Tourism and Hospitality Industry Trends Presentation
PowerPoint Template and Google Slides Theme


Características
Etiquetas
- Eliminar de favoritos
Plantilla de PowerPoint
1 MB
Plantilla de Google Slides
Enlace externo
Plantilla de Keynote
2 MB
Recomendar
- Eliminar de favoritos
Plantilla de PowerPoint
1 MB
Plantilla de Google Slides
Enlace externo
Plantilla de Keynote
2 MB
12 diapositivas
AI and Innovation Technology Presentation
Visualize layered intelligence with this AI and Innovation Technology Presentation. Featuring a dynamic 3D stack layout with five labeled layers and downward data-flow arrows, this slide is ideal for presenting system architecture, AI pipelines, or innovation frameworks. Great for startups, IT teams, and R&D updates. Fully customizable in PowerPoint, Keynote, and Google Slides—includes light and dark mode options for modern appea
- Eliminar de favoritos
Plantilla de PowerPoint
2 MB
Plantilla de Google Slides
Enlace externo
Plantilla de Keynote
4 MB
26 diapositivas
Emerging Market Opportunities Presentation
Dive into the vibrant essence of emerging market opportunities, where every slide is a portal to uncharted economic landscapes brimming with potential. This visual narrative isn't just a collection of information; it's an immersive expedition that charts the topography of untapped markets and the innovative paths to success. Here, infographics transform into a compass guiding decision-makers through the complexities of market penetration, investment, and consumer engagement. Each element, from the meet-the-team introduction to the intricate process diagrams, is a glimpse into the future, beckoning with the promise of growth and the thrill of discovery. The timeline charts are not mere sequences of events but stepping stones across the river of market evolution. With a blend of analytical precision and creative flair, this presentation stands as a beacon for visionaries seeking to explore the vast potential of new business frontiers. It encapsulates 150 words of strategic insights, enveloped in a visual journey that is as inspiring as the markets it aims to conquer.
- Eliminar de favoritos
Plantilla de PowerPoint
1 MB
Plantilla de Google Slides
Enlace externo
Plantilla de Keynote
1 MB
6 diapositivas
Social Media Analytics Infographic
Social Media Analytics refers to the process of collecting, analyzing, and interpreting data from social media platforms to gain insights into audience behavior, content performance, and overall social media effectiveness. This template showcases key concepts and insights related to social media analytics. This template is designed to help individuals and businesses understand and leverage the power of data-driven analysis to enhance their social media strategies. This template is perfect to optimize your social media presence, improve engagement, and drive meaningful results. Compatible with Powerpoint, Keynote, and Google Slides.
- Eliminar de favoritos
Plantilla de PowerPoint
1 MB
Plantilla de Google Slides
Enlace externo
Plantilla de Keynote
1 MB
3 diapositivas
Process Mapping with Tree Diagram Presentation
Optimize Your Workflow! The Process Mapping with Tree Diagram Presentation simplifies complex processes, illustrating decision paths and workflows in a clear, structured format. Perfect for business strategy, operations, and project planning, this fully editable template enhances understanding and efficiency. Compatible with PowerPoint, Keynote, and Google Slides, ensuring seamless customization.
- Eliminar de favoritos
Plantilla de PowerPoint
1 MB
Plantilla de Google Slides
Enlace externo
Plantilla de Keynote
1 MB
4 diapositivas
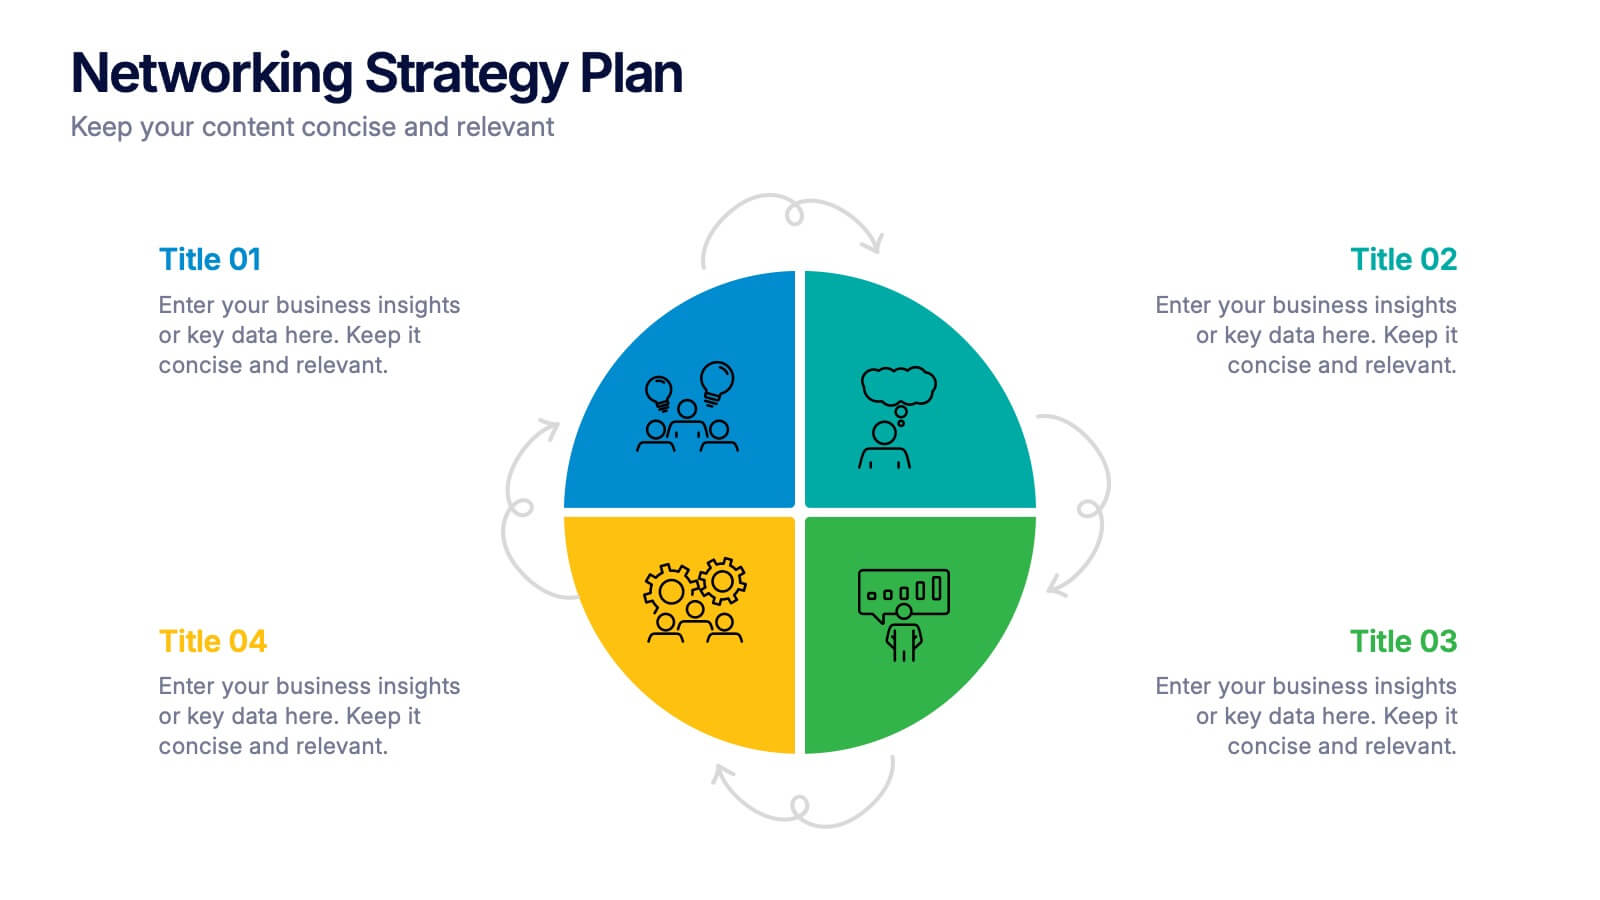
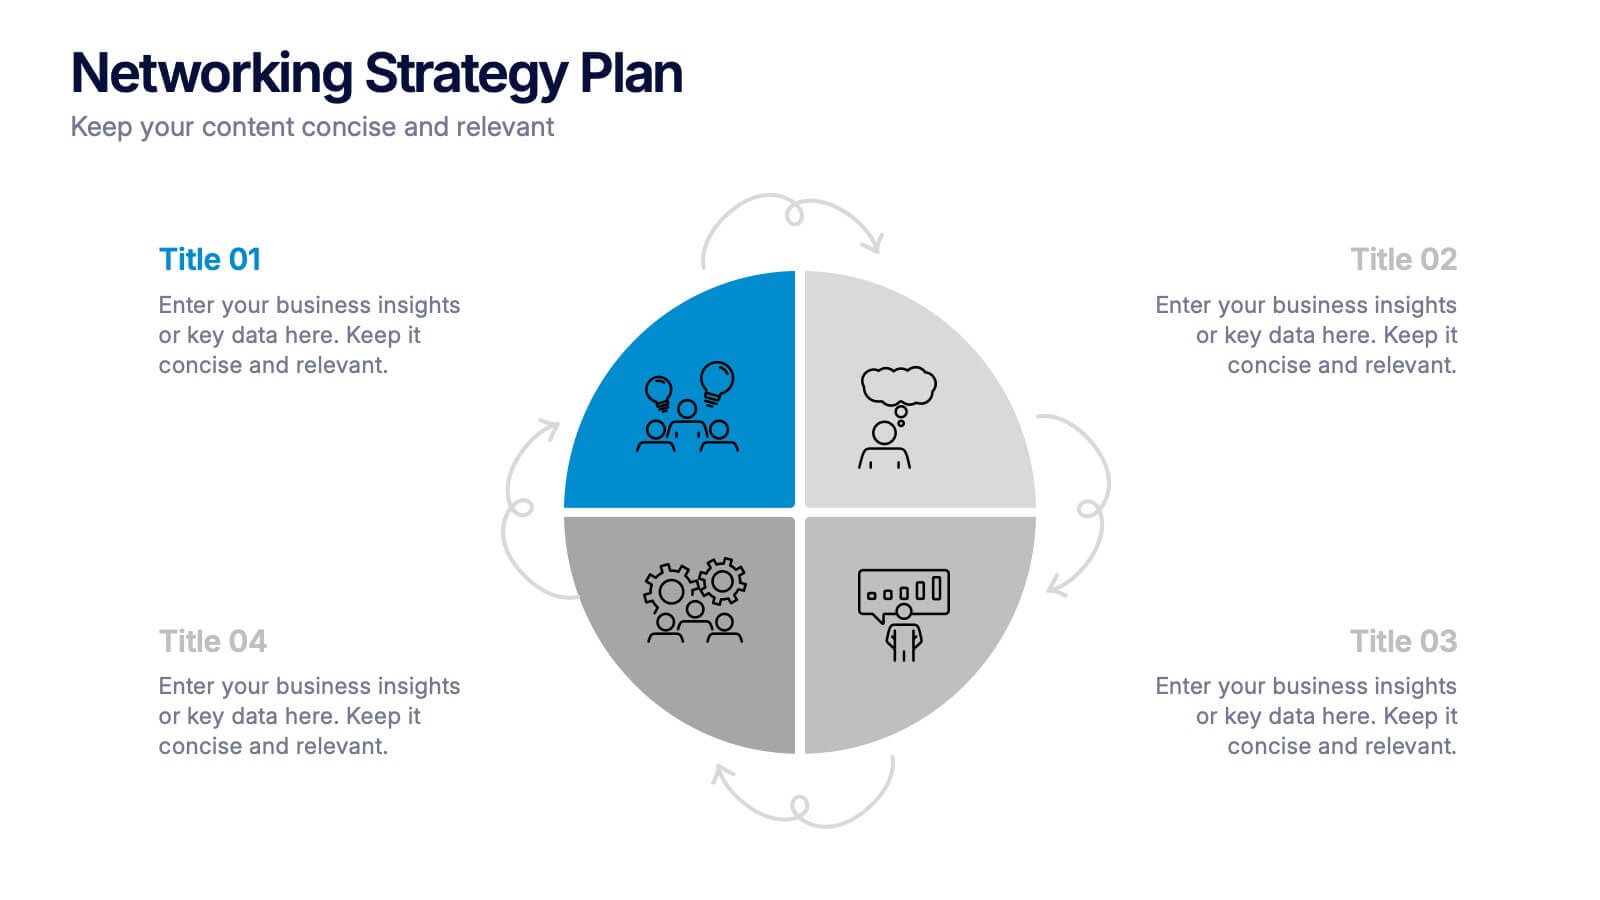
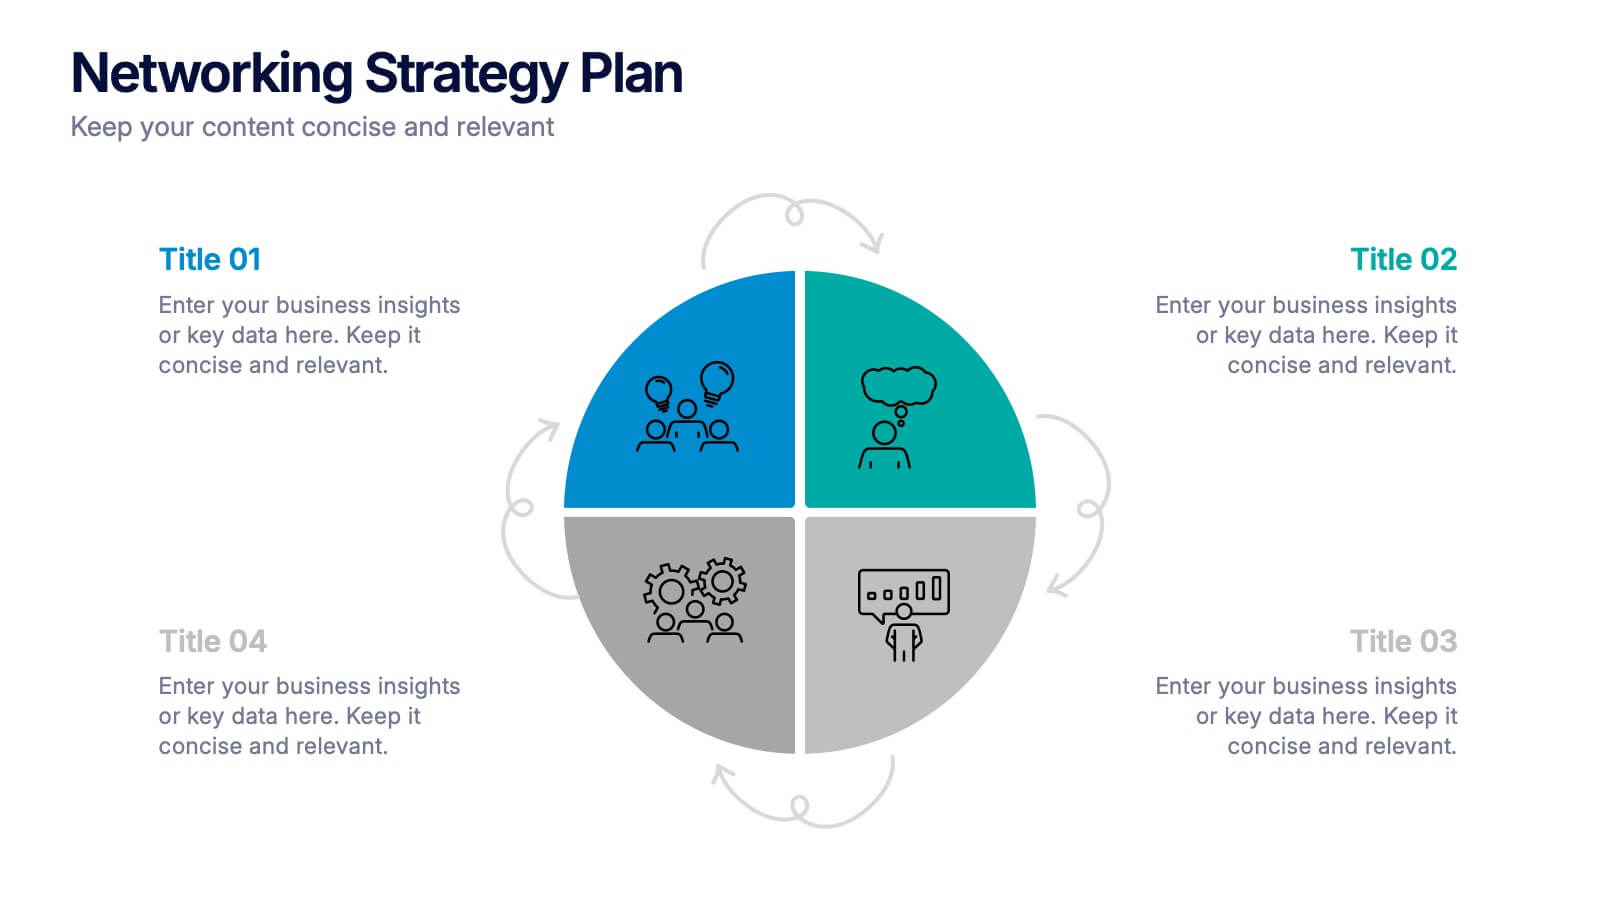
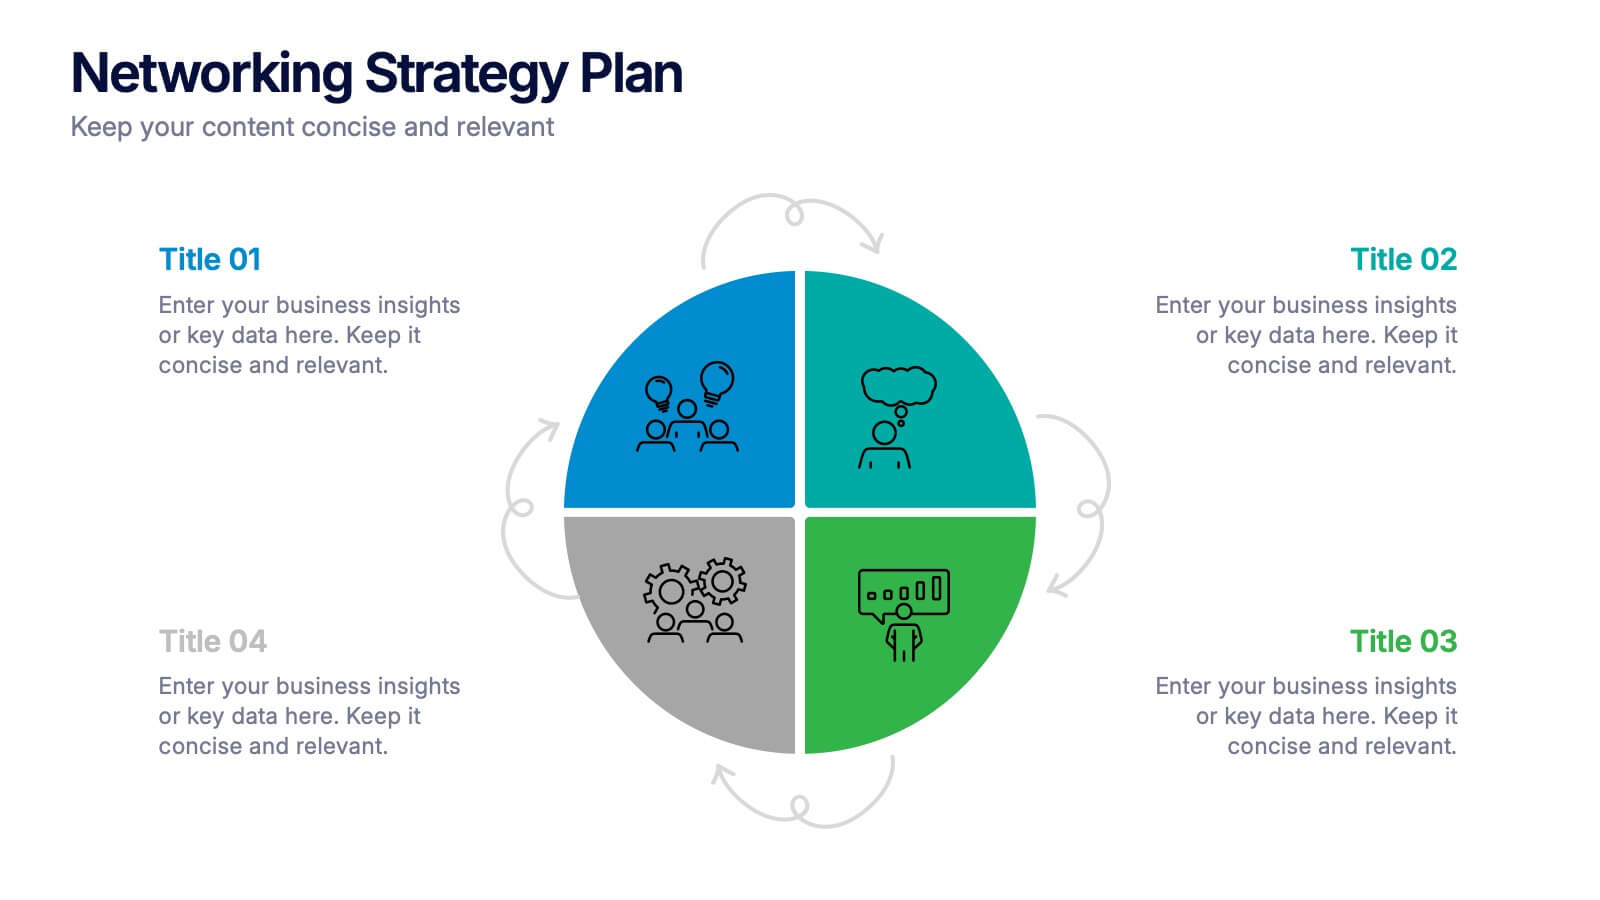
Networking Strategy Plan Presentation
Make every connection count with this clean and modern presentation design. Perfect for outlining relationship-building strategies, collaboration methods, or communication plans, it presents ideas clearly using a structured circular layout. Fully customizable and compatible with PowerPoint, Keynote, and Google Slides for a seamless and professional presentation experience.
- Eliminar de favoritos
Plantilla de PowerPoint
1 MB
Plantilla de Google Slides
Enlace externo
Plantilla de Keynote
1 MB
4 diapositivas
Restaurant Menu Design Showcase Presentation
Showcase your food offerings with this stylish Restaurant Menu Design Template. Divided into clear sections—Menu, Drinks, and Desserts—it’s perfect for restaurants, cafés, or pop-up events. Fully editable in PowerPoint, Keynote, and Google Slides, this layout lets you present items cleanly with bold titles and organized structure for easy viewing.
- Eliminar de favoritos
Plantilla de PowerPoint
1 MB
Plantilla de Google Slides
Enlace externo
Plantilla de Keynote
1 MB
6 diapositivas
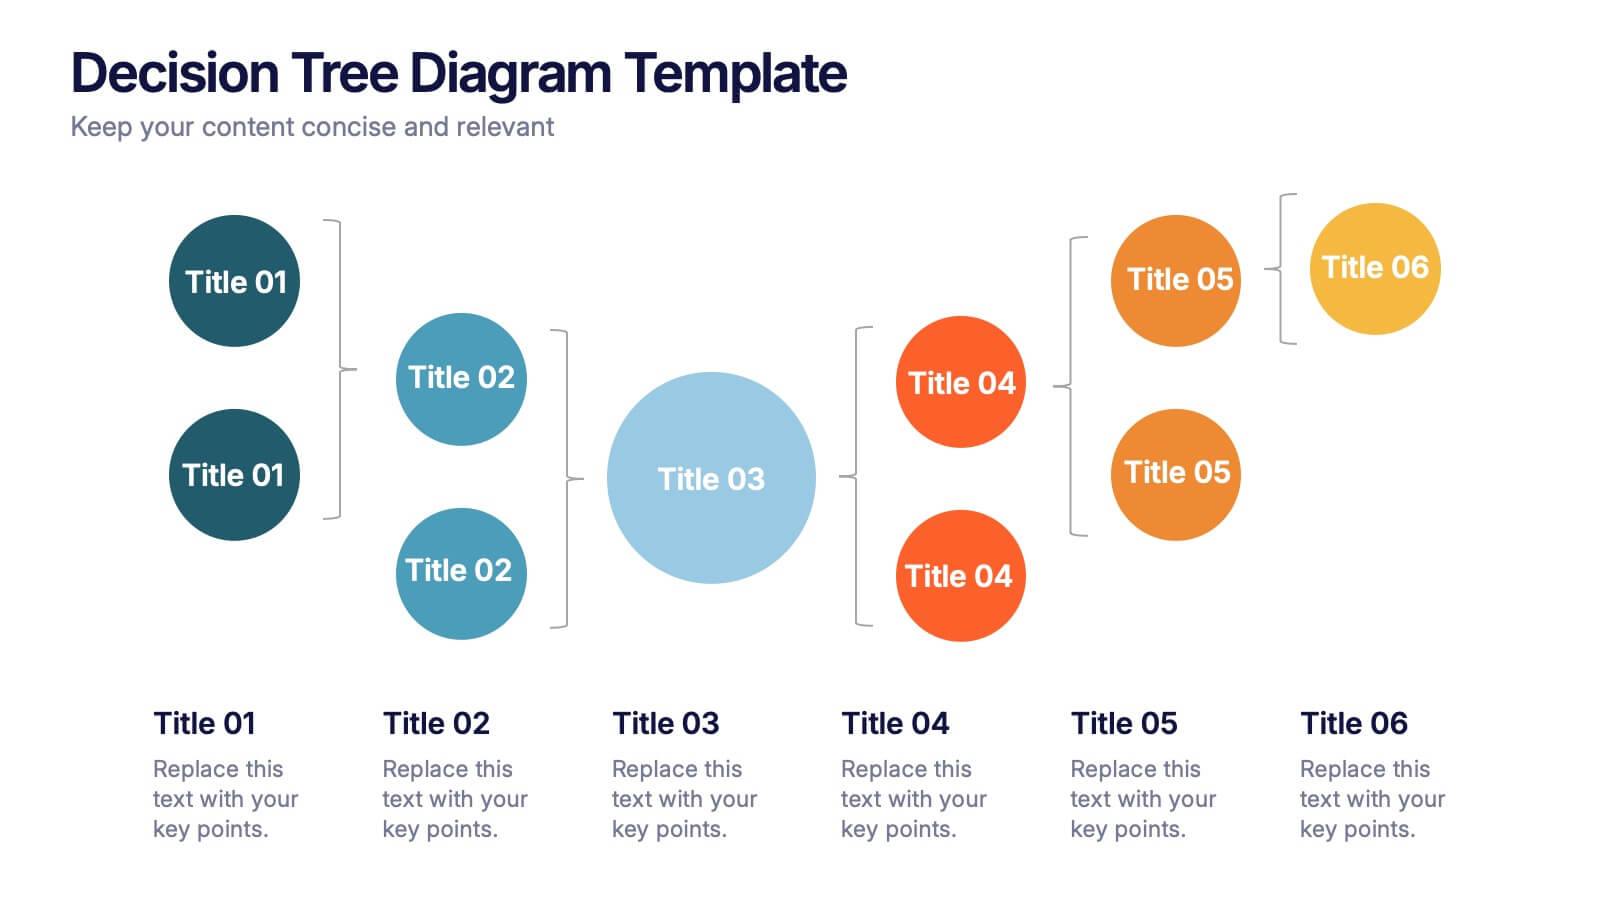
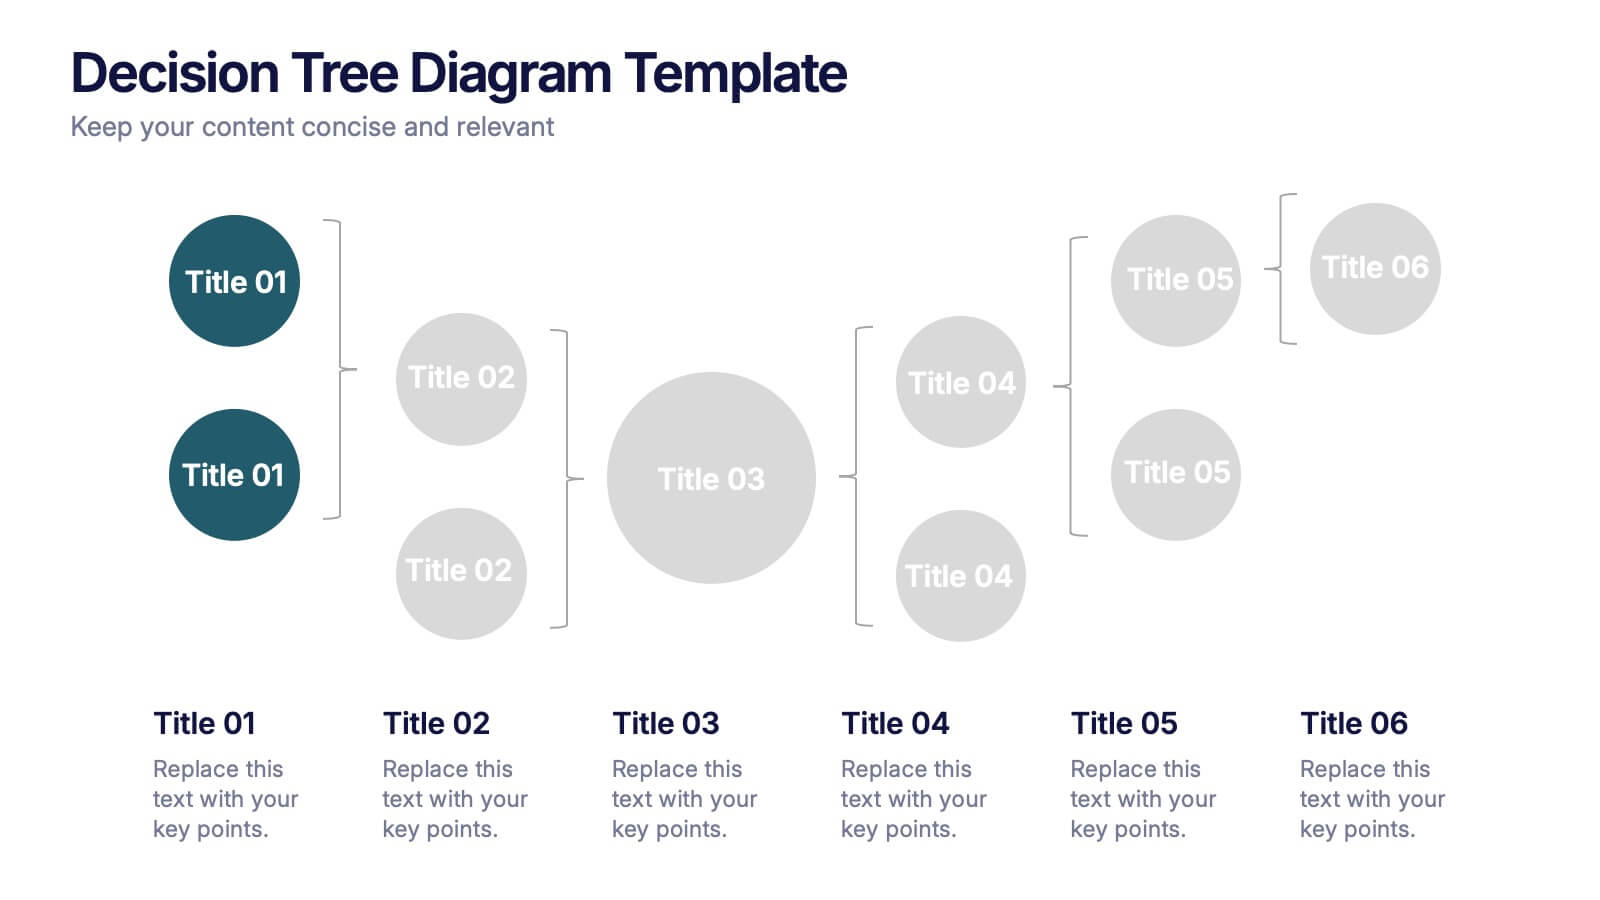
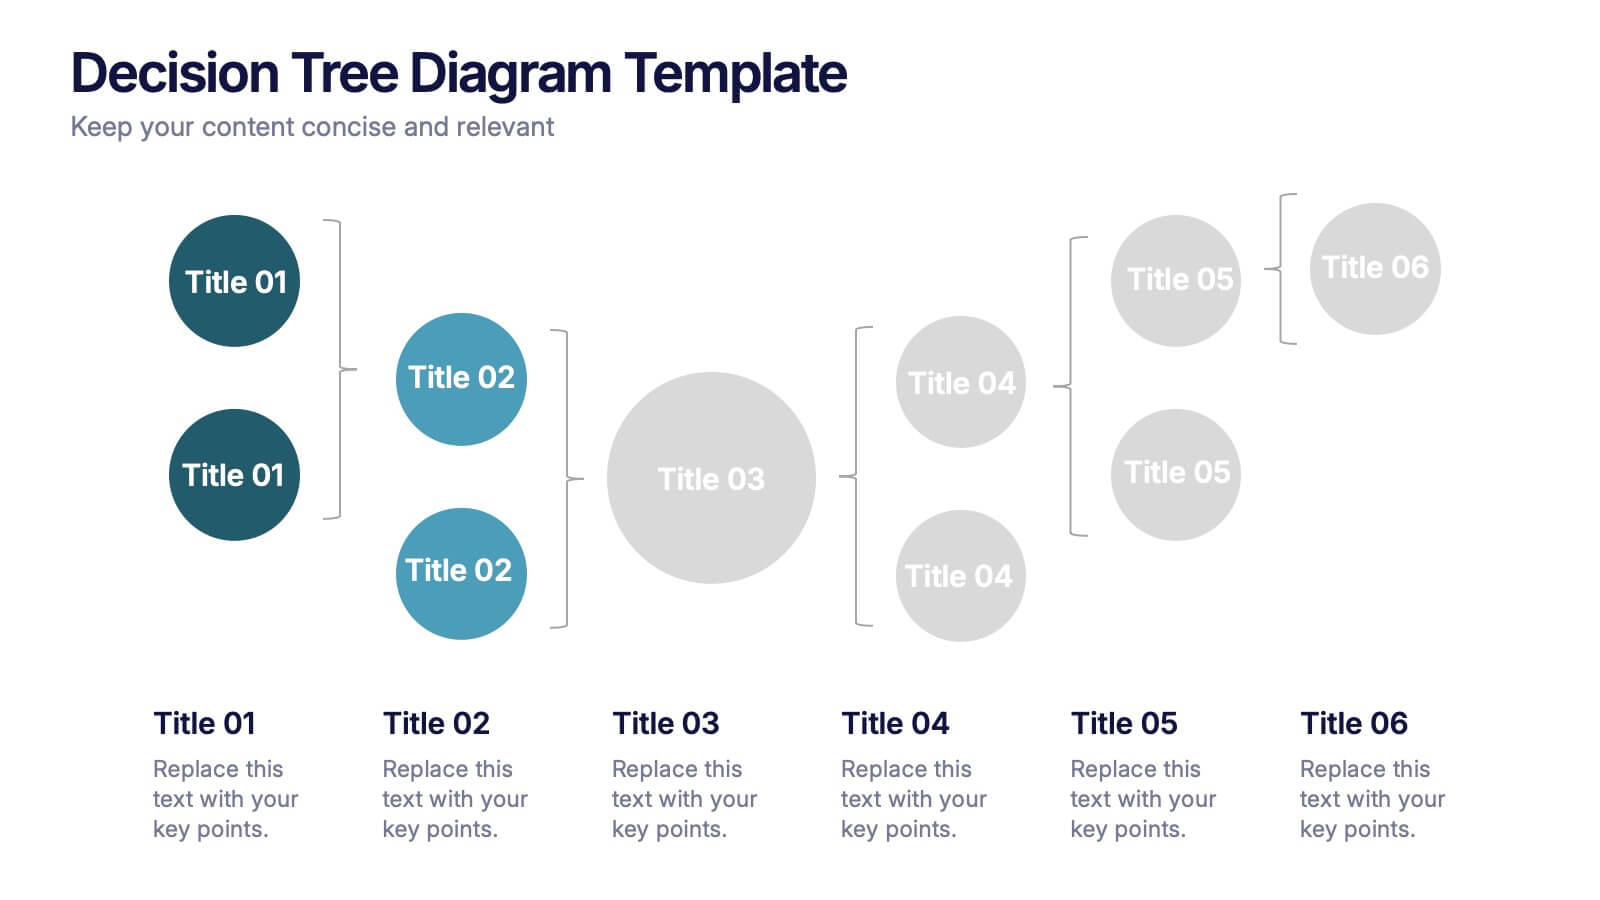
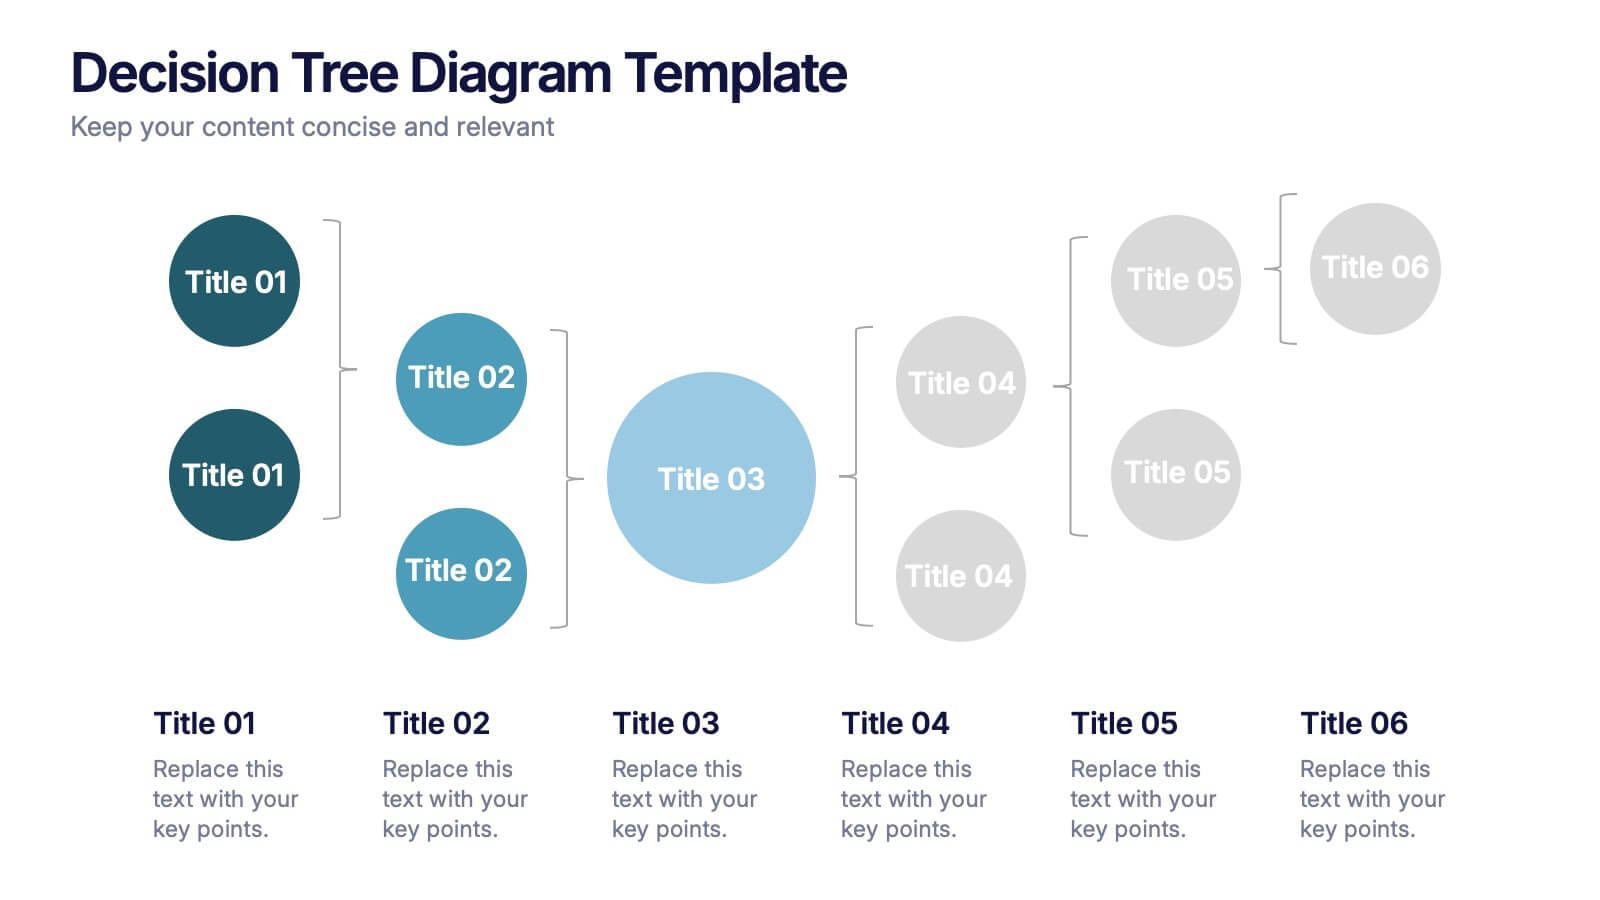
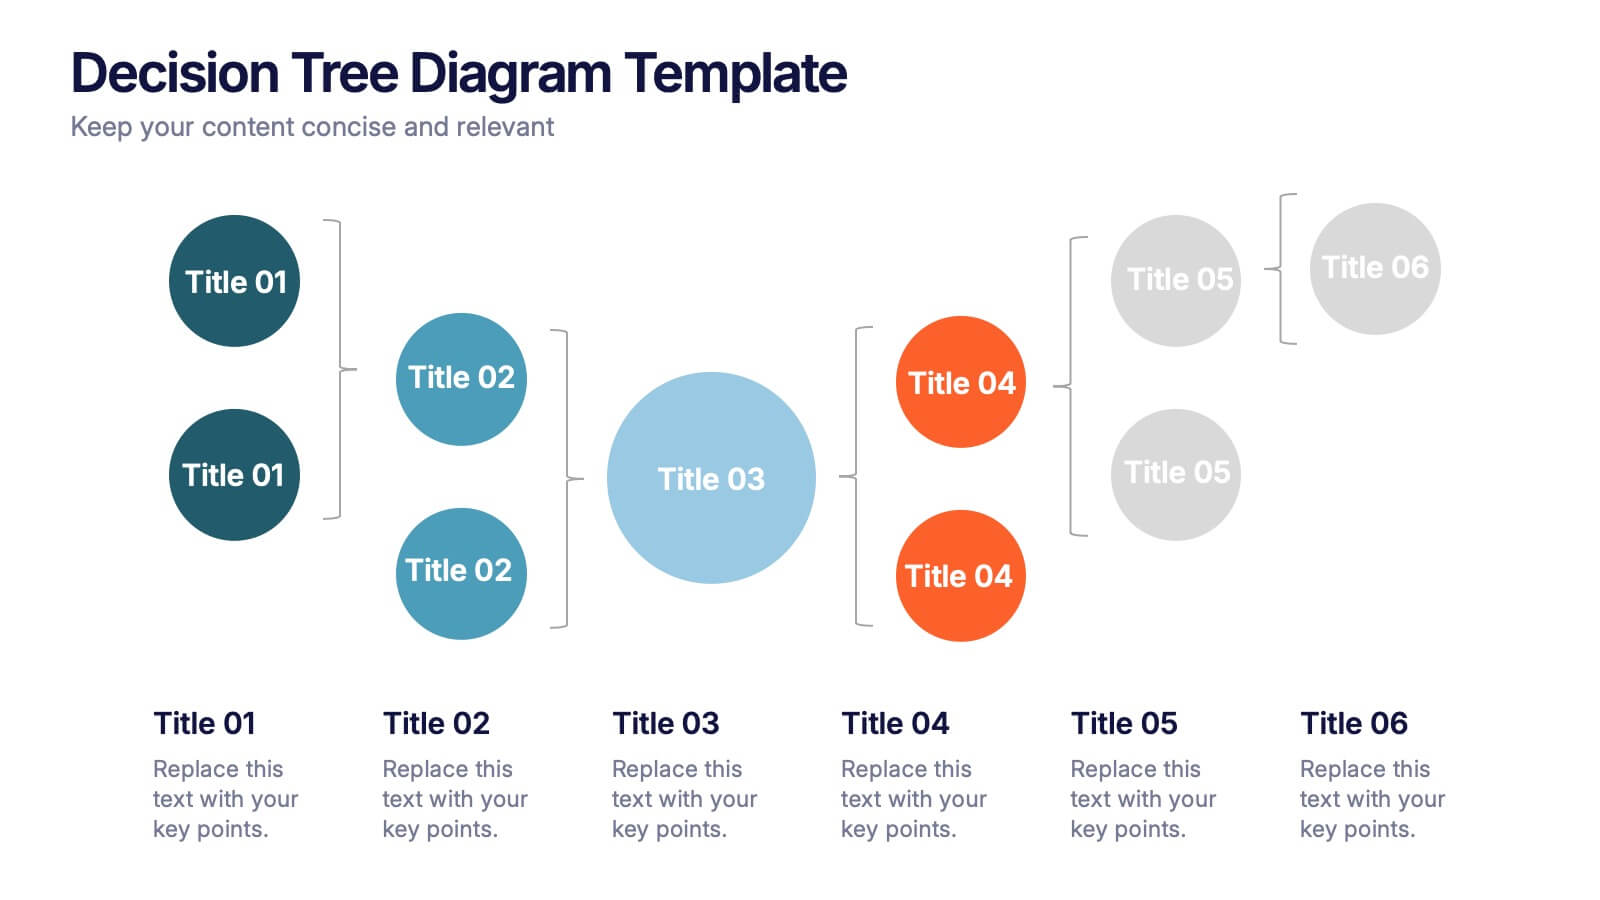
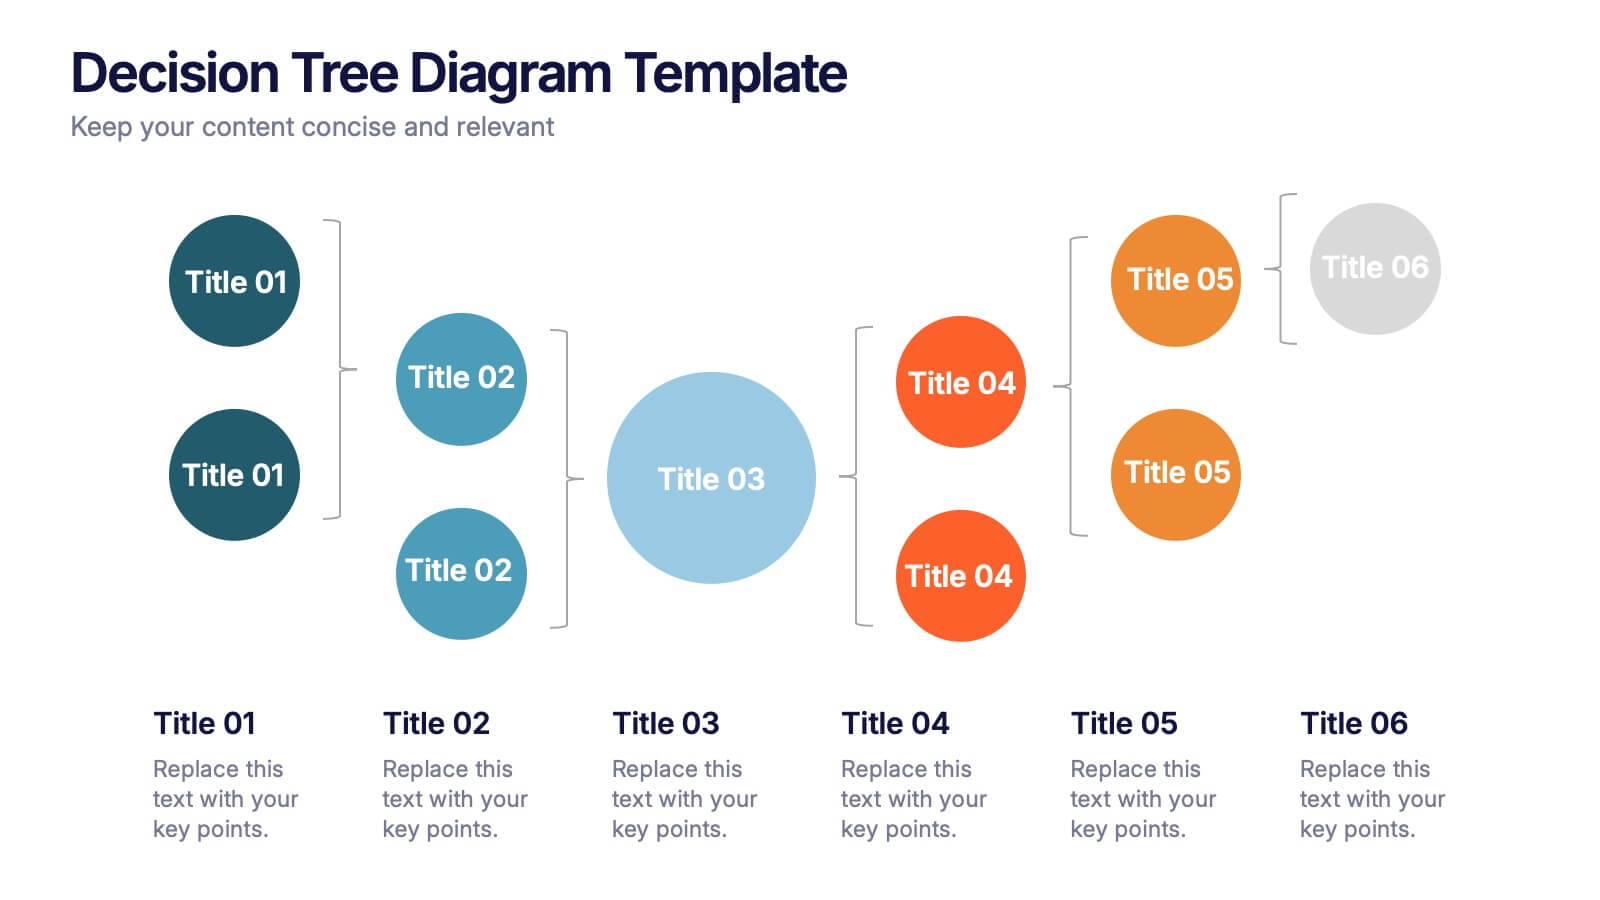
Decision Tree Diagrams Presentation
Turn complex choices into clear, visual stories with this clean and modern template. Perfect for illustrating outcomes, decision paths, or process options, it helps you communicate strategy and logic with confidence. Fully customizable and compatible with PowerPoint, Keynote, and Google Slides for seamless professional presentations.
- Eliminar de favoritos
Plantilla de PowerPoint
1 MB
Plantilla de Google Slides
Enlace externo
Plantilla de Keynote
1 MB
8 diapositivas
Pet Care and Veterinary Clinic Business Presentation
Highlight your clinic’s services with this engaging, paw-themed slide featuring a veterinarian illustration and four colorful pawprints. Perfect for pet care presentations, animal health pitches, or client brochures. Fully editable in PowerPoint, Keynote, or Google Slides for easy customization.
- Eliminar de favoritos
Plantilla de PowerPoint
2 MB
Plantilla de Google Slides
Enlace externo
Plantilla de Keynote
2 MB
13 diapositivas
Market Segmentation and Consumer Demographics Presentation
Visualize your audience breakdown with this clean, data-driven demographic infographic slide. Featuring customizable male and female icons, percentage metrics, and bar charts for segment analysis, this layout is perfect for showcasing consumer insights, behavior patterns, and target group comparisons. Ideal for marketing reports, business plans, and audience research decks. Fully editable in PowerPoint, Keynote, and Google Slides.
- Eliminar de favoritos
Plantilla de PowerPoint
1 MB
Plantilla de Google Slides
Enlace externo
Plantilla de Keynote
2 MB
10 diapositivas
Lean Business Model Planning Presentation
Streamline your startup strategy with this Lean Canvas presentation template. Designed for entrepreneurs and agile teams, it breaks down your business plan into 9 essential blocks—from Problem and Solution to Revenue Streams and Cost Structure. Easy to edit in PowerPoint, Keynote, or Google Slides for fast, effective planning and pitch presentations.
- Eliminar de favoritos
Plantilla de PowerPoint
1 MB
Plantilla de Google Slides
Enlace externo
Plantilla de Keynote
1 MB
6 diapositivas
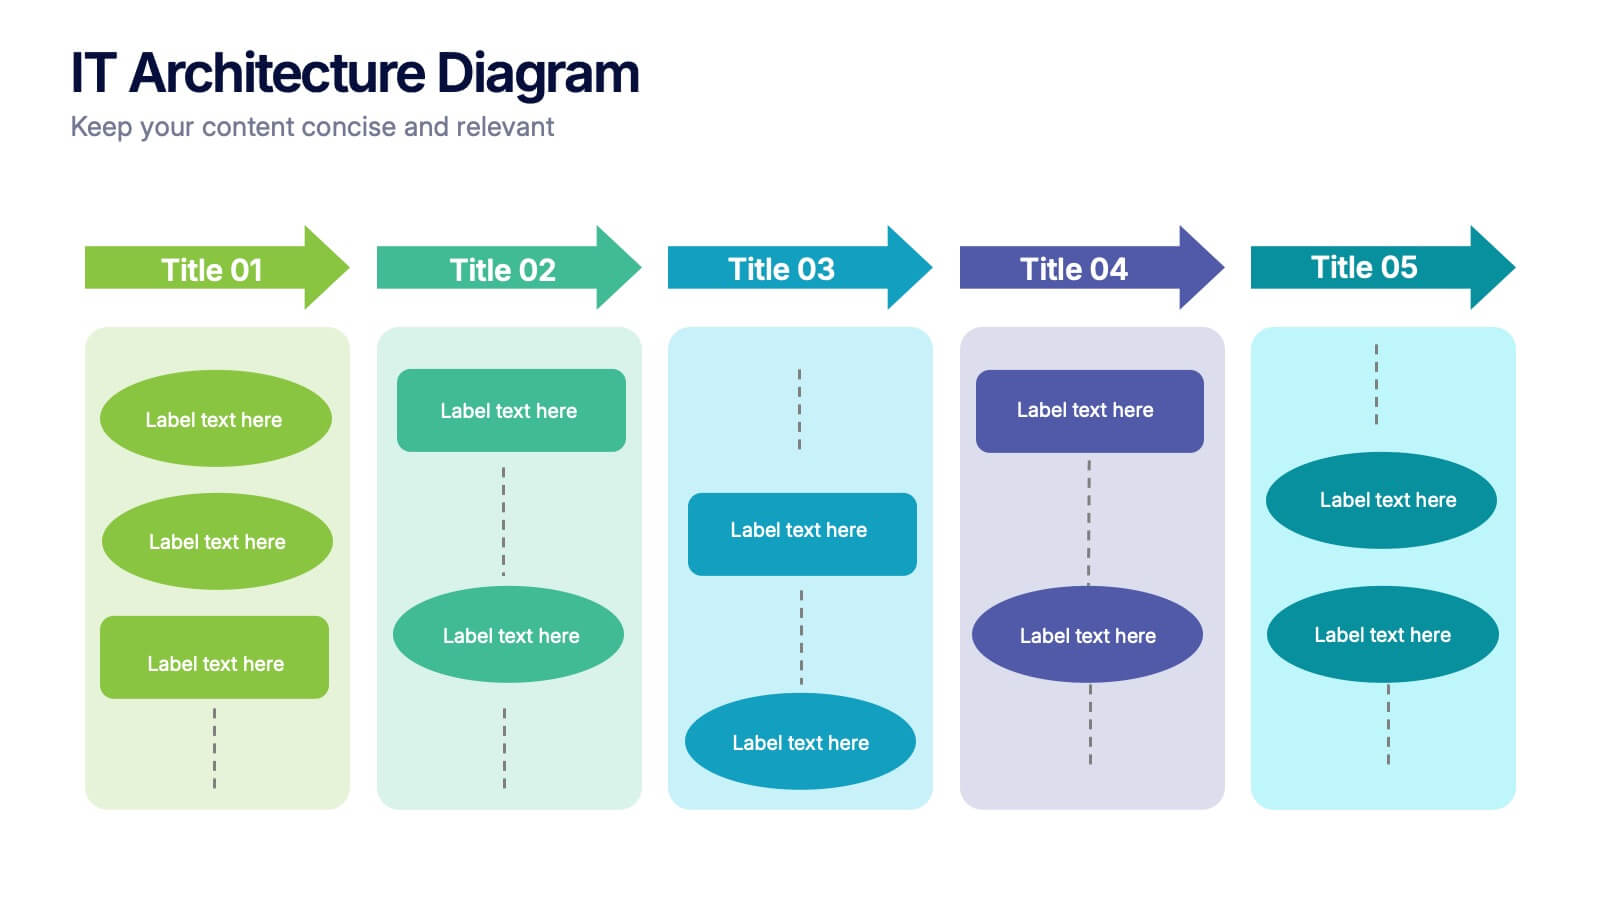
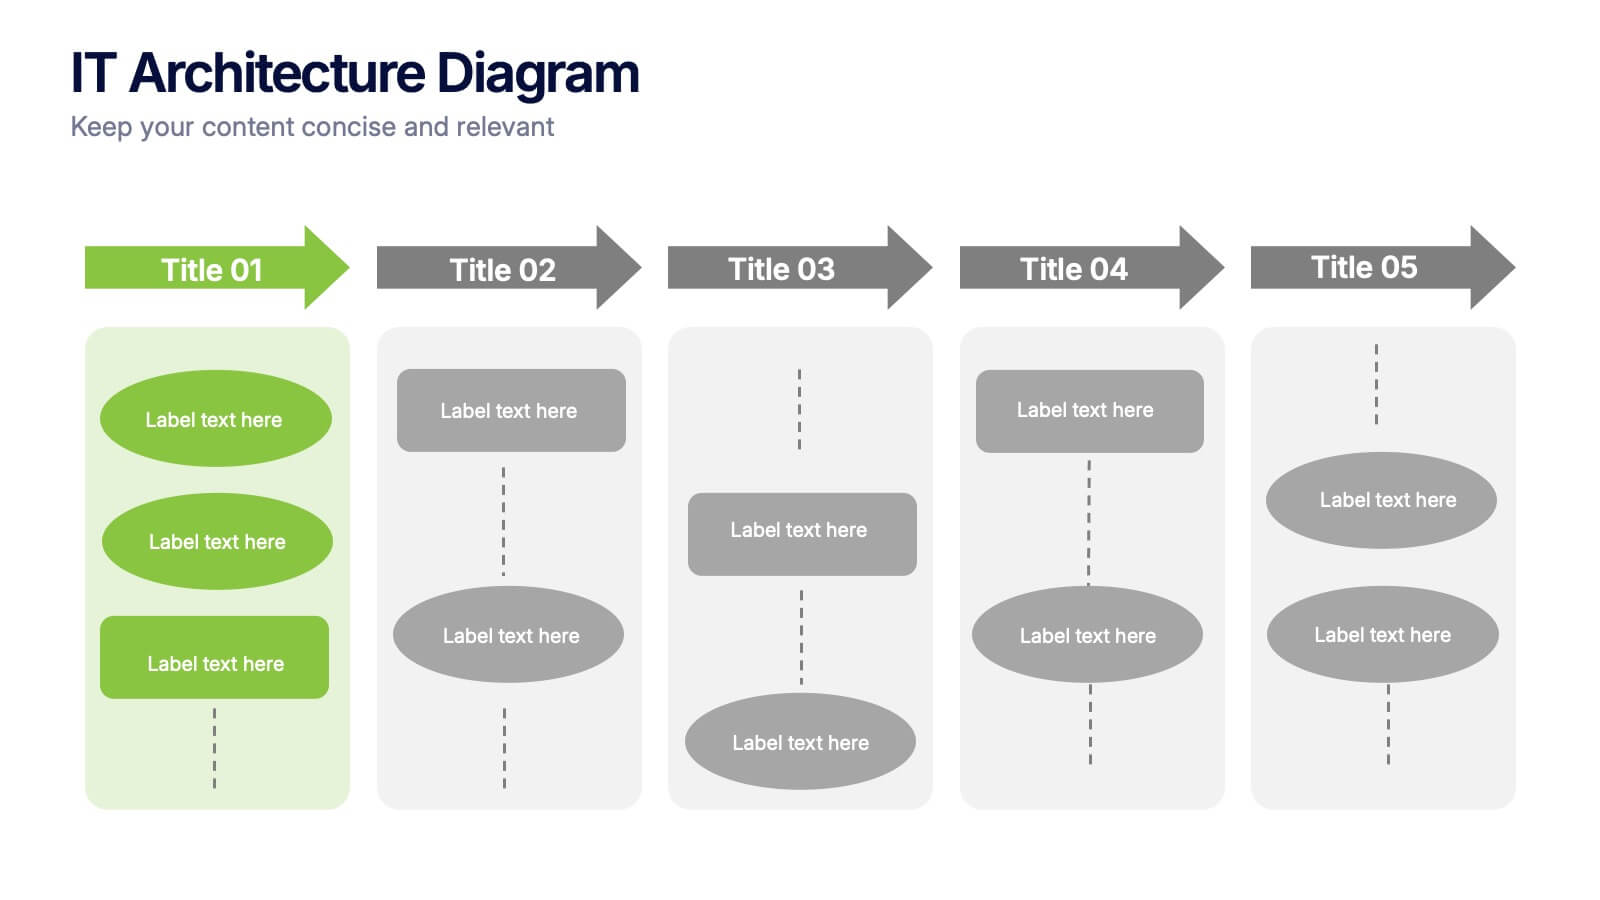
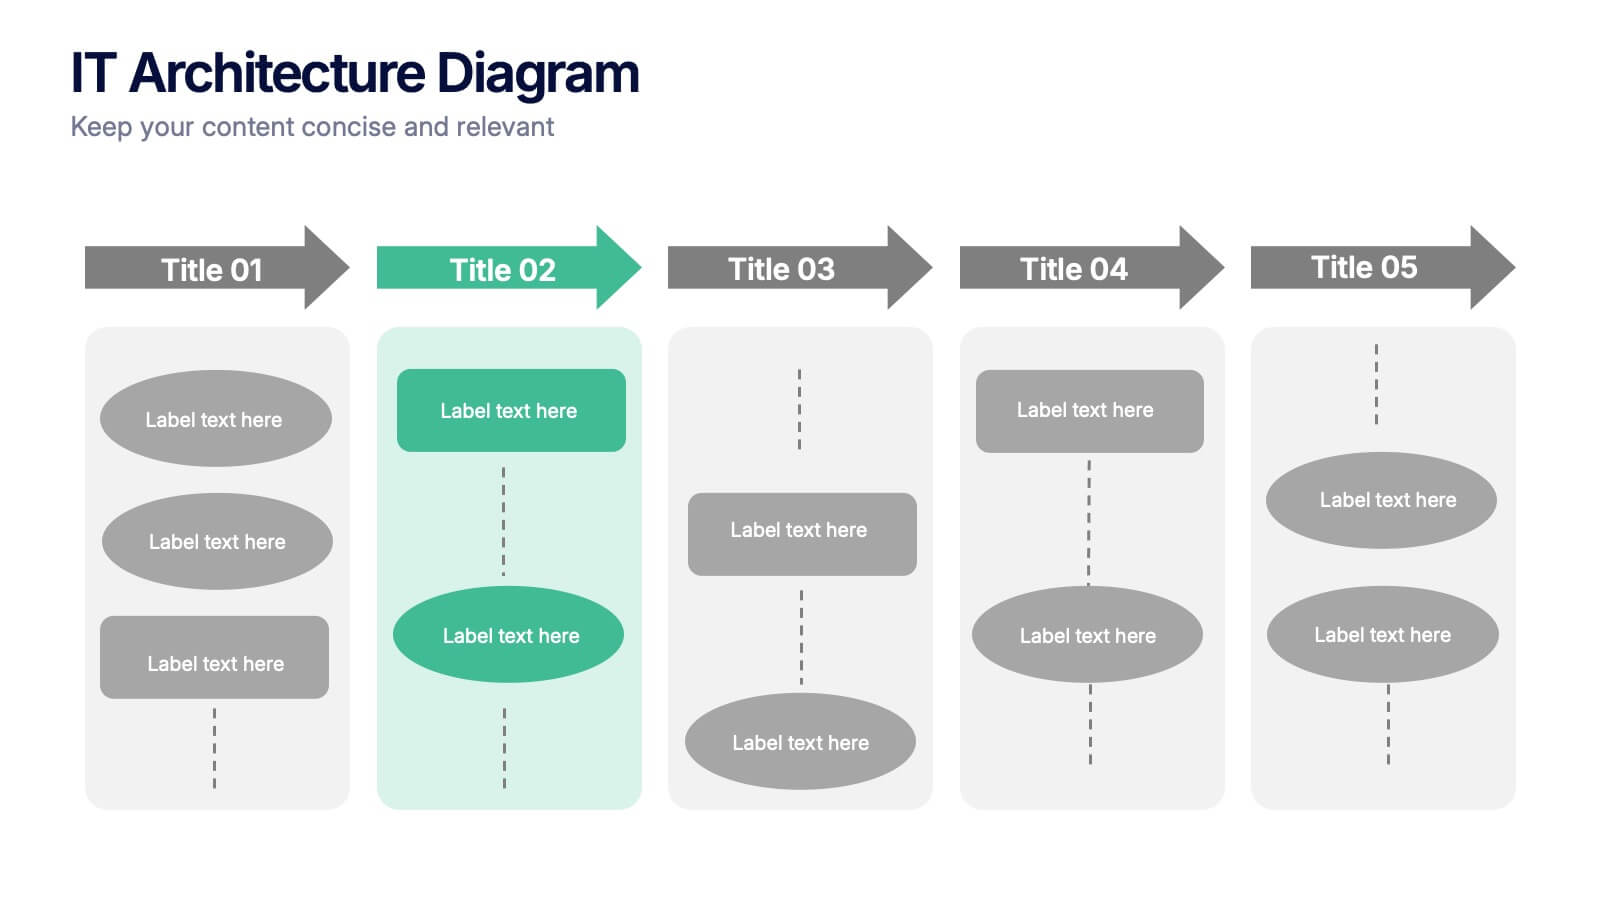
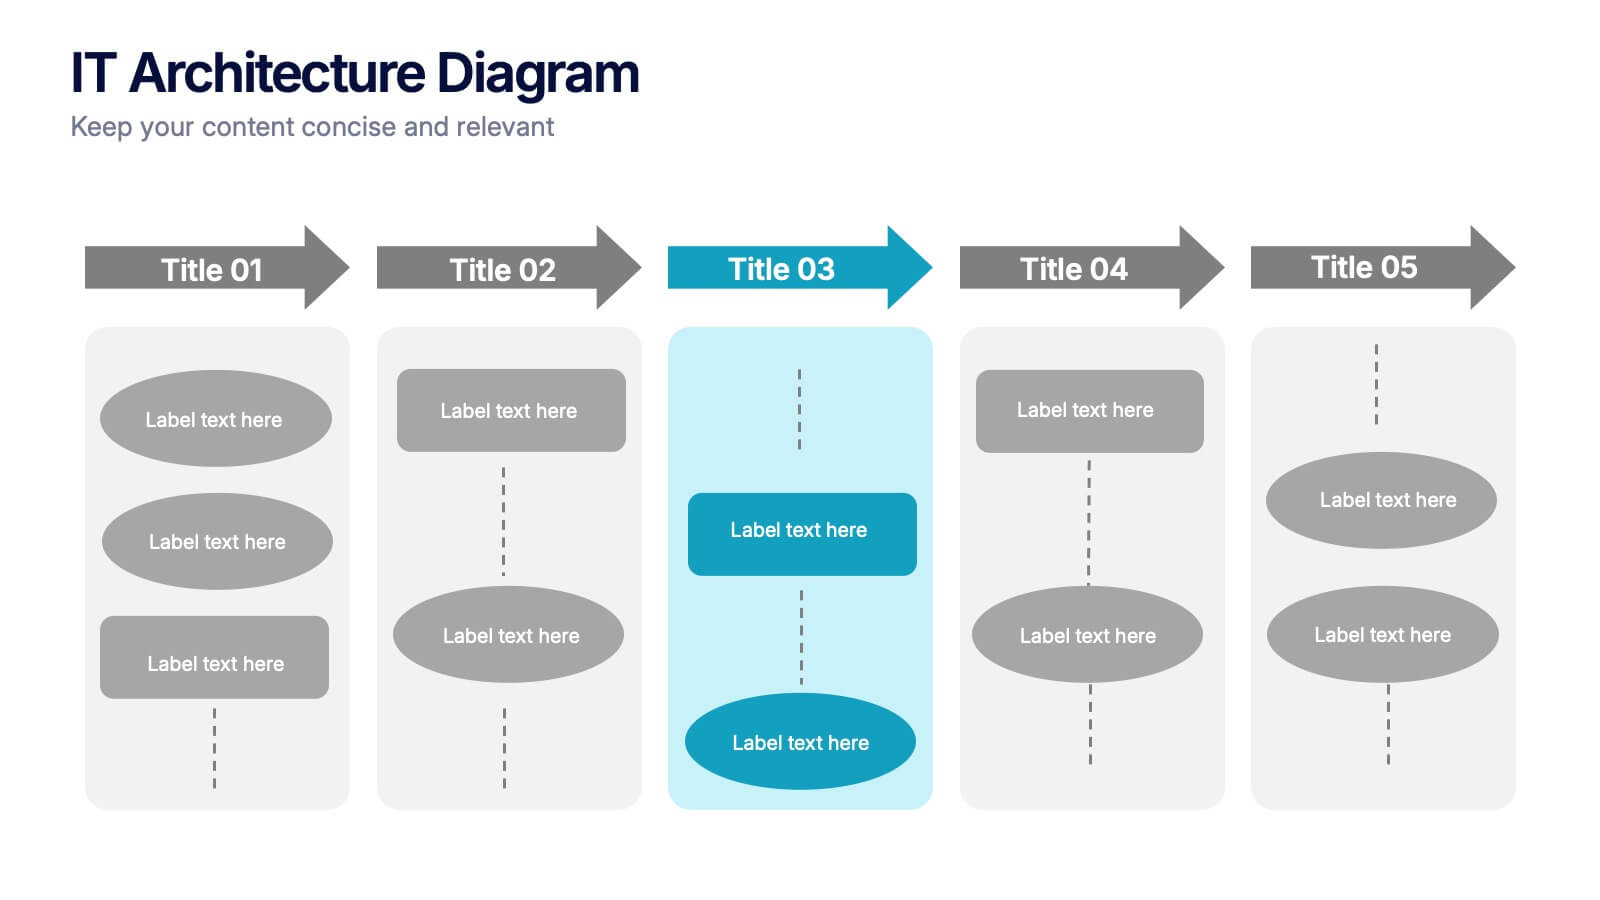
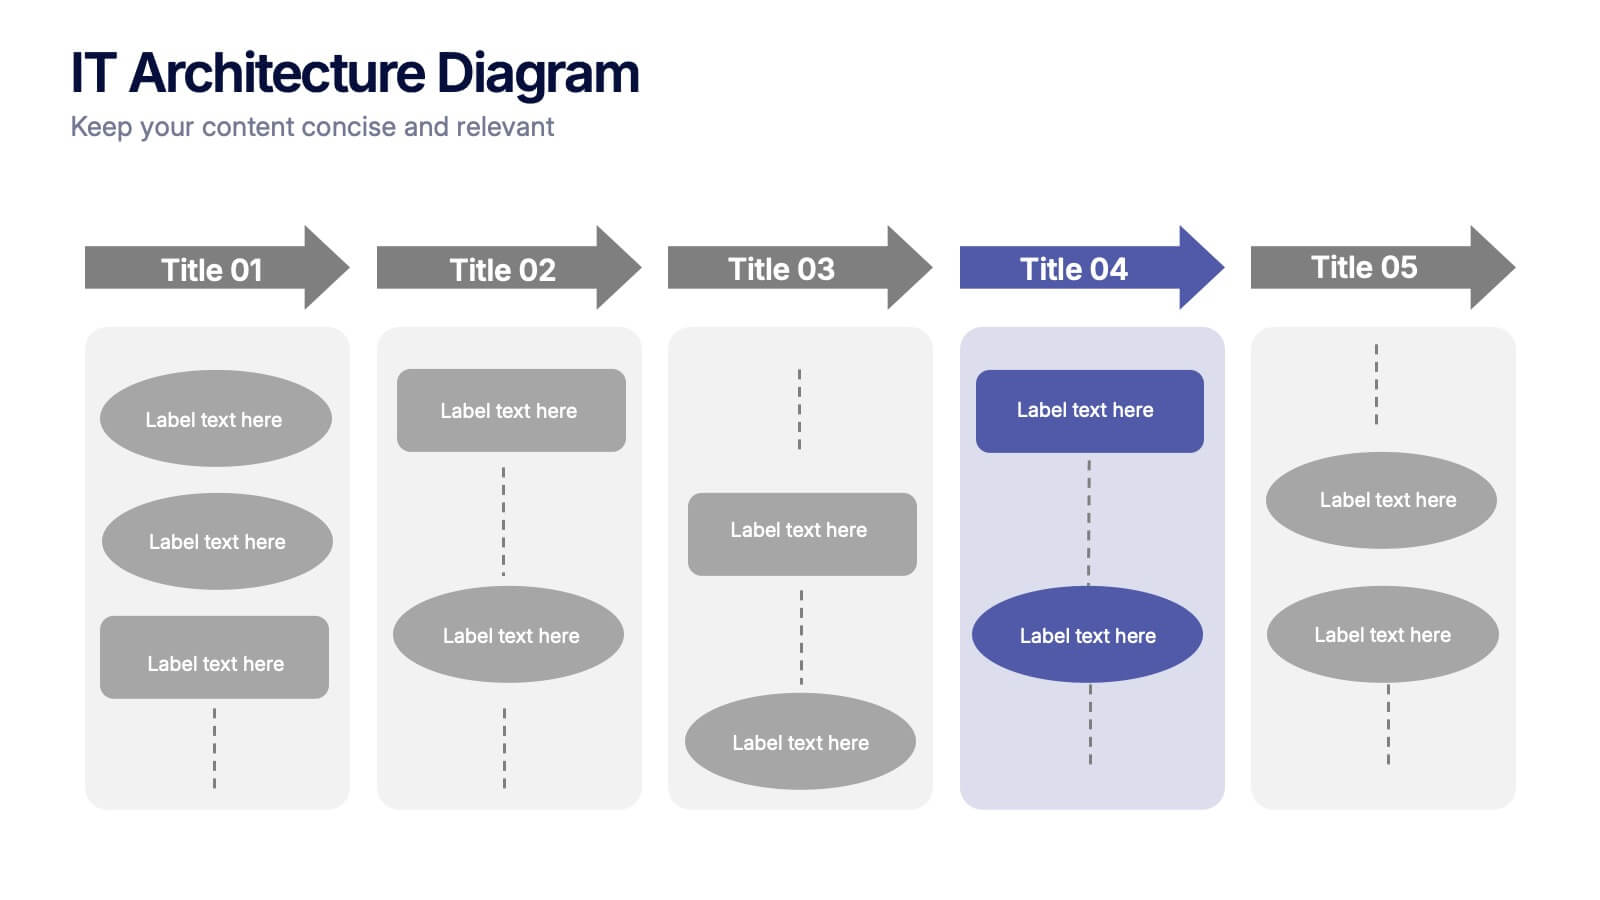
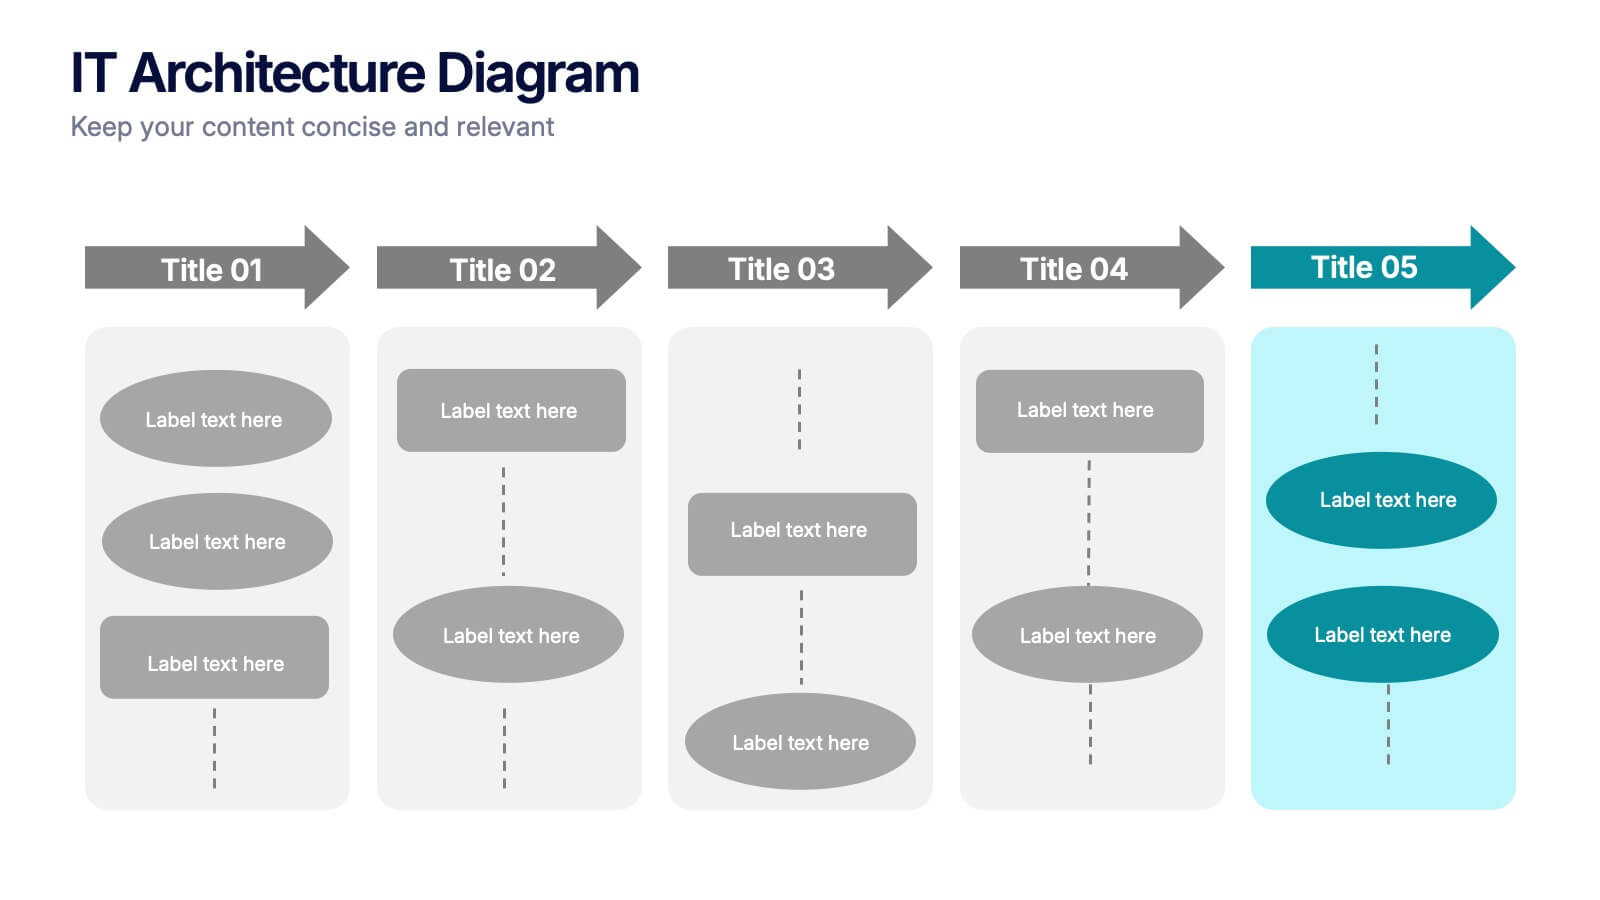
IT Architecture Diagram Presentation
Turn complex system structures into clear visual stories with this professional presentation. Perfect for mapping processes, software layers, or organizational workflows, it helps communicate how technology components connect and operate. Fully editable and compatible with PowerPoint, Keynote, and Google Slides for seamless customization and engaging technical presentations.
- Eliminar de favoritos
Plantilla de PowerPoint
1 MB
Plantilla de Google Slides
Enlace externo
Plantilla de Keynote
1 MB
4 diapositivas
Vision Statement Development Framework Presentation
Define and refine your company’s future with the Vision Statement Development Framework. This clean, step-by-step infographic guides you through creating a focused and inspiring vision statement. Ideal for strategic sessions, leadership presentations, and goal-setting workshops. Fully editable in PowerPoint, Canva, and Google Slides for seamless customization.
- Eliminar de favoritos
Plantilla de PowerPoint
1 MB
Plantilla de Google Slides
Enlace externo
Plantilla de Keynote
1 MB
5 diapositivas
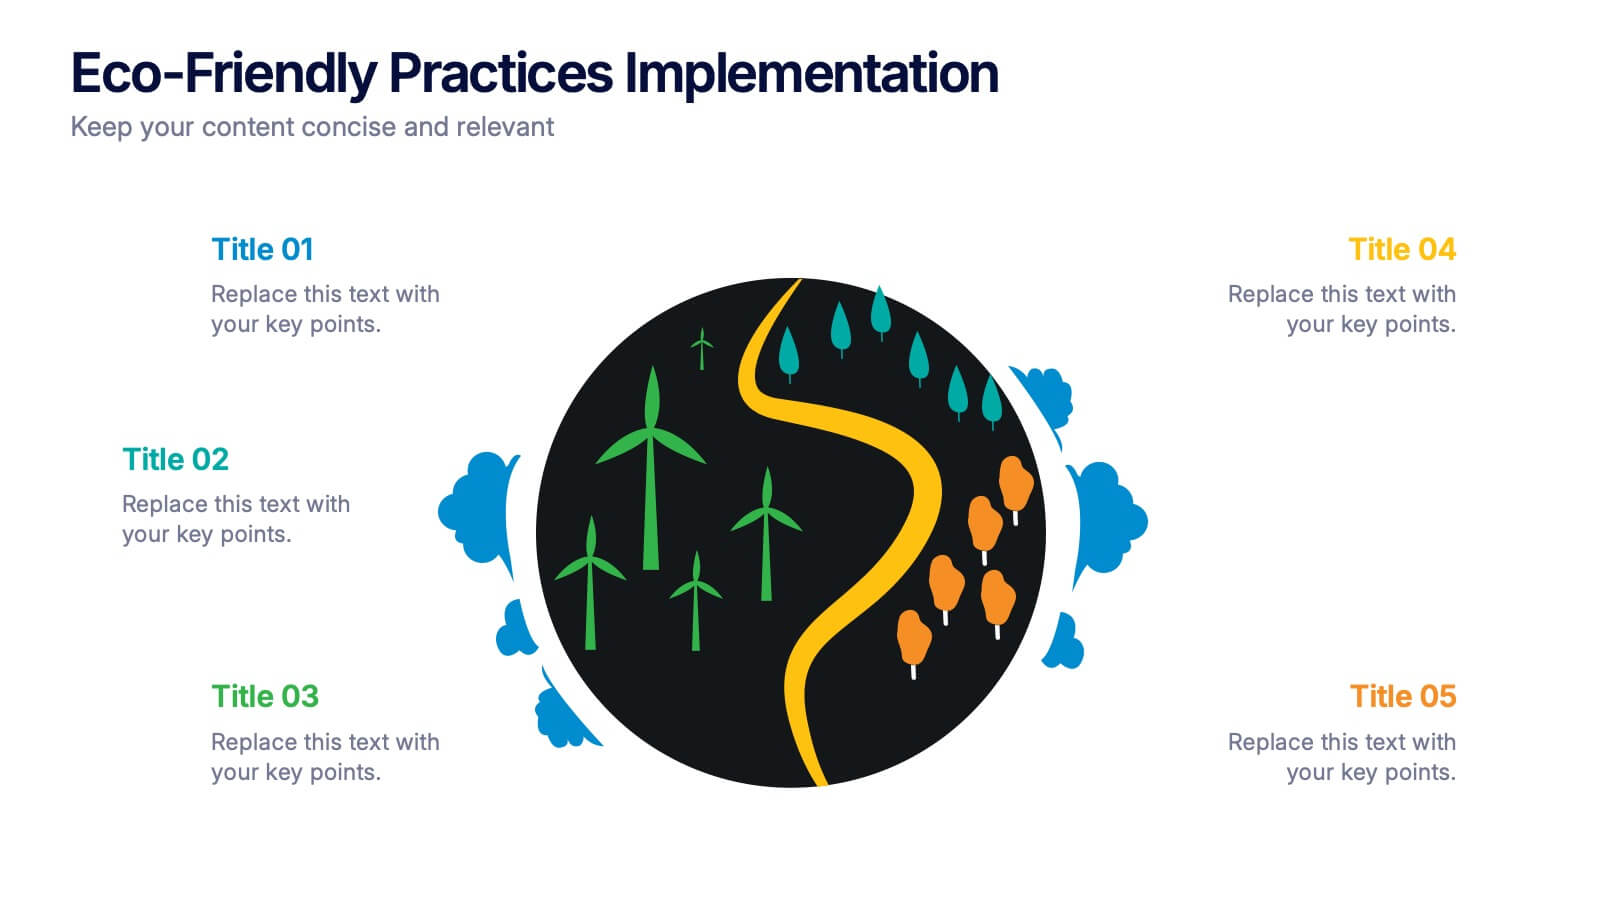
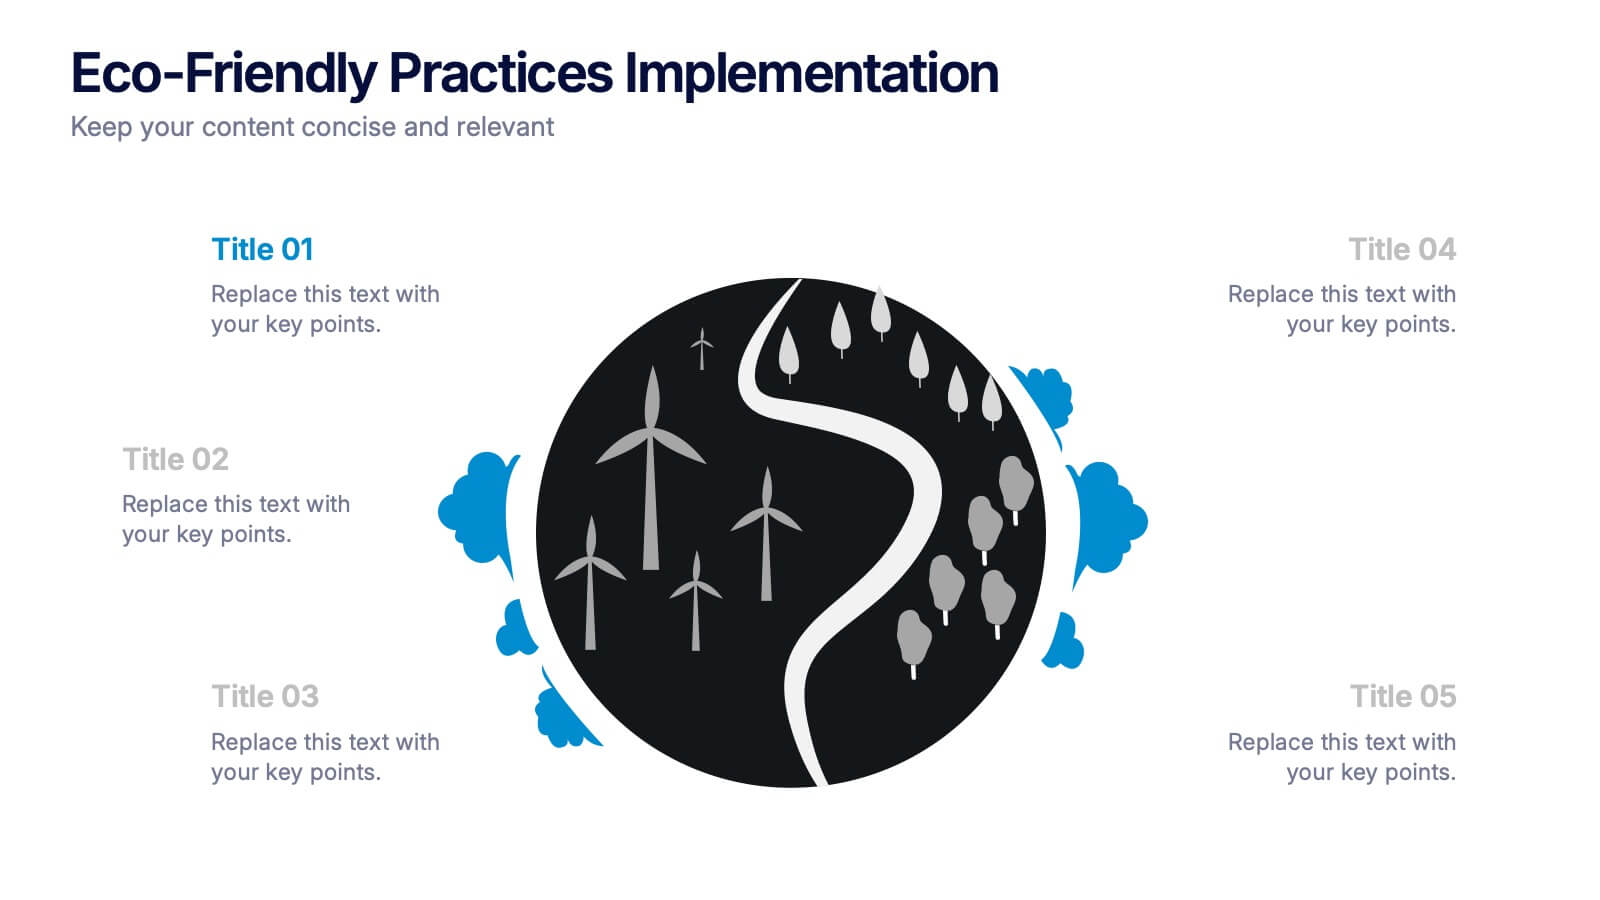
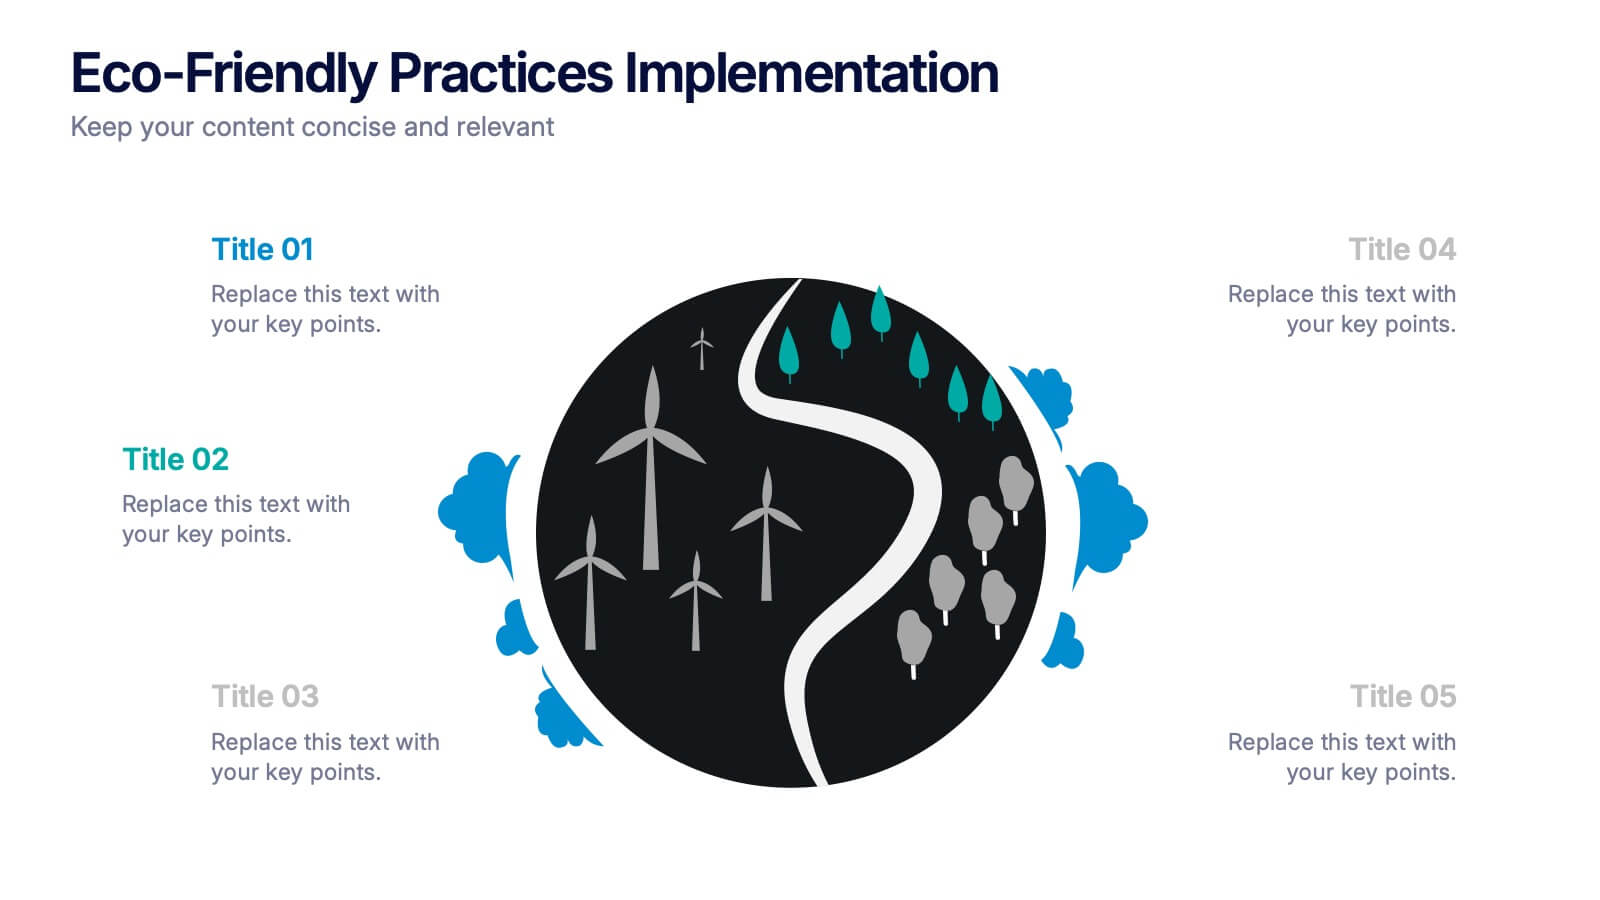
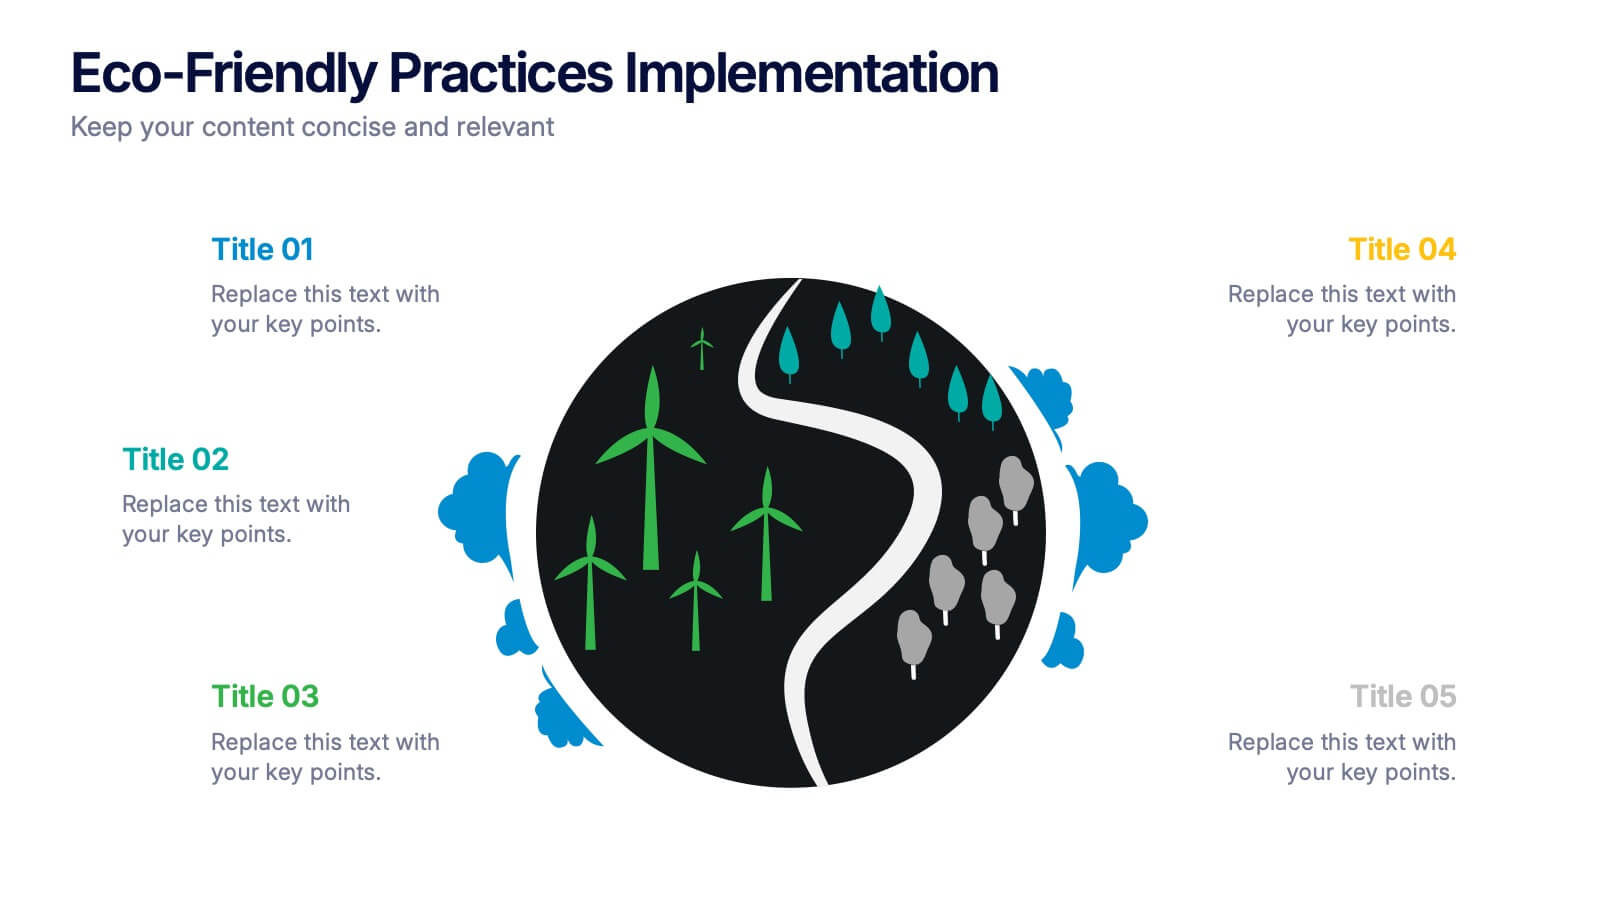
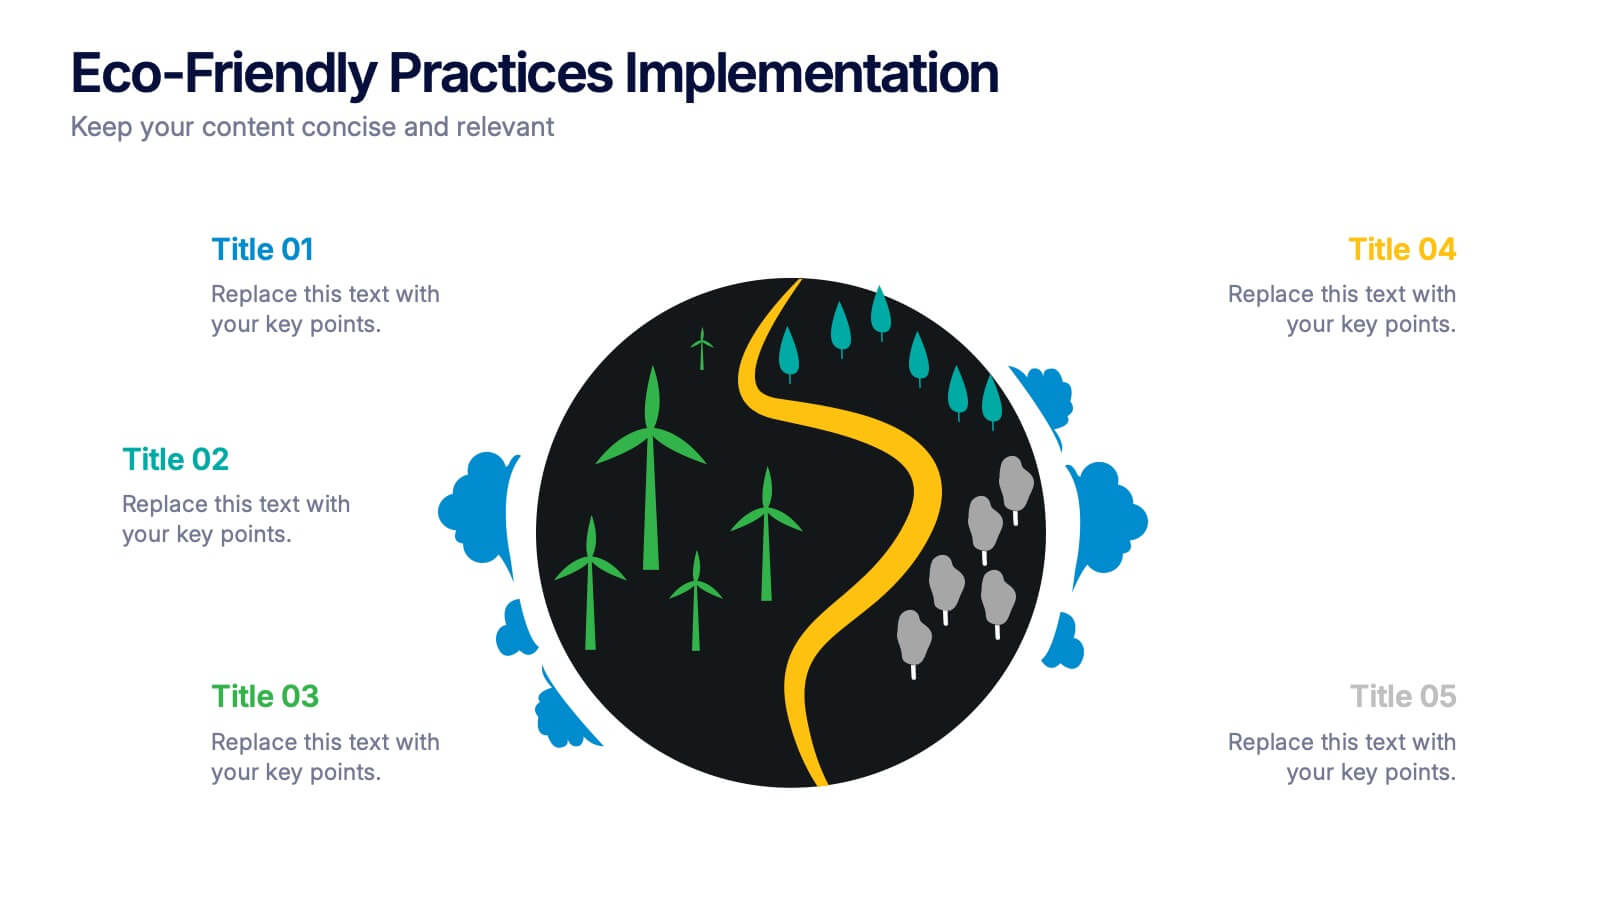
Eco-Friendly Practices Implementation Presentation
Brighten your message with a clean, circular design that maps out every green initiative step-by-step. This visual template illustrates key eco-conscious actions, helping you present sustainable practices with ease. Perfect for environmental reports, team strategies, or policy pitches. Fully compatible with PowerPoint, Keynote, and Google Slides for flexible editing.
- Eliminar de favoritos
Plantilla de PowerPoint
1 MB
Plantilla de Google Slides
Enlace externo
Plantilla de Keynote
1 MB
5 diapositivas
Restaurant Regulations Infographics
Restaurant Regulations are crucial for ensuring food safety and hygiene. This infographic is designed in vertical format, allowing for easy display on digital platforms such as social media or the restaurant's website. This is designed to help restaurants communicate regulations to their staff and customers. The use of visually appealing graphics and colors help make the information more engaging and easier to understand. It can also be customized with the restaurant's branding and logo to create a cohesive look and feel. The infographic is divided into sections, each for covering different areas of your regulations.
- Eliminar de favoritos
Plantilla de PowerPoint
1 MB
Plantilla de Google Slides
Enlace externo
Plantilla de Keynote
1 MB
7 diapositivas
TAM SAM SOM Infographic Presentation Template
TAM, SAM and SOM are acronyms that represents different subsets of a market. Which stand for (TAM) Total Addressable Market, (SAM) Serviceable Addressable Market, and (SOM) Serviceable Obtainable Market. Understanding these acronyms can help you better target your marketing efforts to potential customers. This presentation template is a great tool to organize and plan any of your important business projects. Using this template can become critically important to the very foundation of your business model, and TAM, SAM, SOM should be key components to craft the details of your business plan.
- Eliminar de favoritos
Plantilla de PowerPoint
1 MB
Plantilla de Google Slides
Enlace externo
Plantilla de Keynote
1 MB
4 diapositivas
Commonly Asked Questions Analysis Presentation
Simplify and clarify key topics using this FAQ-style layout, ideal for addressing top customer or stakeholder questions. With a clean lightbulb design and three-part structure, this template keeps content digestible and professional. Fully editable in Canva, PowerPoint, or Google Slides—perfect for onboarding, reports, or support documentation.
- Eliminar de favoritos
Plantilla de PowerPoint
1 MB
Plantilla de Google Slides
Enlace externo
Plantilla de Keynote
1 MB
5 diapositivas
Five Essential Steps for Business Success Presentation
Visualize your growth plan with the Five Essential Steps for Business Success Presentation. This step-by-step layout highlights key milestones using a modern isometric staircase design, with speech bubble markers for added clarity. Ideal for roadmaps, strategic planning, or onboarding workflows. Fully editable in PowerPoint, Keynote, and Google Slides.


