


Características


¿Tienes alguna pregunta?
Recomendar


21 diapositivas
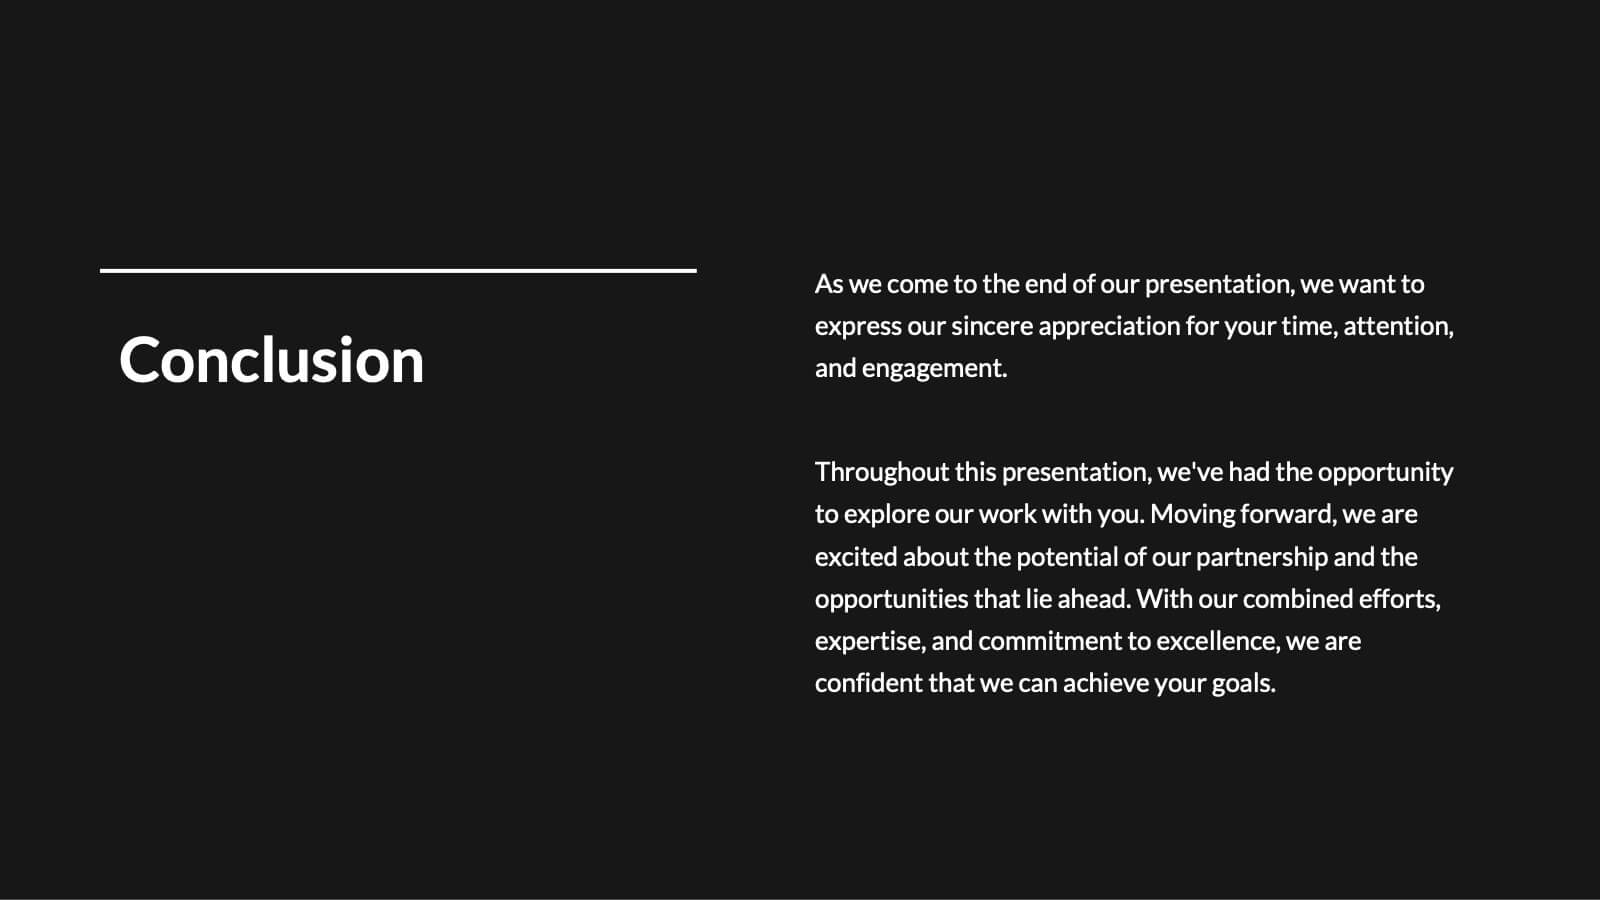
Quaver Annual Report Presentation
Deliver impactful annual reports with this professional presentation template, designed to showcase your company's progress and achievements with precision and clarity. This template is ideal for presenting financial summaries, performance metrics, strategic goals, and operational updates. The layout includes customizable slides for key highlights, risk assessments, project progress, and customer feedback summaries. Infographic elements and visual aids ensure complex data is easily understood, while dedicated sections for challenges, solutions, and recommendations facilitate meaningful discussions. Engage your audience with a clean design and logical structure that reflects professionalism. Compatible with PowerPoint, Google Slides, and Keynote, this template offers full customization to adapt to your branding and specific needs. Whether you're addressing stakeholders, team members, or external audiences, this presentation helps you communicate your accomplishments effectively. Save time and make a lasting impression with a polished and versatile design that aligns with your company’s vision.


5 diapositivas
Search Engine Ranking Presentation
The Search Engine Ranking Presentation template is designed to clearly communicate strategies for improving search engine optimization (SEO). This template visually outlines key concepts in SEO such as enhancing site visibility, optimizing content, reducing bounce rates, and improving branding through intuitive graphical elements and concise bullet points. Each section of the template focuses on a specific aspect of SEO strategy, such as "Improved," "Reduce," "Increase," and "Branding," making it an invaluable tool for marketers looking to present actionable insights. This presentation is perfect for SEO specialists, digital marketers, and content managers aiming to educate teams or clients on the intricacies of boosting online presence effectively.


6 diapositivas
Professional Company Profile Deck Presentation
Present your business with impact using this modern company profile deck. Designed for clarity and professionalism, it includes structured icons, visual highlights, and customizable content sections. Ideal for pitches, internal briefings, or executive introductions. Fully editable in PowerPoint, Keynote, and Google Slides to match your brand and messaging effortlessly.


20 diapositivas
Team Meeting Presentation
Streamline your team meetings with this professional presentation template, designed in striking purple tones. It covers all essential aspects from agenda setting to feedback collection, ensuring efficient and effective communication. Compatible with PowerPoint, Google Slides, and Keynote, this template is perfect for keeping your team aligned and focused.


5 diapositivas
Work From Home Setup and Time Management Presentation
Master productivity from your living room with this Work From Home Setup and Time Management presentation. Featuring a modern, illustrated layout with five clear steps, this slide helps communicate best practices for workspace organization, focus habits, and time-blocking techniques. Ideal for remote onboarding, virtual team training, or self-discipline coaching sessions. Fully customizable in PowerPoint, Keynote, and Google Slides.

21 diapositivas
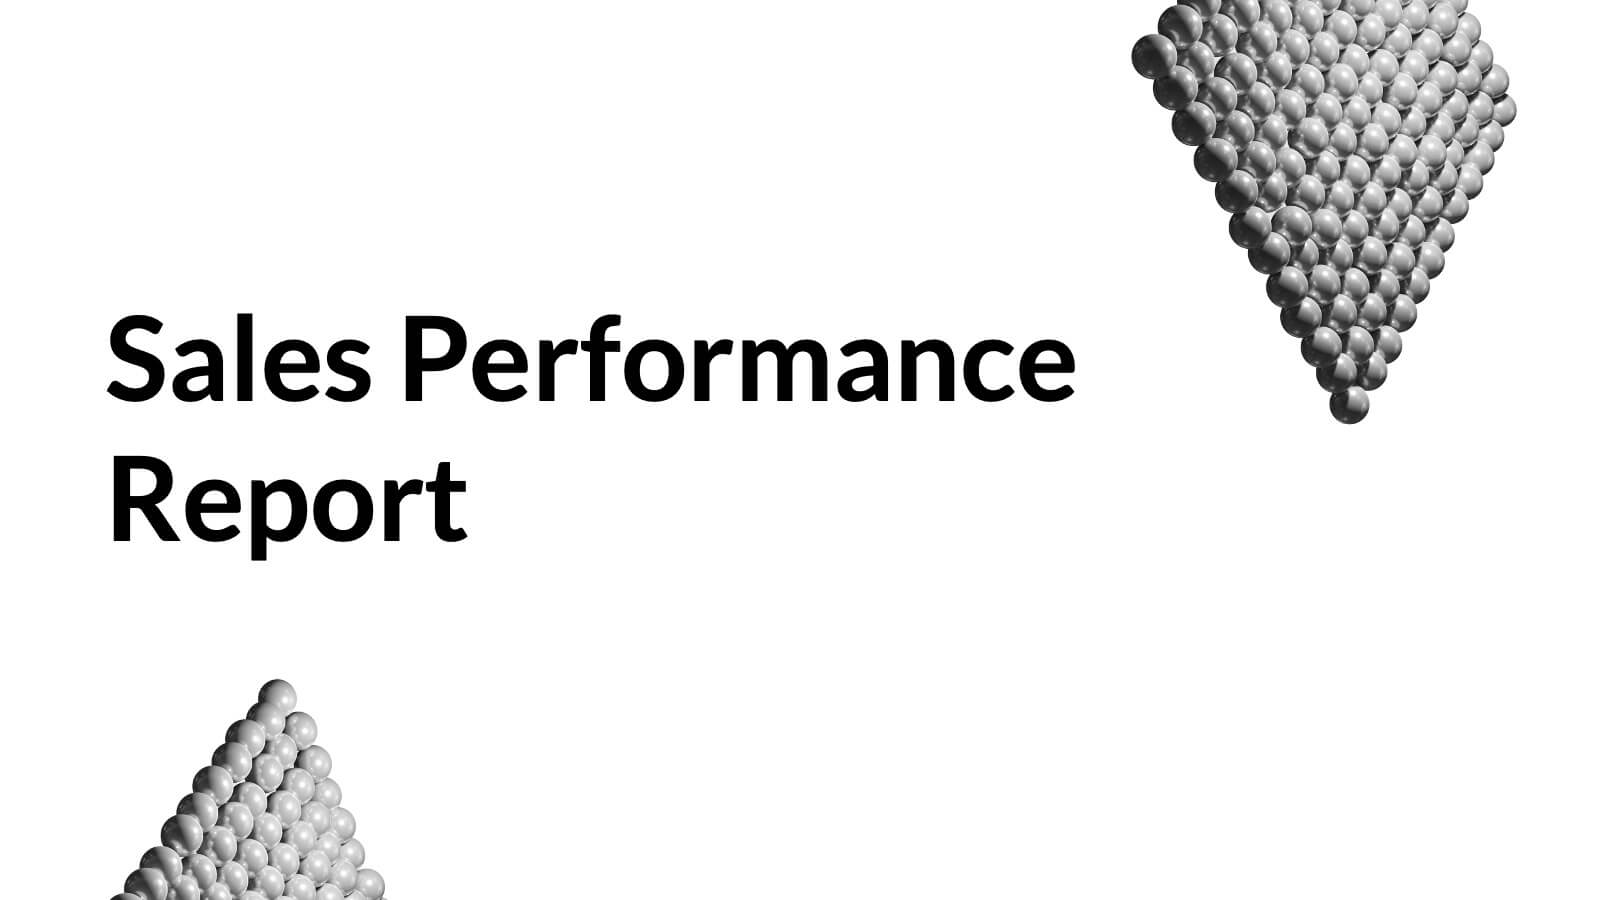
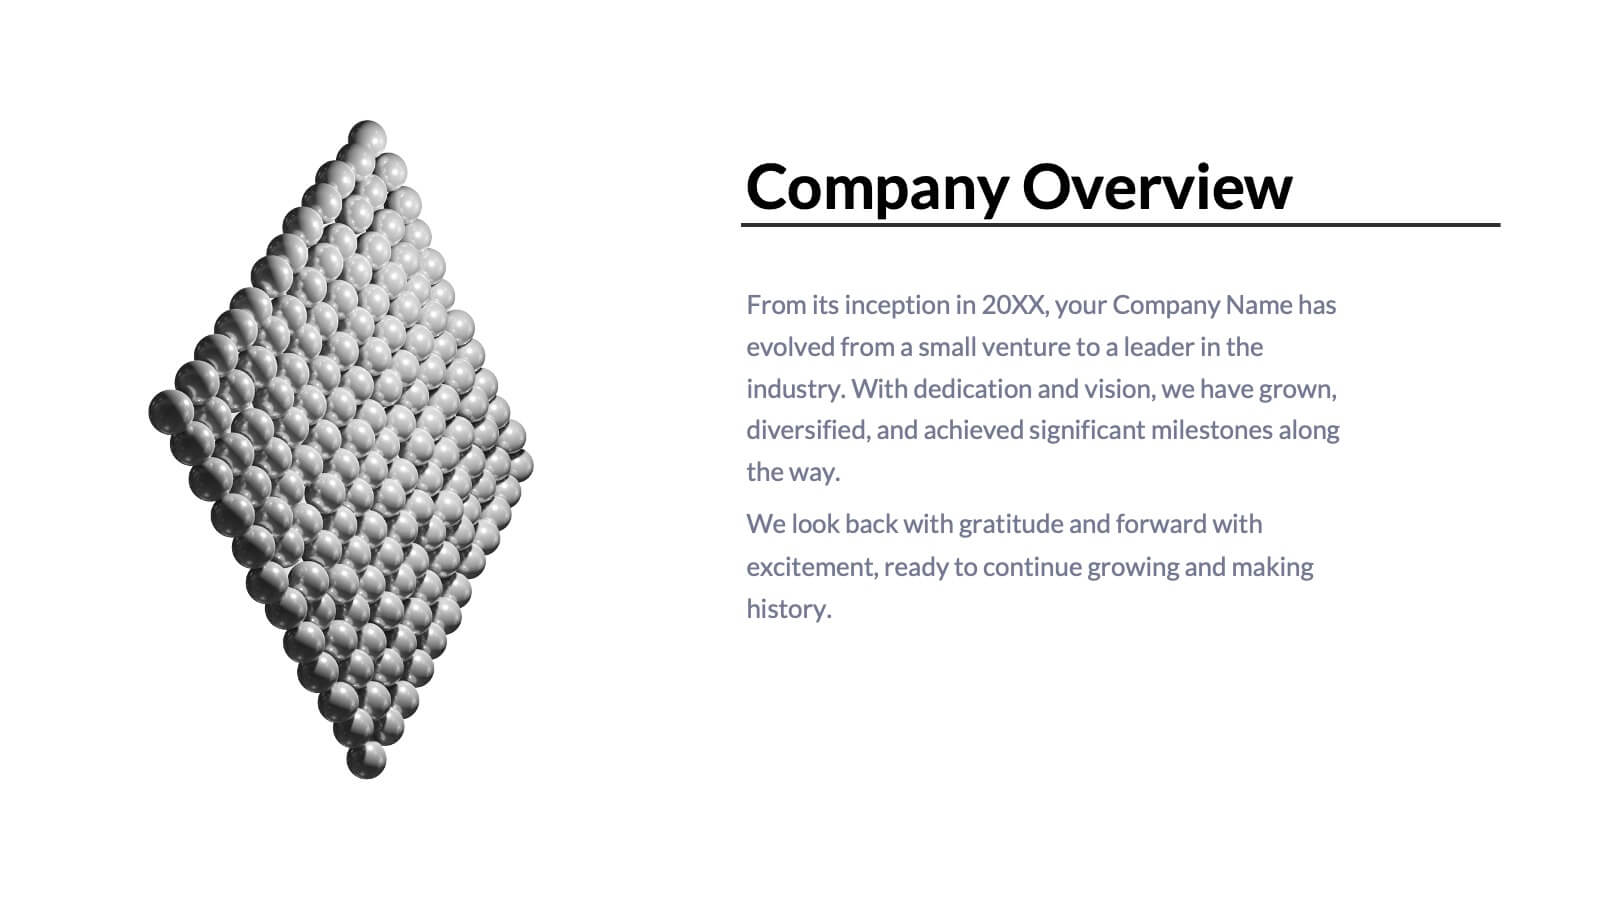
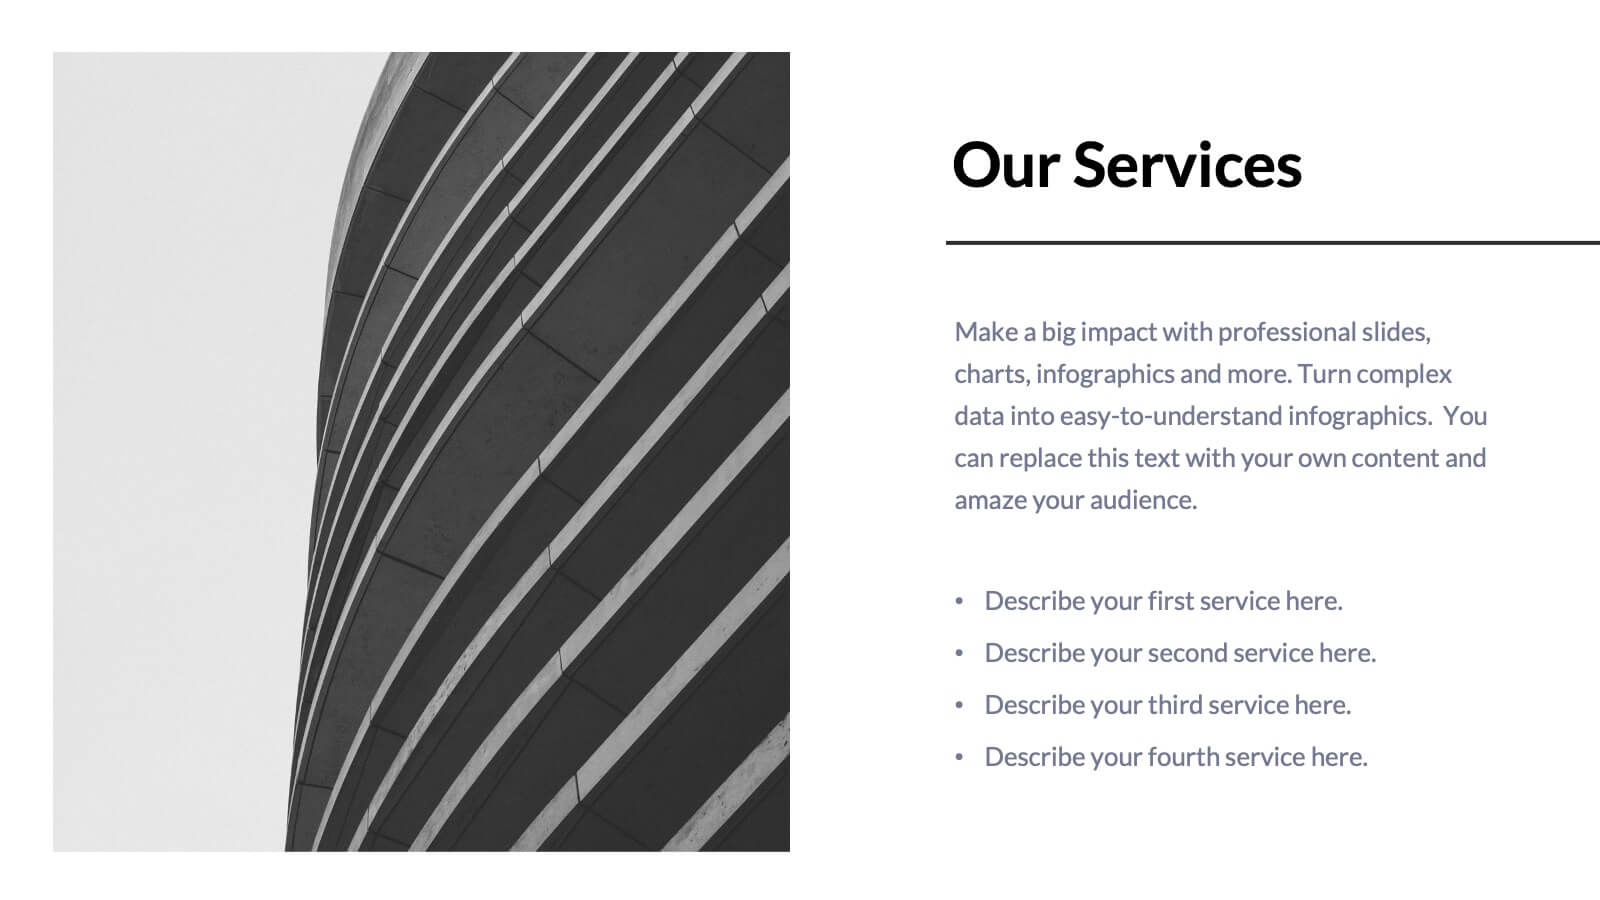
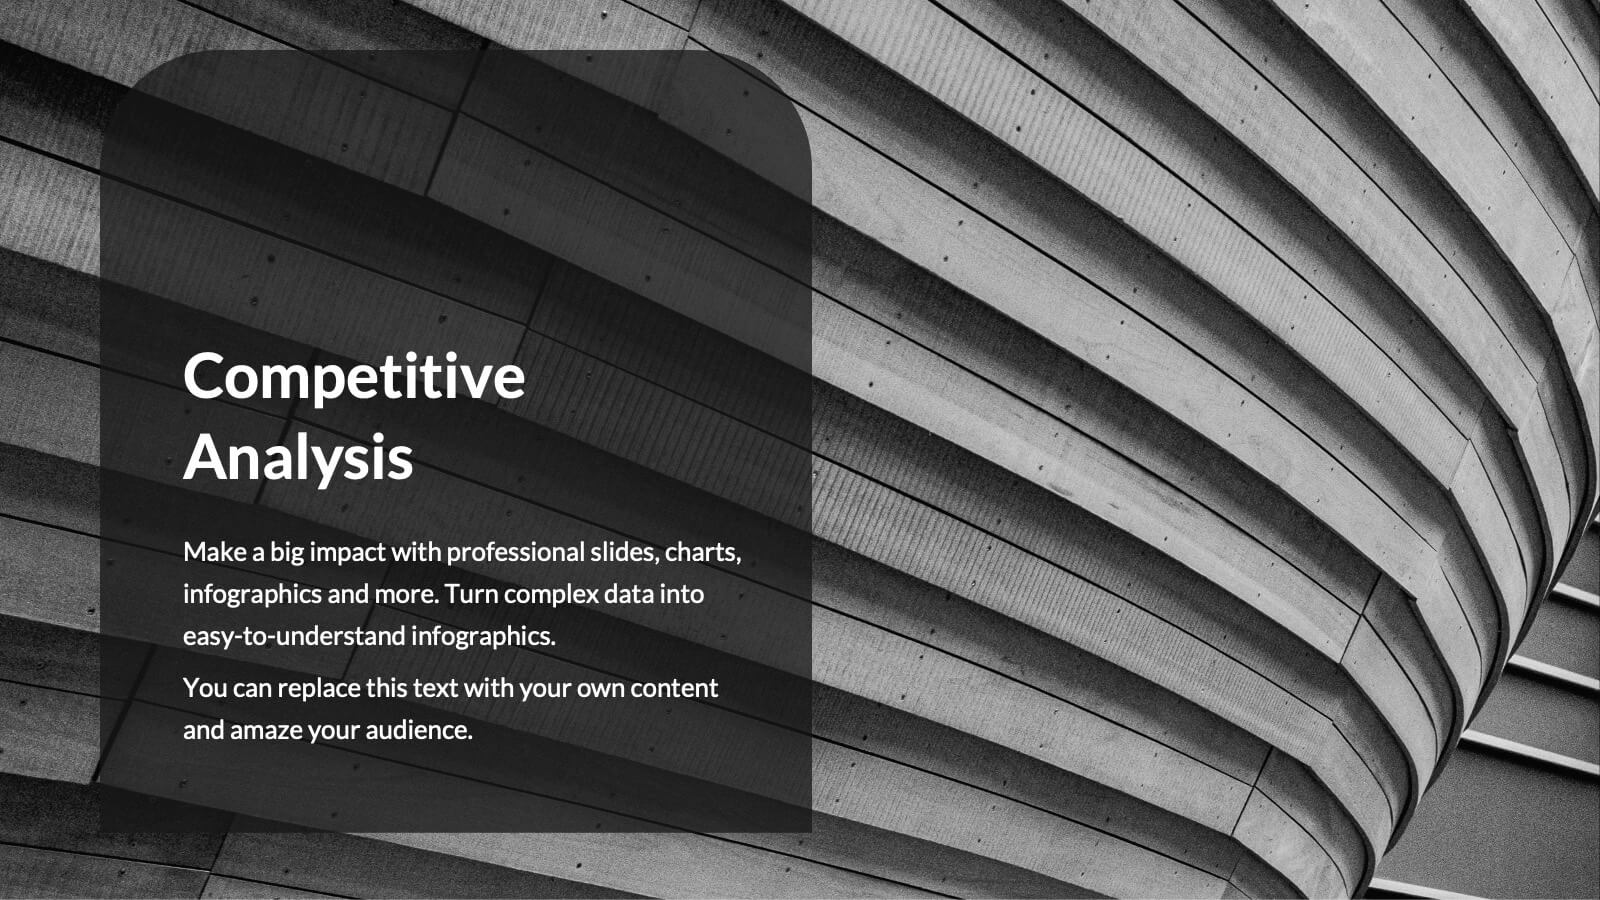
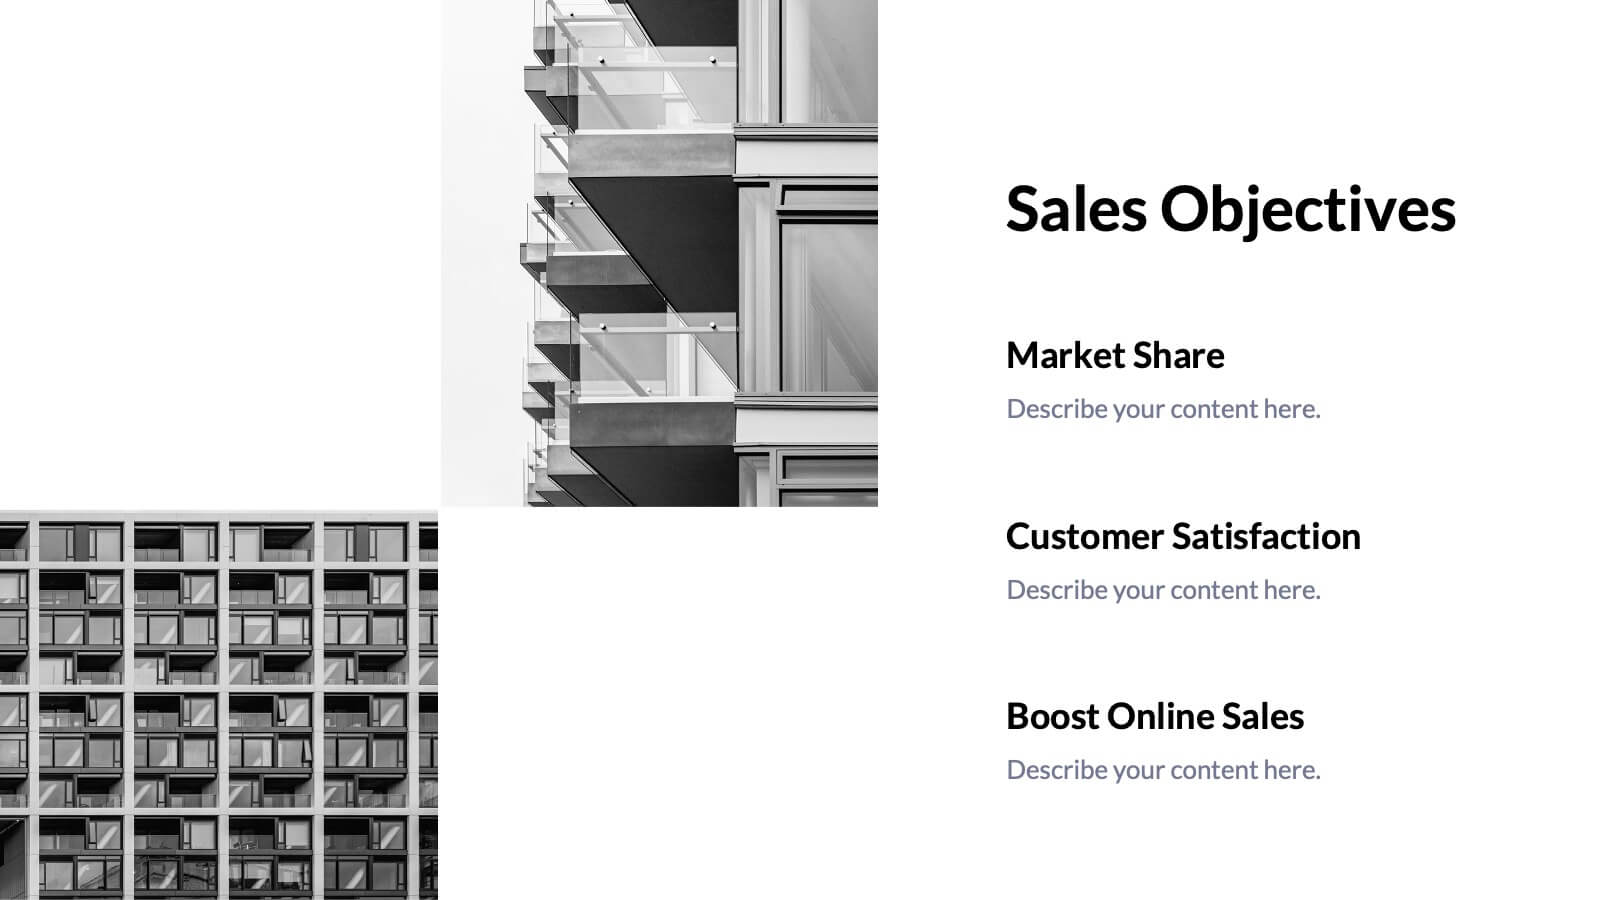
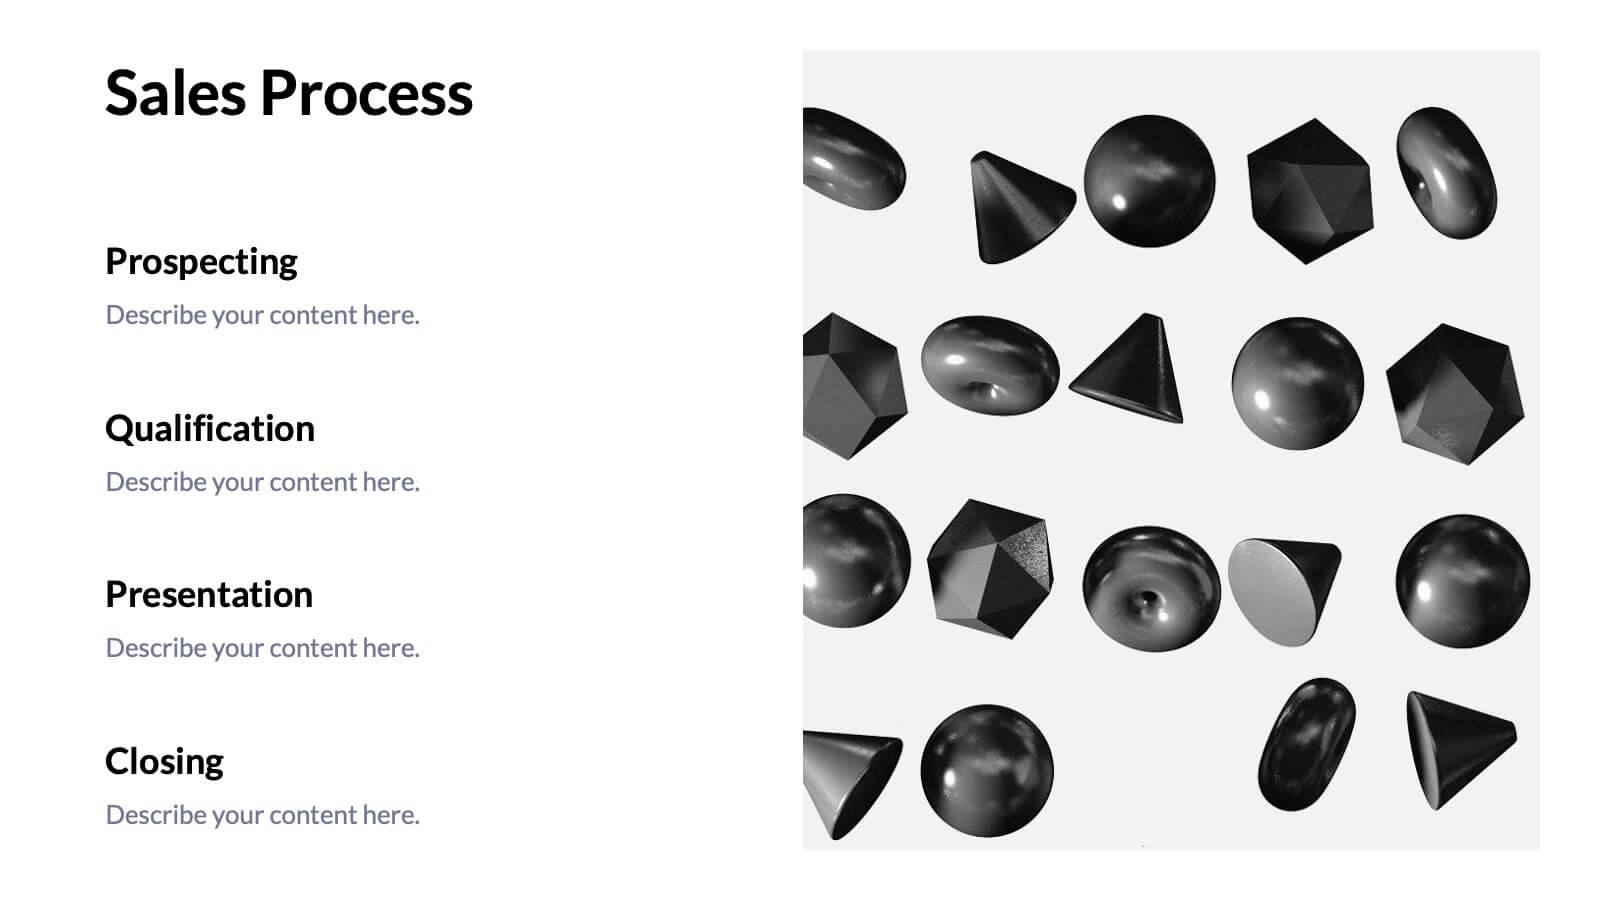
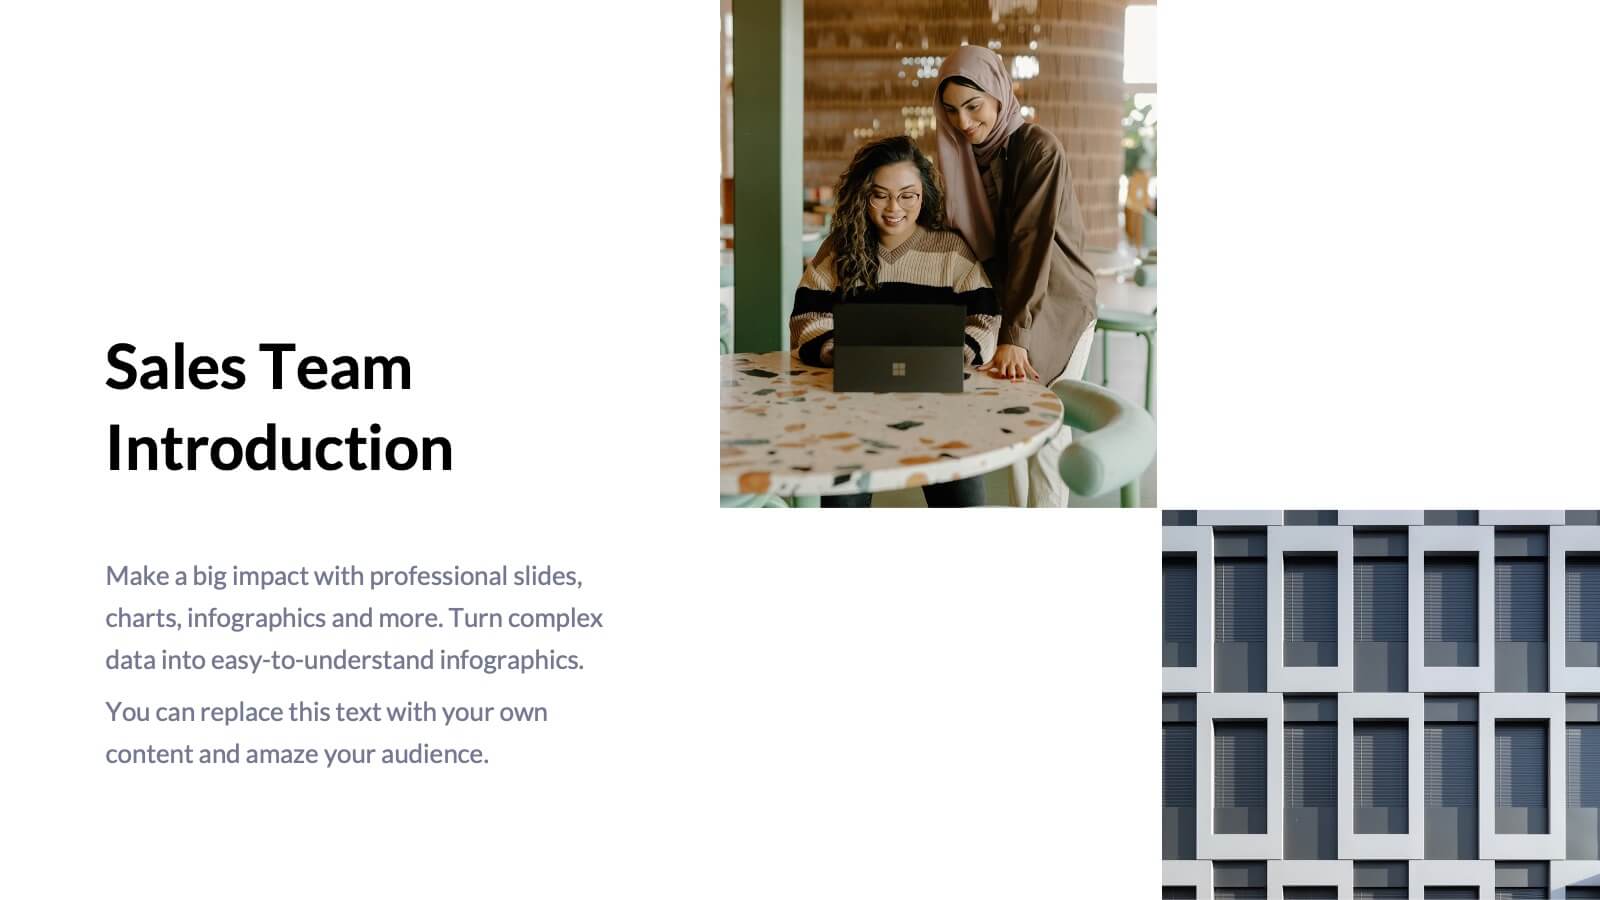
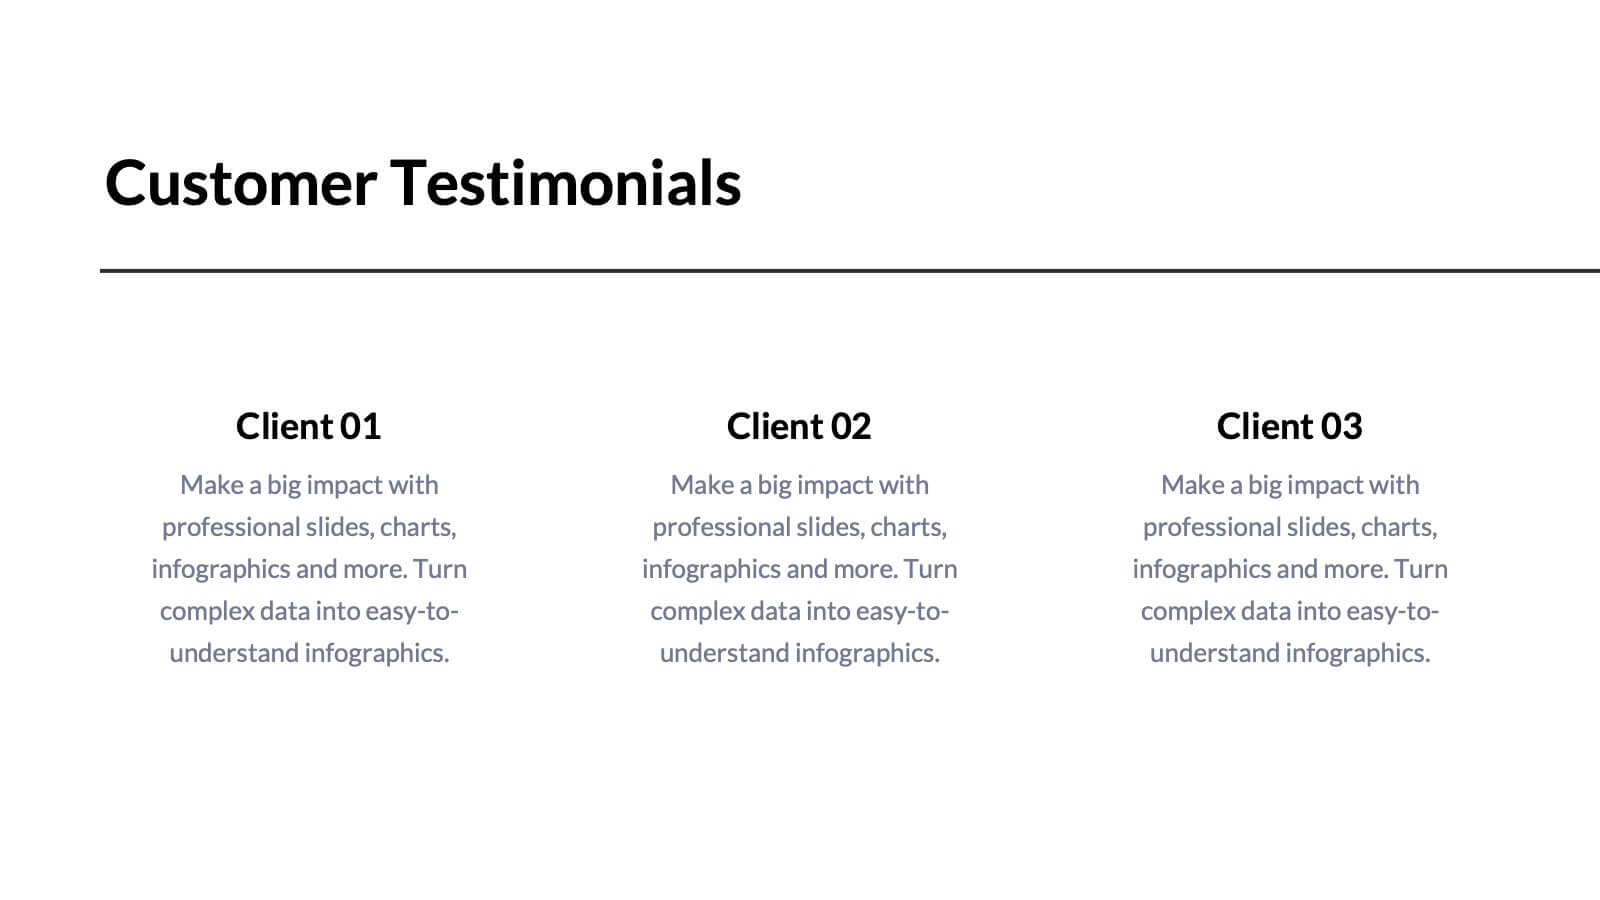
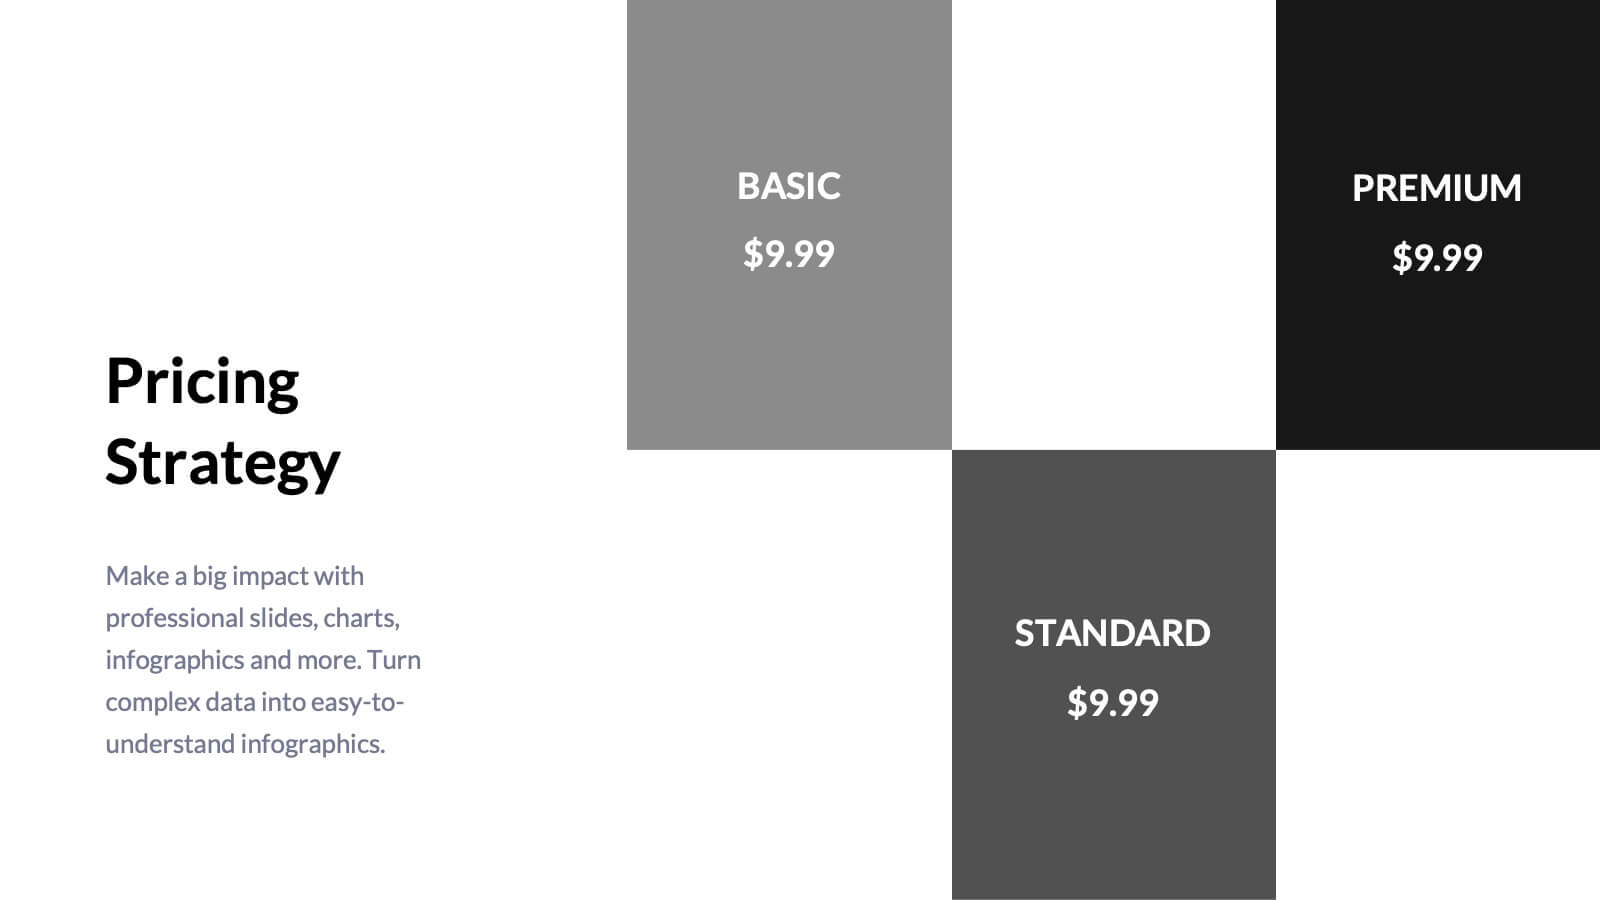
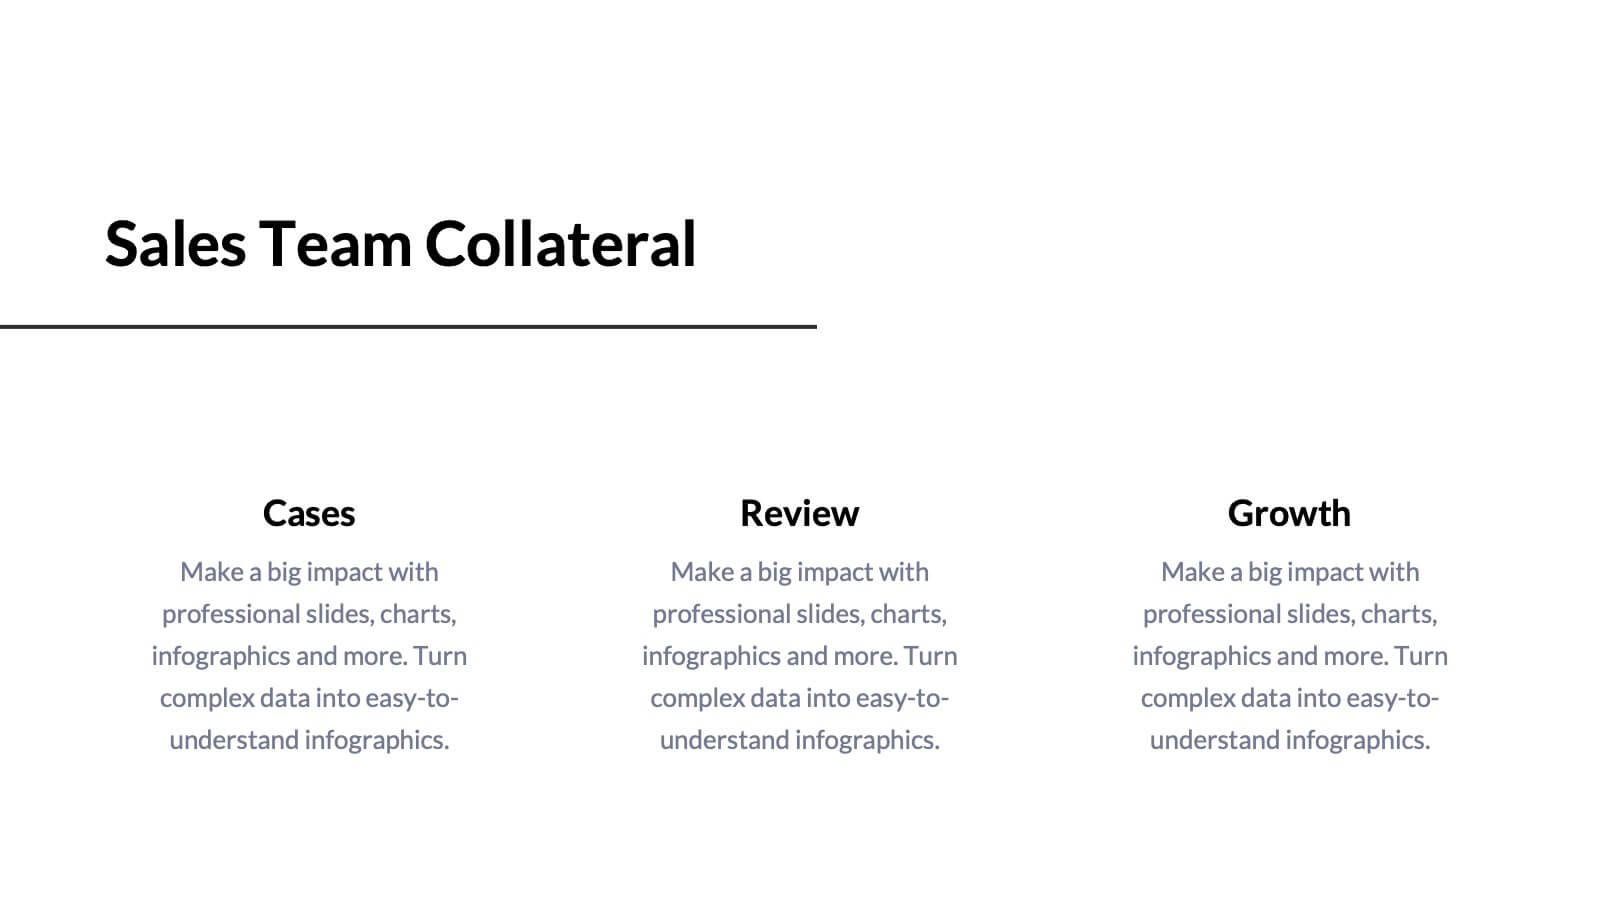
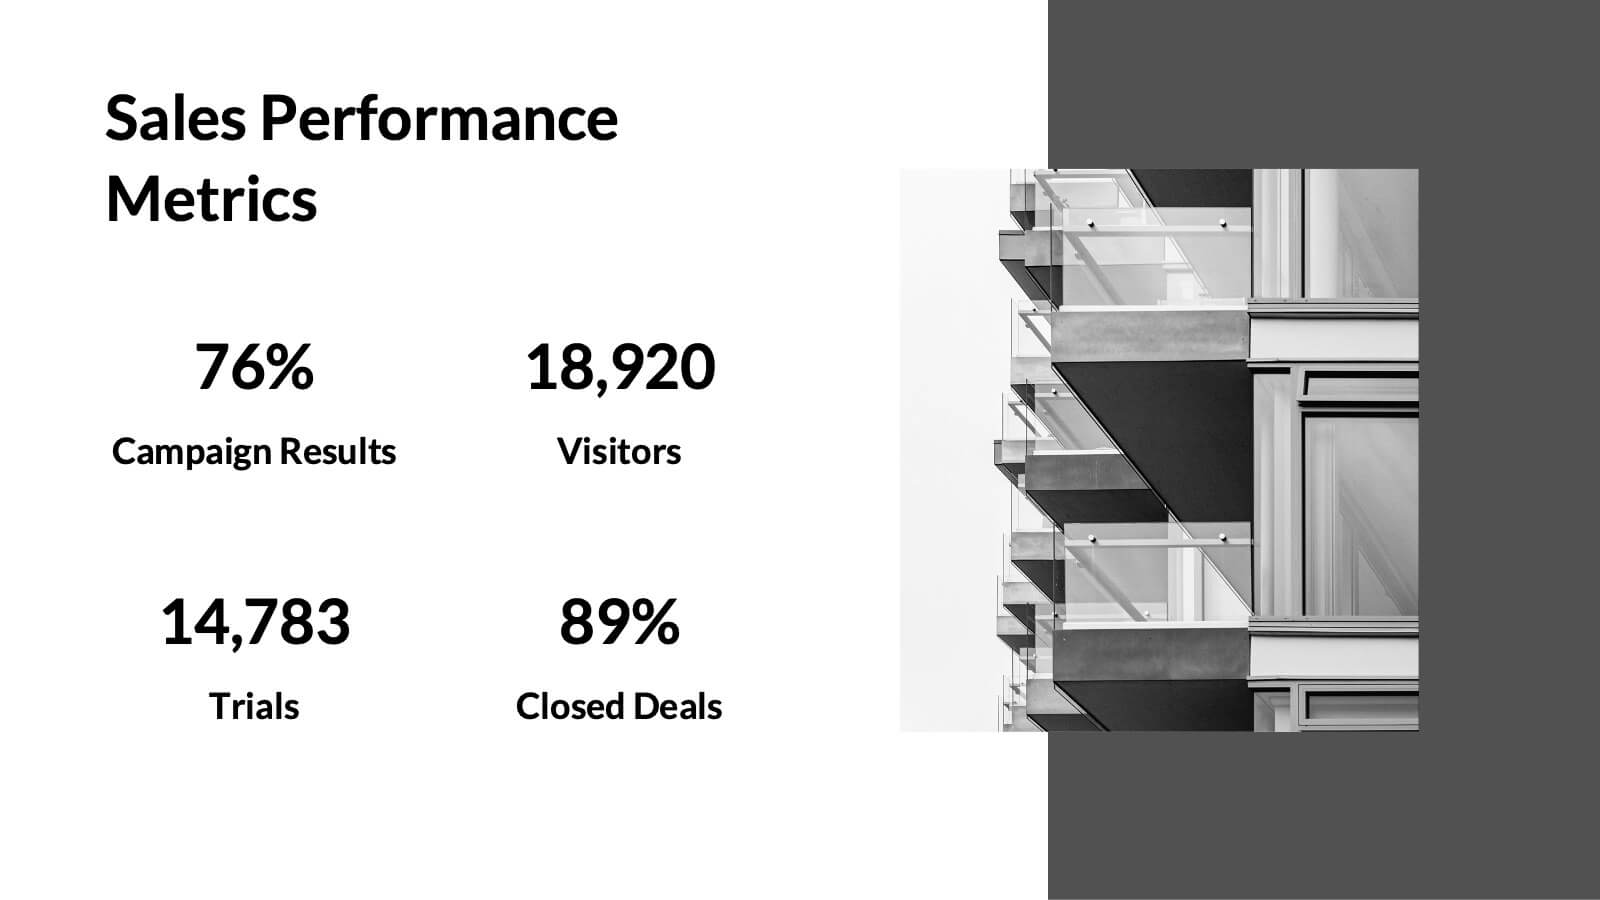
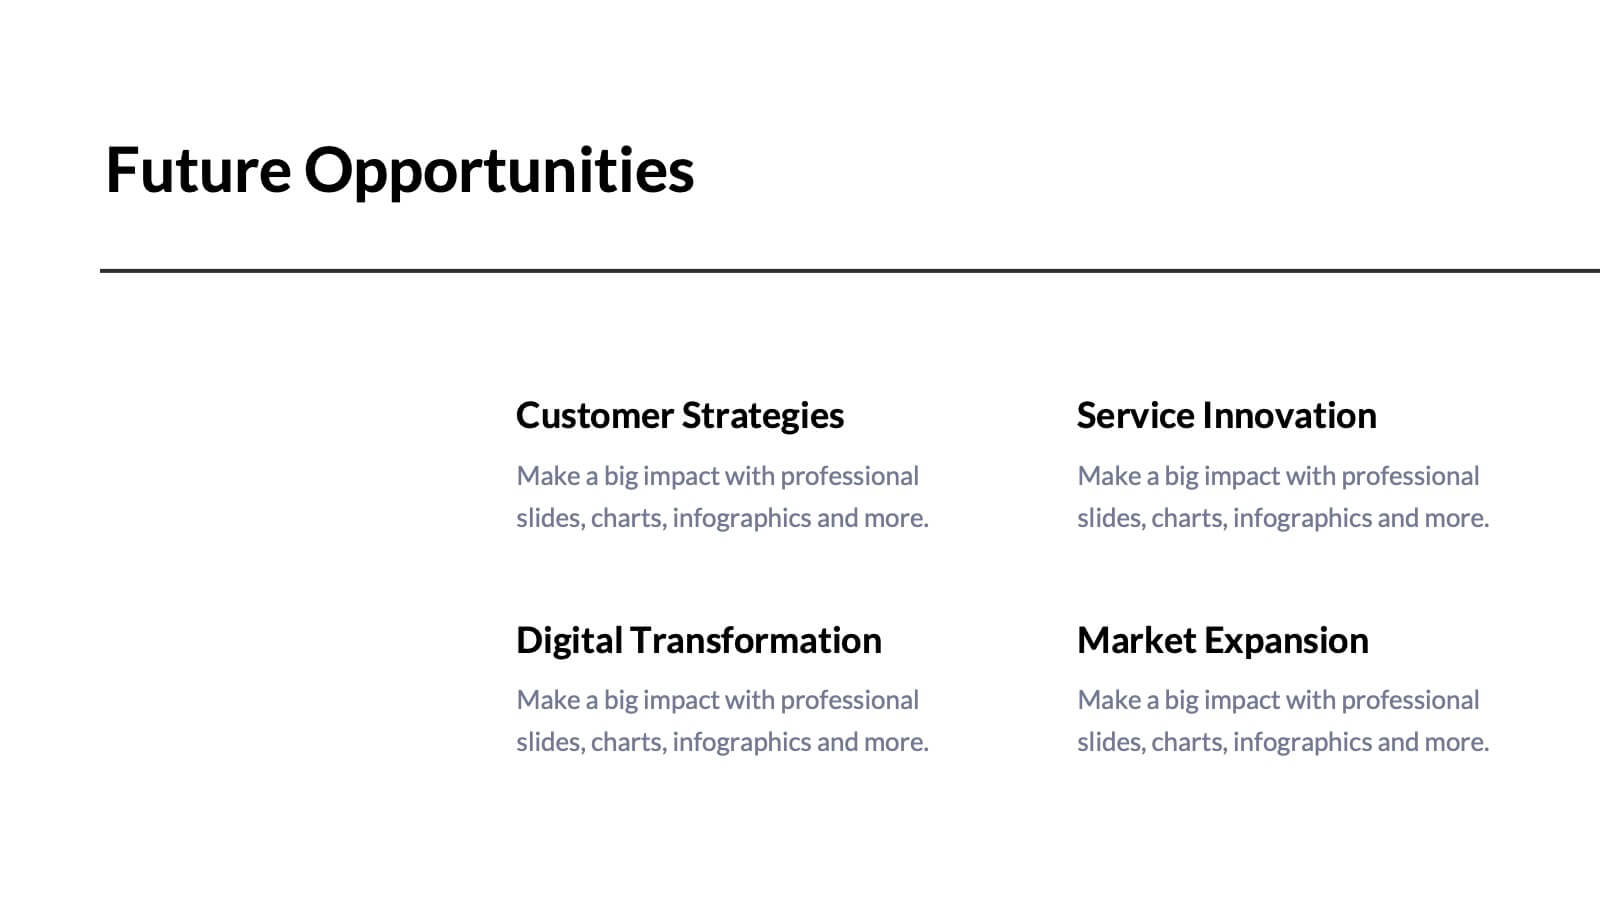
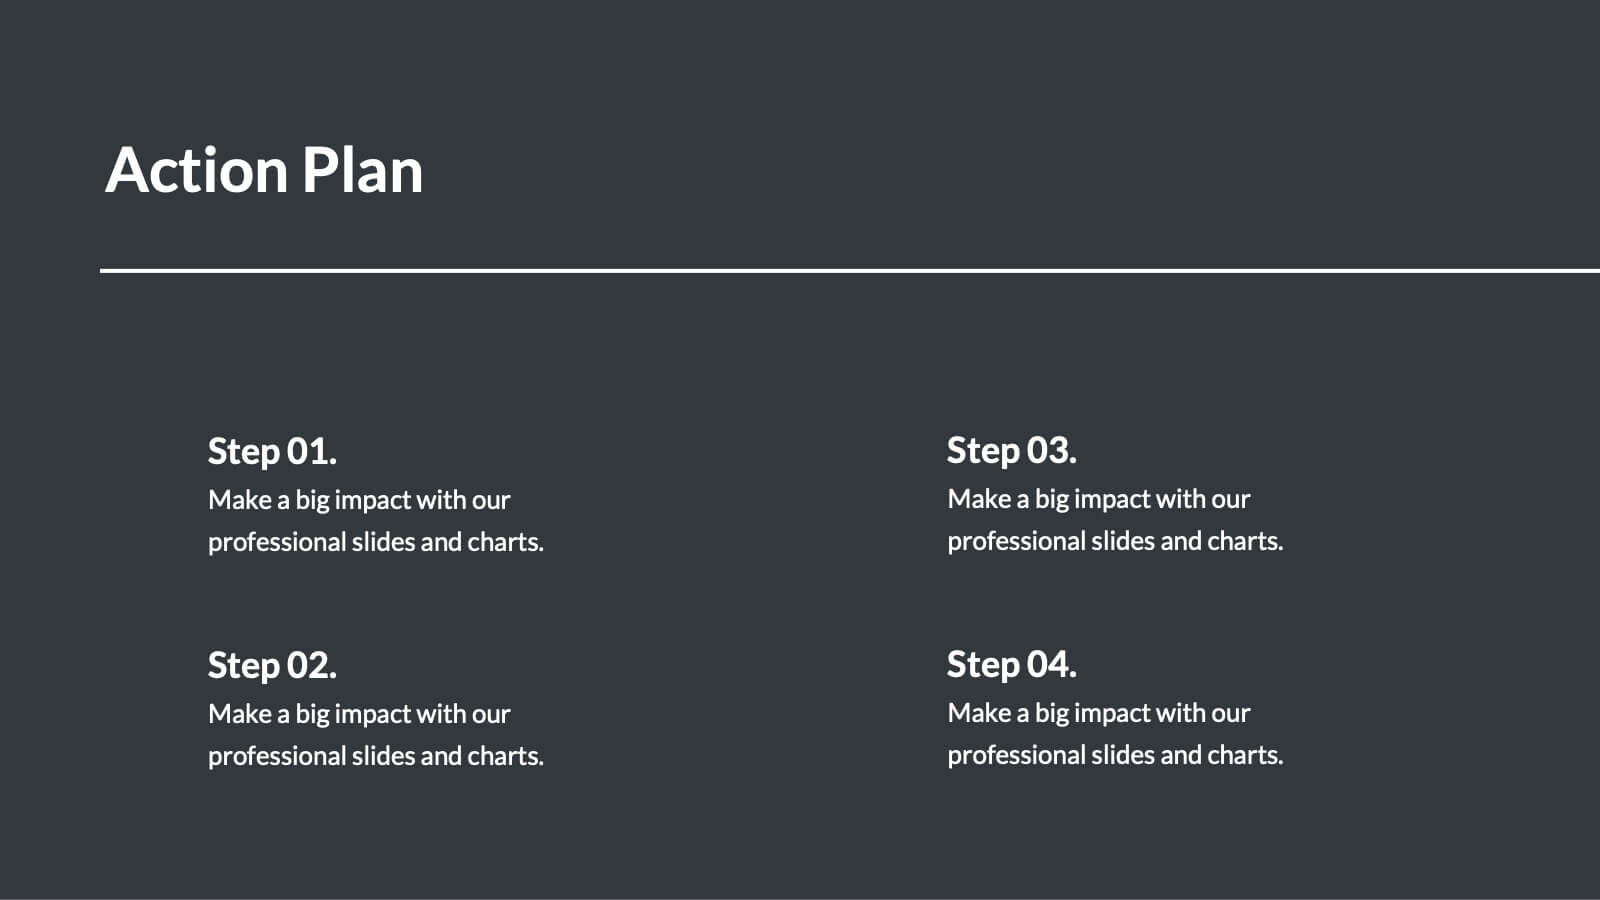
Tempest Sales Performance Report Presentation
Supercharge your sales presentations with this sleek, professional template. Perfect for outlining sales objectives, processes, and performance metrics, it features a clean, minimalist design that enhances clarity and impact. Highlight key elements like competitive analysis, pricing strategy, and future opportunities to captivate your audience. Compatible with PowerPoint, Keynote, and Google Slides, it ensures seamless presentations on any platform.


10 diapositivas
Effective Leadership Strategy Presentation
Unveil the secrets to transformative leadership with our Effective Leadership Strategy Presentation. This template guides you through essential leadership stages with visually engaging graphics, ideal for molding influential leaders. Fully compatible with PowerPoint, Keynote, and Google Slides, it's perfect for enhancing your leadership training sessions.


7 diapositivas
Challenge Infographic Presentation Template
Our Challenge Infographic template is designed for conveying the challenge, purpose, problem and solution of an issue. This template is perfect for presenting ideas and plans on any topic from business to education. It features a clean design that allows you to highlight your ideas with confidence. With this template, you will make your data stand out with a variety of charts, graphs and text to create contrast and guide the audience through your message. Our template is compatible with powerpoint and gives you the ability to customize all of the text boxes, colors and any other elements.


5 diapositivas
Creative Problem Solving with Design Thinking Presentation
Bring your innovation process to life with the Creative Problem Solving with Design Thinking Presentation. This visual layout uses gear and bulb icons to highlight four essential stages in the design thinking approach. Perfect for brainstorming sessions, innovation pitches, and product development workshops. Easily editable in Canva, PowerPoint, Google Slides, and Keynote.


2 diapositivas
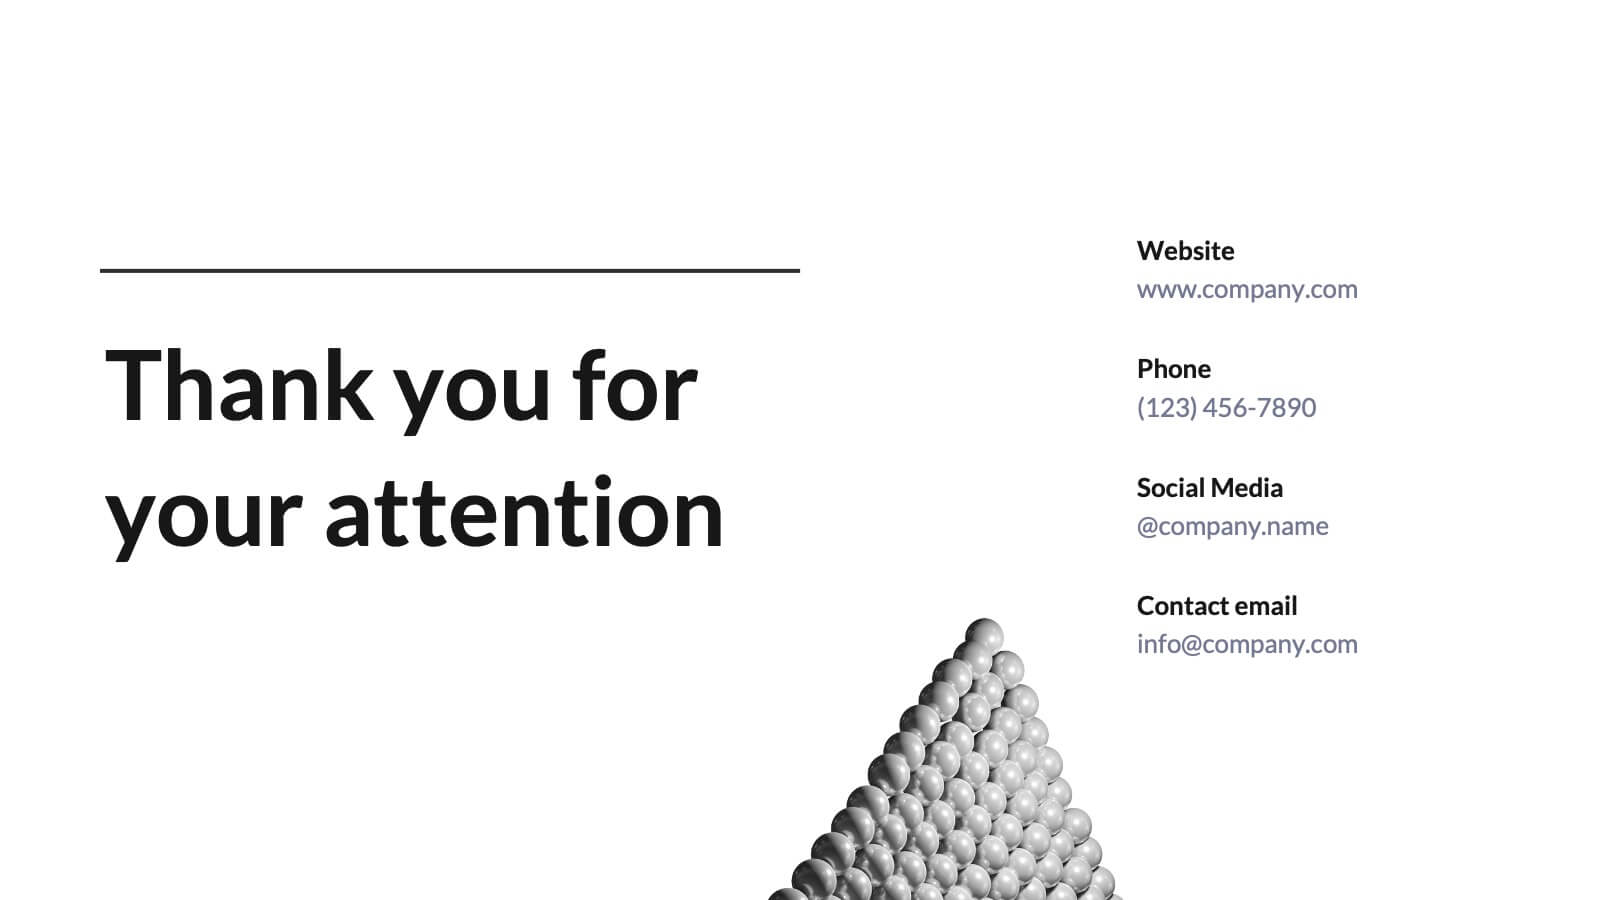
Professional Closing Thank You Presentation
End your presentation on a high note with this professional thank-you slide template! Featuring a clean and modern layout, this design includes space for contact details and a call to action, making it perfect for business meetings, proposals, and networking events. Fully customizable and compatible with PowerPoint, Keynote, and Google Slides.


6 diapositivas
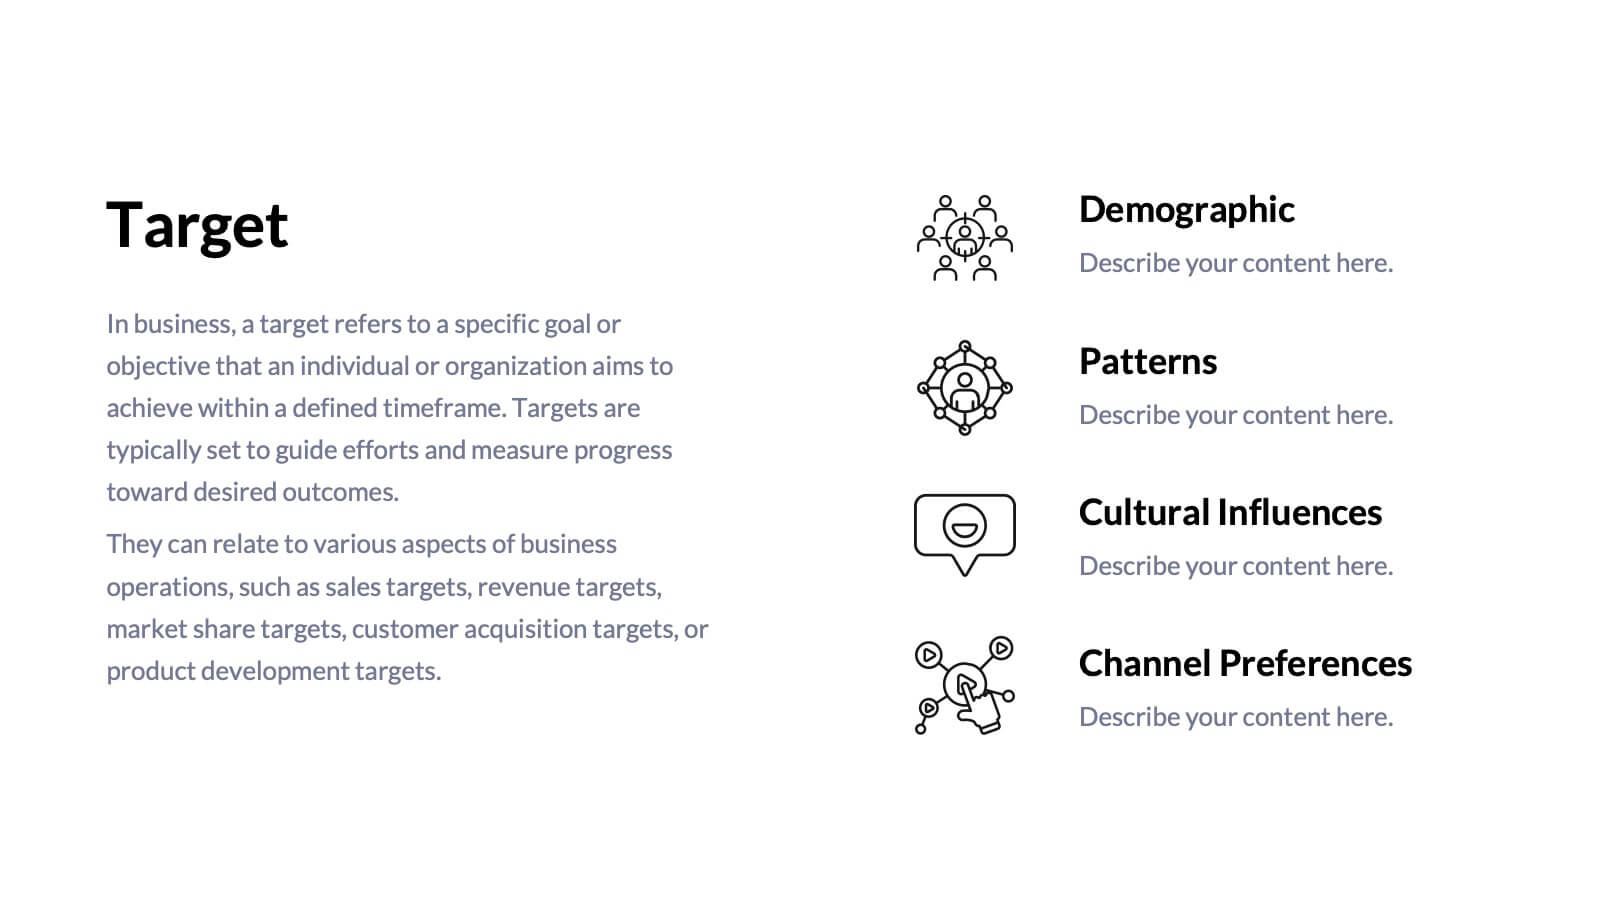
Customers Market Segmentation Strategy Presentation
Unlock the power of understanding your audience with a visually structured layout that turns complex data into clear, actionable insights. This presentation helps businesses define, target, and engage customer groups effectively. Fully editable and compatible with PowerPoint, Keynote, and Google Slides for seamless customization and professional presentation delivery.


20 diapositivas
Astrolight Startup Growth Plan Presentation
A modern and vibrant presentation template tailored for startups. It includes slides for business models, growth plans, competitive analysis, and financial overviews. The visually appealing layout ensures clarity and impact for stakeholders. Fully customizable and compatible with PowerPoint, Keynote, and Google Slides for seamless adaptability.


6 diapositivas
School Goals and Administration Presentation
Visualize key academic priorities with this notebook-style layout, perfect for school administrators and teachers. Featuring colorful pushpin markers and a two-page spread, this template is great for outlining goals, responsibilities, or class guidelines. Fully editable in PowerPoint, Keynote, and Google Slides for customized, classroom-ready presentations.


7 diapositivas
RACI Matrix Process Infographic Presentation
A RACI matrix is a project management tool that is used to clarify and define roles and responsibilities for project tasks and deliverables. Use this template to help you quickly create RACI charts for your next project. Made up of strategic box with shapes, colors, numeric value and text boxes that can be edited easily. This Template is a multipurpose slide as it can be used to present data visually, build a discussion on the topic and influence your audience to take action. Save time and energy with this infographic template, compatible with Powerpoint, Keynote and Google Slides.


4 diapositivas
Digital Course Creation Flow Presentation
Guide your audience through the steps of building a digital course with this clear and modern flowchart layout. Designed to simplify complex processes, this visual template is ideal for educators, instructional designers, or online coaches. Fully compatible with PowerPoint, Keynote, and Google Slides for easy customization and seamless use.


7 diapositivas
Performance Improvement Infographics
A Performance Improvement infographic is a visual representation of the key elements of a plan to enhance the performance of an individual, team, or organization. The purpose of this template is to communicate the plan's objectives, strategies, and metrics in an informative and engaging way. This infographic contains graphs, and diagrams to illustrate key performance indicators and other measures of success. This performance template can help motivate and engage stakeholders, highlight the benefits of performance improvement, and facilitate communication and collaboration among team members.


6 diapositivas
Effective Communication in Meetings Presentation
Communicate with impact using this circular diagram template designed to visualize six key elements or steps for better meeting communication. With centered speech bubble icons and balanced layout, it's ideal for sharing best practices, communication roles, or team feedback loops. Fully customizable in PowerPoint, Keynote, and Google Slides.