


Características


¿Tienes alguna pregunta?
Recomendar


5 diapositivas
Health Care Infographics
Taking care of your health is an investment in your future self and can lead to a happier and more fulfilling life. These vertical health care infographics are visual representations of information related to health care. They can cover a wide range of topics, such as disease prevention, medical treatments, and patient care. These are designed to be easily understandable and engaging for a general audience. They use colorful graphics and illustrations to convey complex information in an eye-catching manner. These also include graphs, diagrams text boxes, and other design elements to highlight key information.


5 diapositivas
IT Support and Systems Presentation
Streamline your tech communication with a clean, structured layout that highlights your IT services, support processes, and system workflows. Perfect for teams presenting solutions, infrastructure overviews, or technical strategies, this presentation brings clarity to complex topics. Fully compatible with PowerPoint, Keynote, and Google Slides for effortless editing and delivery.


5 diapositivas
Music & Arts Infographics
Music and Arts enrich our lives, stimulate our senses, and foster personal growth this plays a significant role in our lives and society. These infographic templates are perfect for promoting understanding and appreciation for music and arts. These can be used in educational settings, cultural organizations, or for personal enrichment, this template effectively conveys the significance of music and arts in our lives and inspires the audience to explore and engage with these creative expressions. These infographics include text boxes, icons, and color schemes that can be customized to fit your brand.


5 diapositivas
Brief Overview of Key Insights Presentation
Present essential information at a glance with this Brief Overview of Key Insights slide. Designed around a bold key graphic, this layout highlights up to four major takeaways with icons and concise descriptions. Ideal for summaries, analysis highlights, or recommendations. Fully editable in Canva, PowerPoint, or Google Slides.


7 diapositivas
Business 3D Infographic
Bring a new dimension to your business presentations with our 3D Business Infographics. These dynamic visuals are perfect for professionals and educators who want to add depth to their data representation and make complex information more accessible. Our 3D Business Infographics collection features a range of formats, from layered pyramids to multidimensional bar graphs, allowing for innovative depictions of hierarchies, relationships, and progressions. Whether you're illustrating strategic frameworks, financial analysis, or project milestones, these graphics can enhance understanding and engagement. Customizable for any business context, these infographics are designed to stand out in reports, presentations, or educational materials. Their SEO-friendly nature ensures that your content is more likely to be seen and shared, extending your reach. Use these 3D infographics to make a strong visual impact that communicates your business concepts with clarity and creativity.


5 diapositivas
Strategic Decision-Making Techniques Presentation
Communicate key business insights with clarity using this structured four-step layout. Each segment is aligned with an icon and space for concise text, making it ideal for presenting executive strategies, project evaluations, or decision pathways. The centered character adds a professional and engaging touch. Fully customizable in PowerPoint, Keynote, and Google Slides.


8 diapositivas
Financial Growth Planning Presentation
Plan and track financial success with this Financial Growth Planning template. This visually engaging slide features a stepwise roadmap with hexagonal icons, helping you outline budgeting, investments, and financial milestones in a clear and structured format. Perfect for financial analysts, business strategists, and executives, this slide is fully editable and compatible with PowerPoint, Keynote, and Google Slides.


5 diapositivas
SEO Strategies Infographics
Immerse yourself in the dynamic world of digital marketing with our SEO strategies infographics. Rendered in bold black, vibrant orange, and various eye-catching colors, this creative and vertical template serves as a beacon for marketing professionals, digital strategists, and entrepreneurs who aim to conquer the digital space. Each element, from engaging graphics to interpretative icons, is specifically tailored to present SEO methodologies with clarity and charisma. This infographic template is not only a visual treat but a reservoir of insights, facilitating users to communicate influential SEO tactics effectively and drive their brand's online visibility forward.


7 diapositivas
Growth Infographics Presentation Template
Our Growth Infographic template is a minimal modern design that combines data analysis and professional presentation. The presentation contains a set of slides with various information texts for your topic. This template is compatible with powerpoint and allows you to customize the color schemes, which makes it suitable for any theme and image style. Showcase your company’s growth by using this infographic template. This template can be used as a promotional tool for your business or to show growth results in order to attract investors. This template is a high quality, dynamic presentation!


26 diapositivas
Leadership and Management Skills Presentation
Elevate your leadership and management training with a presentation template that's as organized and efficient as it is visually appealing. The design is tailored for clarity, with a clean, contemporary layout that speaks to professionals eager to enhance their skills. Each slide is crafted with purpose, using a smart blend of graphics and space to highlight key concepts in leadership and management. This template includes a variety of slides to cover all training aspects: from the core qualities of a leader to the intricacies of team management. Graphs and charts provide a clear representation of management theories, while comparison slides help illustrate different leadership styles. Whether for a corporate training session, a workshop for budding entrepreneurs, or a classroom lecture, this set is ready for use in PowerPoint, Keynote, and Google Slides, making it a valuable tool for any leadership development program.


7 diapositivas
Risk Management Plan Infographics
This Risk Management Plan infographic template is a comprehensive tool for identifying and assessing potential risks in projects or business operations. Compatible with PowerPoint, Google Slides, and Keynote, it features a range of visual aids including risk matrices, probability scales, and impact graphs. Each slide is tailored to categorize risks by severity, from low to high, and includes customizable fields for detailed risk descriptions and mitigation strategies. The color-coding aids in quick recognition of risk levels, and the straightforward design ensures clarity in communication. Ideal for project managers and business strategists, this template streamlines the process of risk analysis and planning in any professional presentation.


3 diapositivas
Supply Chain and Transportation Map Presentation
Navigate the complexities of modern logistics with this engaging visual designed to map out each phase of product movement. This infographic breaks down the supply chain and transportation process into three clear stages—road, lift, and ship—making it easy to explain workflows or illustrate system improvements. Compatible with PowerPoint, Keynote, and Google Slides.


5 diapositivas
Project Milestone Timeline Presentation
Bring your project’s journey to life with this vibrant and organized presentation layout. Designed to showcase milestones, releases, and key phases clearly, it helps teams stay aligned and focused on goals. Fully editable and compatible with PowerPoint, Keynote, and Google Slides for smooth, professional presentations every time.


20 diapositivas
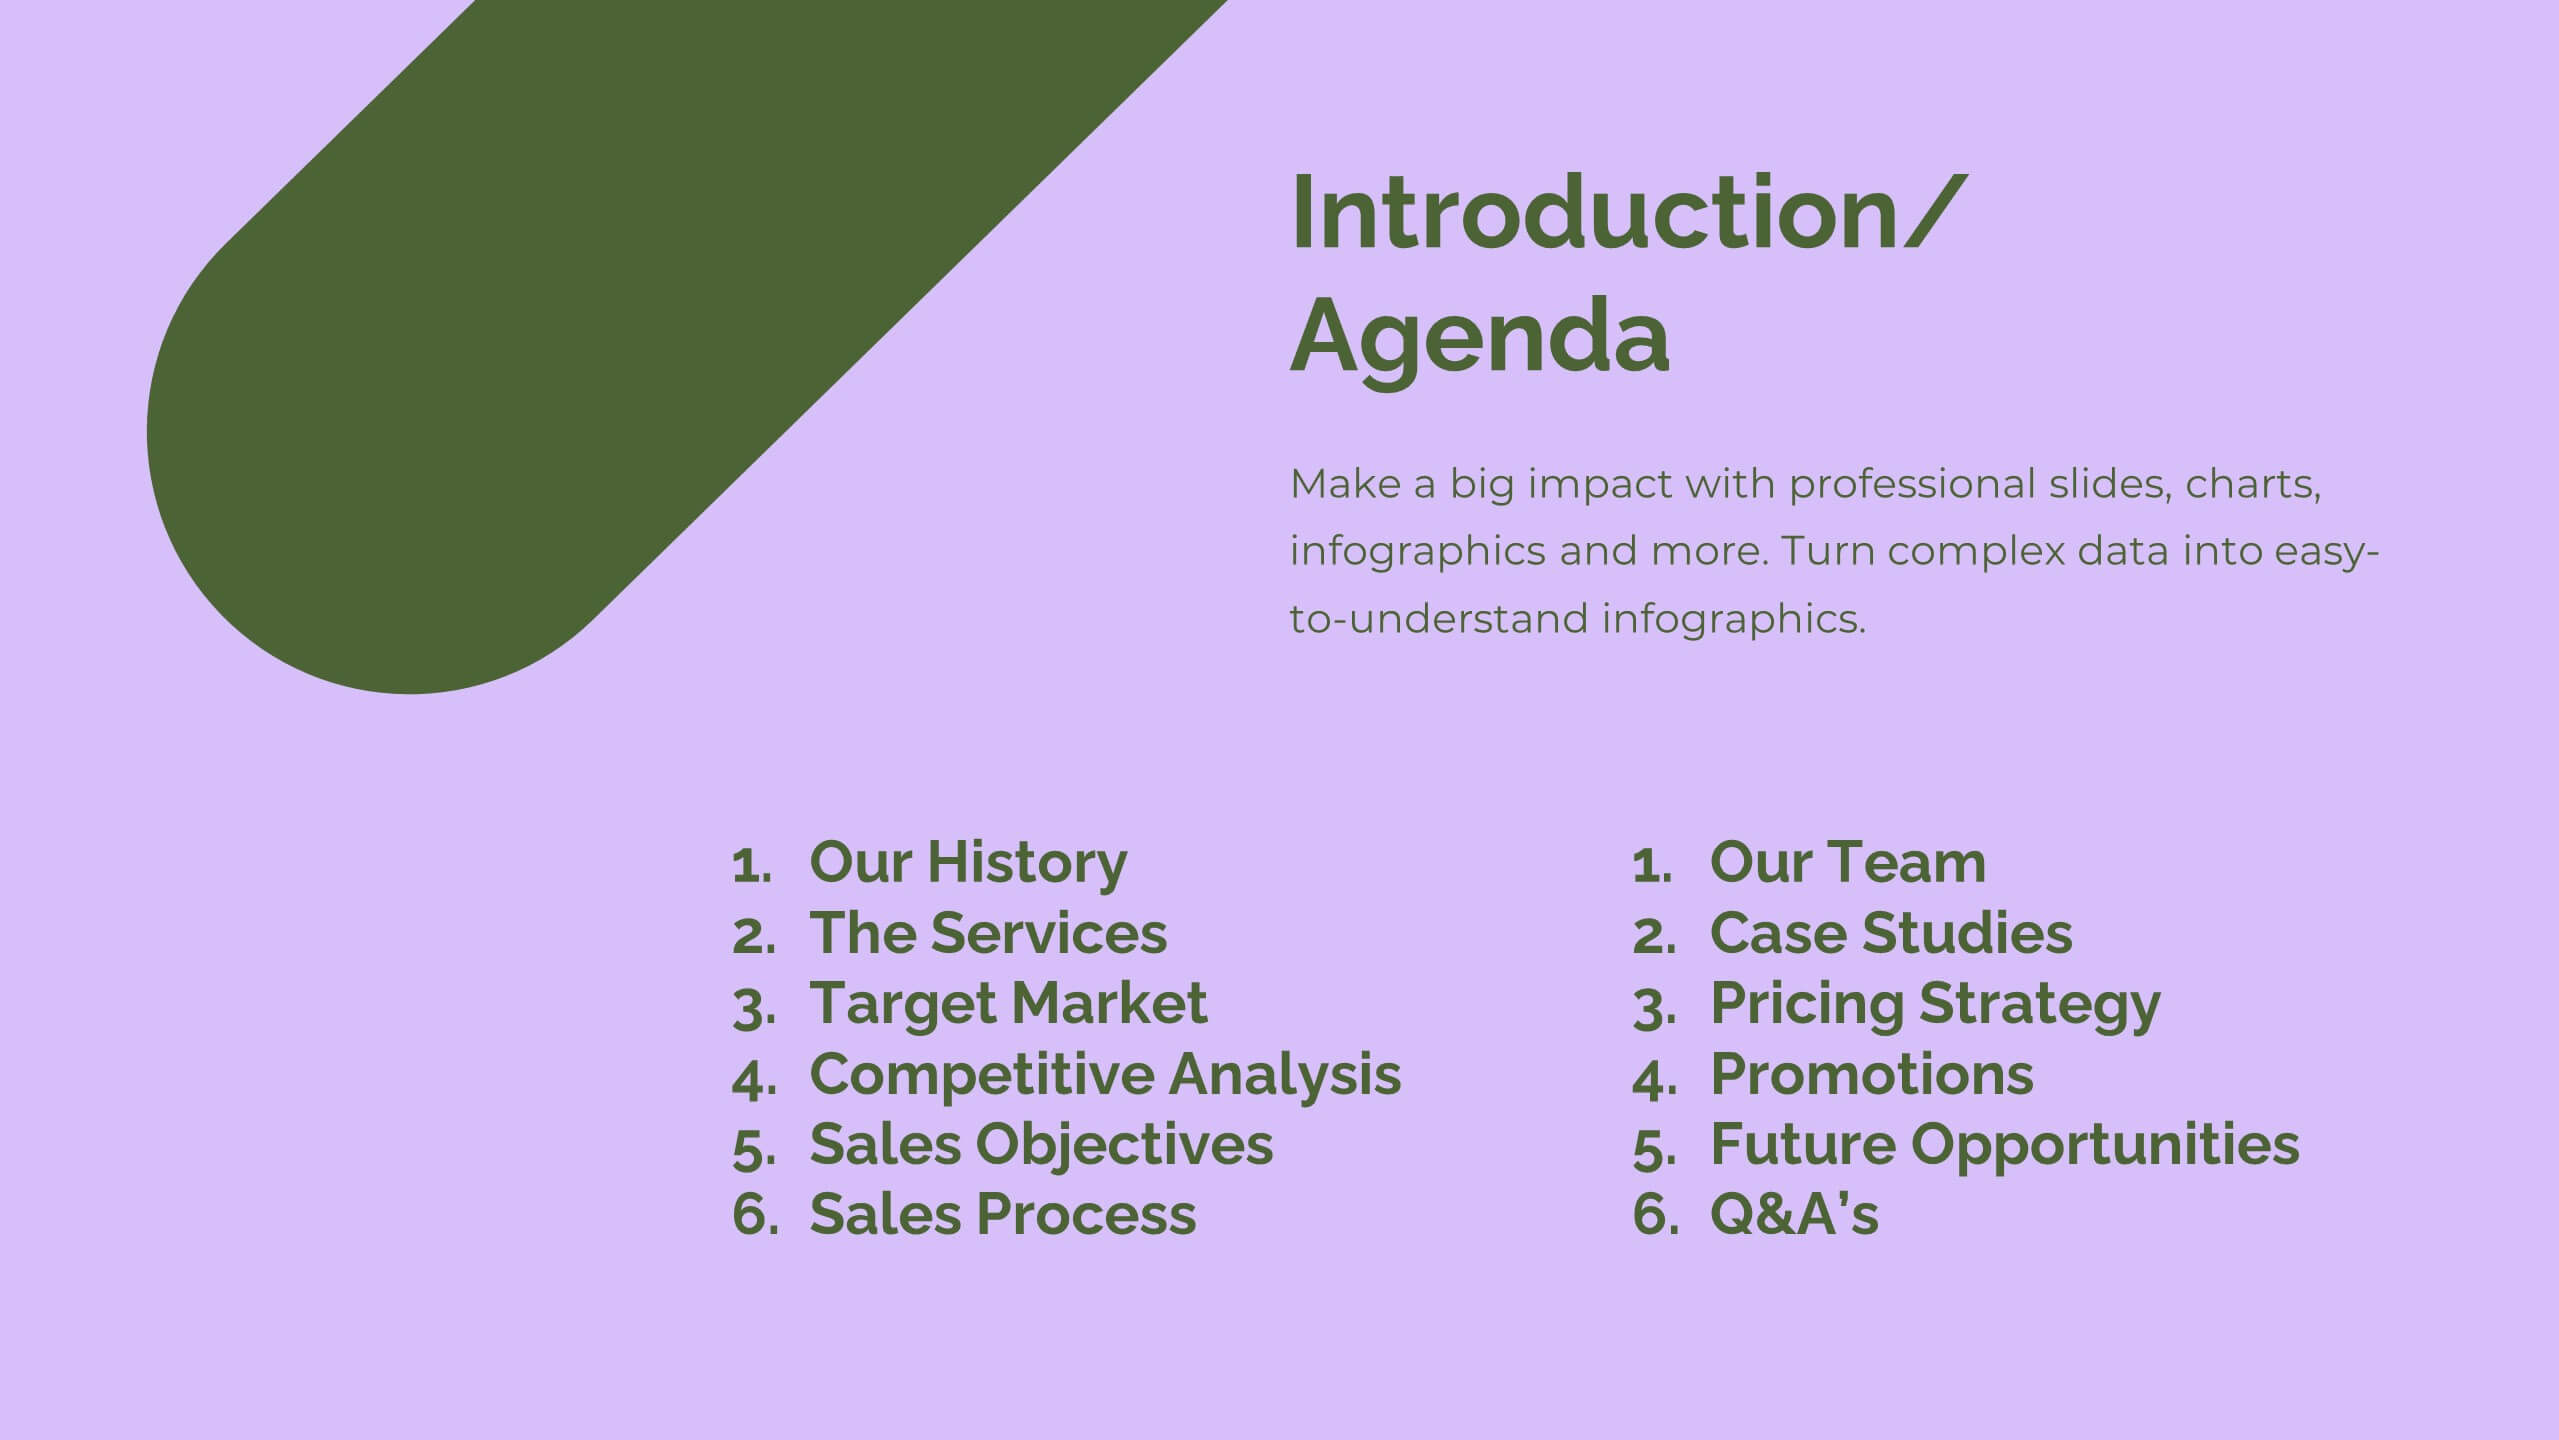
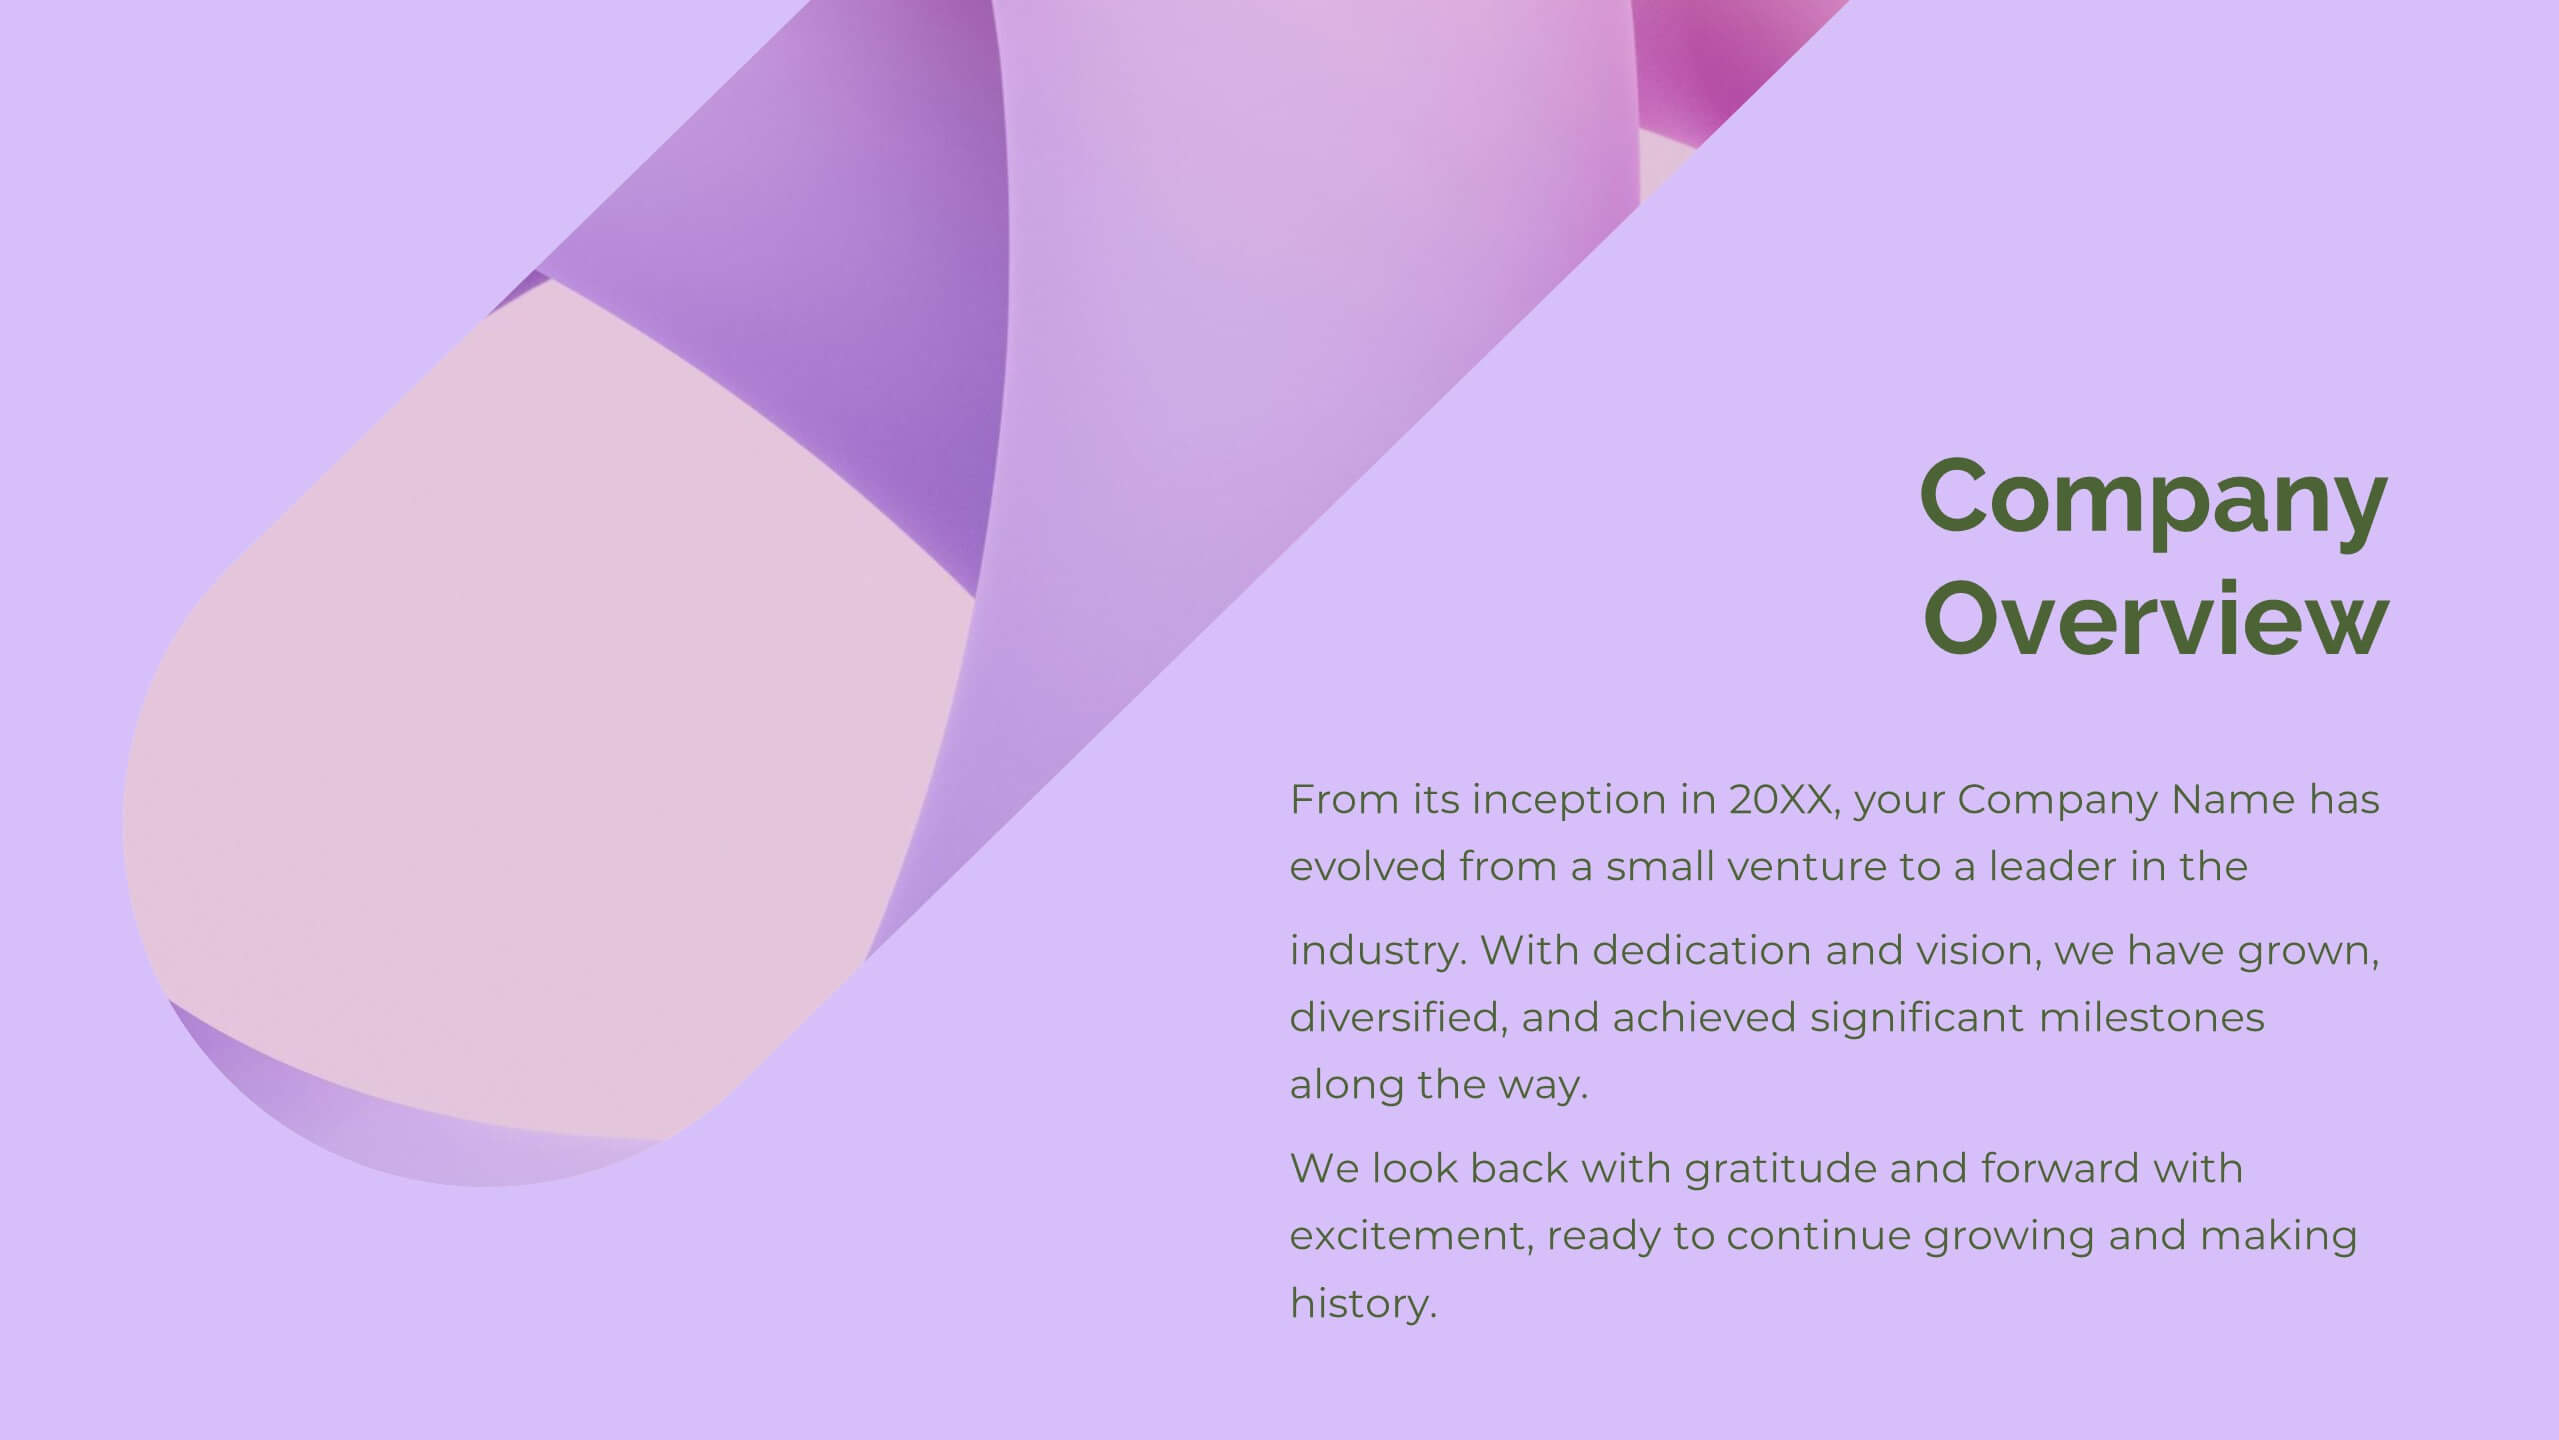
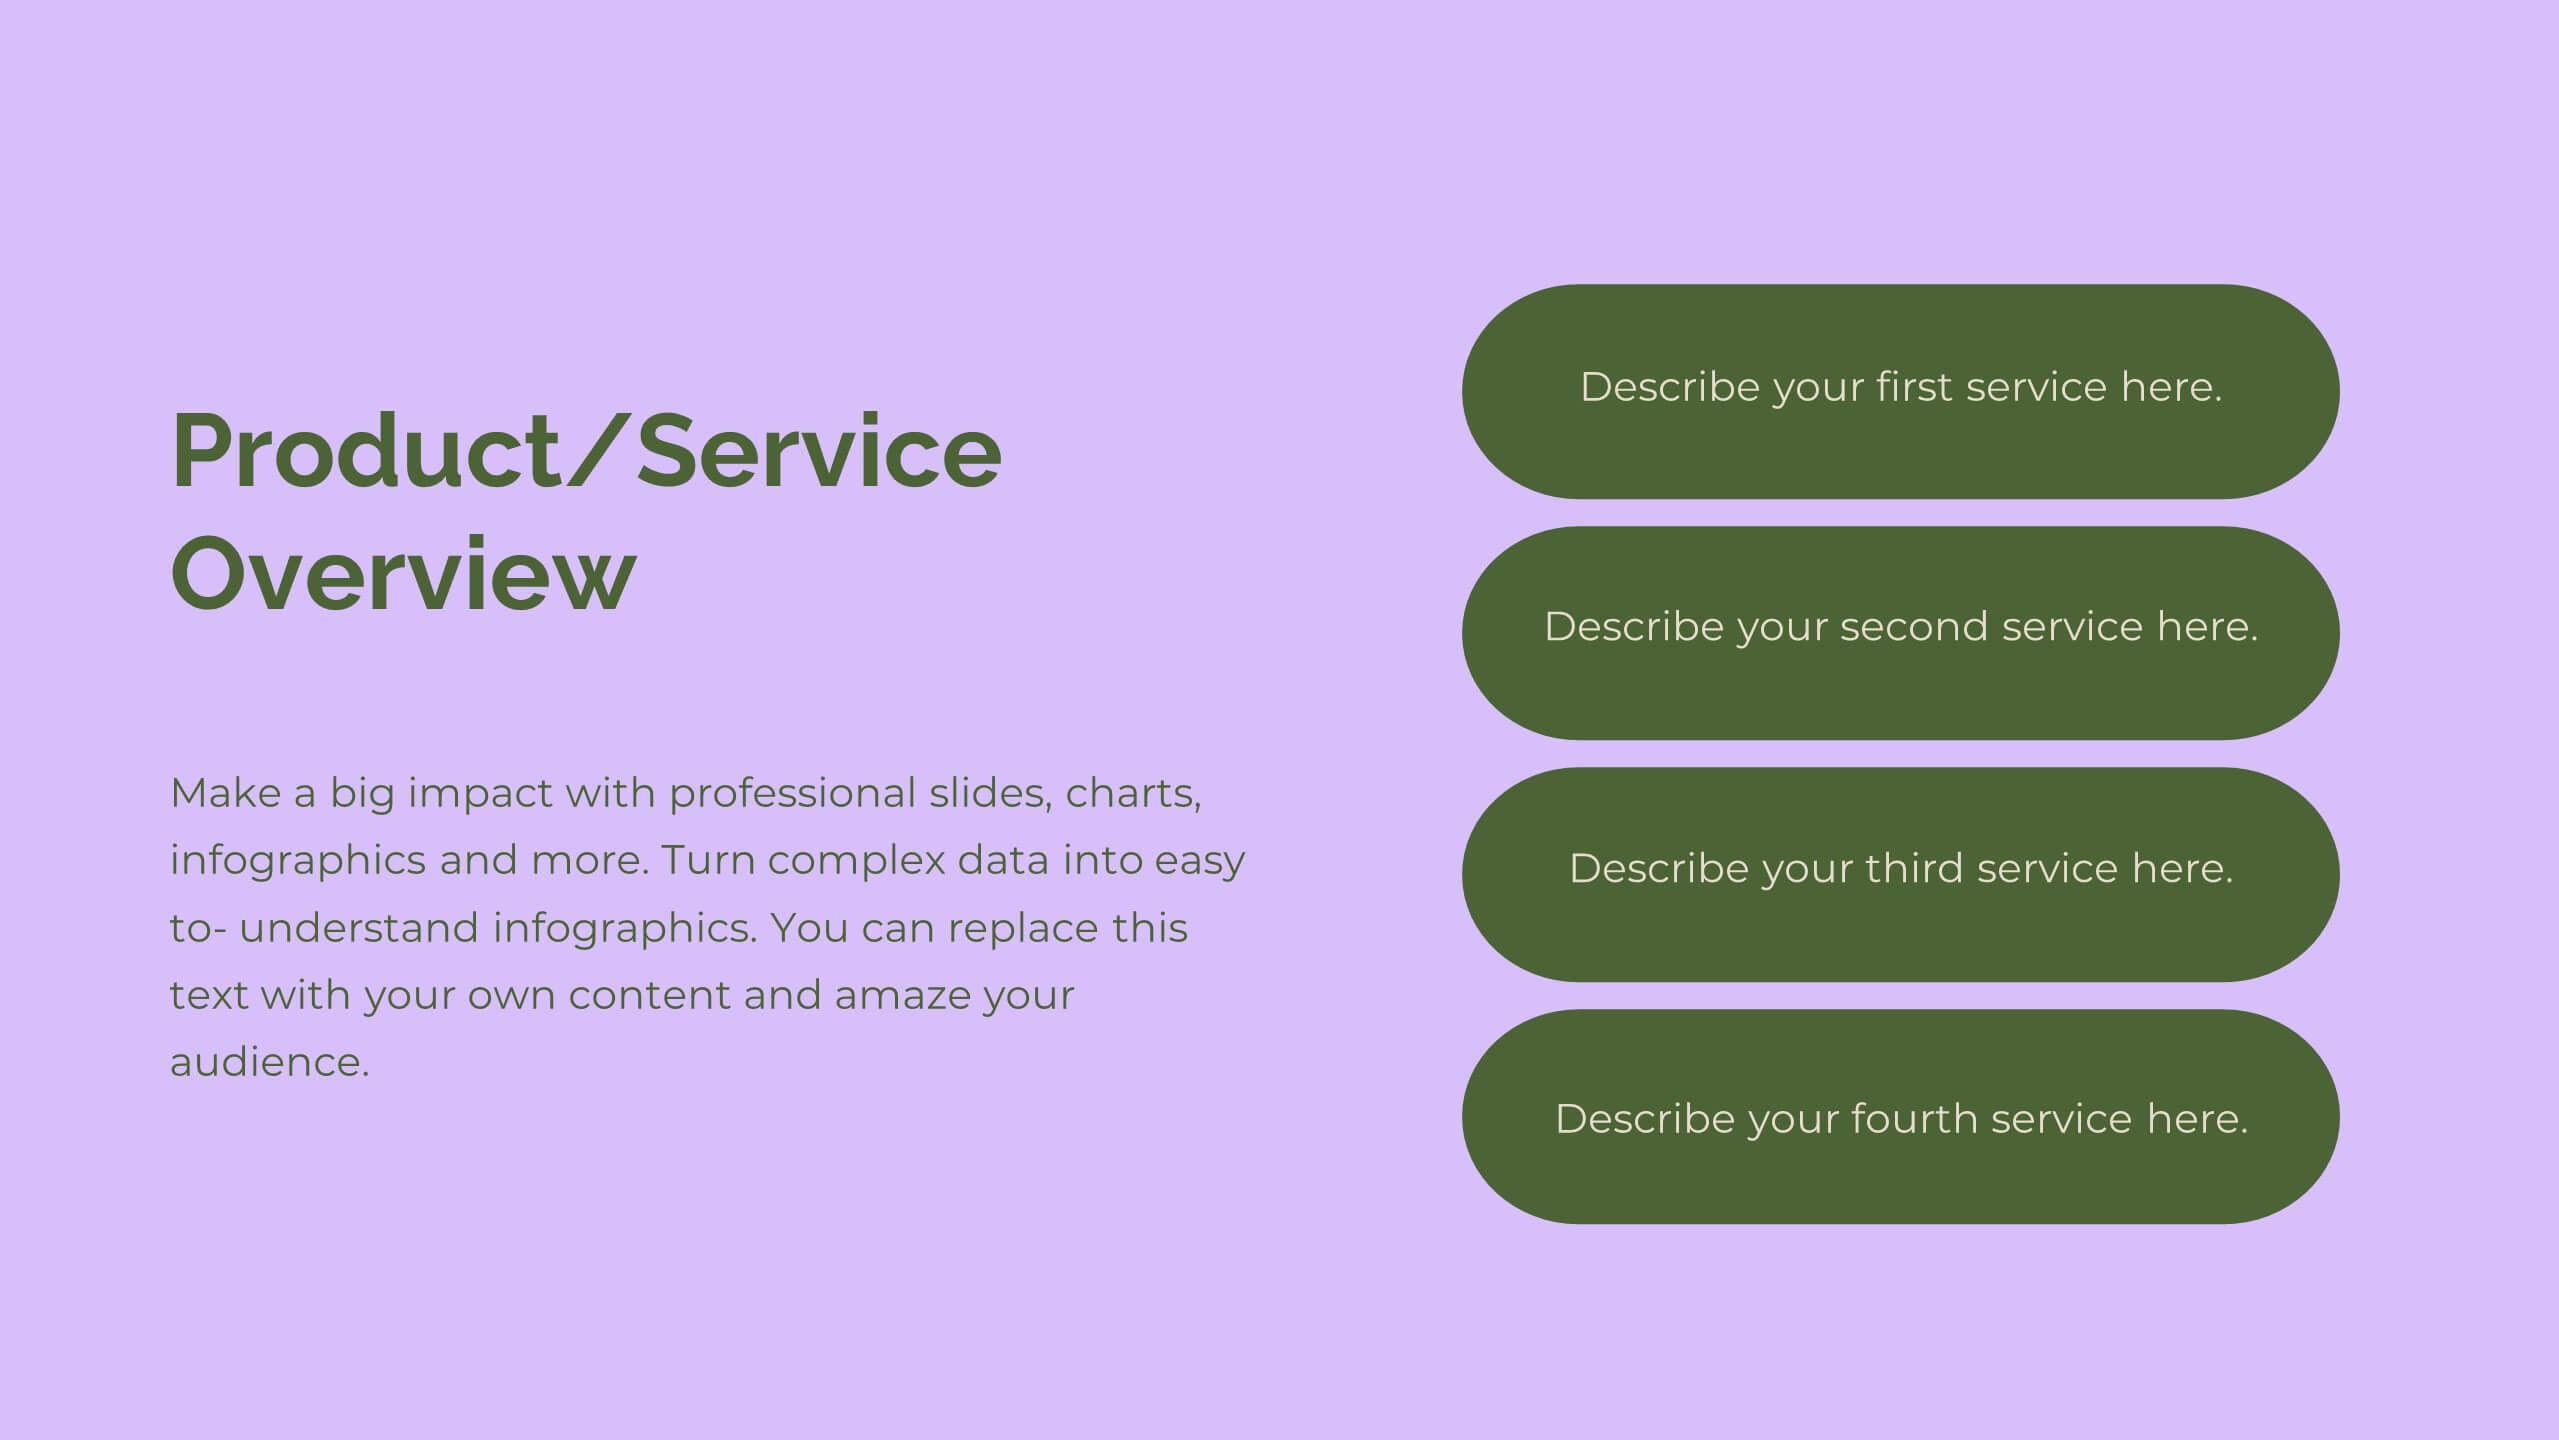
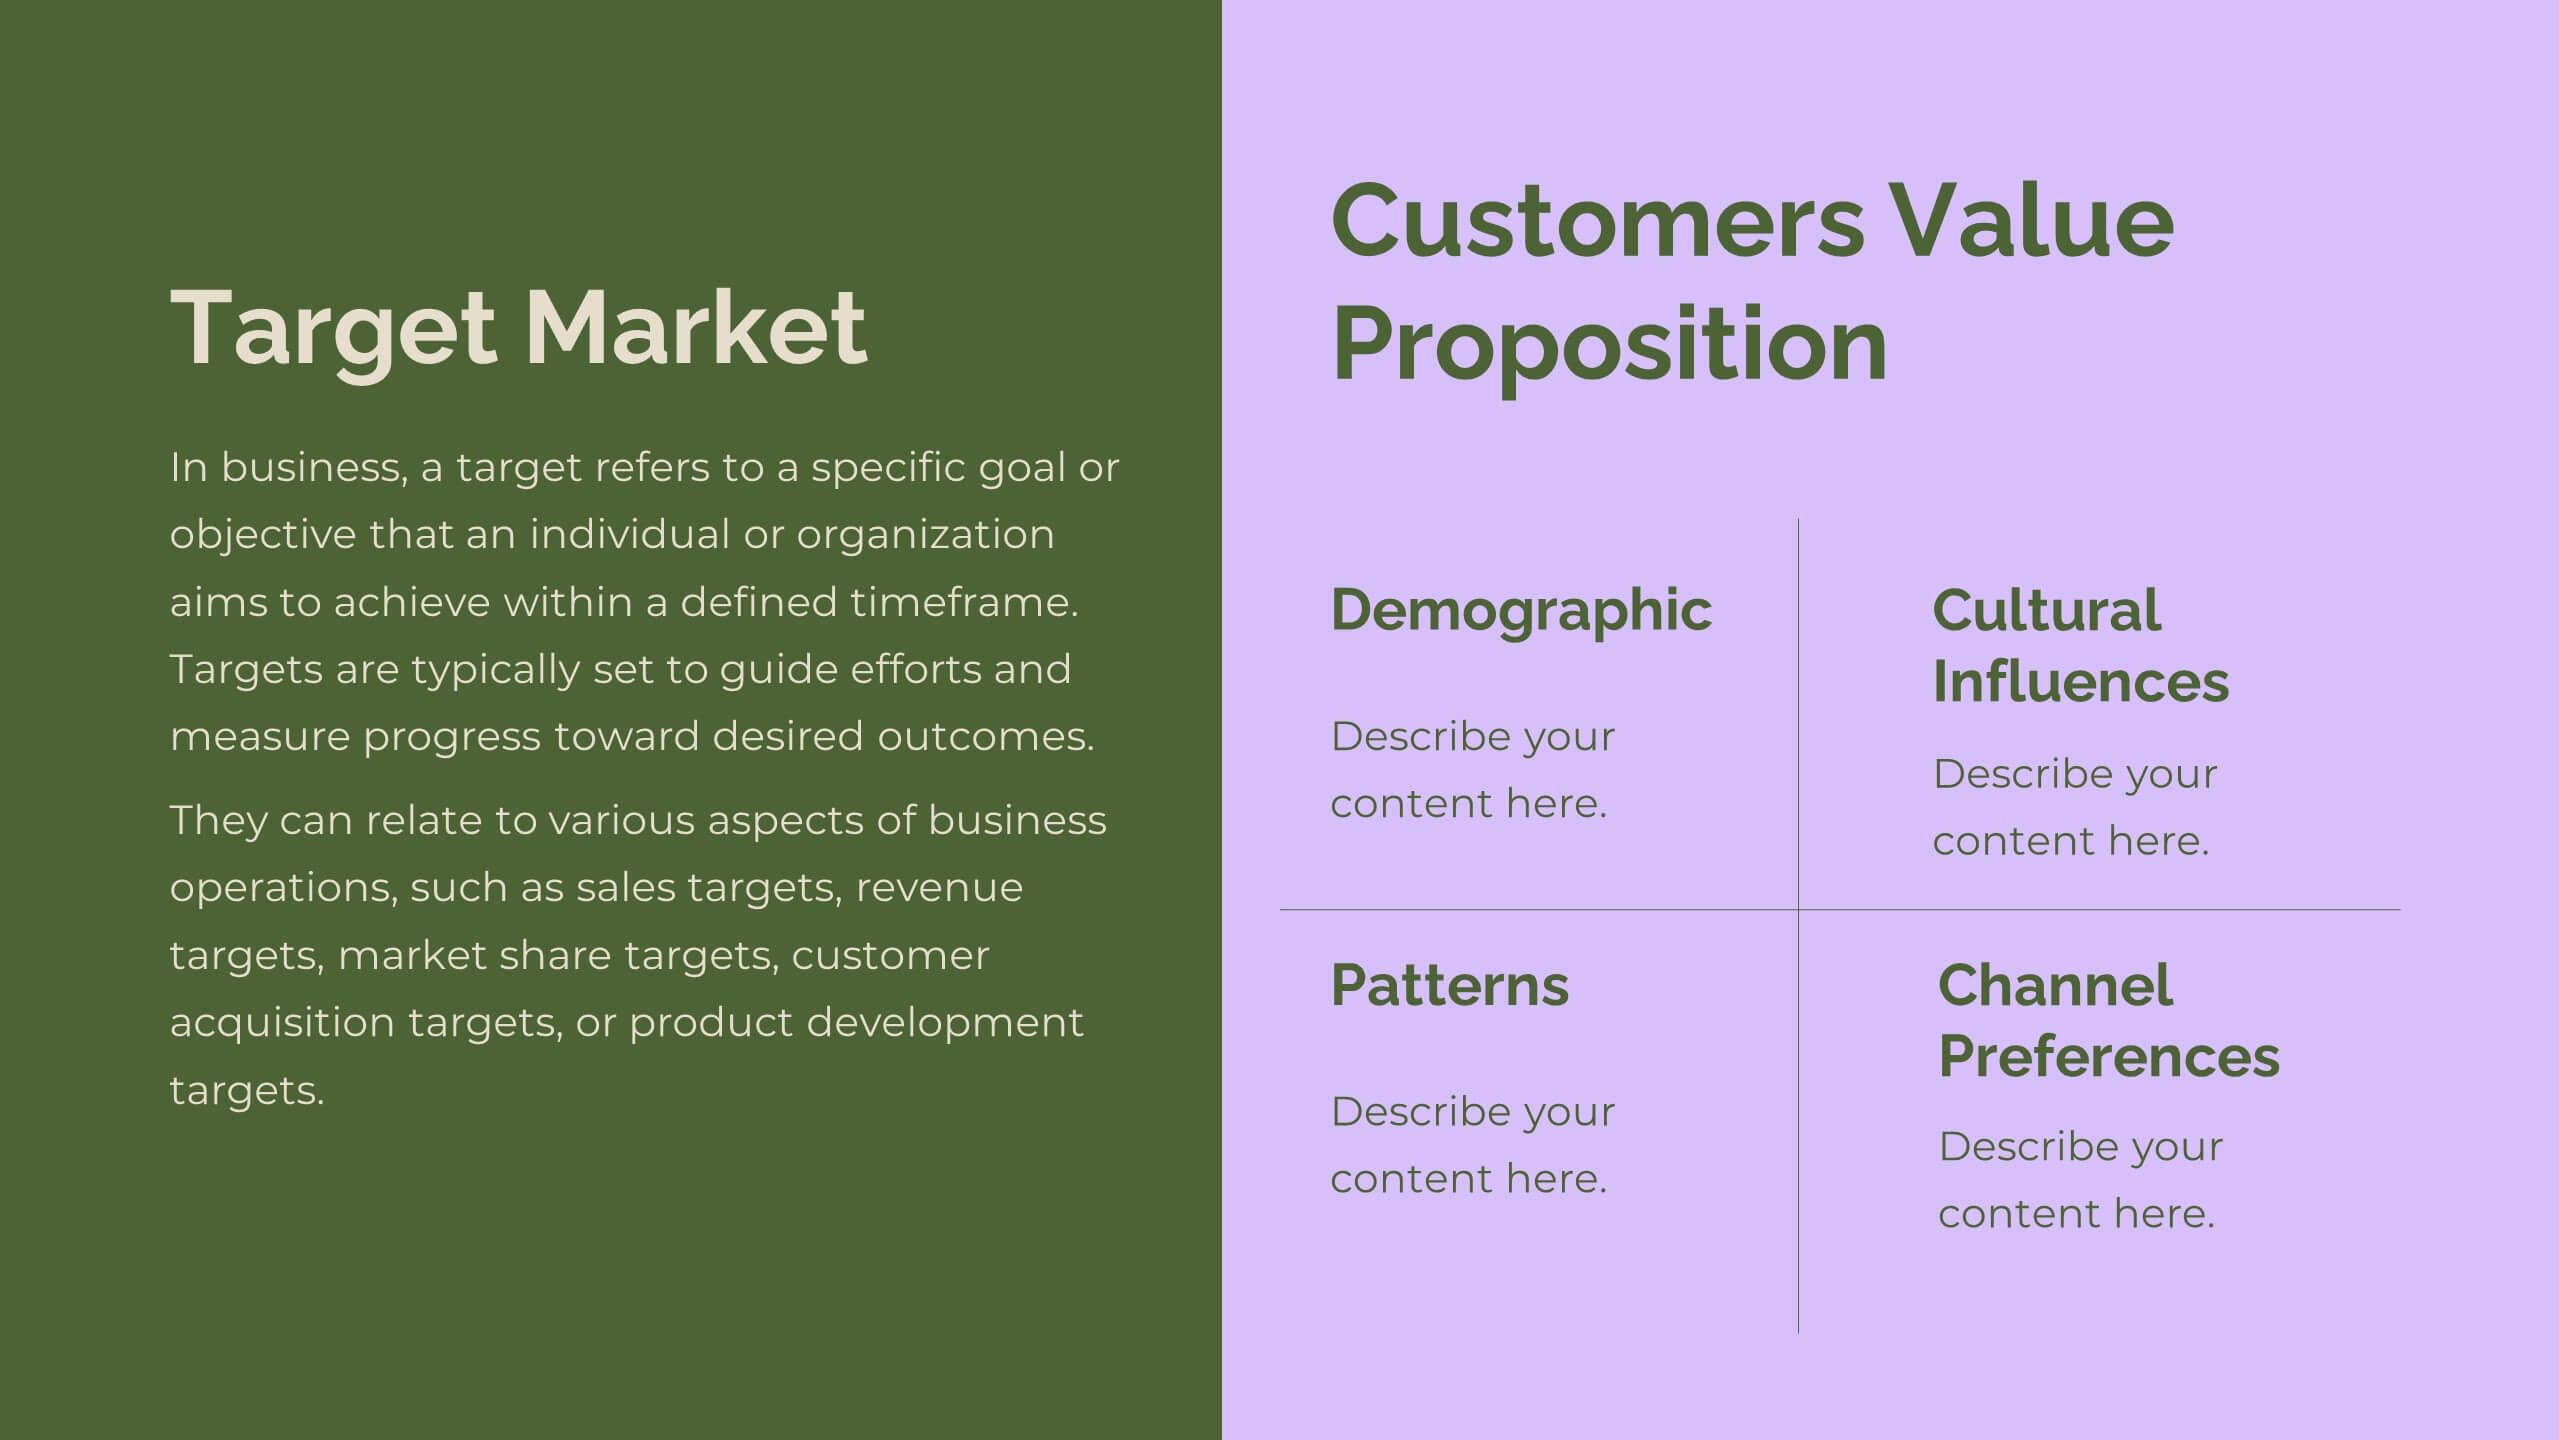
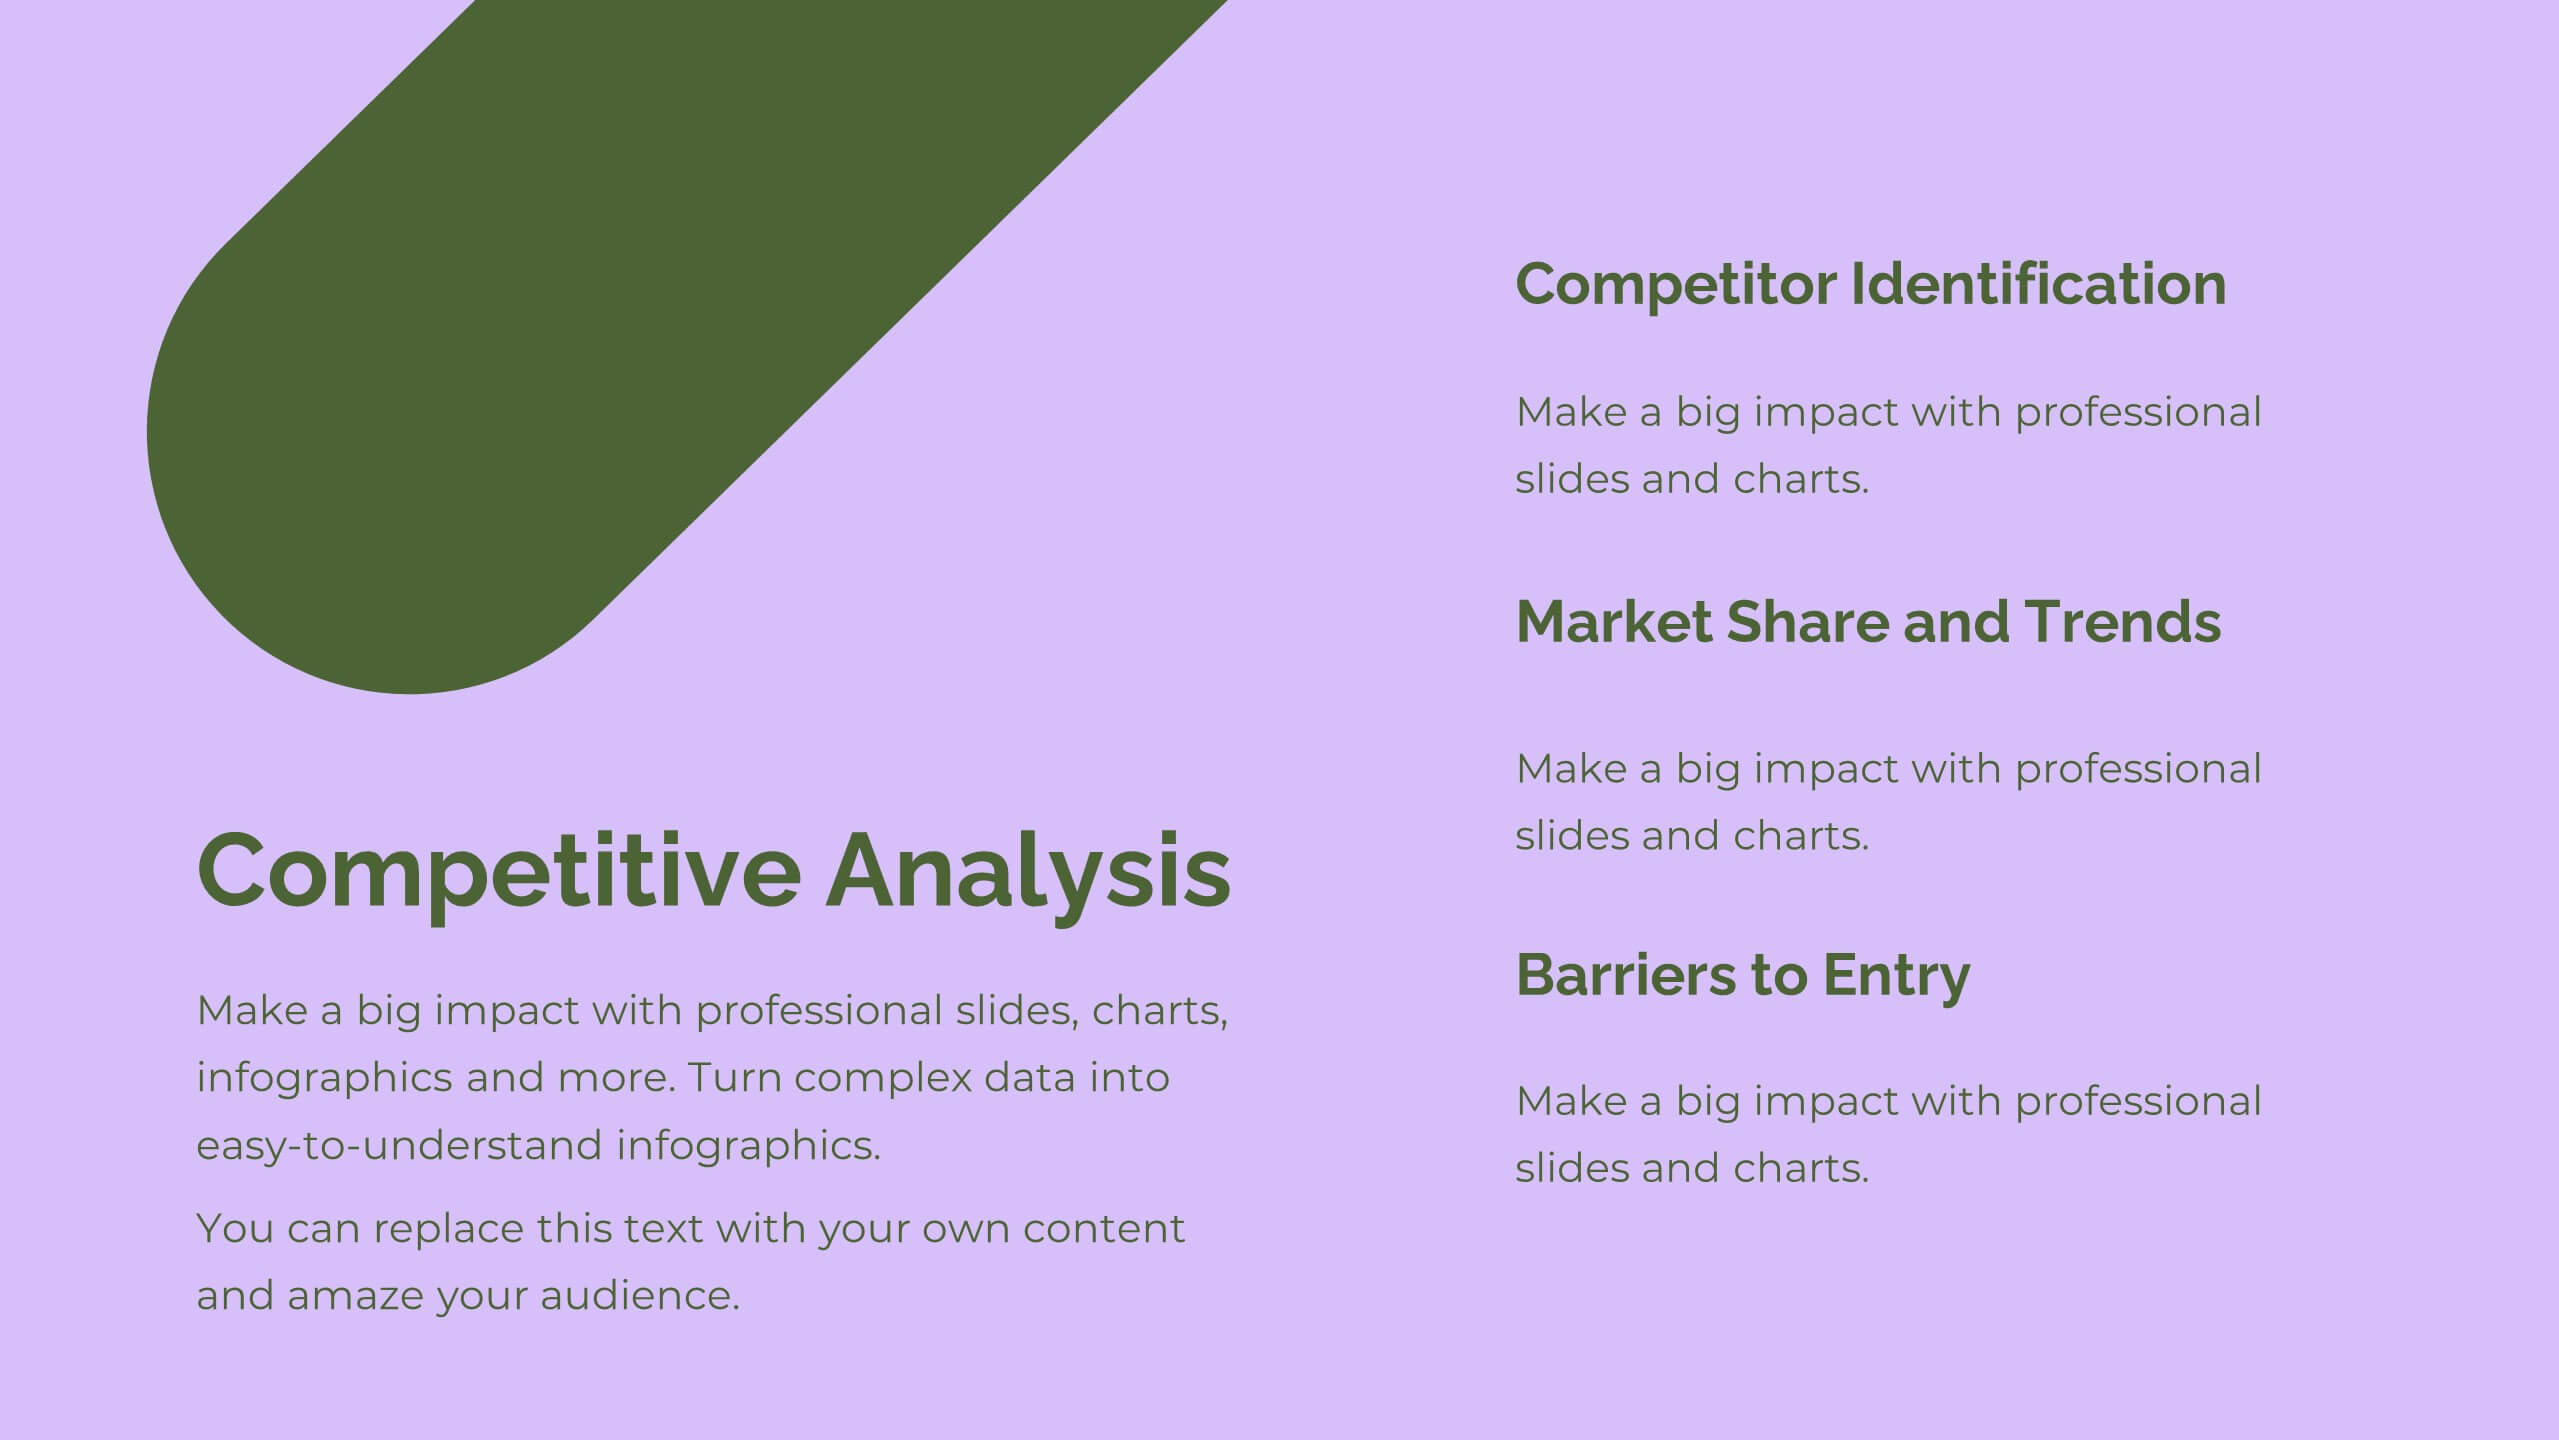
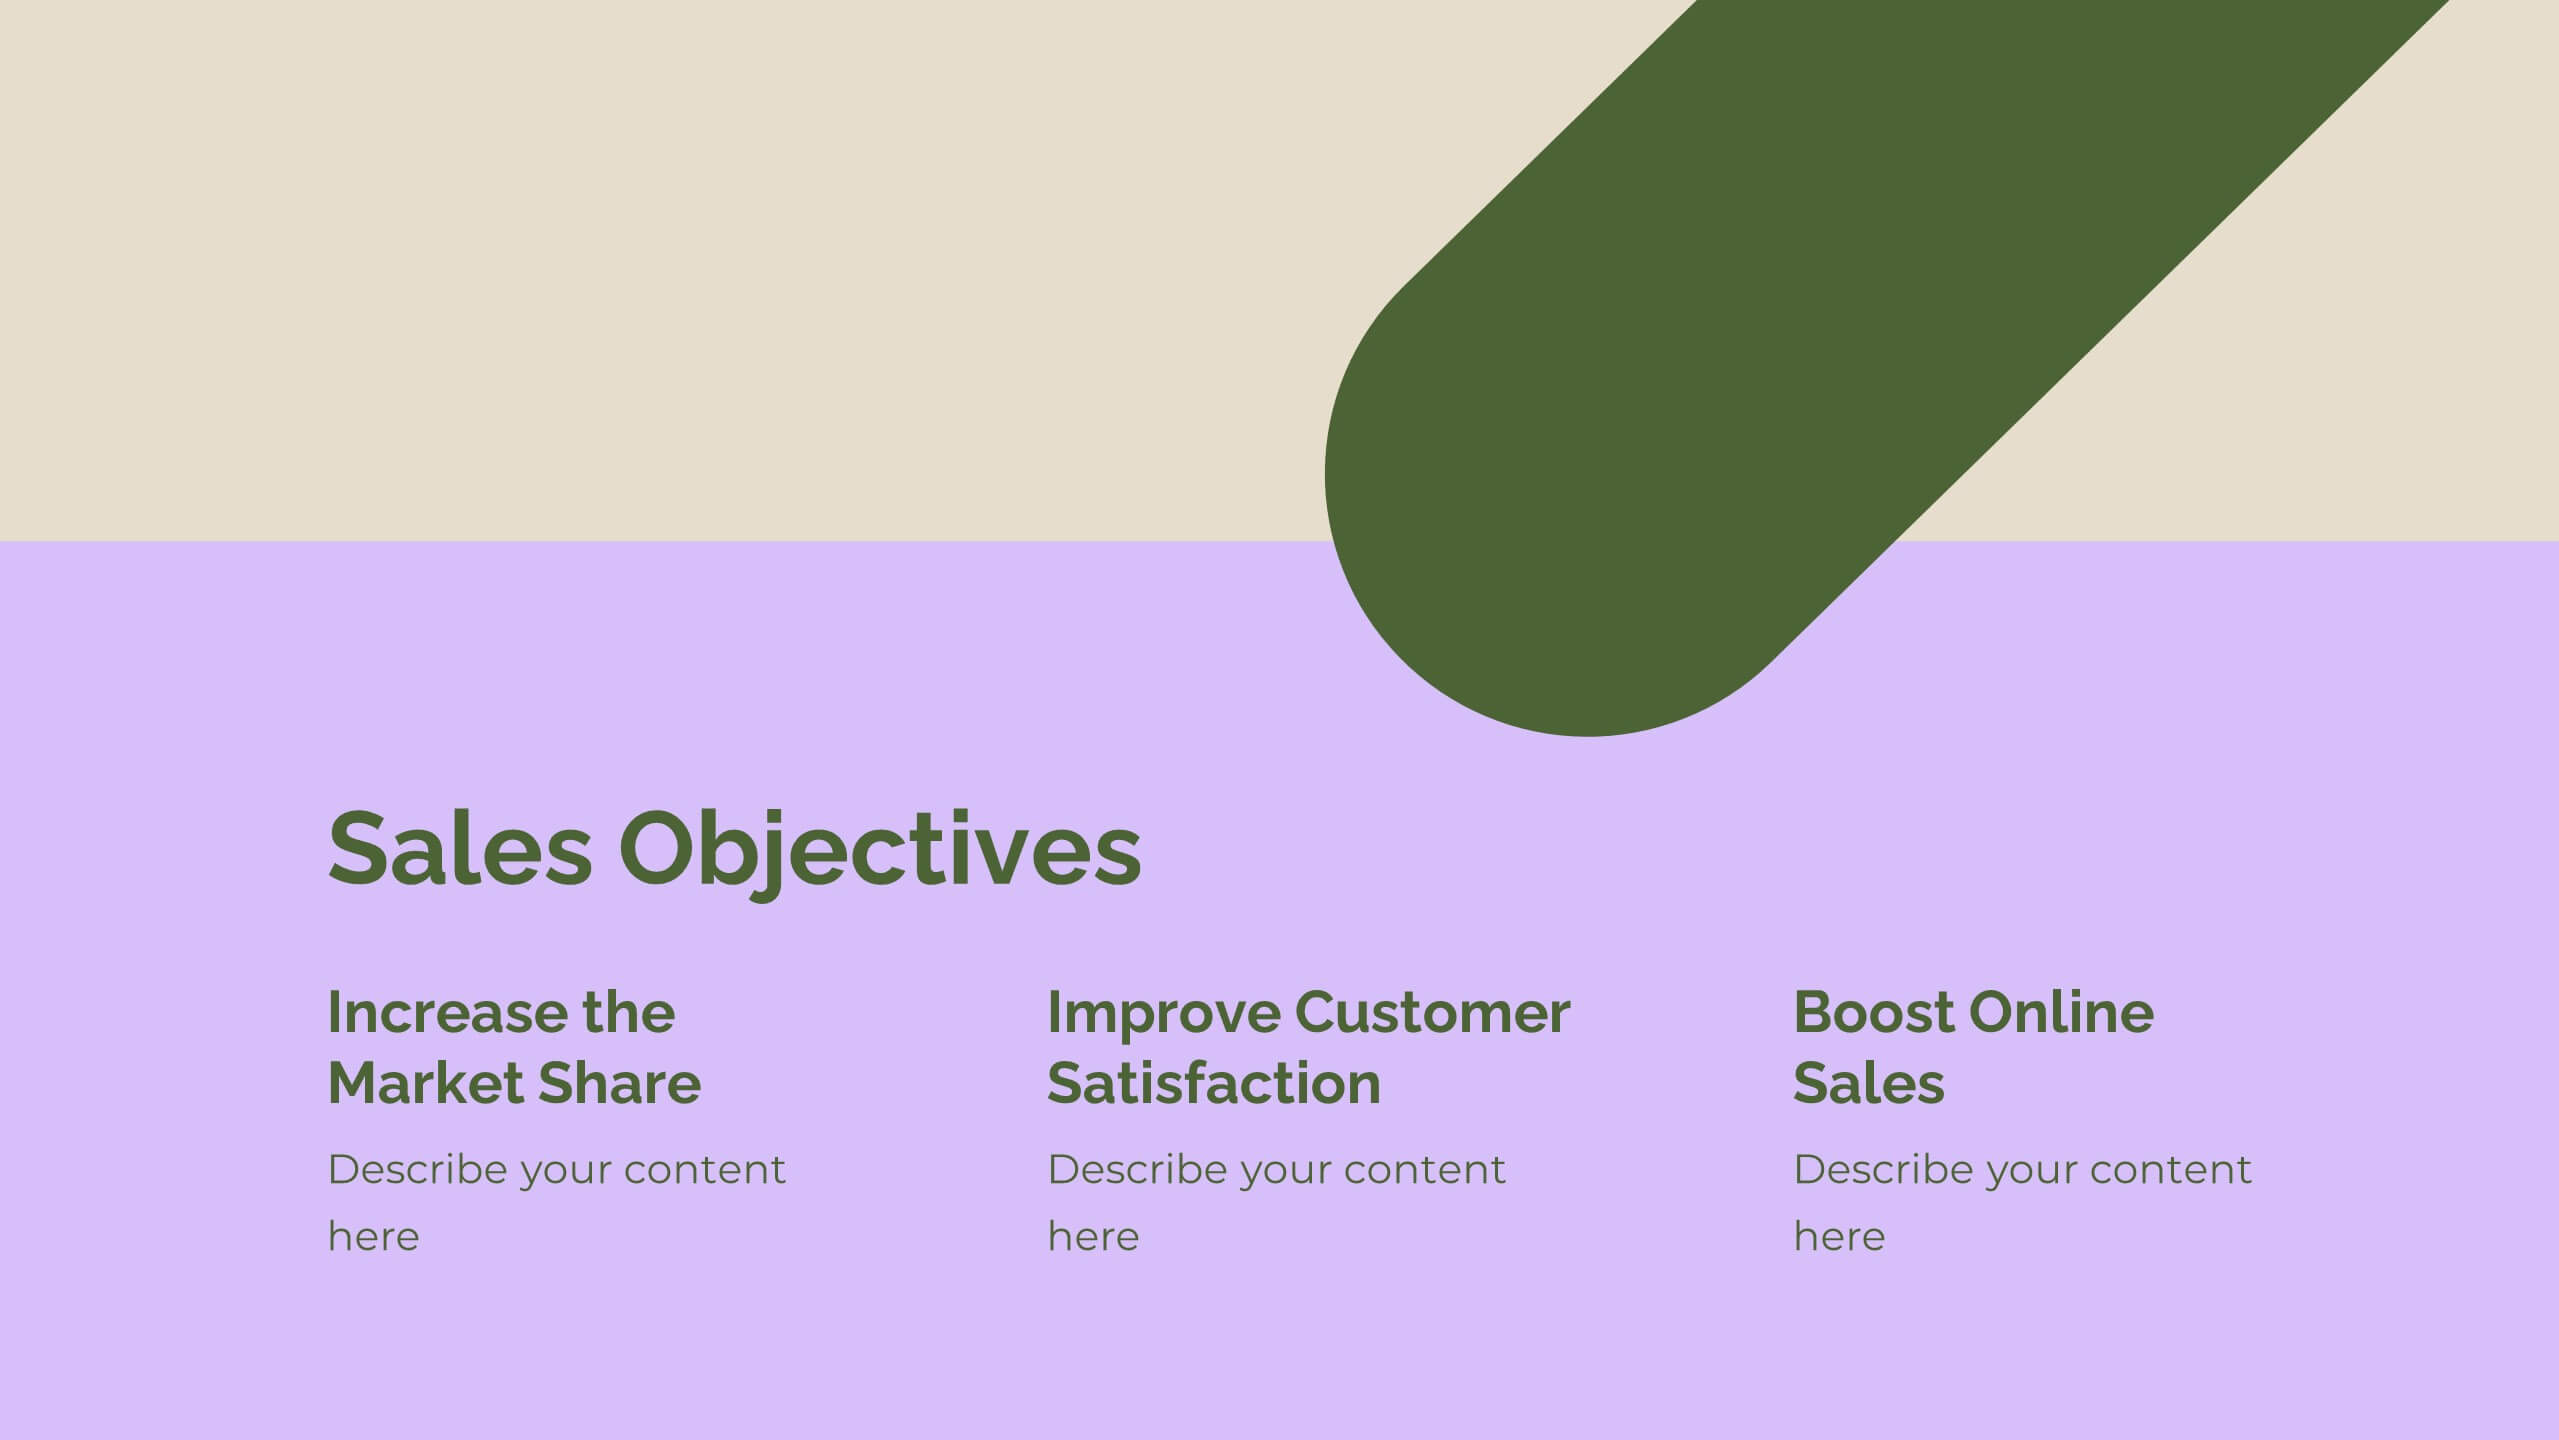
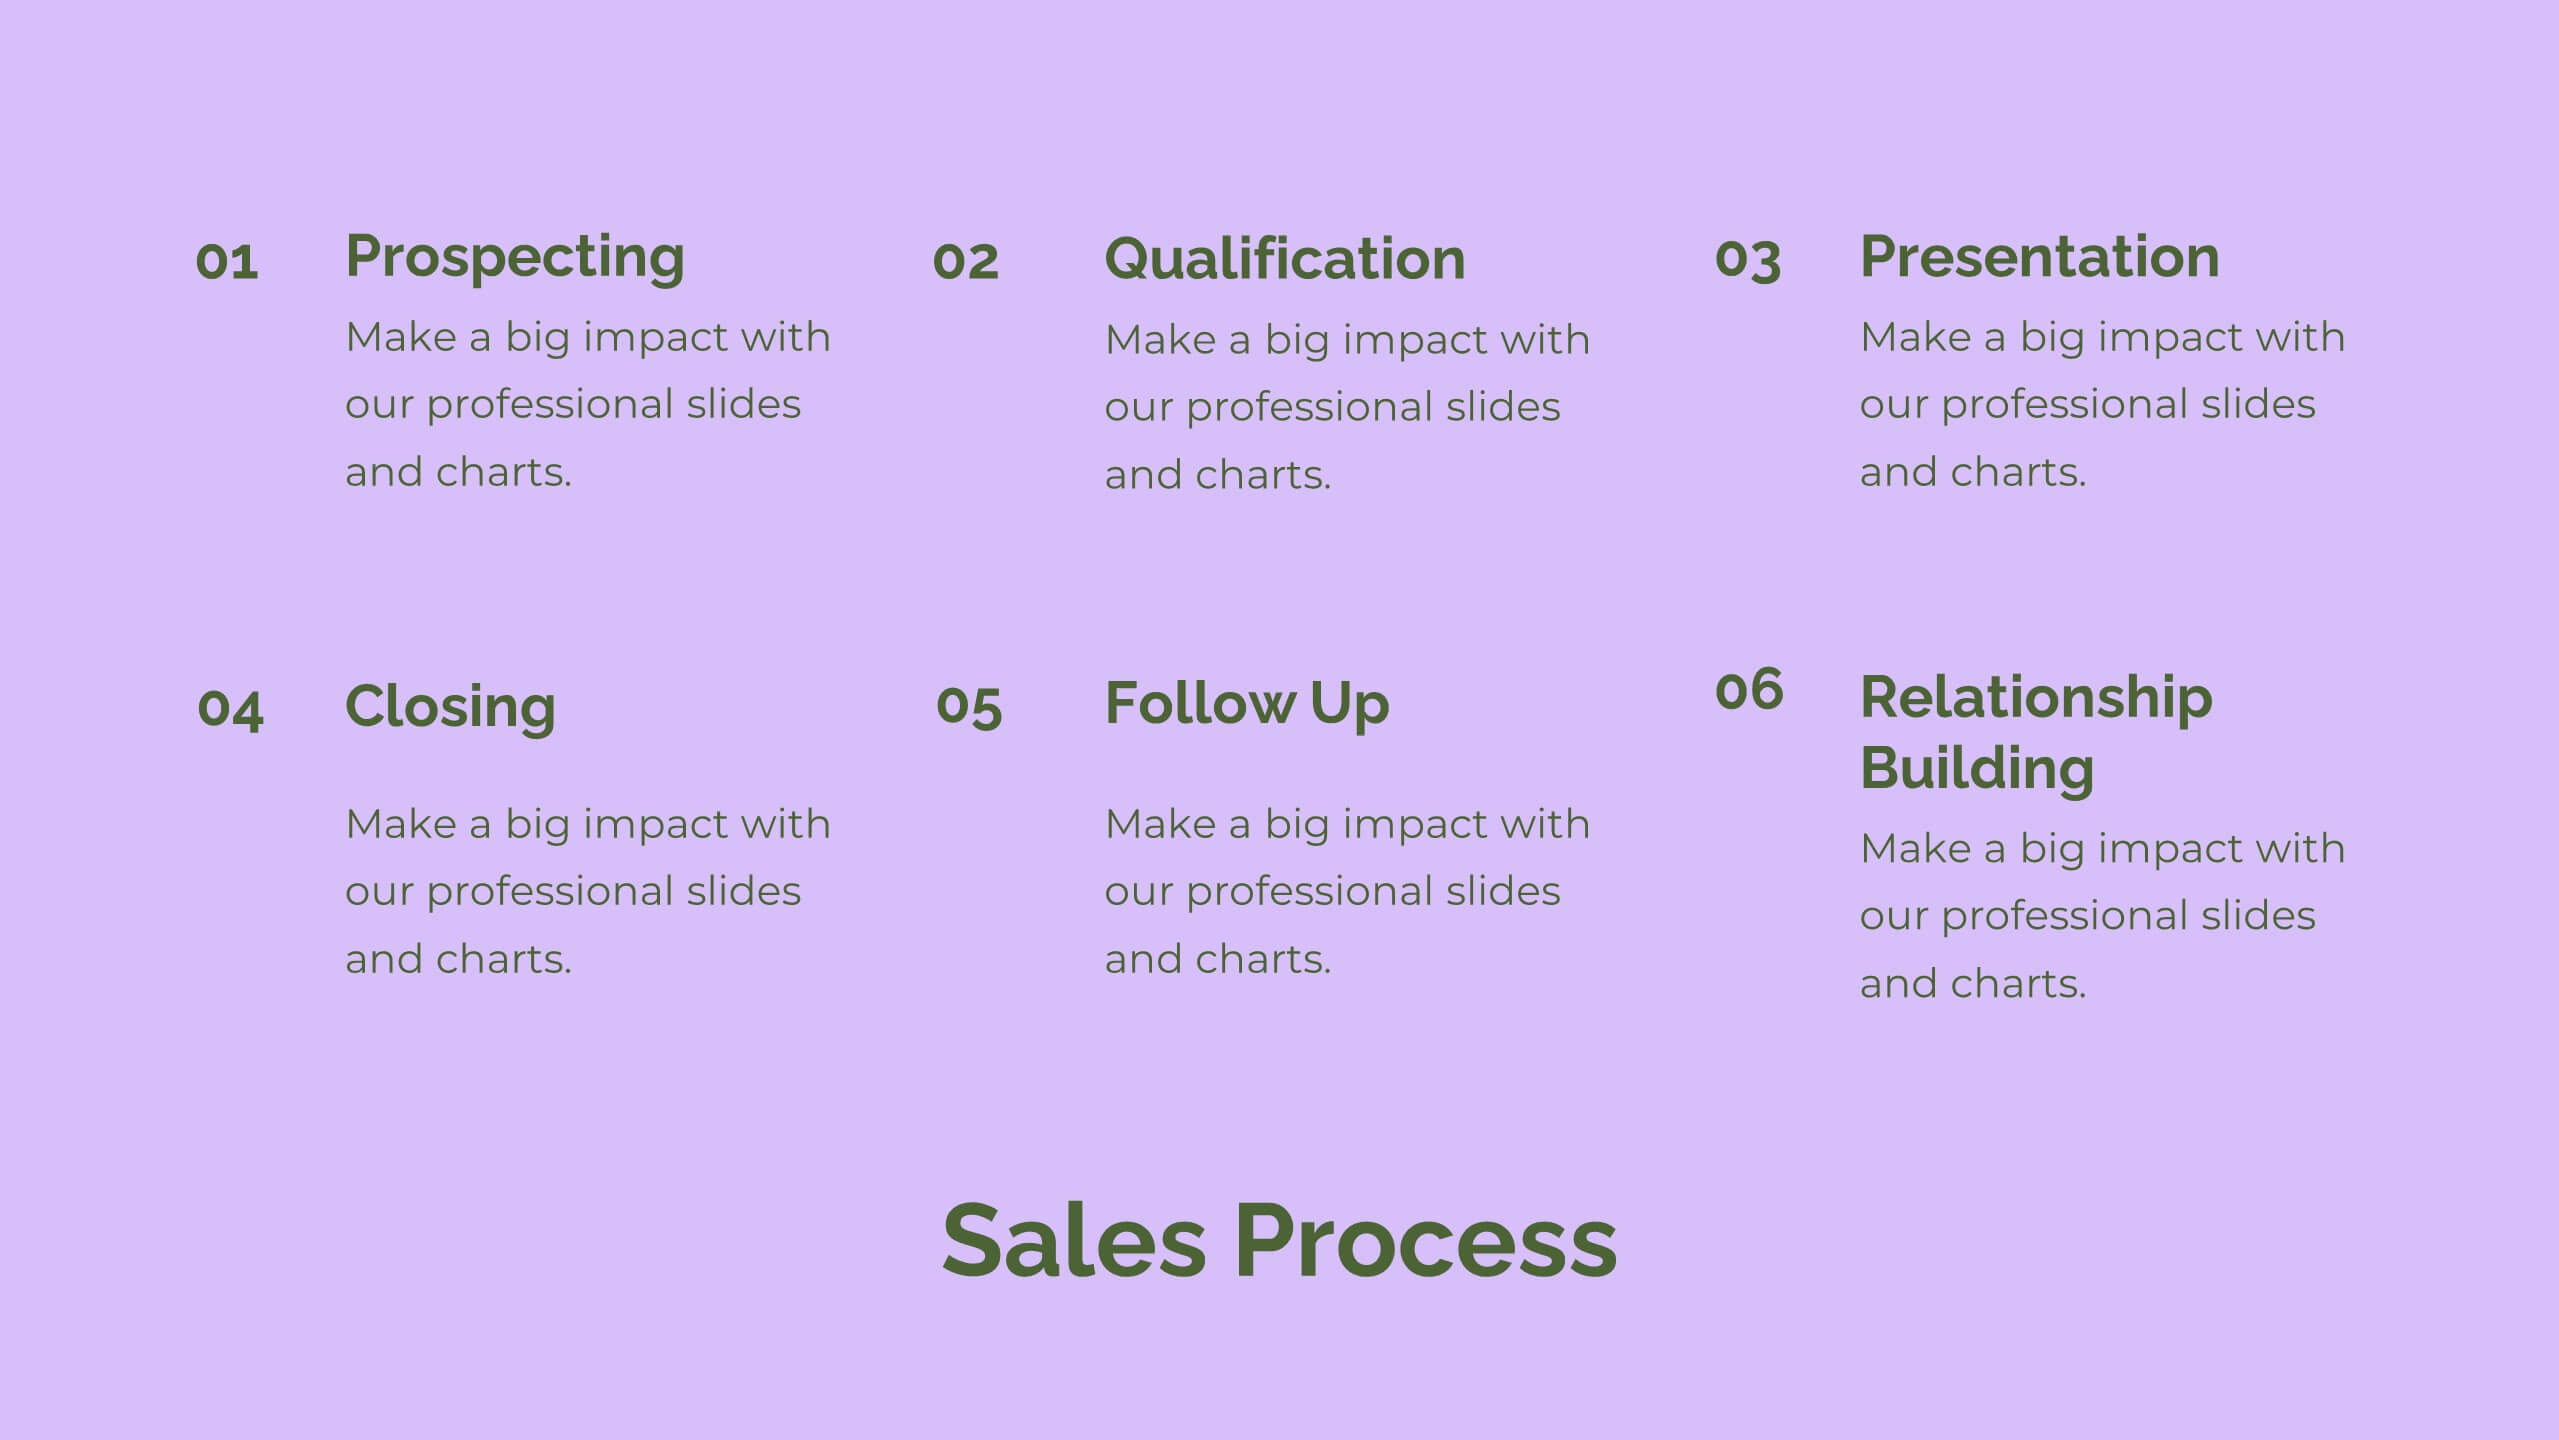
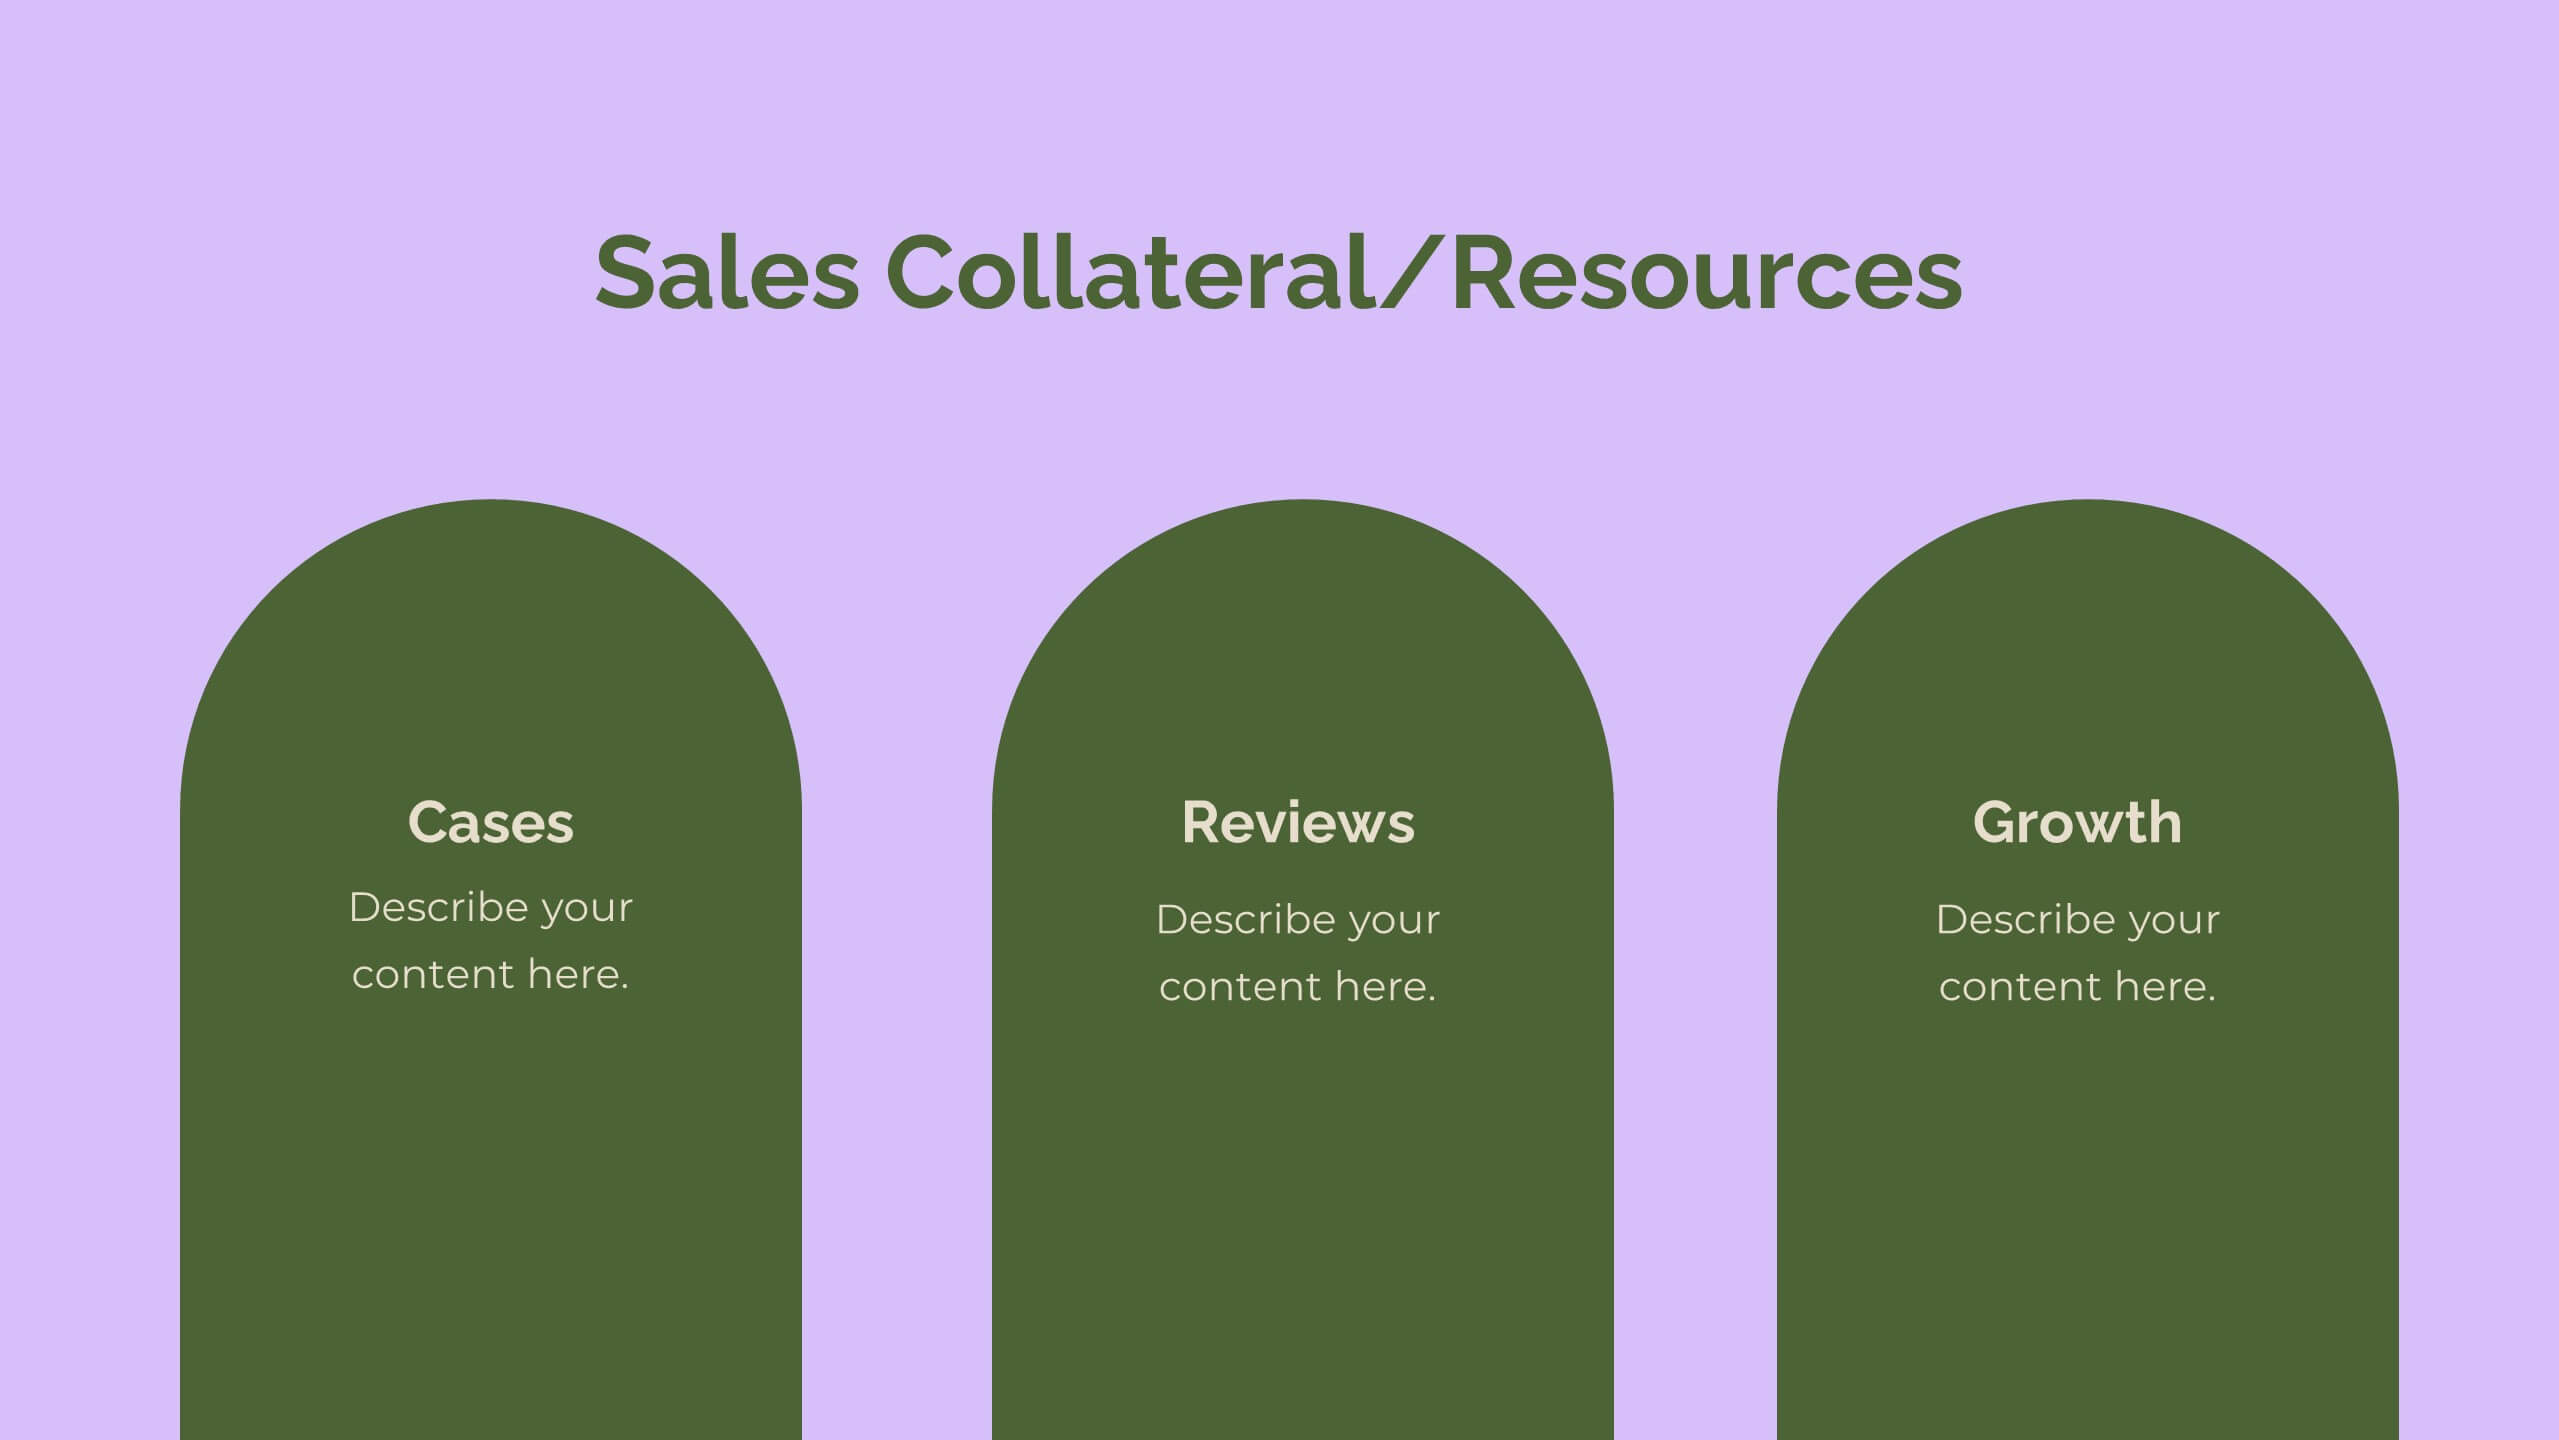
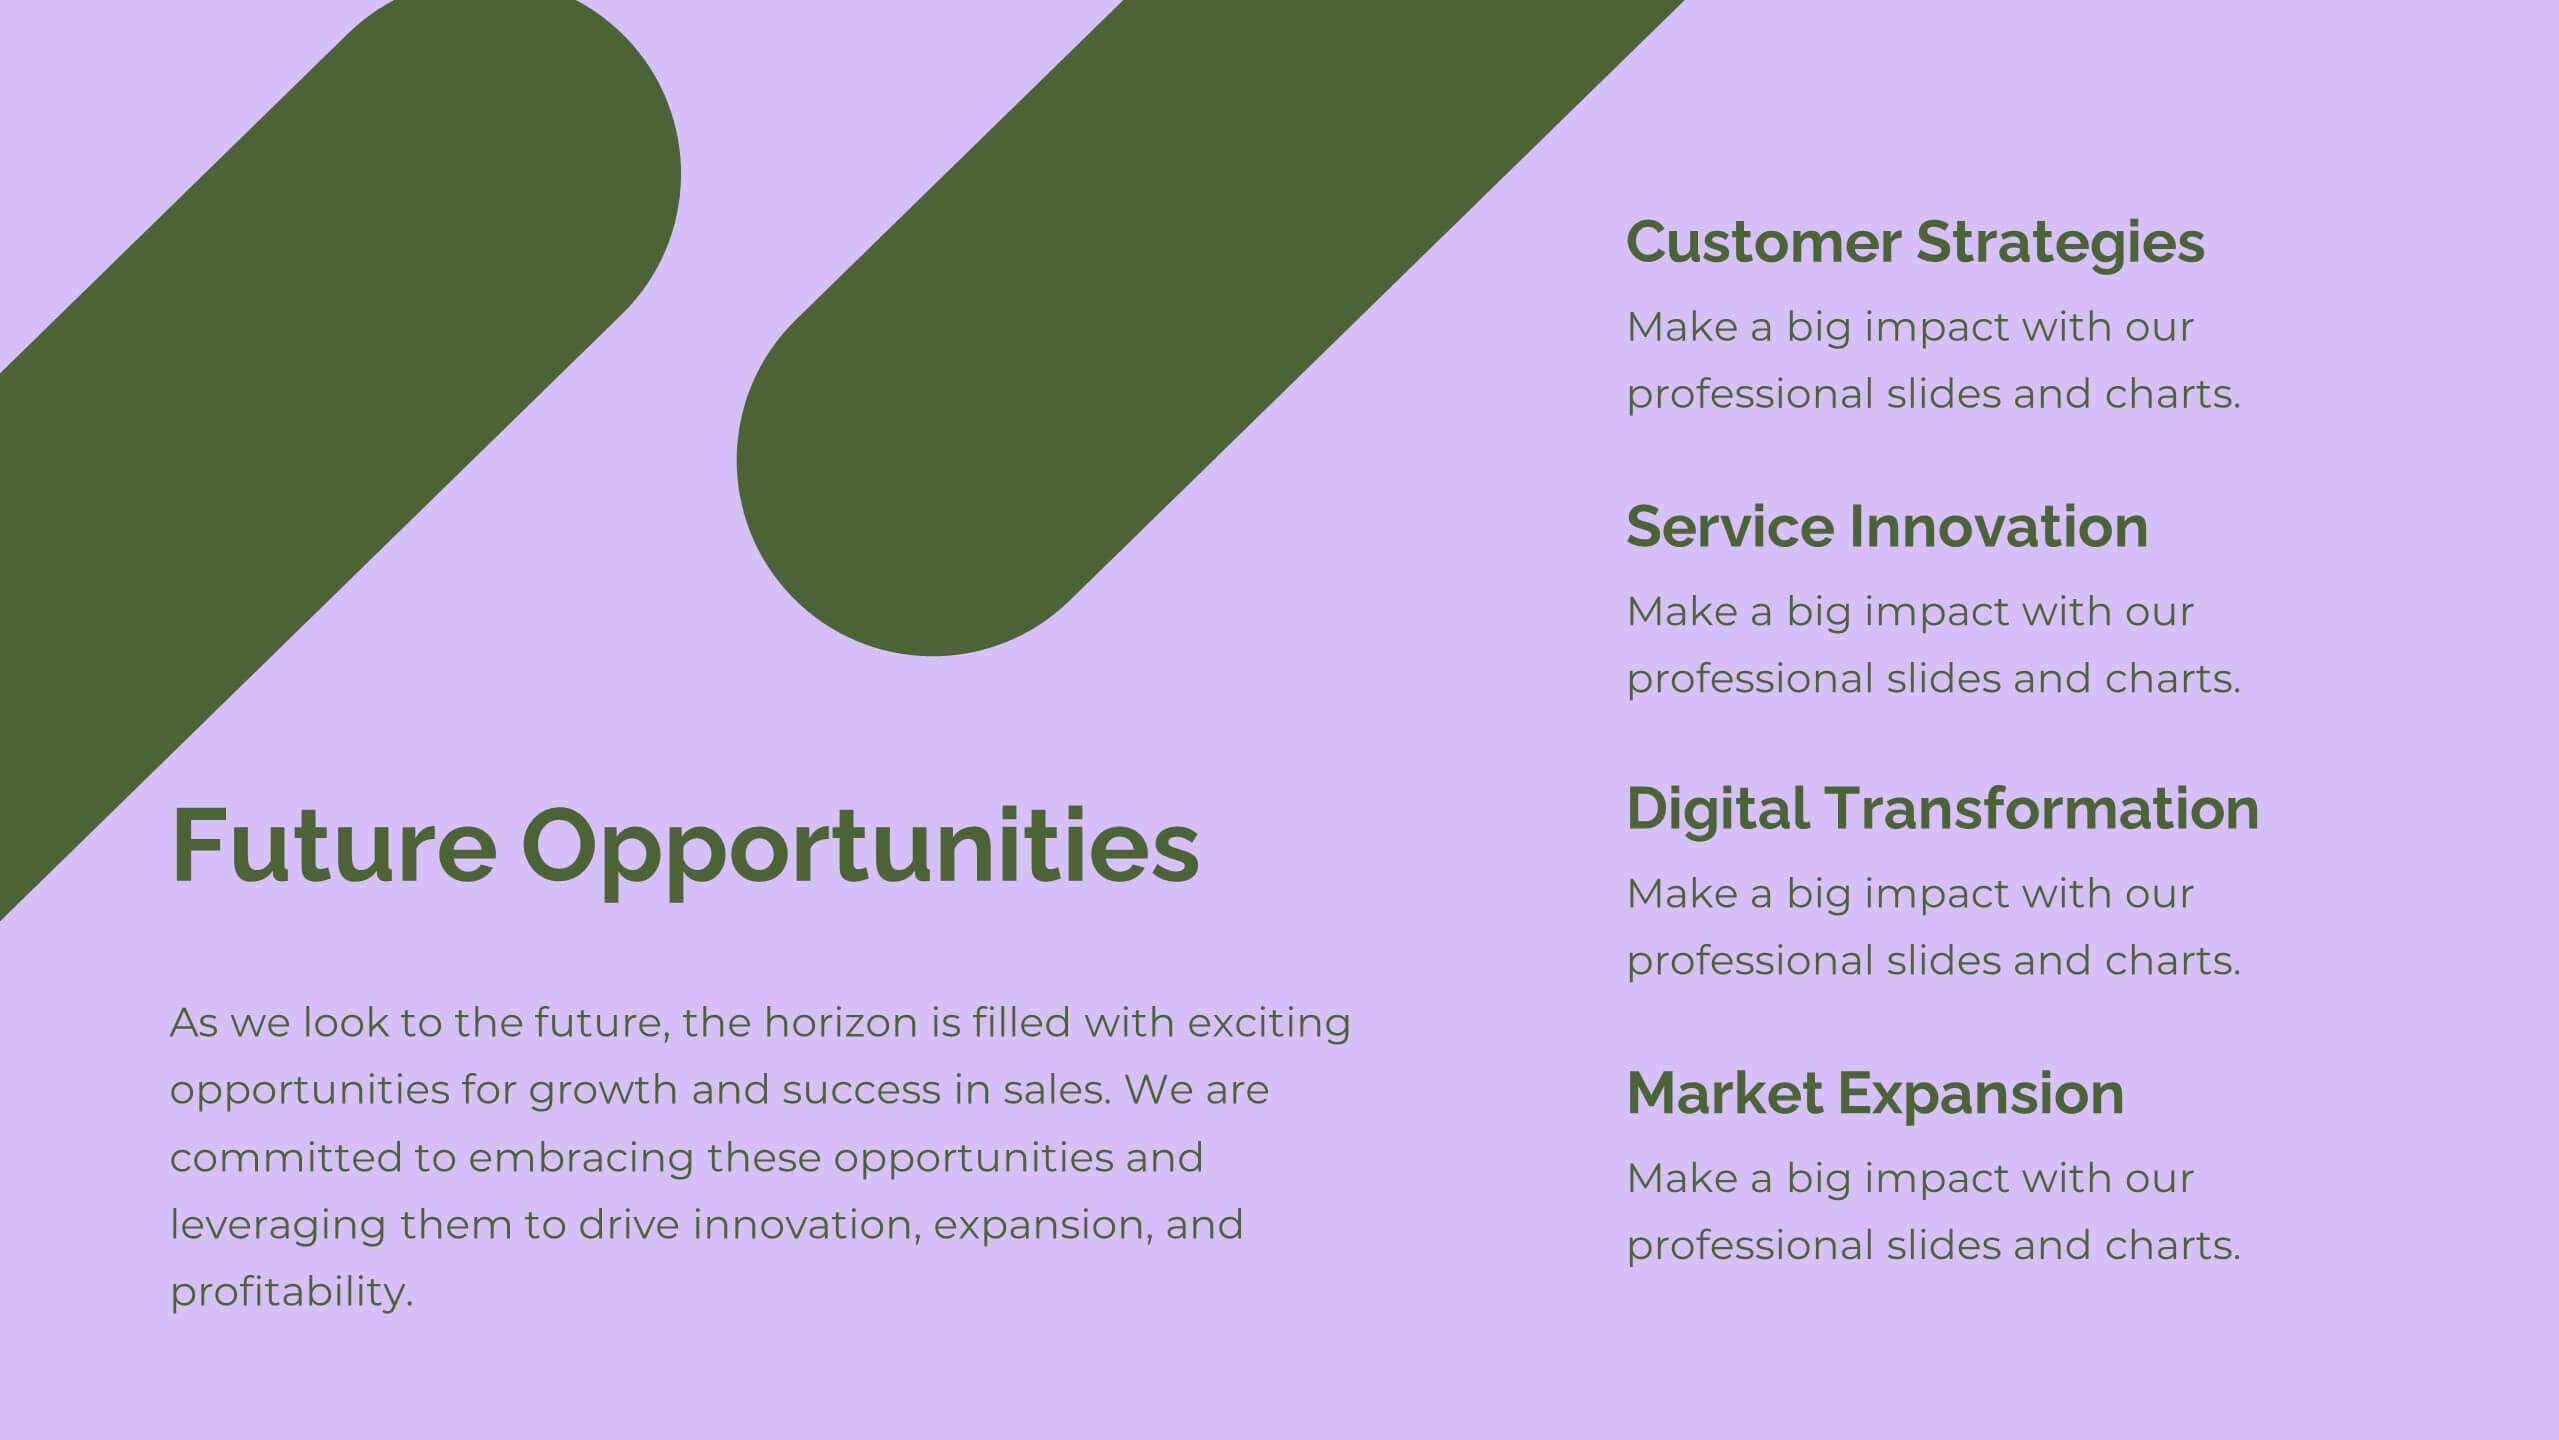
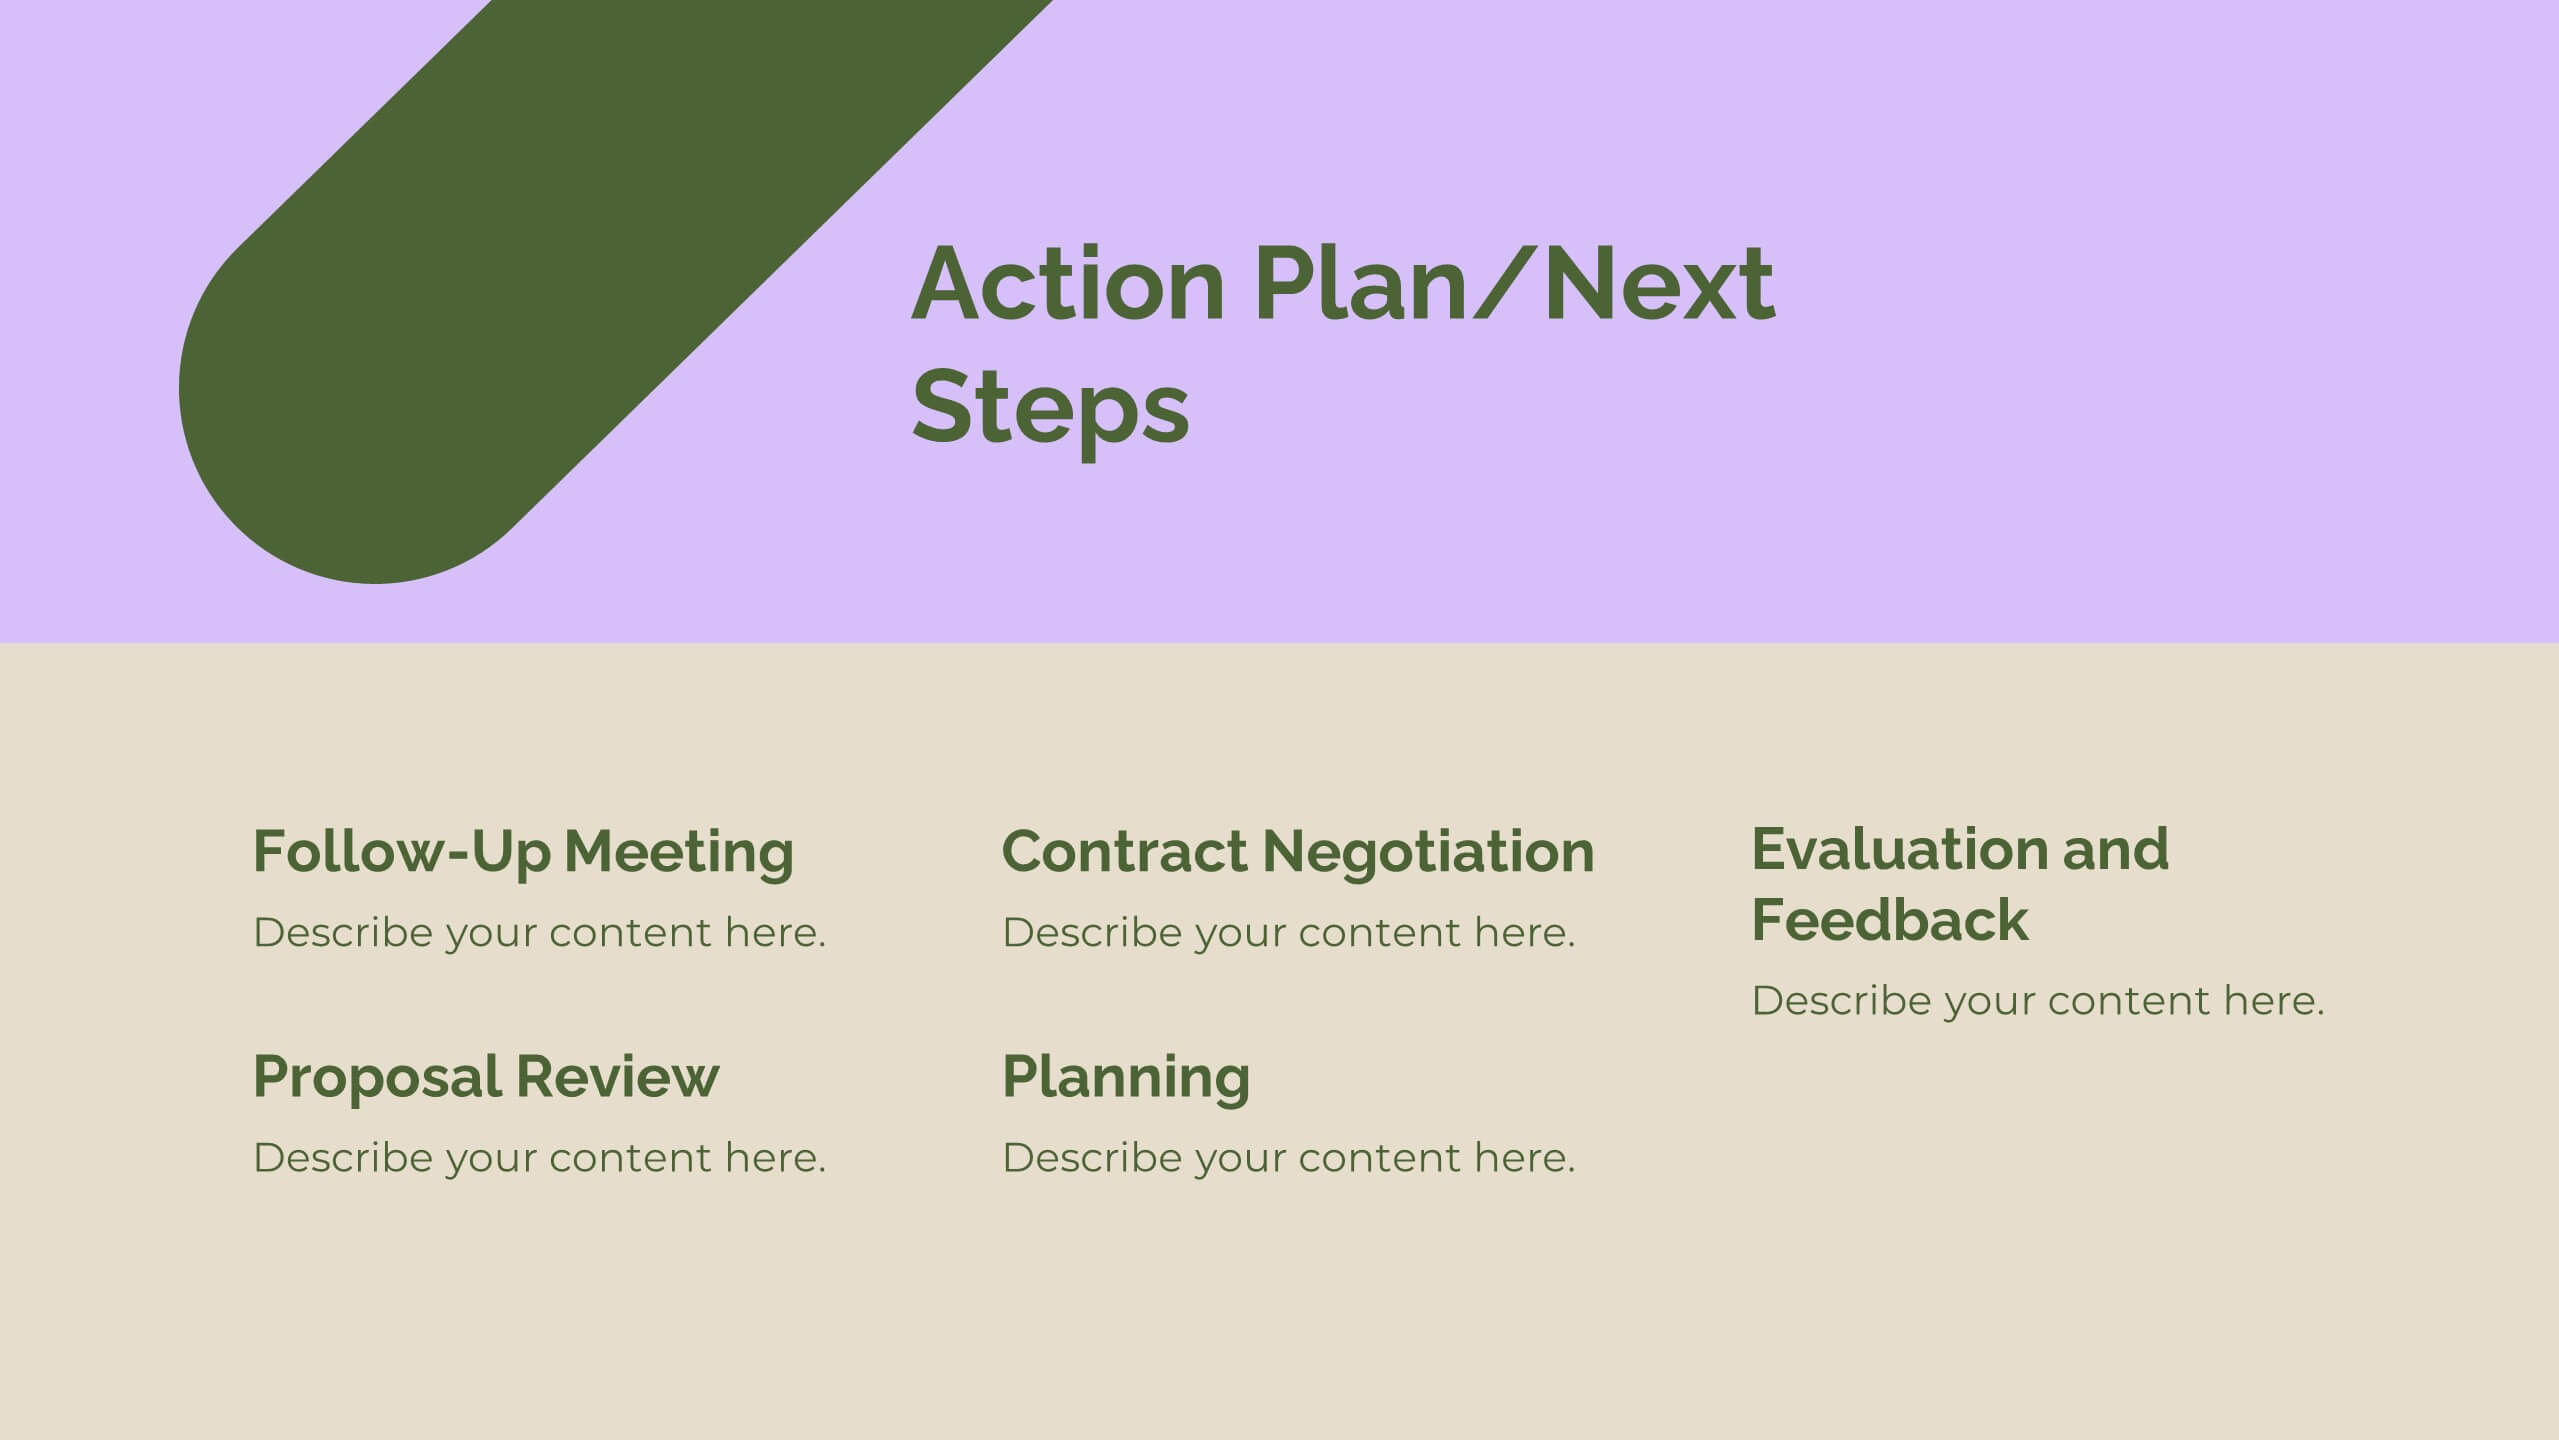
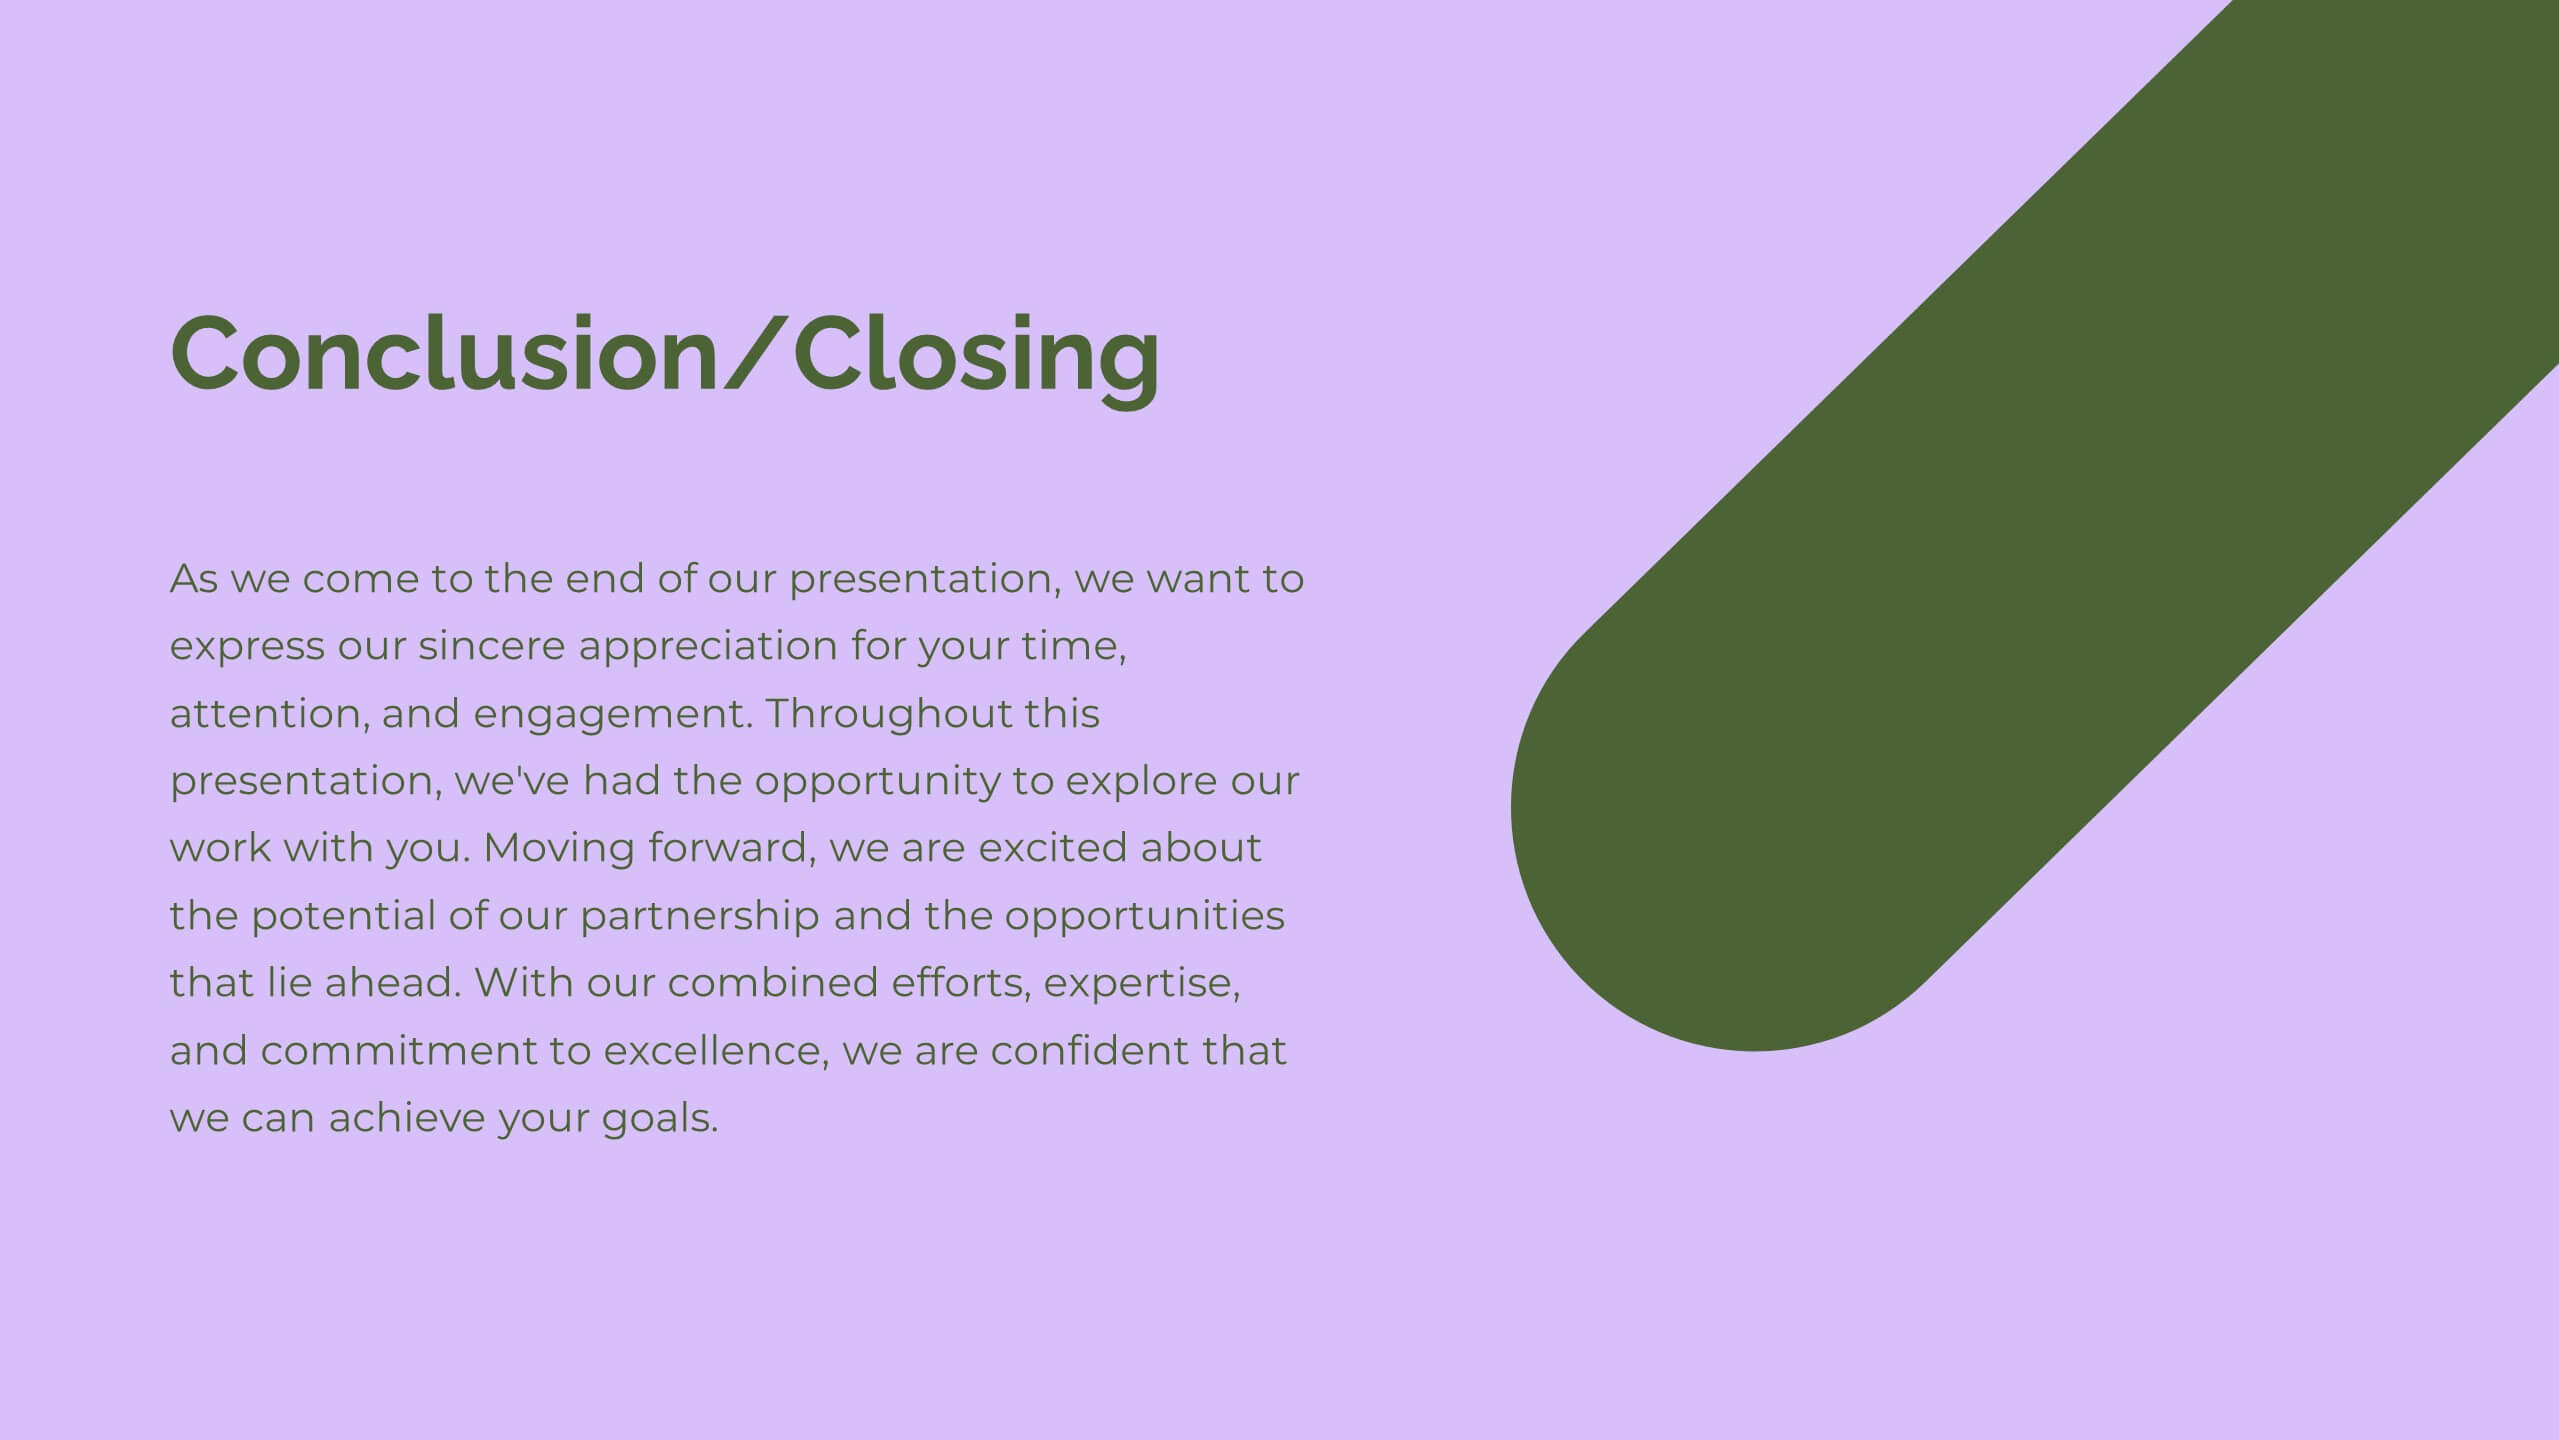
Glint Sales Strategy Presentation
Boost your sales performance with this dynamic sales strategy template! Perfect for presenting your company overview, product details, and competitive analysis, it includes slides for sales objectives, pricing strategy, and performance metrics. Engage your team with vibrant visuals and clear, structured content. Compatible with PowerPoint, Keynote, and Google Slides for seamless presentations on any platform.


7 diapositivas
Matrix System Diagram Infographic
A matrix diagram is a visual representation of data in a matrix format, commonly used to analyze the relationships between two or more sets of items. This infographic template is a valuable tool in various fields including business, project management, quality management, and decision-making processes. Compatible with Powerpoint, Keynote, and Google Slides. This is designed to help you present intricate relationships, structures, and data in a clear and visually engaging way. Whether you're illustrating business strategies, decision matrices, or organizational hierarchies, this template simplifies complexity.


26 diapositivas
Understanding Cryptocurrency Presentation
Step into the future of finance with this engaging presentation on cryptocurrency. Covering key topics like blockchain technology, digital wallets, market trends, and security best practices, this template helps simplify complex concepts for any audience. Fully customizable and compatible with PowerPoint, Keynote, and Google Slides for a seamless and informative presentation experience.


7 diapositivas
Milestones Credit Card Infographic Presentation
A Milestones Infographic is a visual representation of significant events, accomplishments, or achievements in a project, business, or individual's life. This template include timelines, graphs, diagrams, and other visual elements to help convey important information. You can use this infographic to cover many different topics, including project management, business growth, personal achievements, or company history. This template is useful for businesses or individuals who want to showcase their accomplishments, highlight important dates or events, or just share progress updates.