


Características


¿Tienes alguna pregunta?
Recomendar


26 diapositivas
Arana Presentation Template
Arana is a minimal and stylish template to create stunning presentations. This template is perfect for training your business staff or team on how to use various services or products. It's easy to use, resulting in high quality presentations that look great to your clients or customers. Its slide designs can be used with each other to make more elaborate presentations complete with charts, images and text boxes. Arana simple yet stylish design makes it easy for anyone to use. With the large amount of information included, your presentation will look lighter, appealing, and easy to understand.


7 diapositivas
Data Analysis Research Infographic
A Data Analysis Research infographic is a visual representation of the key findings of a research study that used data analysis techniques. The purpose of this template is to provide a clear summary of the research study's most important results, making it easier for your viewers to understand and interpret the findings. This infographic include visualizations such as charts, graphs, icons, and tables that present key data points in a visually compelling way. This template is designed to highlight differences between groups or subgroups, or show how various factors are related to one another.


10 diapositivas
Creative Thinking and Innovation
Inspire fresh perspectives and spark ideas with this Creative Thinking and Innovation presentation. Designed around a dynamic lightbulb concept, it features five clearly numbered stages for visualizing brainstorming, concept development, and strategic creativity. Perfect for workshops, ideation sessions, or innovation planning. Fully editable in PowerPoint, Keynote, and Google Slides.


12 diapositivas
Sales Metrics Dashboard Presentation
Unlock a sharper view of your sales story with a clean, data-driven layout that highlights performance trends at a glance. This presentation organizes KPIs, charts, and progress indicators into an easy-to-follow dashboard that supports smarter decision-making. Fully compatible with PowerPoint, Keynote, and Google Slides.


3 diapositivas
Linear Business Process Flow Presentation
Give your workflow a smooth, streamlined story with a layout that makes every step feel clear and intentional. This presentation outlines processes in a clean, linear format ideal for planning, operations, or strategy mapping. Fully compatible with PowerPoint, Keynote, and Google Slides.


6 diapositivas
Demographic Trends and Audience Breakdown Presentation
Visualize key audience segments and population trends with this modern demographic breakdown slide. Featuring a clean circular chart layout, it's perfect for showcasing age, gender, location, or behavioral data. Ideal for marketing, branding, or user research reports, it turns complex demographics into clear, impactful insights for strategic planning and targeting.


7 diapositivas
Brain Structure Infographic
Unlock the marvels of the human mind with our brain structure infographic. Resting on a pristine white canvas and enriched by the calming green, profound blue, and enlightening yellow, this template meticulously dissects the intricacies of brain anatomy. Adorned with detailed infographics, illustrative icons, and specific image placeholders, it dives deep into the regions and functions of the brain. Impeccably tailored for Powerpoint, Keynote, or Google Slides. An indispensable resource for neuroscientists, educators, medical students, or anyone with an intrigue for cerebral wonders. Venture with insight; let each slide be your guide through the labyrinth of the human brain.


5 diapositivas
User Experience Customer Path Map
Visualize the full customer journey with the User Experience Customer Path Map Presentation. This engaging slide illustrates five key touchpoints in the user experience cycle using a connected flow design with bold icons and captions. Perfect for mapping onboarding steps, product interactions, or decision-making stages. Fully editable in PowerPoint, Keynote, and Google Slides.


6 diapositivas
Strategic Planning Spider Diagram Presentation
Present your strategy with clarity using the Strategic Planning Spider Diagram Presentation. This template offers a bold, visual way to showcase performance across six core categories, helping teams align on goals and priorities. Easily customizable and compatible with PowerPoint, Keynote, and Google Slides. Ideal for executives and planners.


24 diapositivas
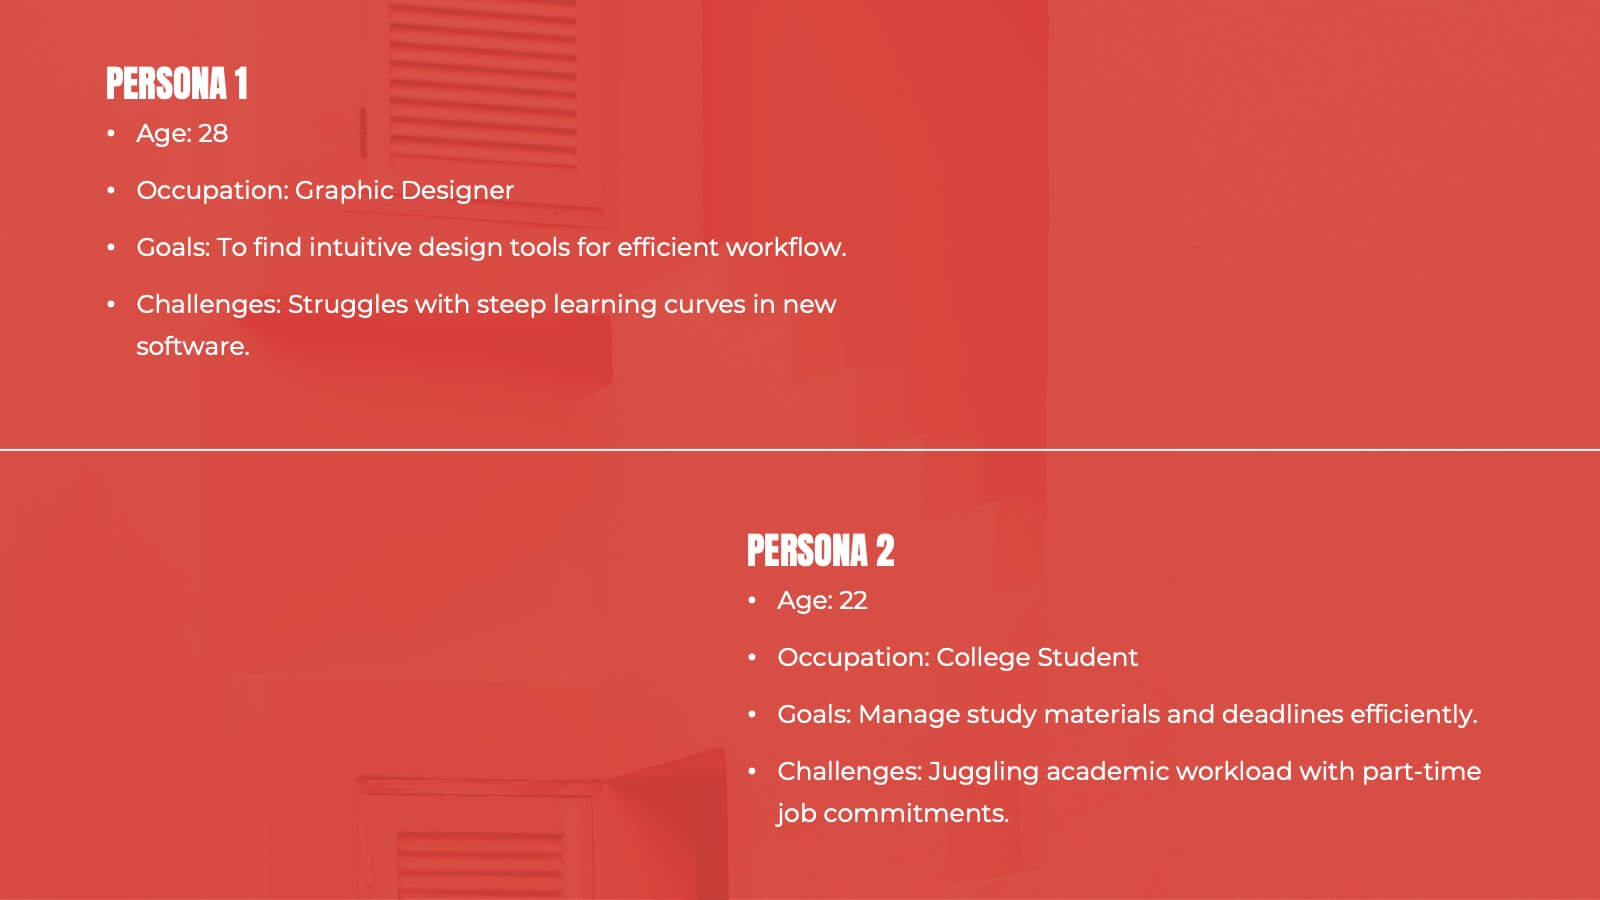
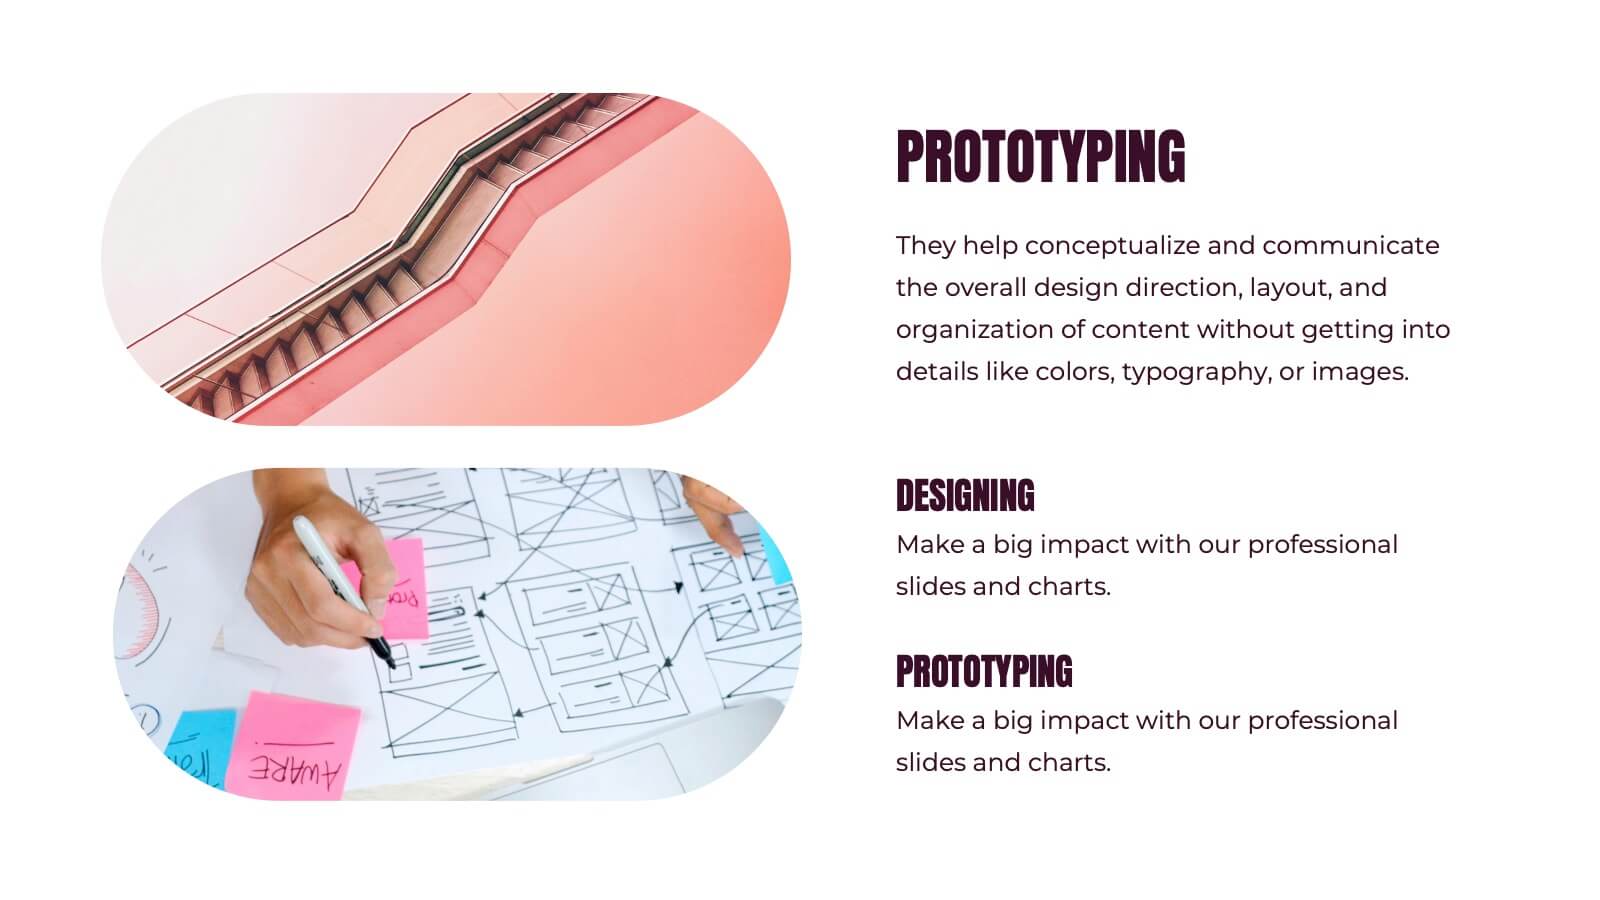
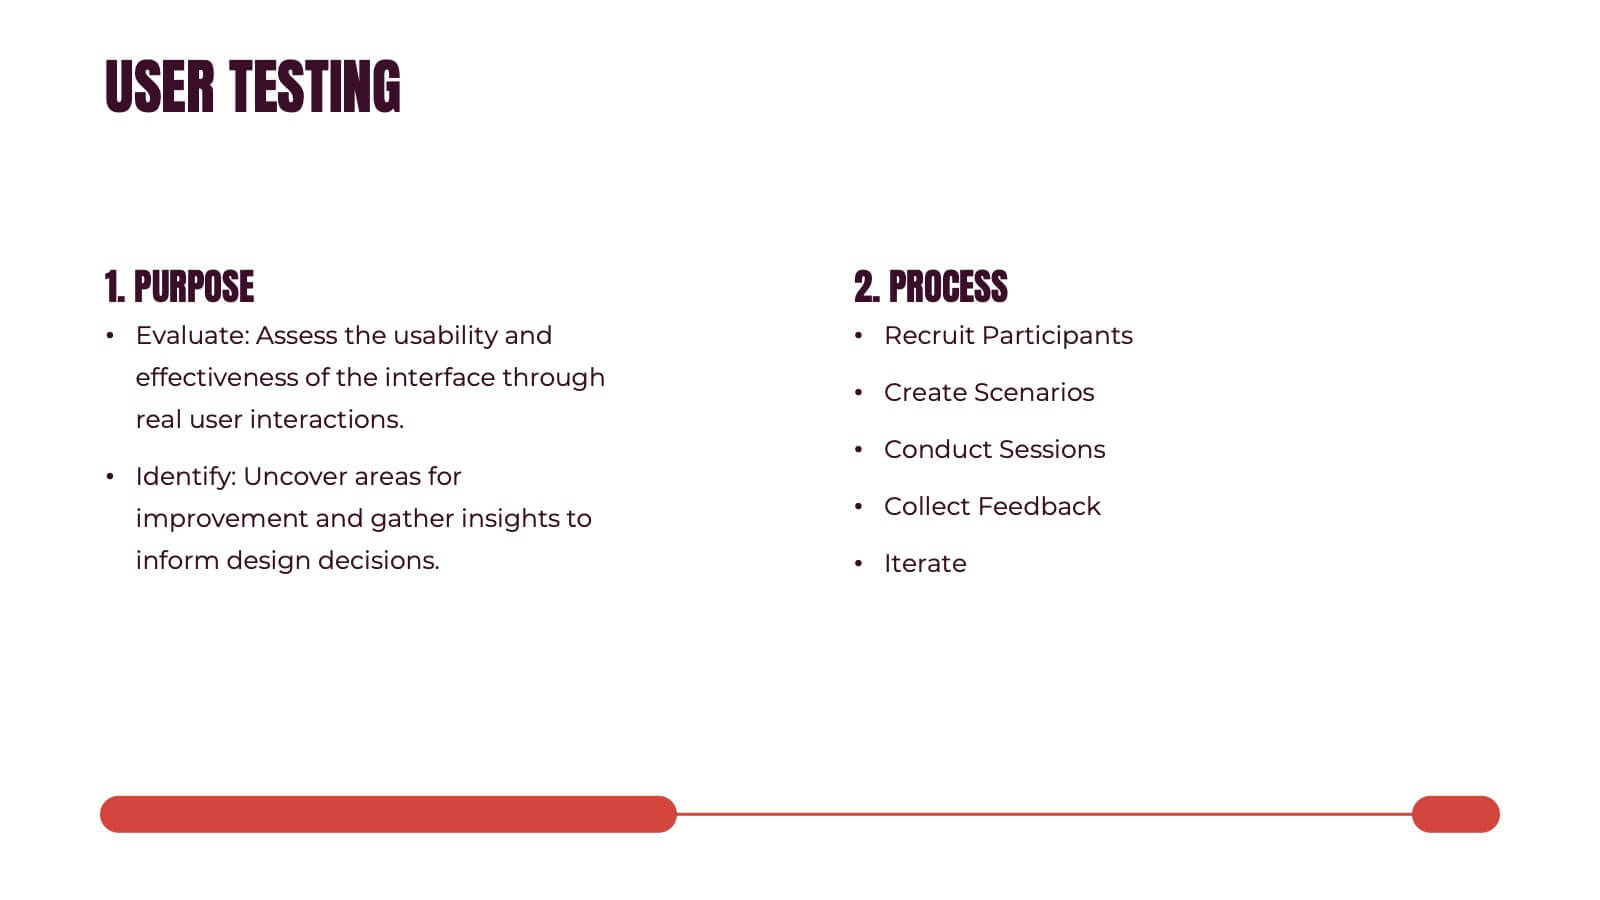
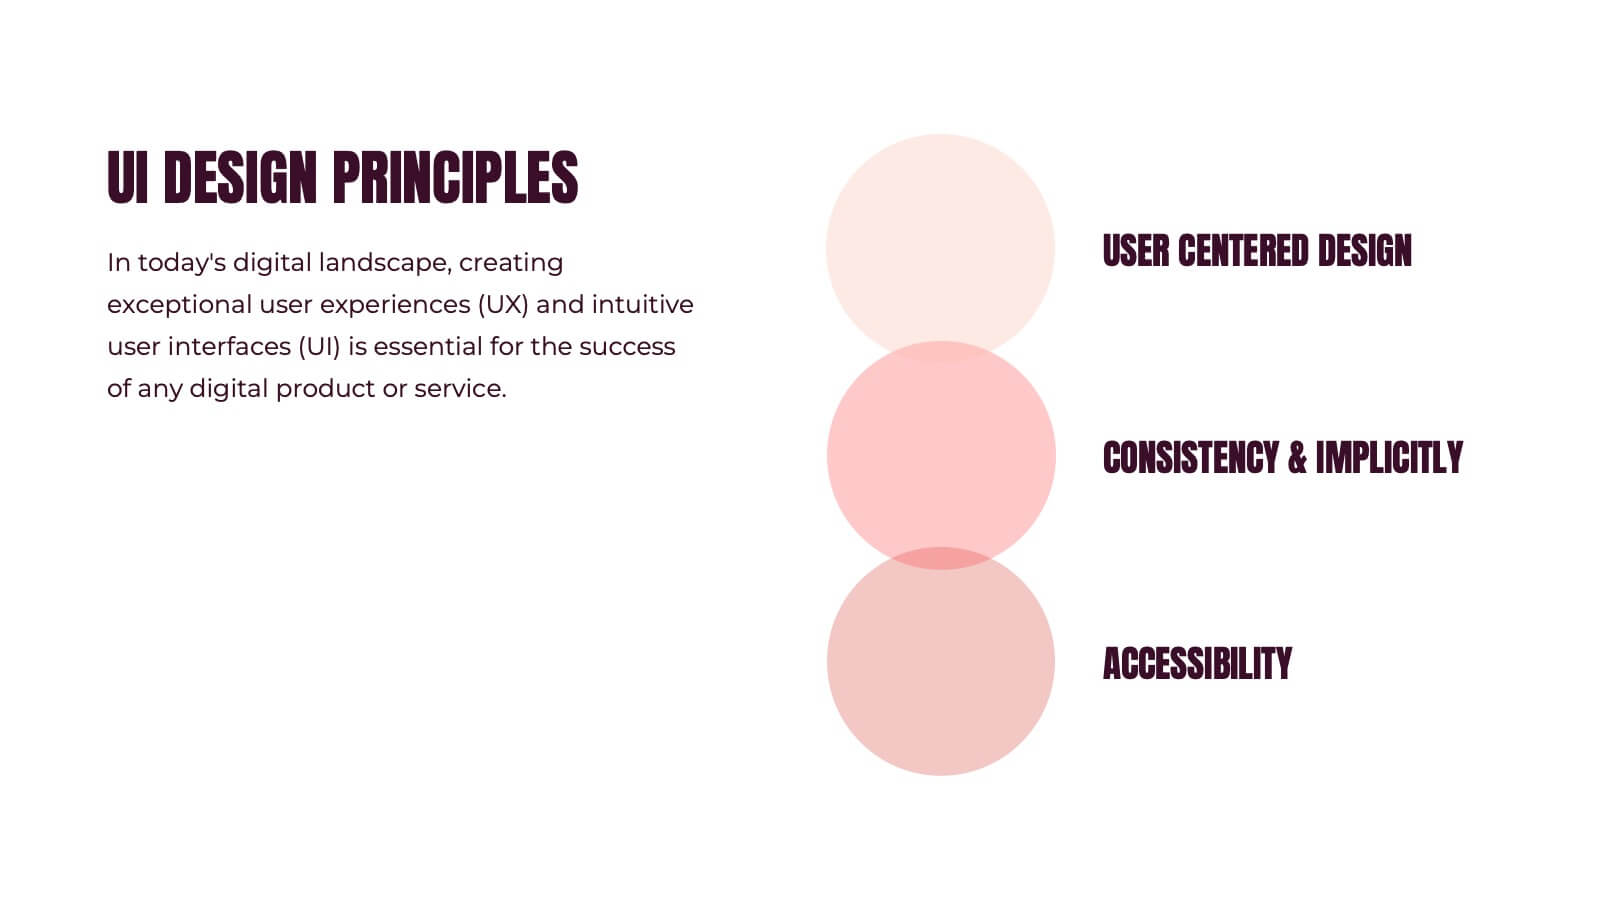
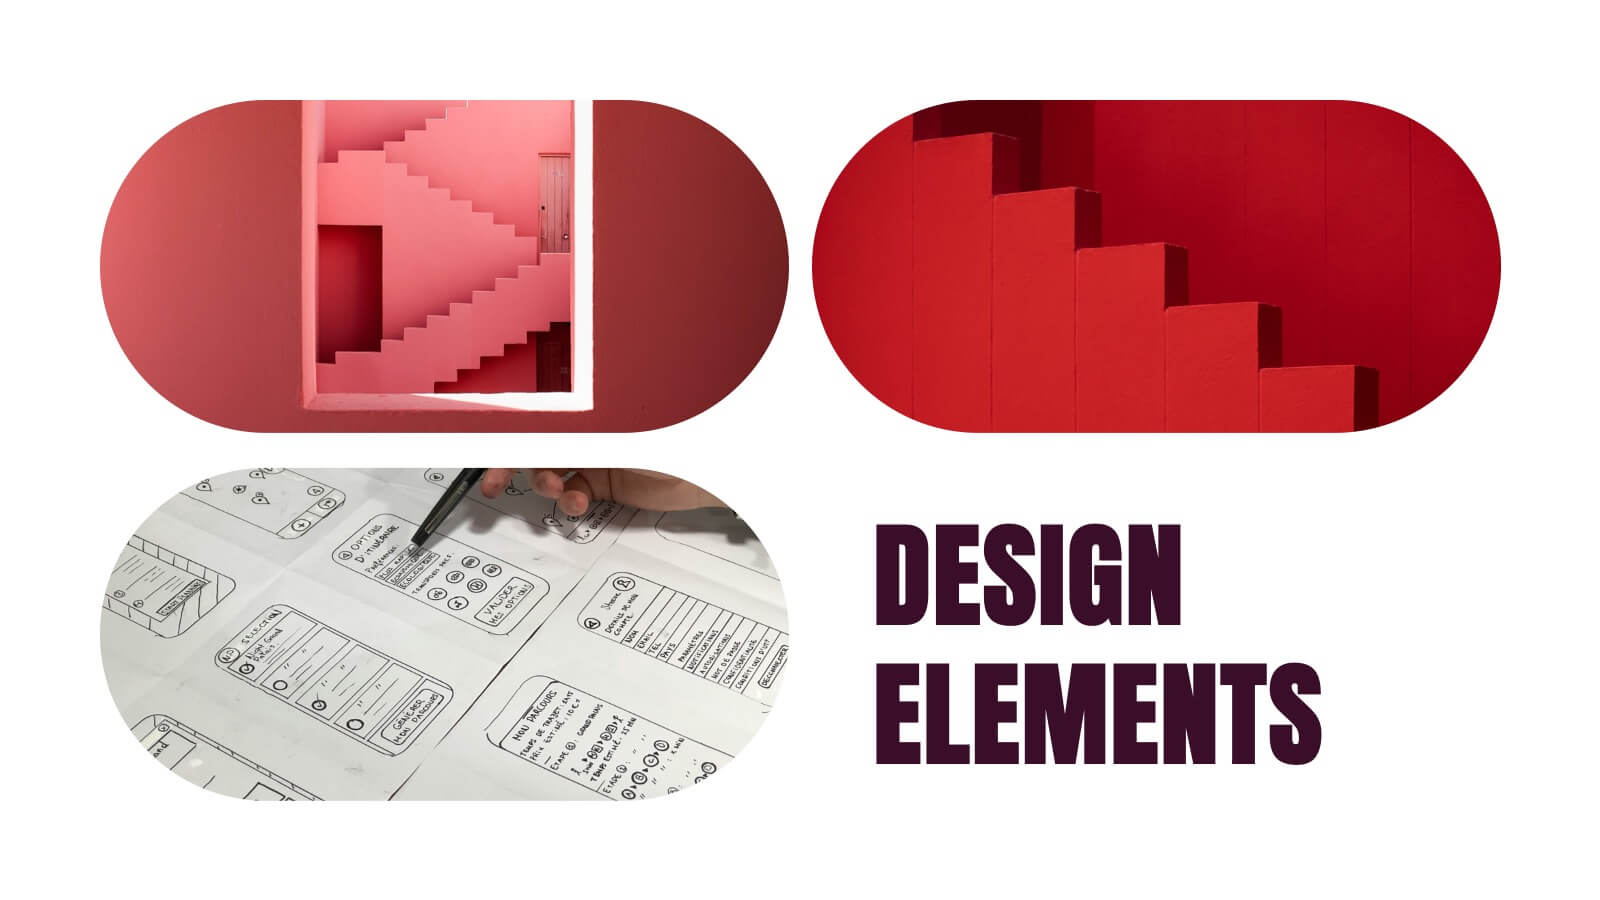
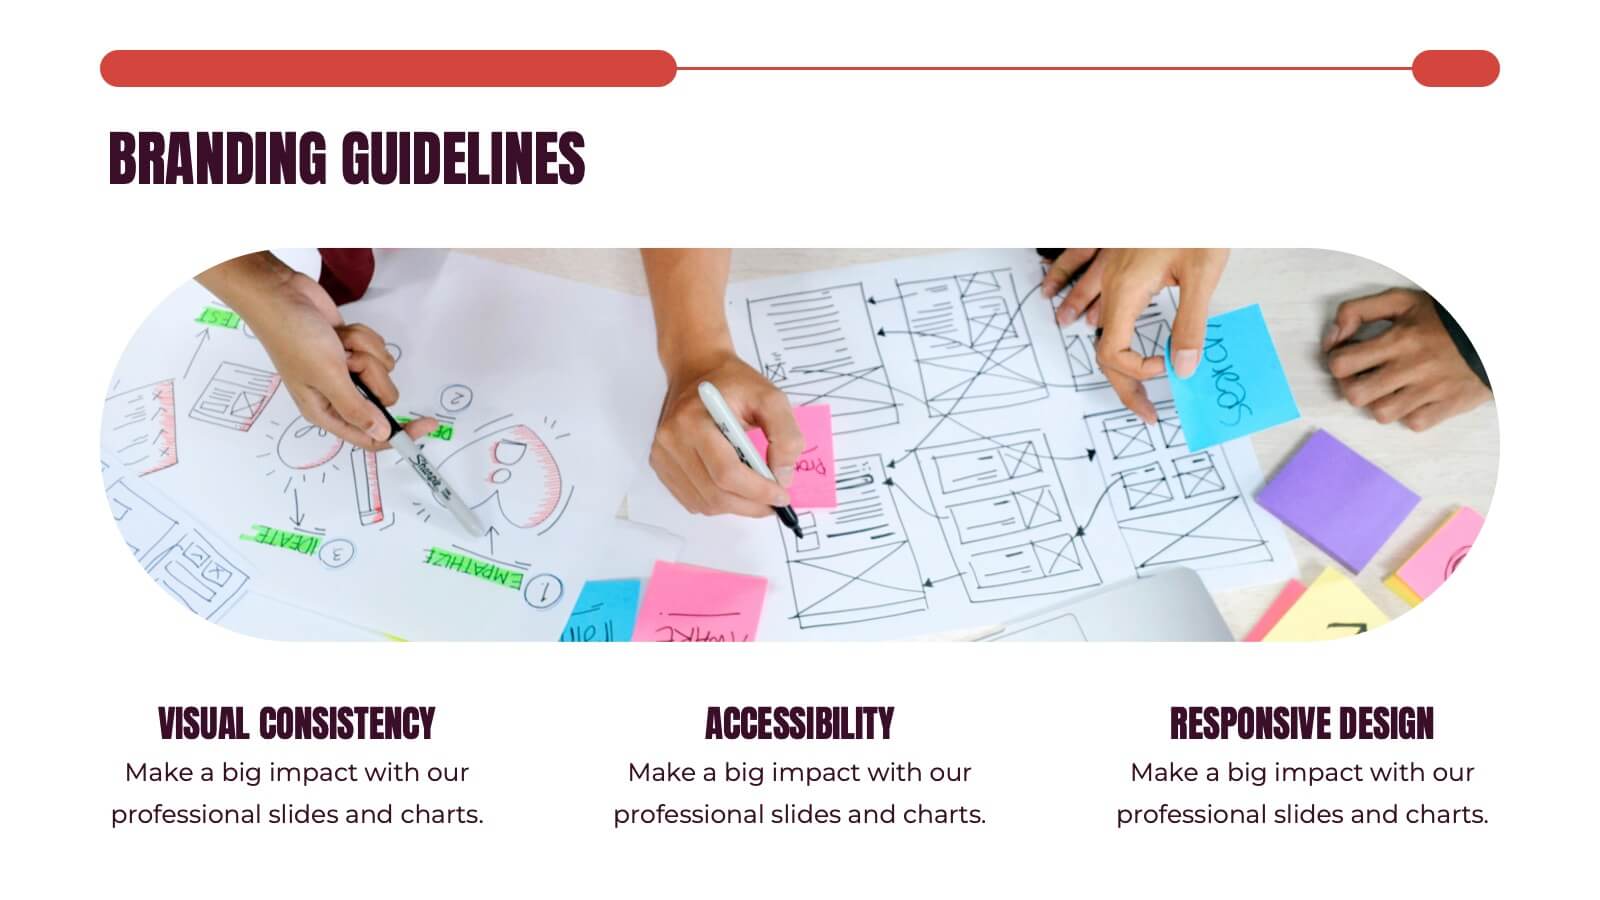
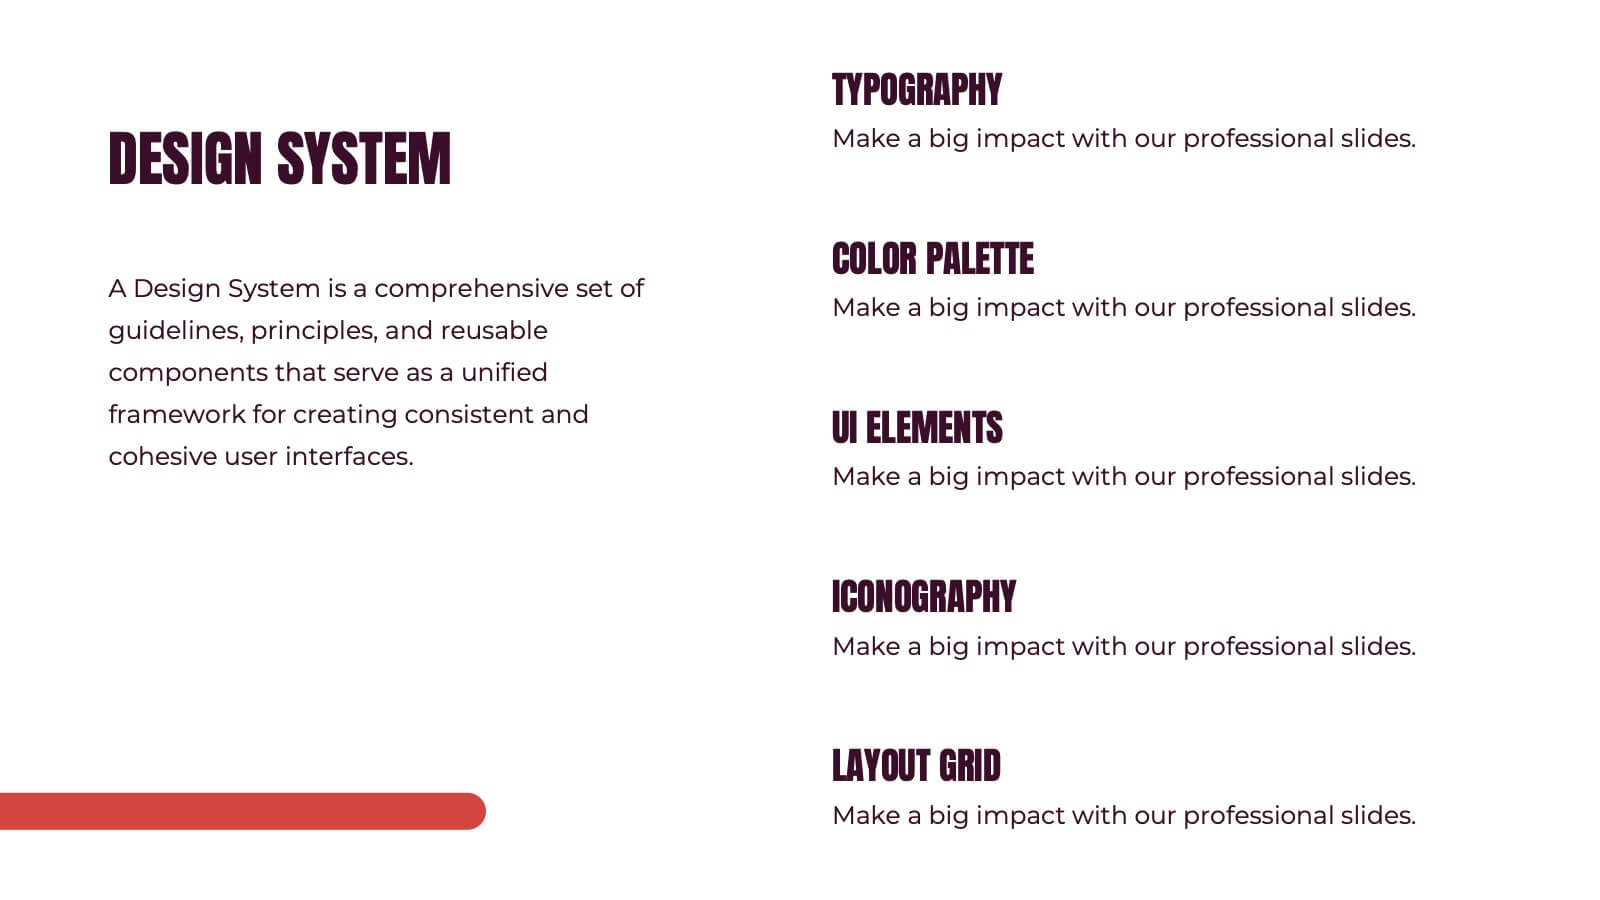
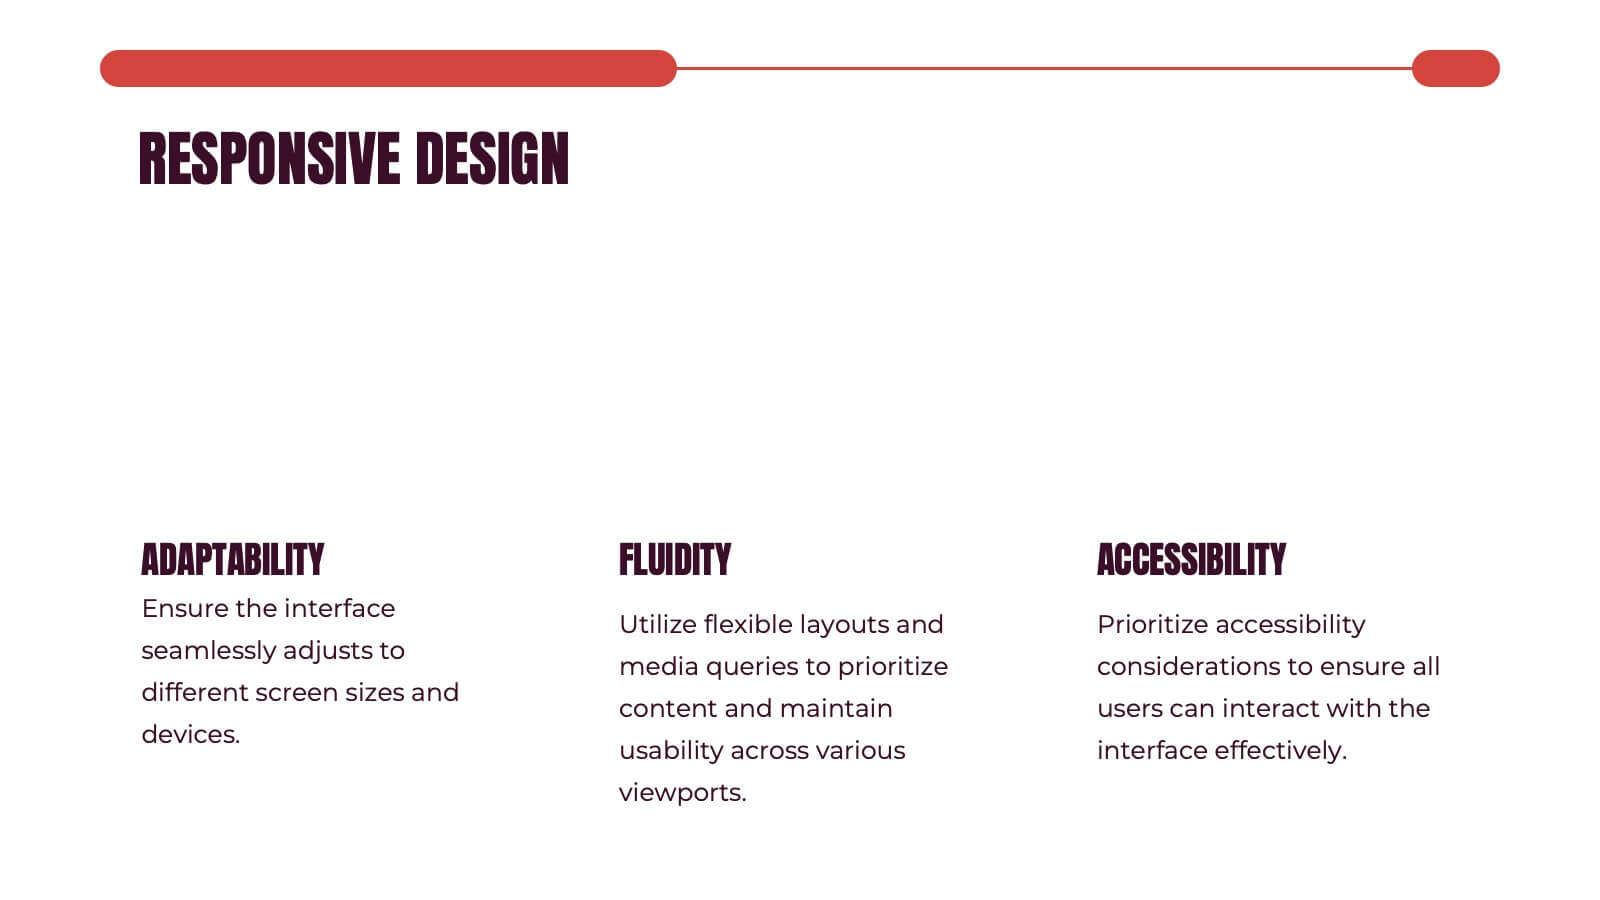
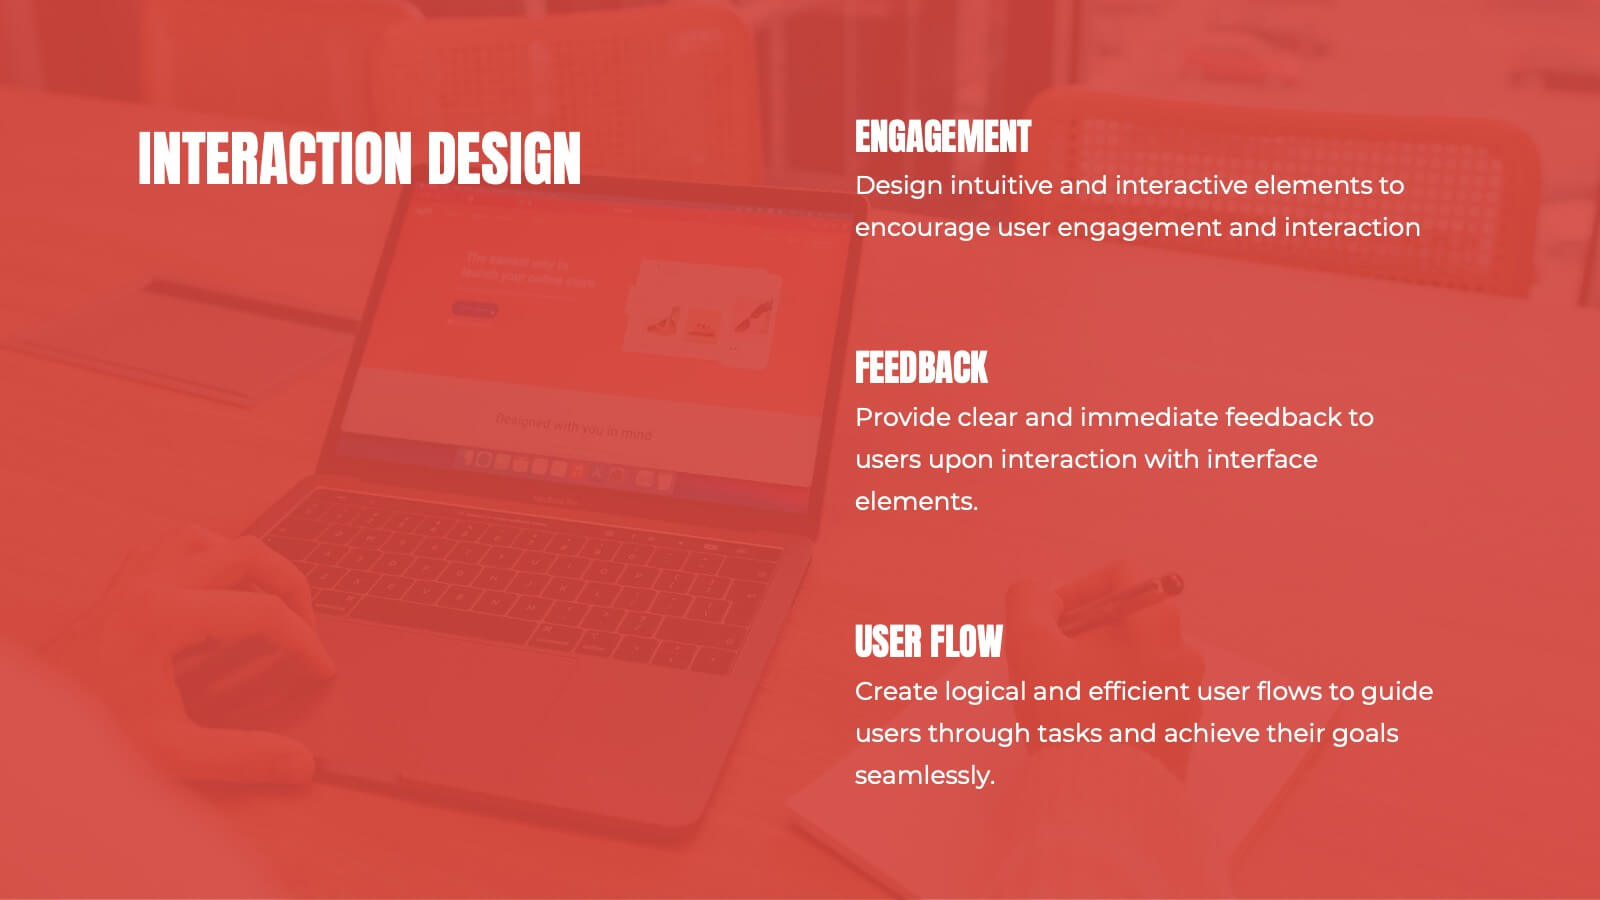
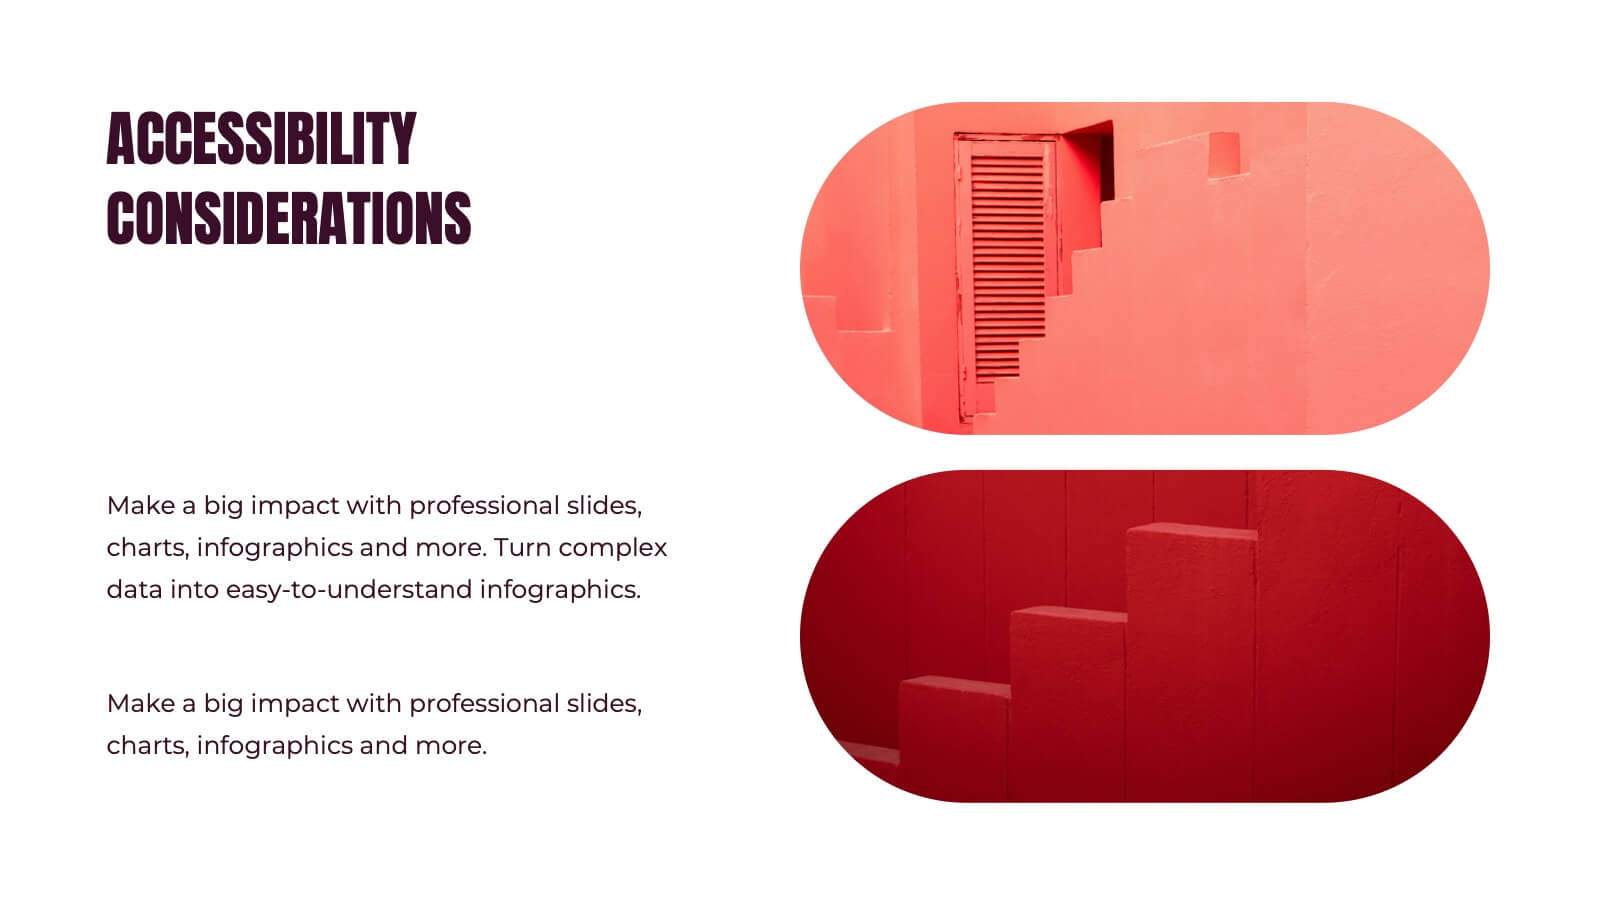
Kismet UX Design Presentation
Dive into the world of design with this stunning presentation template! Perfect for explaining user experience concepts, this template covers everything from wireframes to prototyping. It's designed to captivate your audience with visually engaging slides and clear, concise information. Compatible with PowerPoint, Keynote, and Google Slides for effortless use across platforms.


5 diapositivas
Business Growth and Expansion
Visually communicate each stage of business development with this Business Growth and Expansion diagram. Featuring a dynamic circular flow, this editable slide is perfect for showcasing progress, scaling strategies, or roadmap milestones. Fully compatible with PowerPoint, Keynote, and Google Slides—ideal for business plans and strategic presentations.


4 diapositivas
Science Lab Results and Data Analysis Presentation
Visualize lab data with clarity using this science-themed infographic. Featuring test tubes in a rack, it’s ideal for presenting experimental results, sample comparisons, or analysis summaries. Each tube aligns with icons and key points for easy interpretation. Fully customizable in PowerPoint, Keynote, and Google Slides to match your findings.


26 diapositivas
Workouts for Every Body Part Presentation
Achieve total-body fitness with this dynamic presentation on targeted workouts for every muscle group. Covering effective exercises, proper form, strength training techniques, and workout plans, this template helps simplify fitness routines for all levels. Fully customizable and compatible with PowerPoint, Keynote, and Google Slides for a seamless and engaging presentation experience.


6 diapositivas
PESTEL Framework Breakdown Presentation
Kickstart your strategic thinking with a bold, colorful layout that makes external business factors easy to understand at a glance. This presentation breaks complex influences into clear, structured sections, helping teams analyze trends and plan with confidence. Fully editable and compatible with PowerPoint, Keynote, and Google Slides.


7 diapositivas
Communication Styles Infographic
Dive into the diverse world of communication with our communication styles infographic. Set against a palette of blue, yellow, and white, this template offers a visual exploration of different communication methods and their nuances. Whether it's assertive, passive, aggressive, or passive-aggressive, understanding these styles is vital in both personal and professional settings. Ideal for corporate trainers, educators, students, or anyone aiming to improve their interpersonal skills. Crafted for clarity and compatibility, this infographic is an excellent addition to PowerPoint, Keynote, and Google Slides, ensuring your presentations resonate with both substance and style.


6 diapositivas
DMAIC Six Sigma Framework Presentation
Dive into process perfection with our DMAIC Six Sigma Framework template! This visually appealing guide breaks down each phase—Define, Measure, Analyze, Improve, and Control—making it easier to streamline operations and enhance quality. Fully compatible with PowerPoint, Keynote, and Google Slides, it's designed for professionals dedicated to operational excellence and continuous improvement.


4 diapositivas
Soft Watercolor Background Slides Presentation
Add a soft, elegant touch to your presentation with this Soft Watercolor Background Slides Presentation. Designed with gentle gray brushstroke textures and clean, modern layout, it's perfect for conveying ideas clearly while maintaining visual appeal. Ideal for creative, wellness, or professional topics. Fully editable in PowerPoint, Google Slides, and Canva.