


Características


¿Tienes alguna pregunta?
Recomendar


7 diapositivas
Cryptocurrency Market Infographic Presentation
The importance of cryptocurrency includes decentralization, privacy, accessibility, investment potential, and innovation. This template introduces the most comprehensive cryptocurrency infographic to help you increase your understanding of cryptocurrencies. You can use this template to present examples and tips on how to navigate and make commercial use of cryptocurrency. This template is designed in Powerpoint, Keynote, and Google Slides which allows you to easily edit this presentation and include your data. The cryptocurrency theme allows you to make your data stand out with a unique design.


6 diapositivas
Career Objective Infographic
Objective slides help communicate goals, aims, and purpose of the presentation to the audience. This infographic template is a visual representation that communicates your career goals, aspirations, and the value you bring to potential employers. This template serves as a roadmap for your presentation, helping both you and your audience understand the purpose and direction of your objective. Compatible with Powerpoint, Keynote, and Google Slides. This showcases your career objectives and key qualifications. Use a design that reflects your industry and personal brand while conveying your career objectives effectively.


6 diapositivas
Corporate Foundation and Pillars Presentation
Highlight your company's core principles with this visually impactful pillar-style slide. Designed to illustrate business frameworks, strategies, or guiding values, this layout helps communicate stability and growth. Fully customizable in PowerPoint, Keynote, and Google Slides for seamless brand alignment.


5 diapositivas
E-Learning and Digital Education Trends Presentation
Stay ahead in the digital learning space with the E-Learning and Digital Education Trends Presentation template. Designed for educators, trainers, and e-learning professionals, this modern and insightful layout highlights key trends, innovative tools, and strategies in online education. With fully customizable elements, you can tailor the slides to your audience’s needs. Compatible with PowerPoint, Keynote, and Google Slides for a seamless presentation experience.


10 diapositivas
Agile Sprint Planning with Scrum Board Presentation
Plan and track your sprints effectively with this Agile Scrum Board Template. Featuring customizable “Stories,” “To Do,” “In Progress,” and “Testing” columns, this layout helps visualize workflow and team tasks clearly. Perfect for scrum masters and agile teams. Compatible with PowerPoint, Keynote, and Google Slides for easy editing.


6 diapositivas
Africa Richest Map Infographic
Africa is the world's second-largest and second-most-populous continent, It's a continent full of people, culture, and history. This infographic template is designed to help you inform your audience about everything they need to know about Africa's richest countries. Use this template to inform about Africa's most valuable exports and imports, the percentage of their GDP that is made up of oil revenue, and much more. This infographic map displays information on each country, including population density and economic ranking. This template is fully customizable and compatible with Powerpoint, Keynote, and Google Slides.


26 diapositivas
Textures Company Profile Black Presentation
A company profile is a concise document that provides an overview of a business, its history, products or services, achievements, mission, vision, values, and other relevant information. This presentation template is designed for businesses to showcase their brand identity and services in an elegant and professional manner. With a dominant black color theme, this presentation exudes a sense of modernity and class, making it perfect for businesses in various industries. Introduce your company's history, mission, and values in a concise and compelling manner. Utilize the clean and clear typography to maintain a professional and sophisticated look.


5 diapositivas
Market Share Analysis Pie Chart Presentation
Present market insights effectively with the Market Share Analysis Pie Chart Presentation. This visually engaging template helps illustrate competitive positioning, segment distribution, and industry trends through clear and customizable pie charts. Ideal for marketing reports, business strategy meetings, and investor presentations. Fully editable and compatible with PowerPoint, Keynote, and Google Slides.


5 diapositivas
Fundraising for Nonprofits Infographics
Elevate your fundraising efforts with our fundraising for nonprofits infographics template. Cast in the trustworthy shades of blue and red, this collection is a boon for nonprofit organizations, charity events coordinators, and social activists. It's designed to articulate critical fundraising information, campaign progress, and financial goals in a format that's as compelling as it is clear. Compatible with Powerpoint, Keynote, and Google Slides. The creative and informative style, replete with pertinent graphics, icons, and image placeholders, ensures your message resonates profoundly, encouraging more engagement and generosity towards your noble causes.


5 diapositivas
Survey Findings and Summary Report Presentation
Present survey data clearly with this layered, step-style layout. Each section is color-coded with matching icons for quick insight into key findings. Ideal for summarizing feedback, analytics, or market research. Fully editable in Canva, PowerPoint, or Google Slides—perfect for making data-driven presentations engaging and easy to follow.


4 diapositivas
Objectives and Key Results Overview Presentation
Set your goals, define success, and visualize progress with a sleek, easy-to-follow layout that connects objectives to measurable outcomes. Ideal for business strategy, team performance, or quarterly reviews, this presentation keeps your message clear and professional. Fully compatible with PowerPoint, Keynote, and Google Slides for effortless editing.


4 diapositivas
Employee Training and Development
Train smarter, not harder—with this bold funnel-style visual that maps your employee development journey from initial training to measurable impact. It's perfect for illustrating progress, performance shifts, or development stages across teams or roles. Fully customizable in PowerPoint, Keynote, and Google Slides for smooth integration into any professional presentation.


6 diapositivas
Fishbone Diagram
A fishbone diagram, also known as a cause-and-effect diagram or an Ishikawa diagram, is a visual tool used to identify and analyze the potential causes of a problem or an effect. This infographic template is designed to help you explore and understand the root causes of an issue by visually mapping out various contributing factors. This cause-and-effect diagram, provides a structured approach to identify and categorize the various factors contributing to a specific outcome. This template is fully customizable and compatible with Powerpoint, Keynote, and Google Slides making it easy to input your information.


6 diapositivas
End-to-End Value Chain Process Presentation
Visualize every link in your process with the End-to-End Value Chain Process Presentation. This modern chain diagram helps illustrate each stage of your business or production flow—from initial input to final output. It's ideal for strategy, supply chain, and operational planning. Fully editable in PowerPoint, Keynote, Canva, or Google Slides.


21 diapositivas
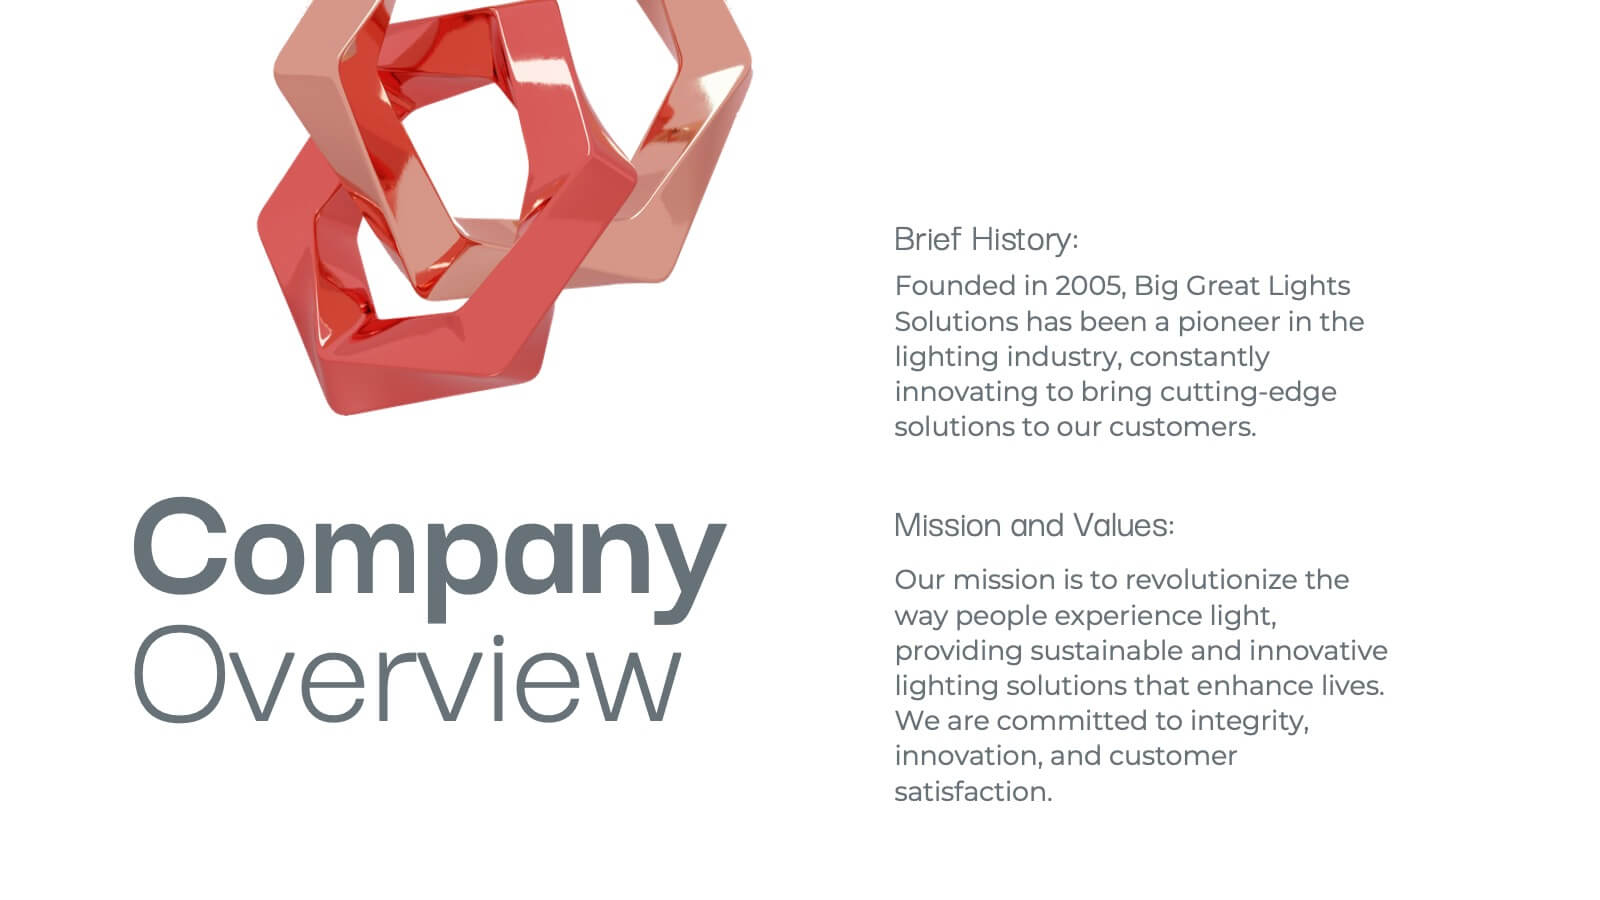
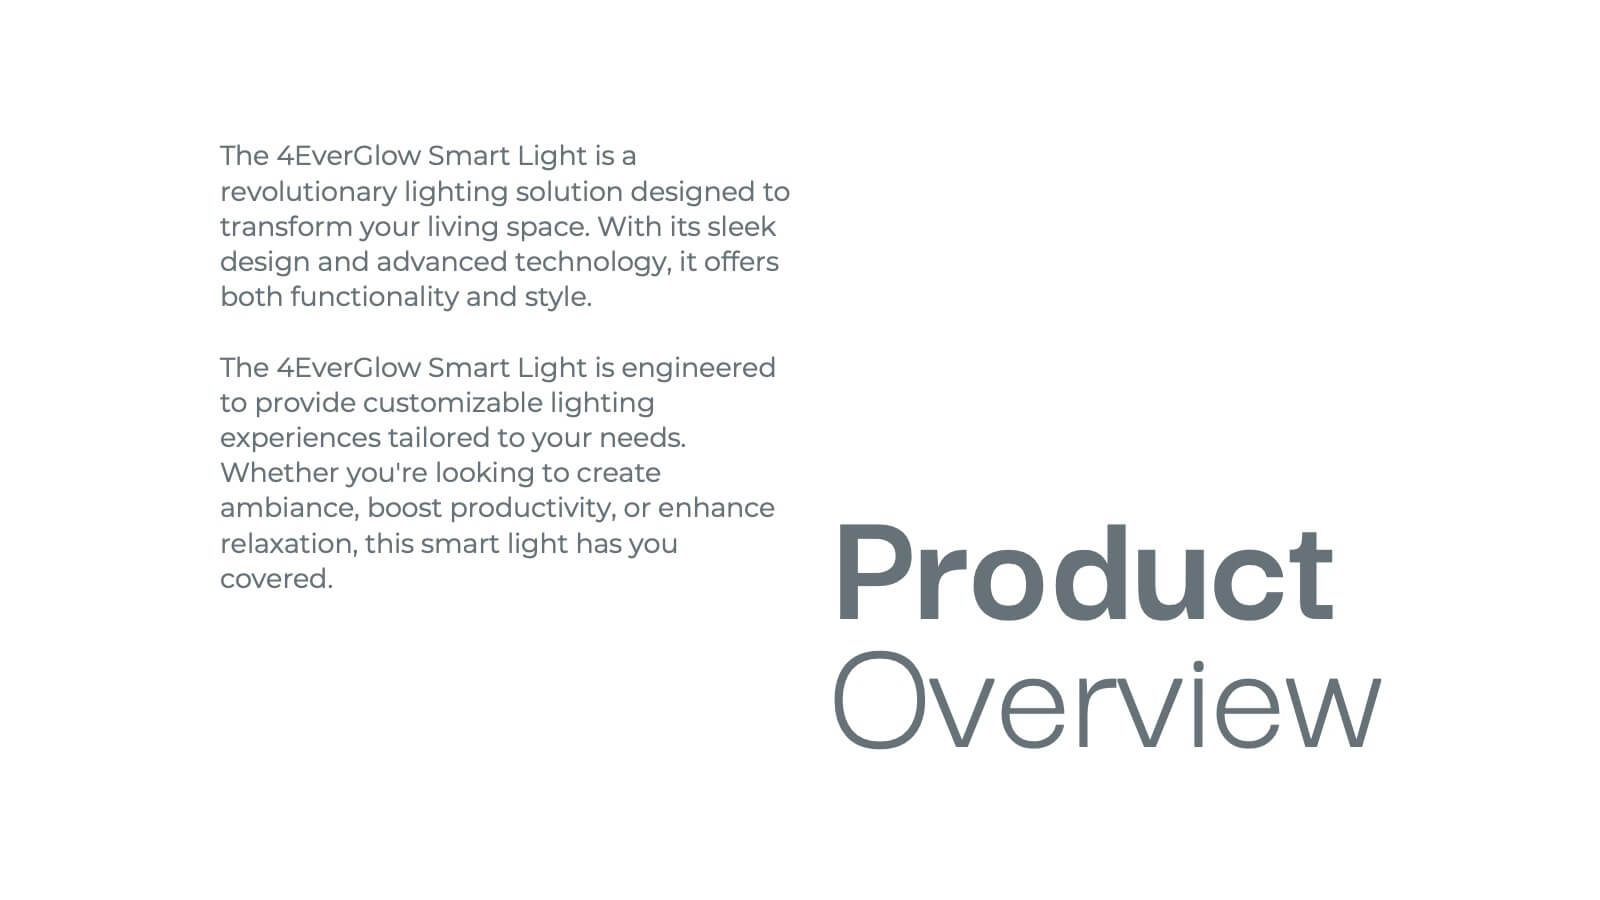
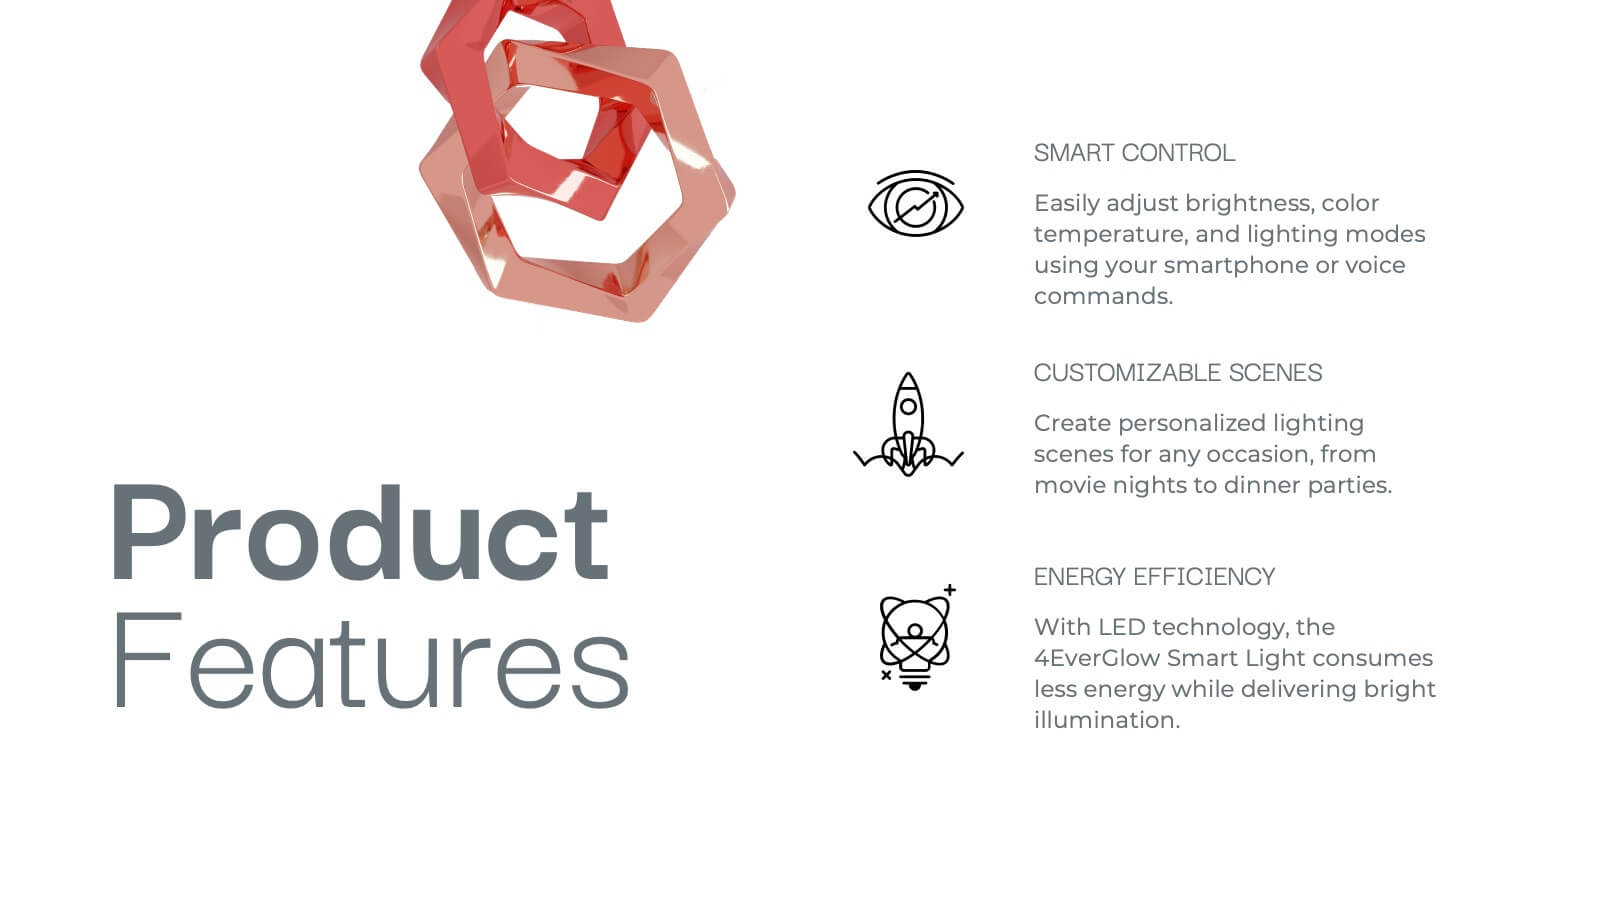
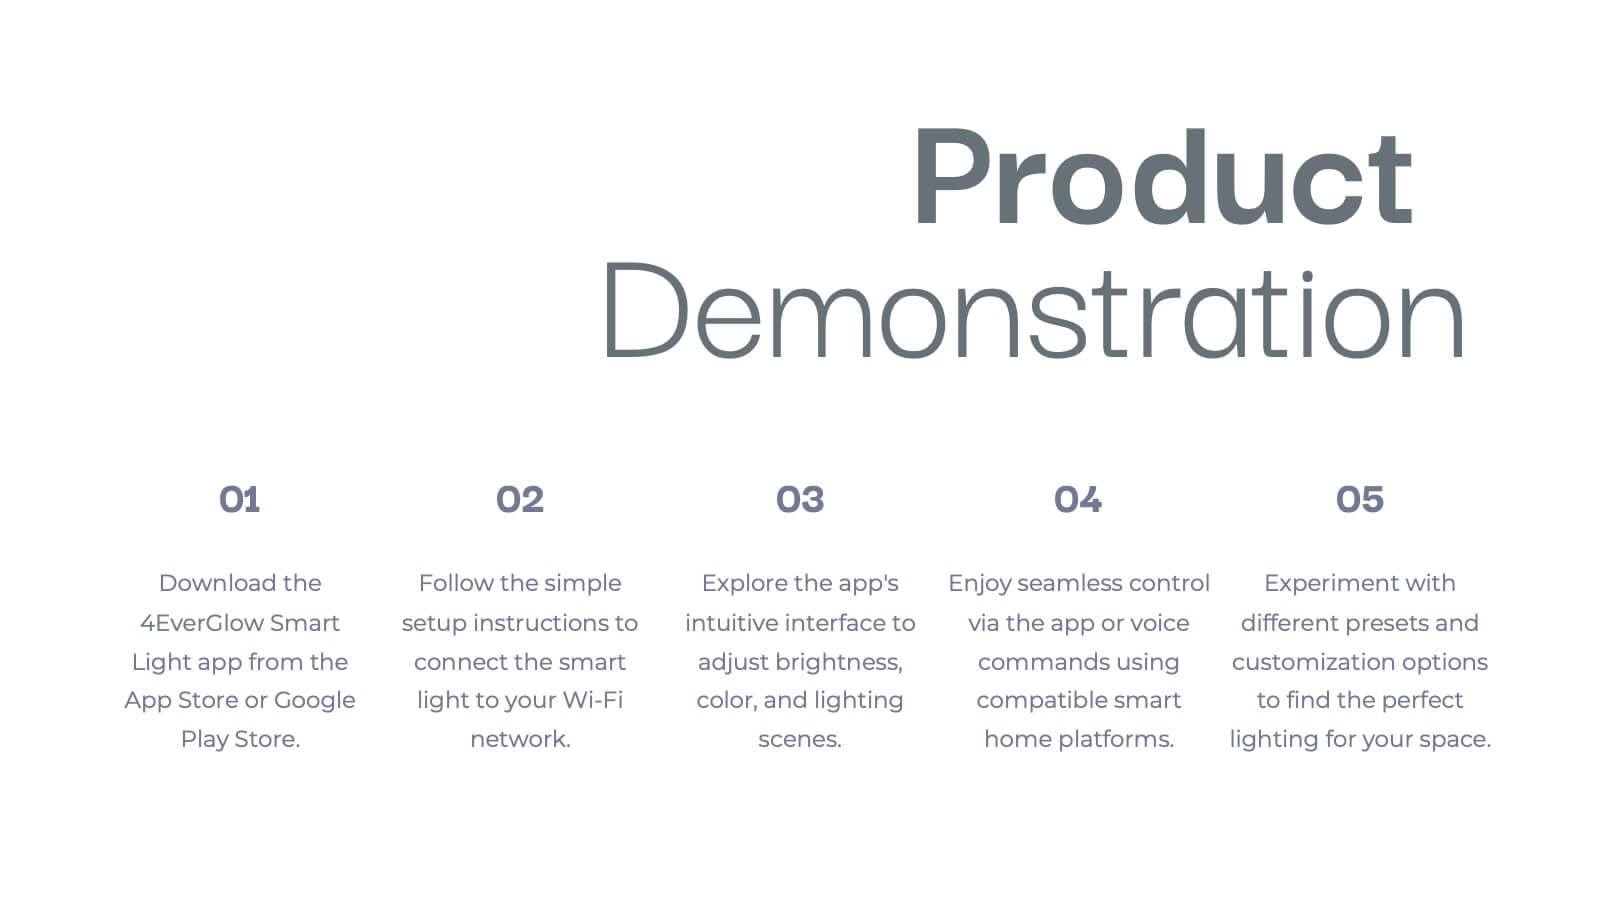
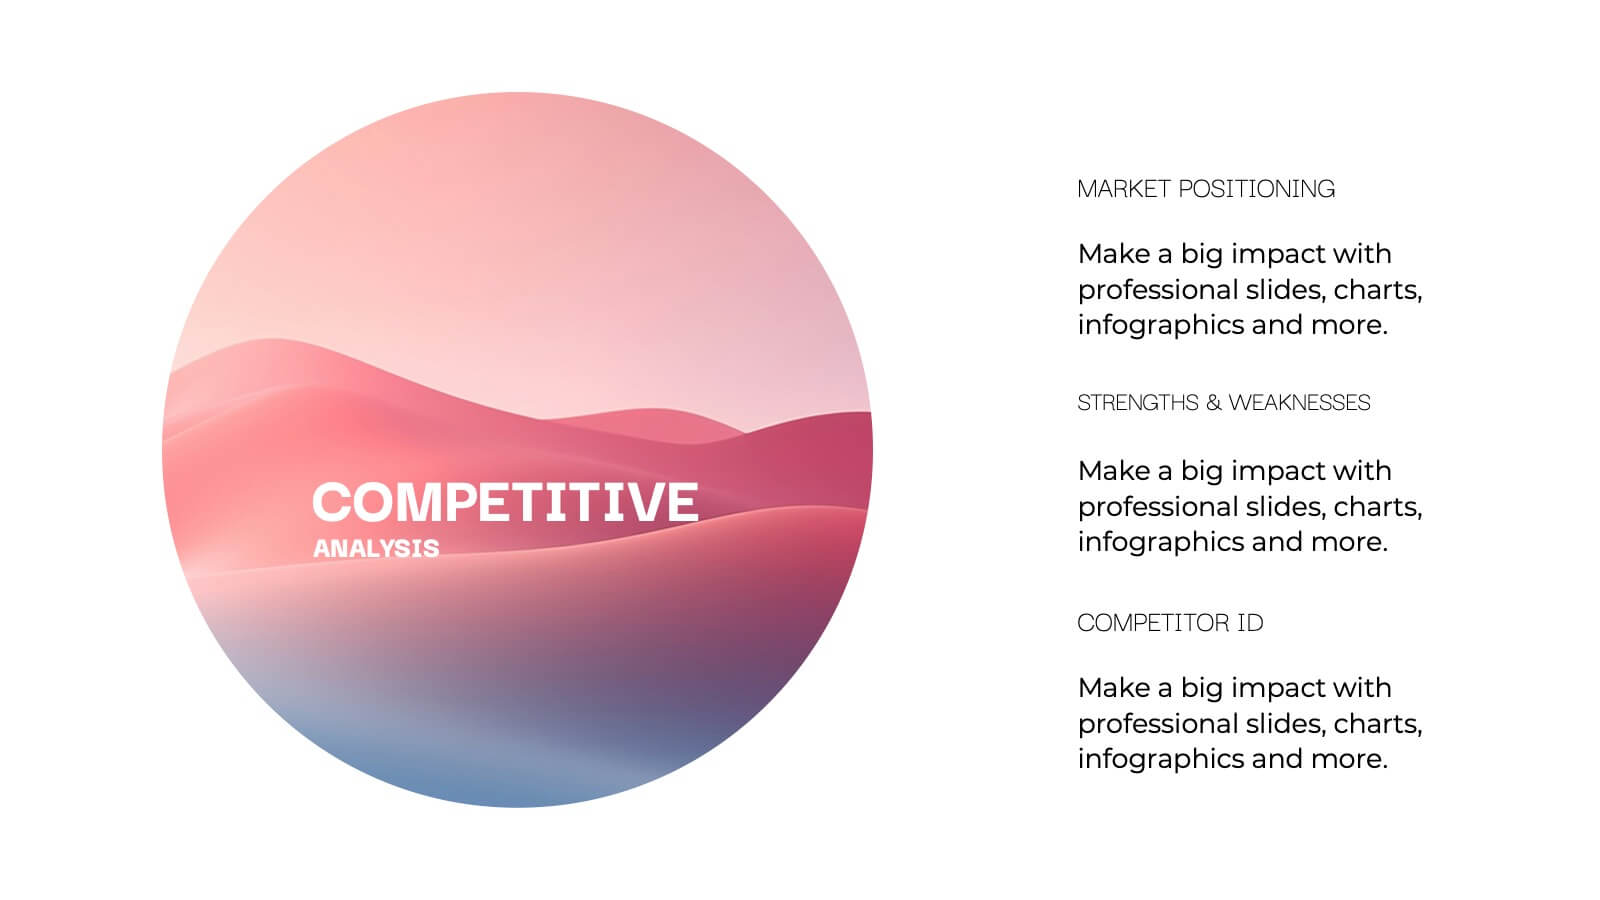
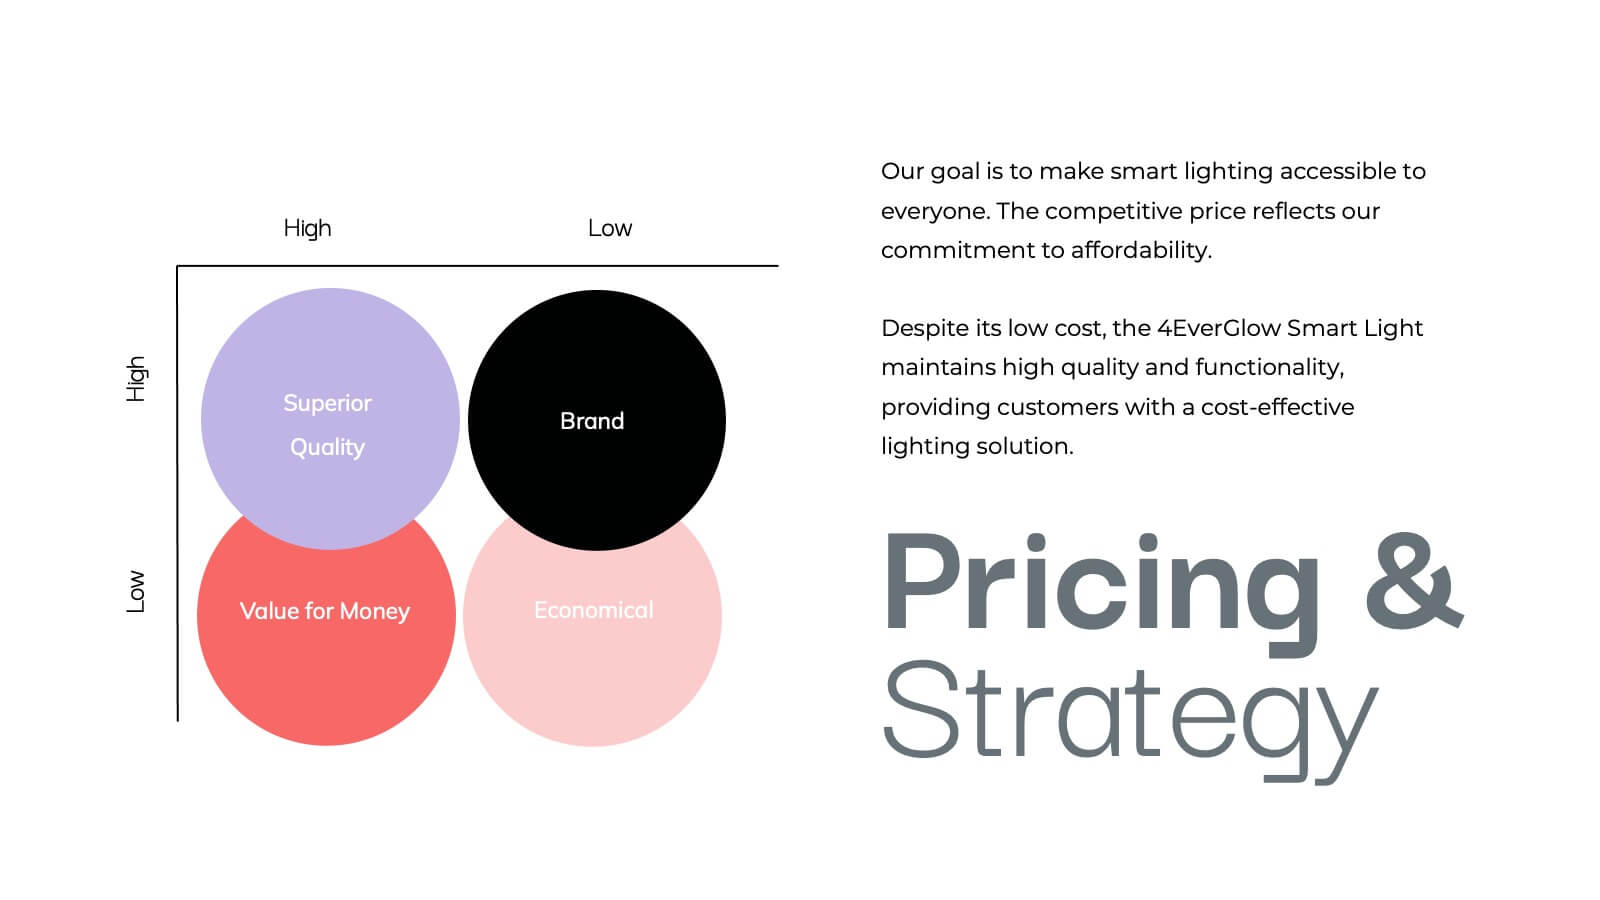
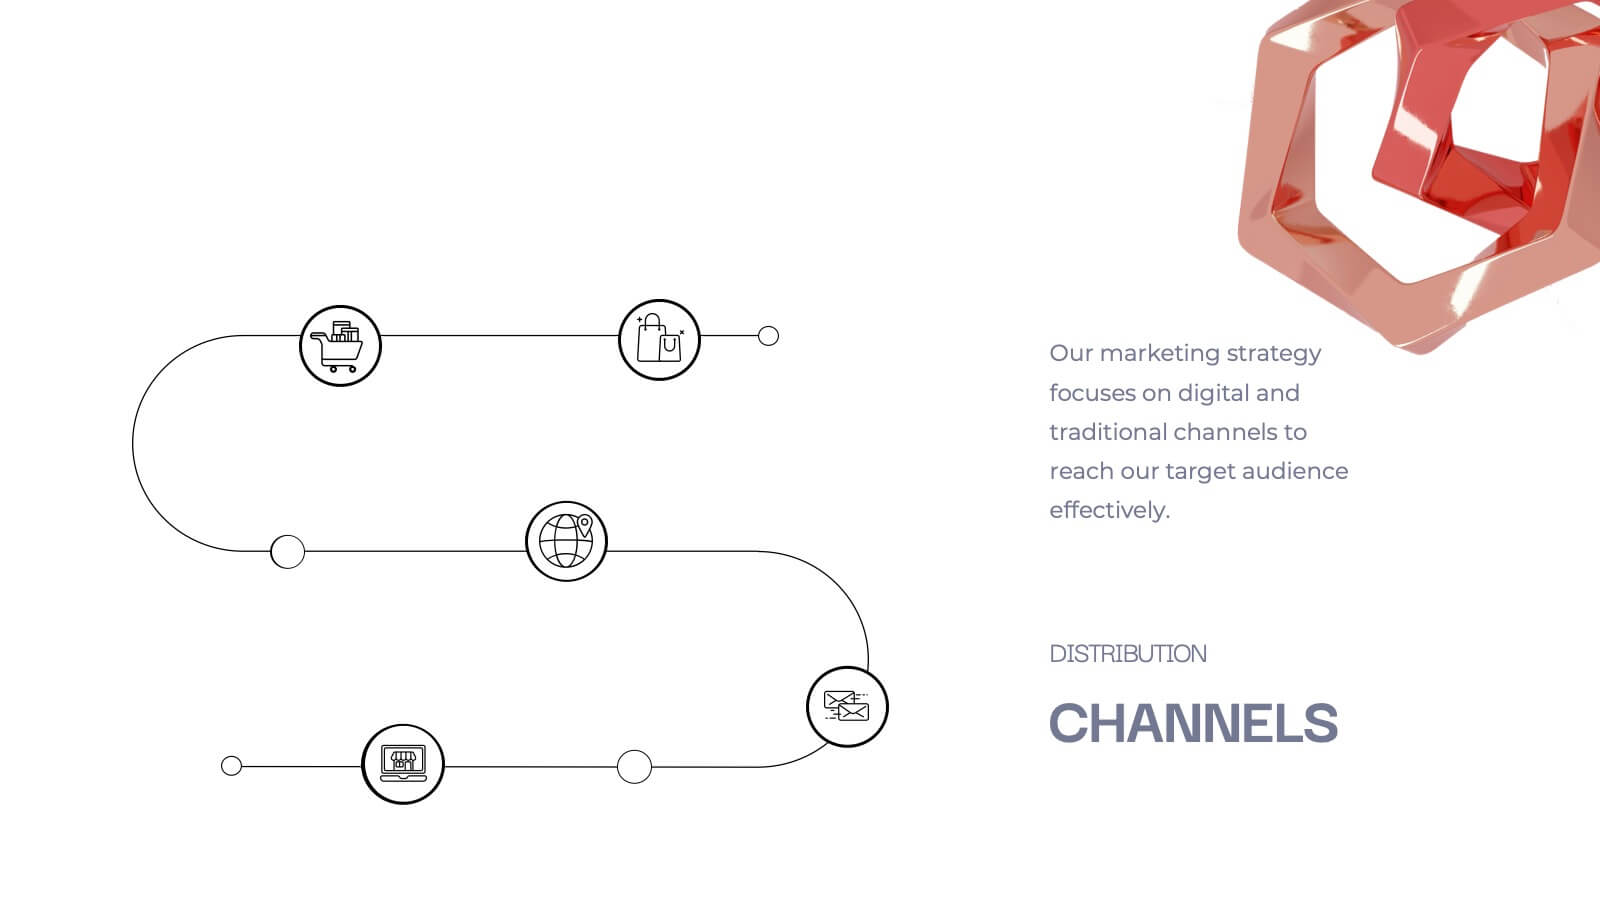
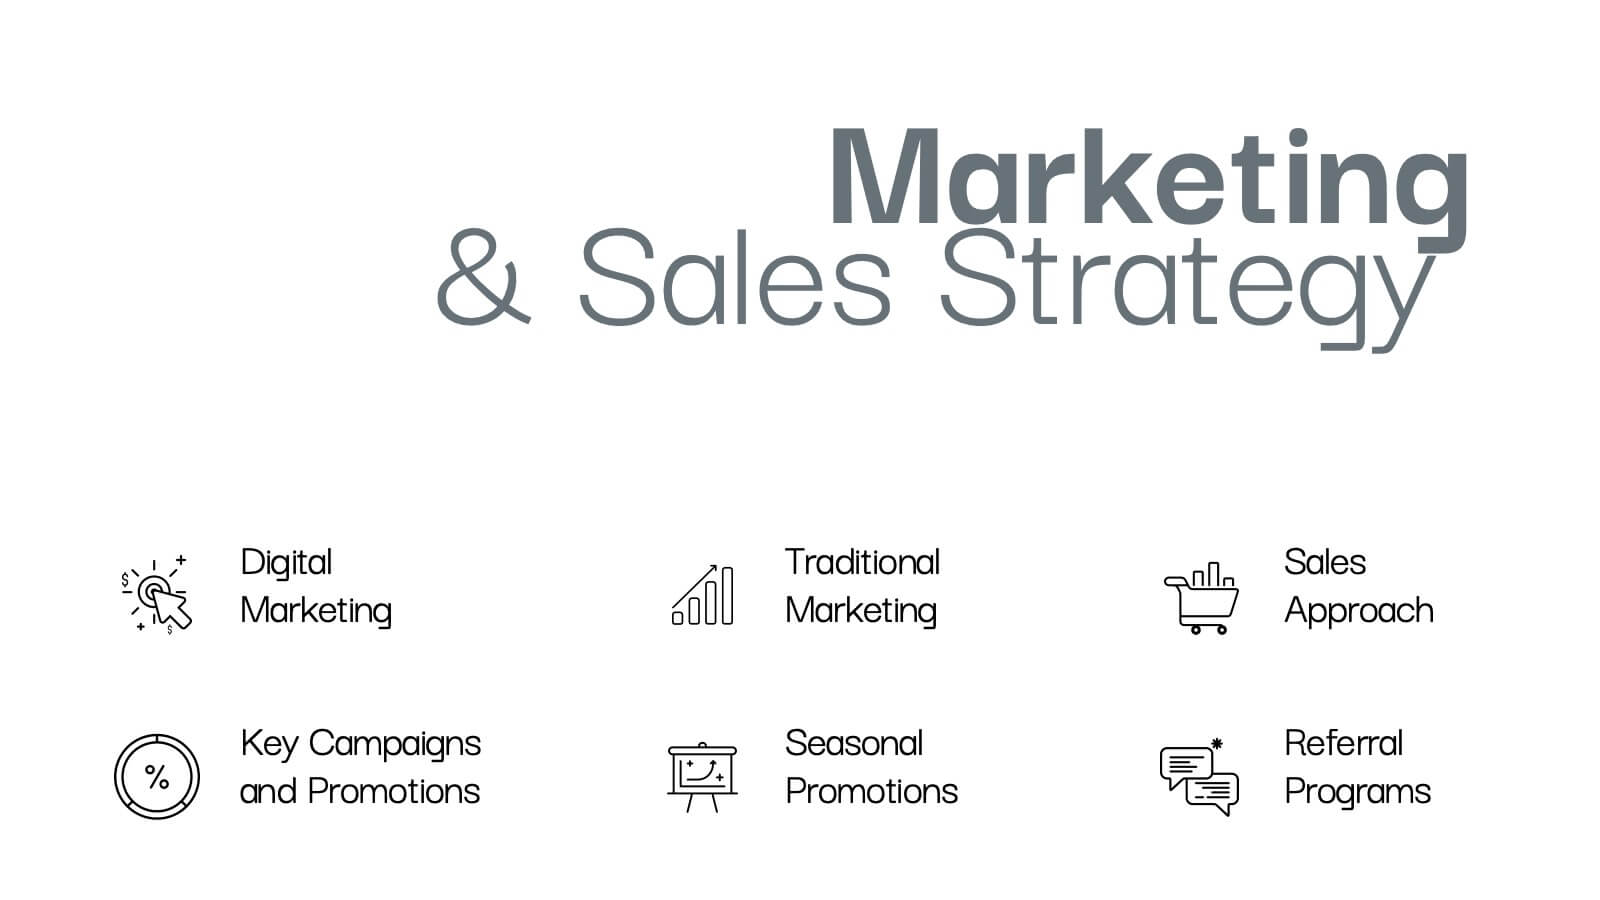
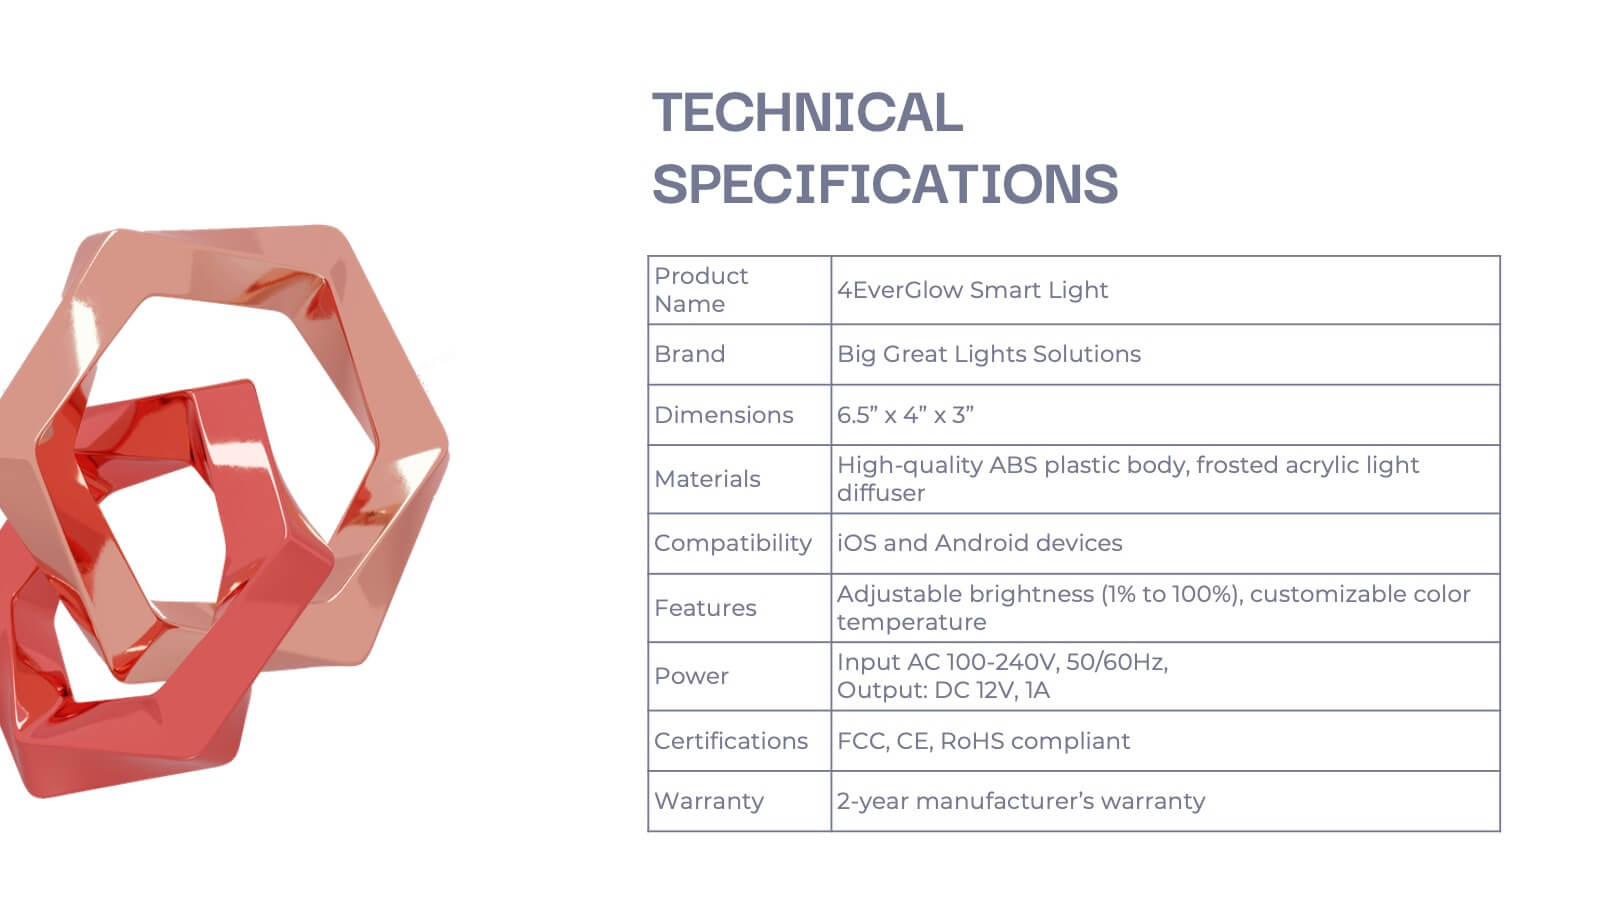
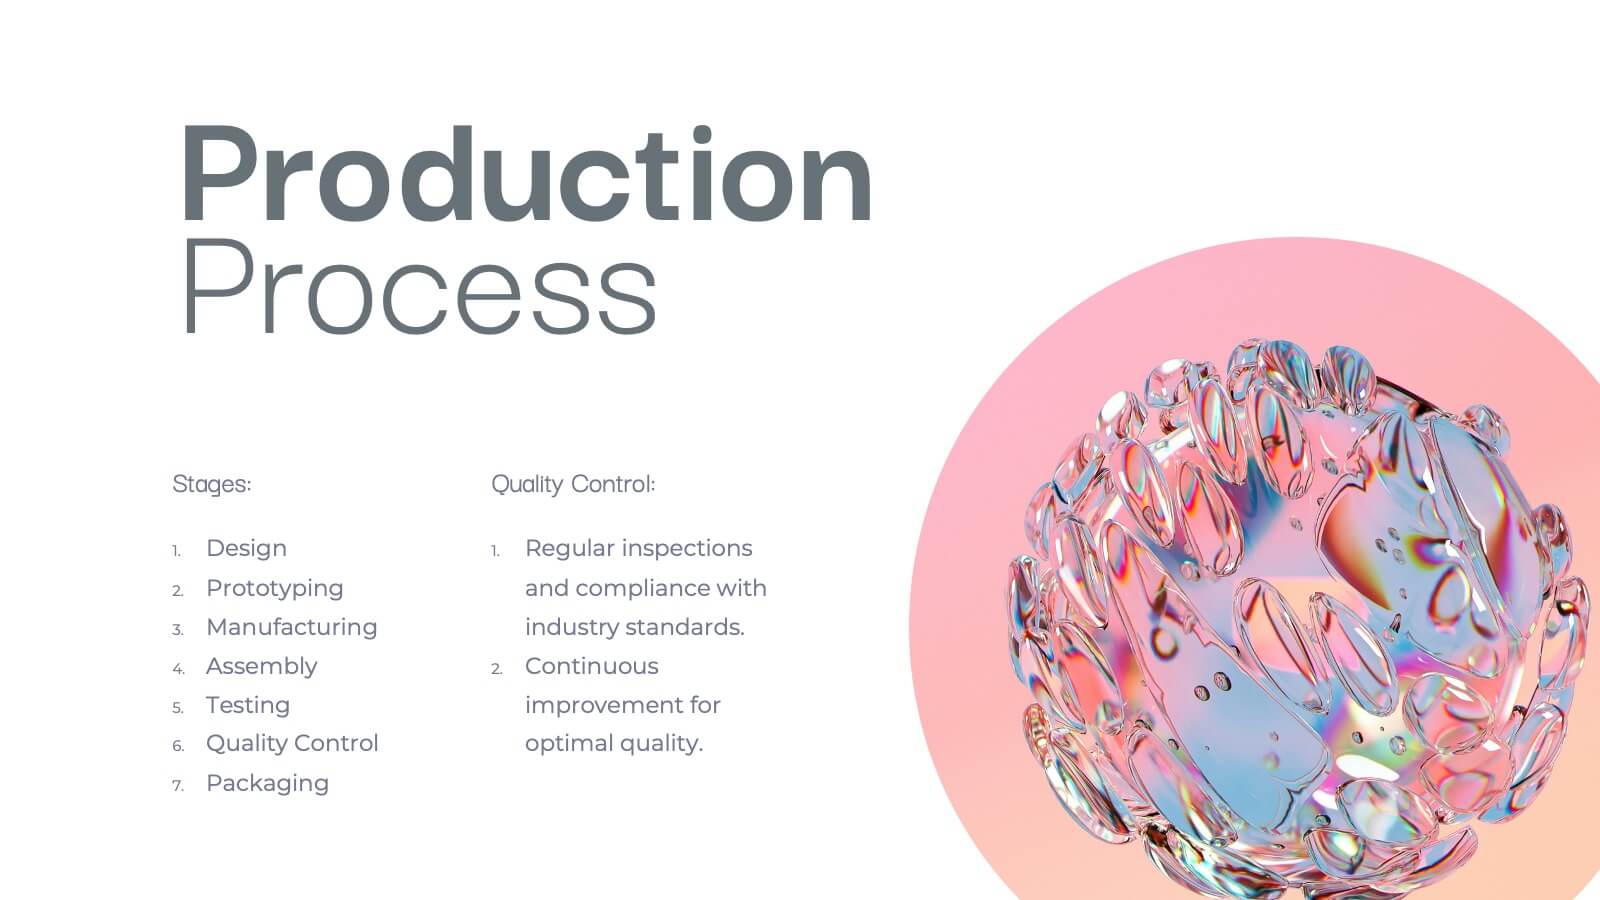
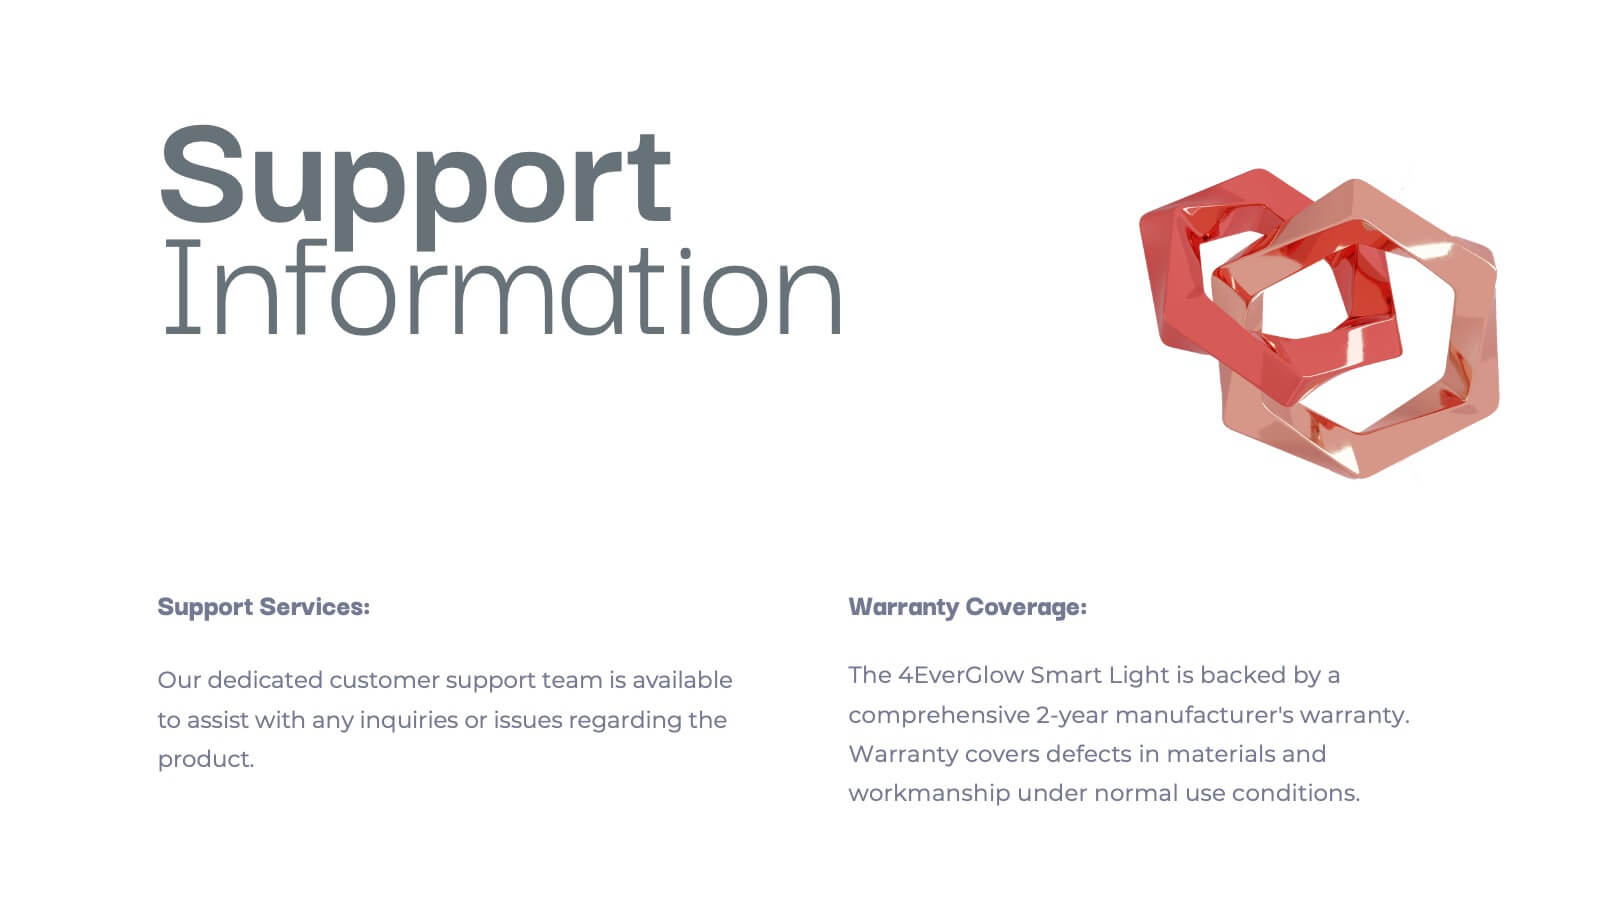
Vulcan New Product Proposal Presentation
Launch your next product with confidence using this comprehensive presentation template! Covering everything from product features and target market to pricing strategy and customer pain points, this template ensures a smooth and engaging flow for your audience. It’s ideal for product proposals, demonstrations, and marketing strategies. Compatible with PowerPoint, Keynote, and Google Slides for seamless presentations.


6 diapositivas
Business Roadmap Strategy Presentation
Map your path to success with this Business Roadmap Strategy template. Designed for clarity and impact, it helps you outline goals, milestones, and timelines in a visual journey. Ideal for team planning, strategy meetings, and pitches. Compatible with PowerPoint, Keynote, and Google Slides for seamless editing.


26 diapositivas
Modern Company Culture Playbook Presentation
A culture playbook is a document or guide that outlines the values, beliefs, behaviors, and norms that define the organizational culture of a company or team. This presentation template is designed to help businesses create and communicate their unique company culture to employees and potential recruits. With a modern and professional design, this presentation provides a comprehensive overview of your company's values, mission, and beliefs, fostering a positive and inclusive work environment. Illustrate your company's vision for the future and its role in shaping a better world, encouraging employees to be part of a meaningful journey.