


Características


¿Tienes alguna pregunta?
Recomendar


6 diapositivas
Capability Gap Analysis Infographic
Gap analysis is a strategic management tool used to compare an organization's current performance or situation with its desired or target state. This infographic template is a visual representation of the process of conducting a capability gap analysis, which is a strategic assessment used to identify the gaps between their current capabilities and the capabilities required to achieve their goals or meet specific objectives. The infographic aims to provide a clear and concise overview of the capability gap analysis process and its key components. Compatible with Powerpoint, Keynote, and Google Slides.


6 diapositivas
Leadership Vision and Strategy Presentation
Present your organization’s goals with this leadership vision and strategy template, designed with a hierarchy graphic to represent team structure and growth. Perfect for strategic planning, leadership meetings, and corporate presentations. Fully editable in Canva, PowerPoint, or Google Slides, making it easy to customize colors, text, and layout to fit your brand.


8 diapositivas
Impressive Business Metrics by Numbers
Highlight your company’s key wins with the Impressive Business Metrics by Numbers Presentation. This data-driven slide layout emphasizes three core metrics using bold numbering, modern icons, and clear titles—perfect for showcasing KPIs, milestones, or achievements. Ideal for reports, pitches, and performance reviews. Fully editable in PowerPoint, Keynote, and Google Slides.


7 diapositivas
Simple Schedule Infographic
Effortlessly structure your time with our simple schedule infographic. Rendered in a clean white canvas, enhanced with dependable blue tones and anchored with timeless black, our template is the epitome of clarity and organization. Equipped with streamlined infographics, universal icons, and adaptable image placeholders, it facilitates easy time management and daily planning. Seamlessly tailored for Powerpoint, Keynote, or Google Slides. A fundamental tool for project managers, event planners, educators, or any professional aiming to efficiently allocate their time. Plan with ease; let every slide bring order to your daily chaos.


6 diapositivas
Bubble Diagram for Idea Development
Streamline your brainstorming sessions and visualize concept progression with this Bubble Diagram for Idea Development presentation. Featuring a circular, color-coded layout from A to F, it’s ideal for mapping interconnected ideas, workflows, or innovation cycles. Easily editable in PowerPoint, Keynote, and Google Slides.


7 diapositivas
Supply Chain Process Mapping Presentation
Streamline your logistics and operations presentations with the Supply Chain Process Mapping Presentation. Featuring a linked-chain visual, this editable template is ideal for outlining each step in your supply flow—from sourcing to delivery. Highlight dependencies, bottlenecks, or key stages with customizable color coding. Fully compatible with PowerPoint, Keynote, and Google Slides.


6 diapositivas
Regional Finance Infographic
Regional finance plays a vital role in fostering economic growth, attracting investments, and improving the overall well-being of communities within a specific region. This infographic template focuses on financial trends, insights, and data related to specific regions or countries. It is designed to help businesses, organizations, or financial professionals analyze and understand the financial landscape of a particular region. The data-driven content in this template is suitable for businesses or individuals seeking insights to make informed decisions regarding investments, market entry, or financial planning in a specific region.


26 diapositivas
Wok Presentation Template
Want to learn about popular Chinese dishes? Wok is a fun and colorful template made for you. It includes all the essential elements of a food related template: fresh ingredients and vibrant colors. Wok was developed to meet the needs of those who want to promote their business with a clean and organized design. It has easy editing features making it simple to customize by adding company logos and other relevant details. The template is responsive, which means that it will adapt its layout based on how the user wants it displayed. This makes it easy to access the site from wherever you may be.


8 diapositivas
Card Services Comparison Layout Presentation
Highlight key differences in financial products with this Card Services Comparison Layout Presentation. Featuring a sleek smartphone-centered design, this template allows you to clearly compare up to three card types or financial service features. Perfect for fintech presentations, banking pitches, or product feature breakdowns. Fully customizable in PowerPoint, Keynote, and Google Slides.


4 diapositivas
Insurance Business Overview Presentation
Bring clarity and professionalism to your financial presentations with this sleek and modern design. Ideal for outlining key insights, policies, or service breakdowns, it visually communicates business protection and stability. Fully customizable and compatible with PowerPoint, Keynote, and Google Slides for an engaging and polished presentation experience.
24 diapositivas
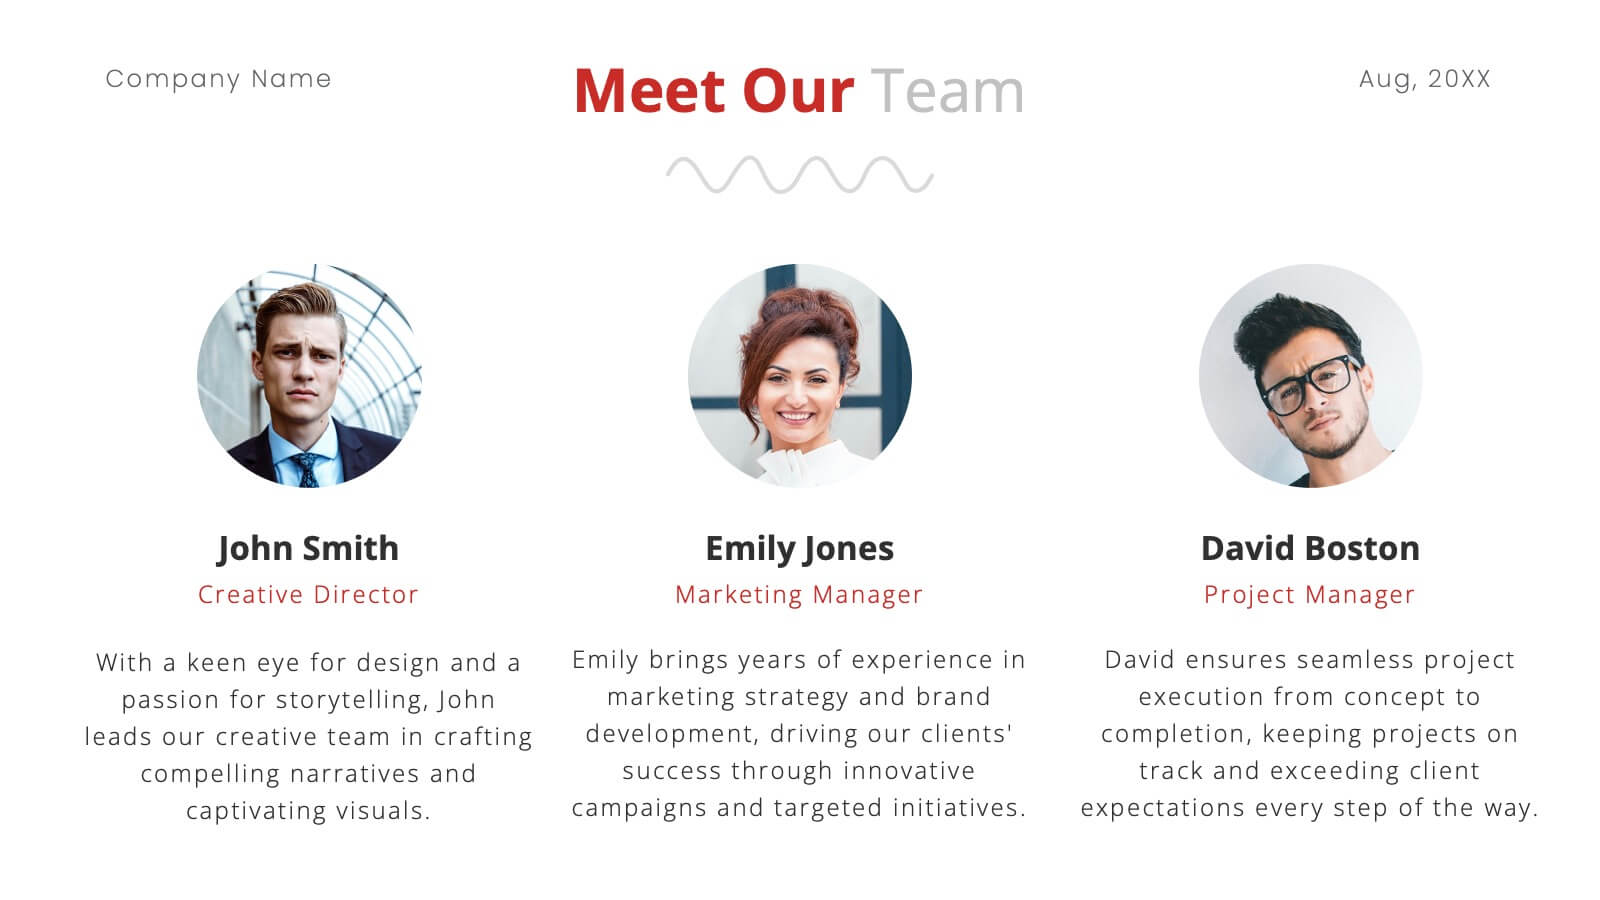
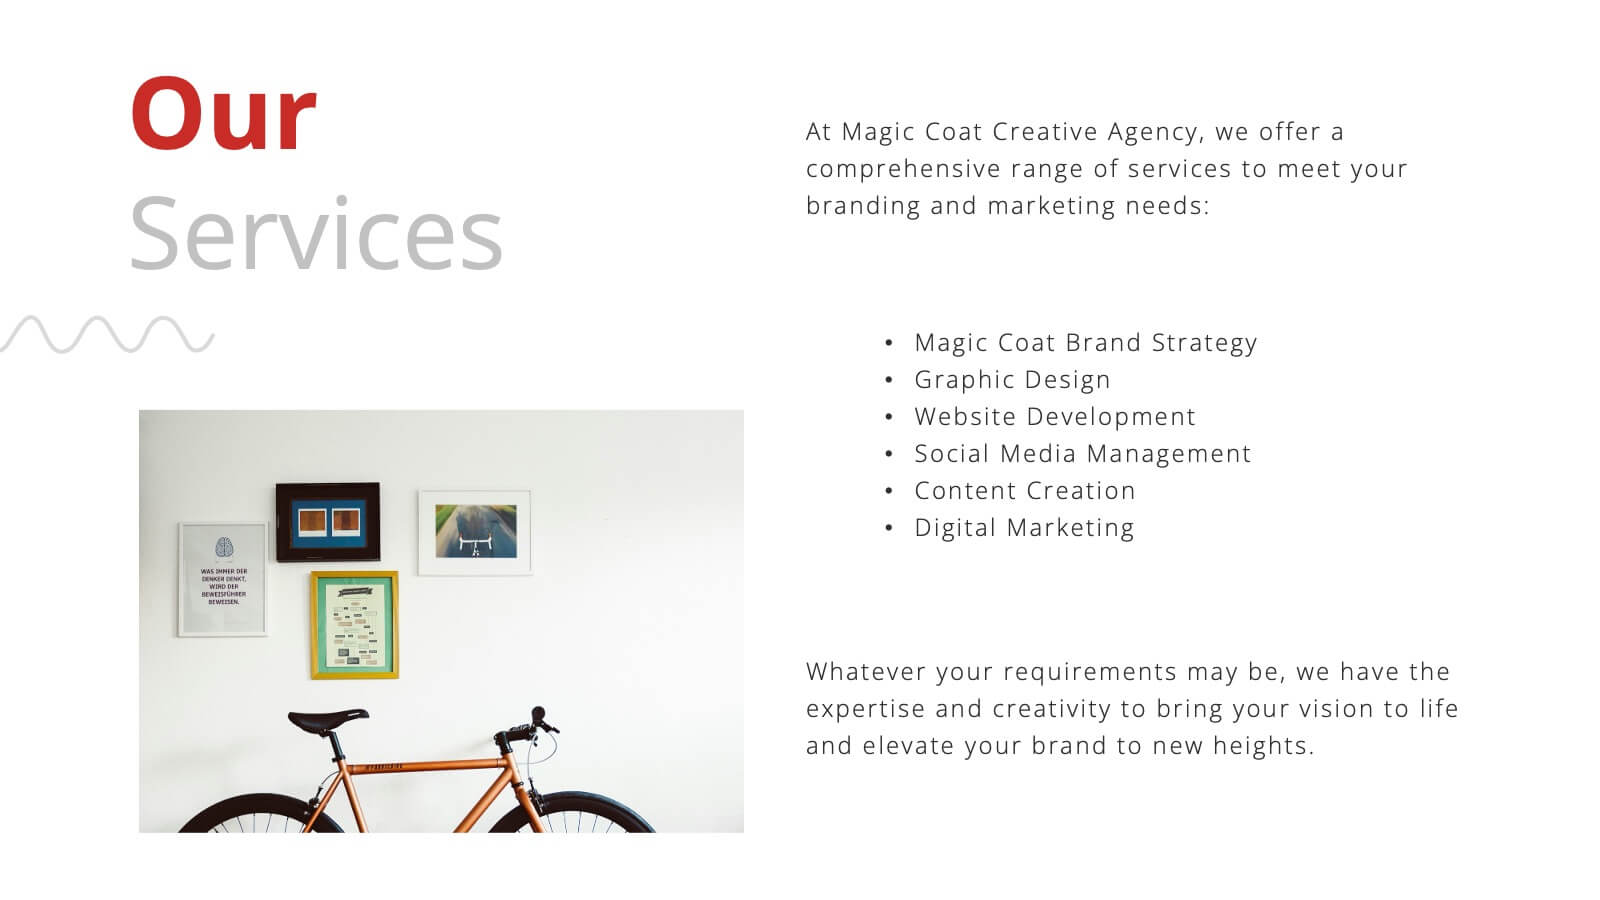
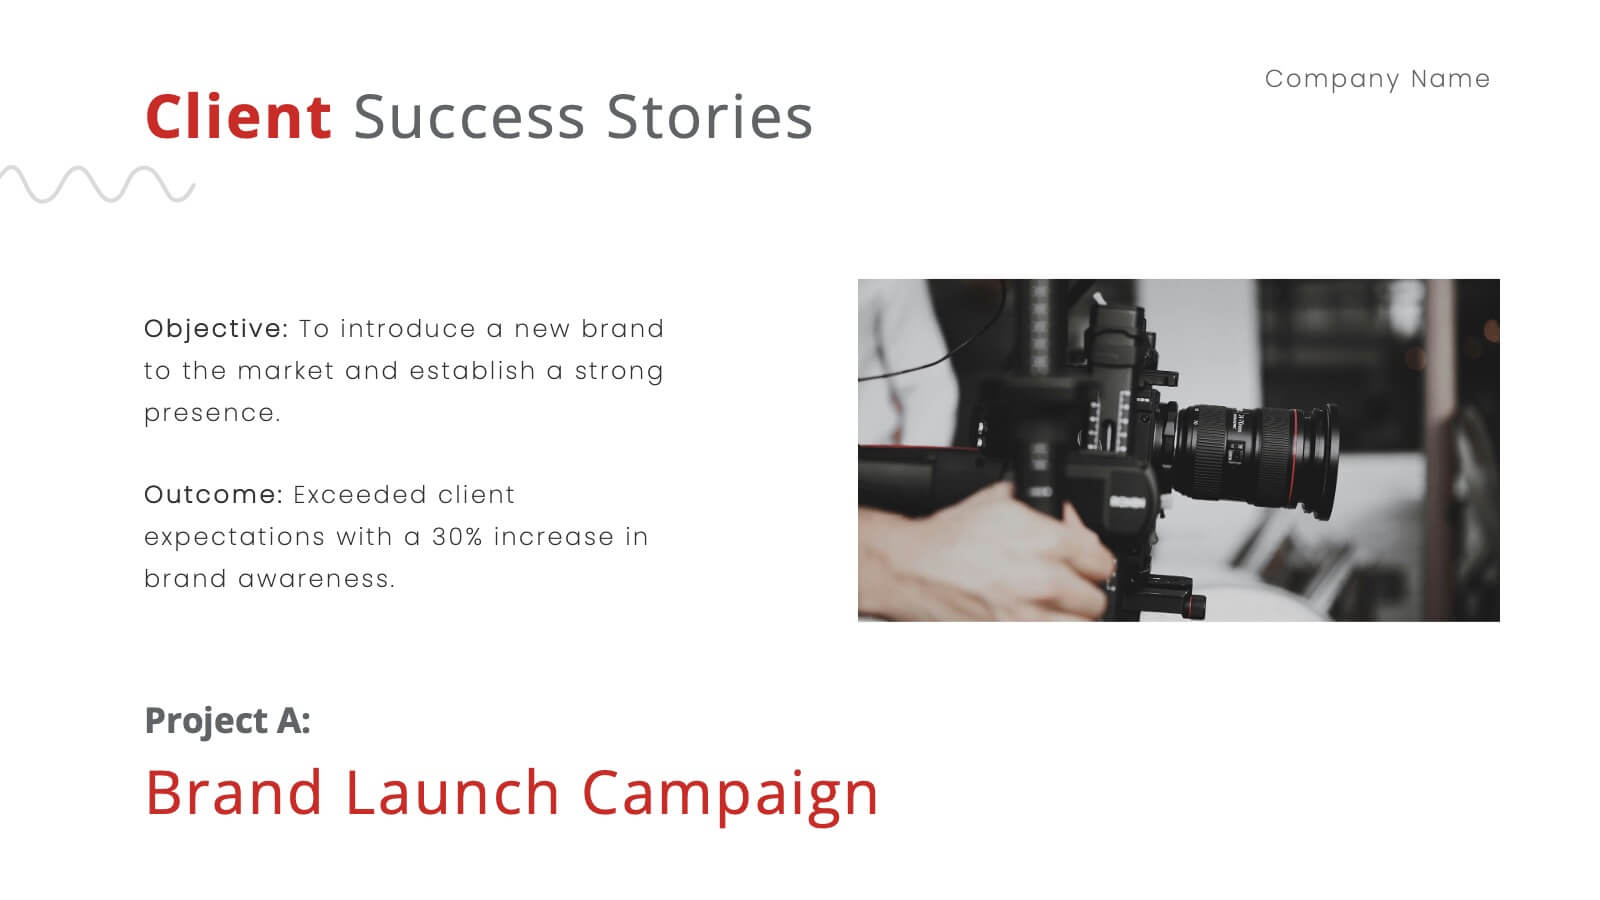
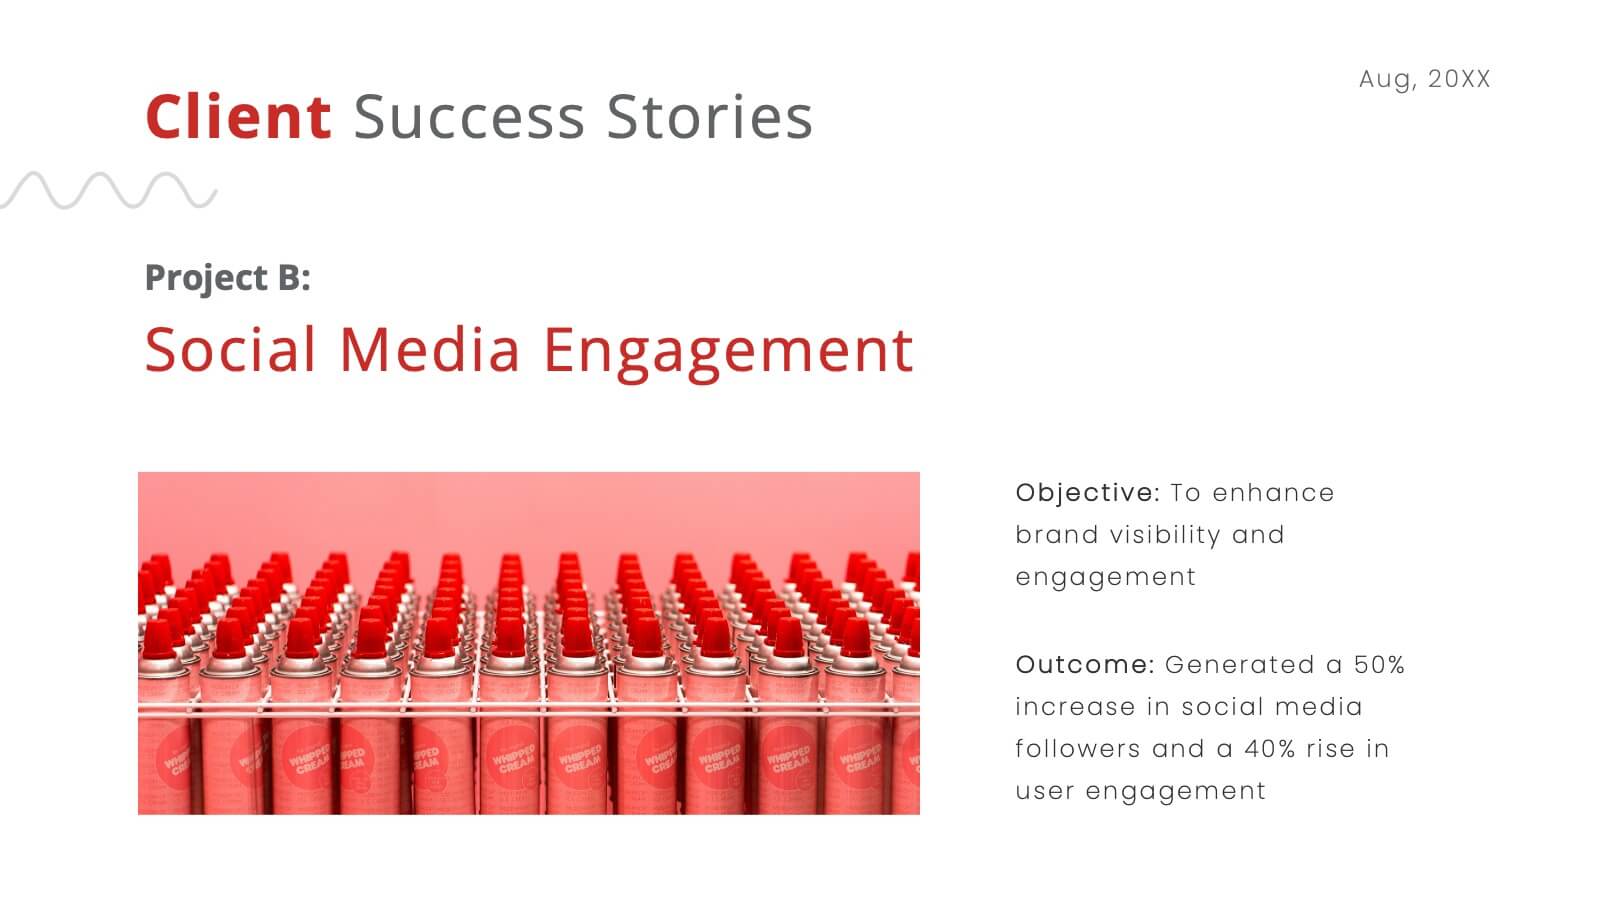
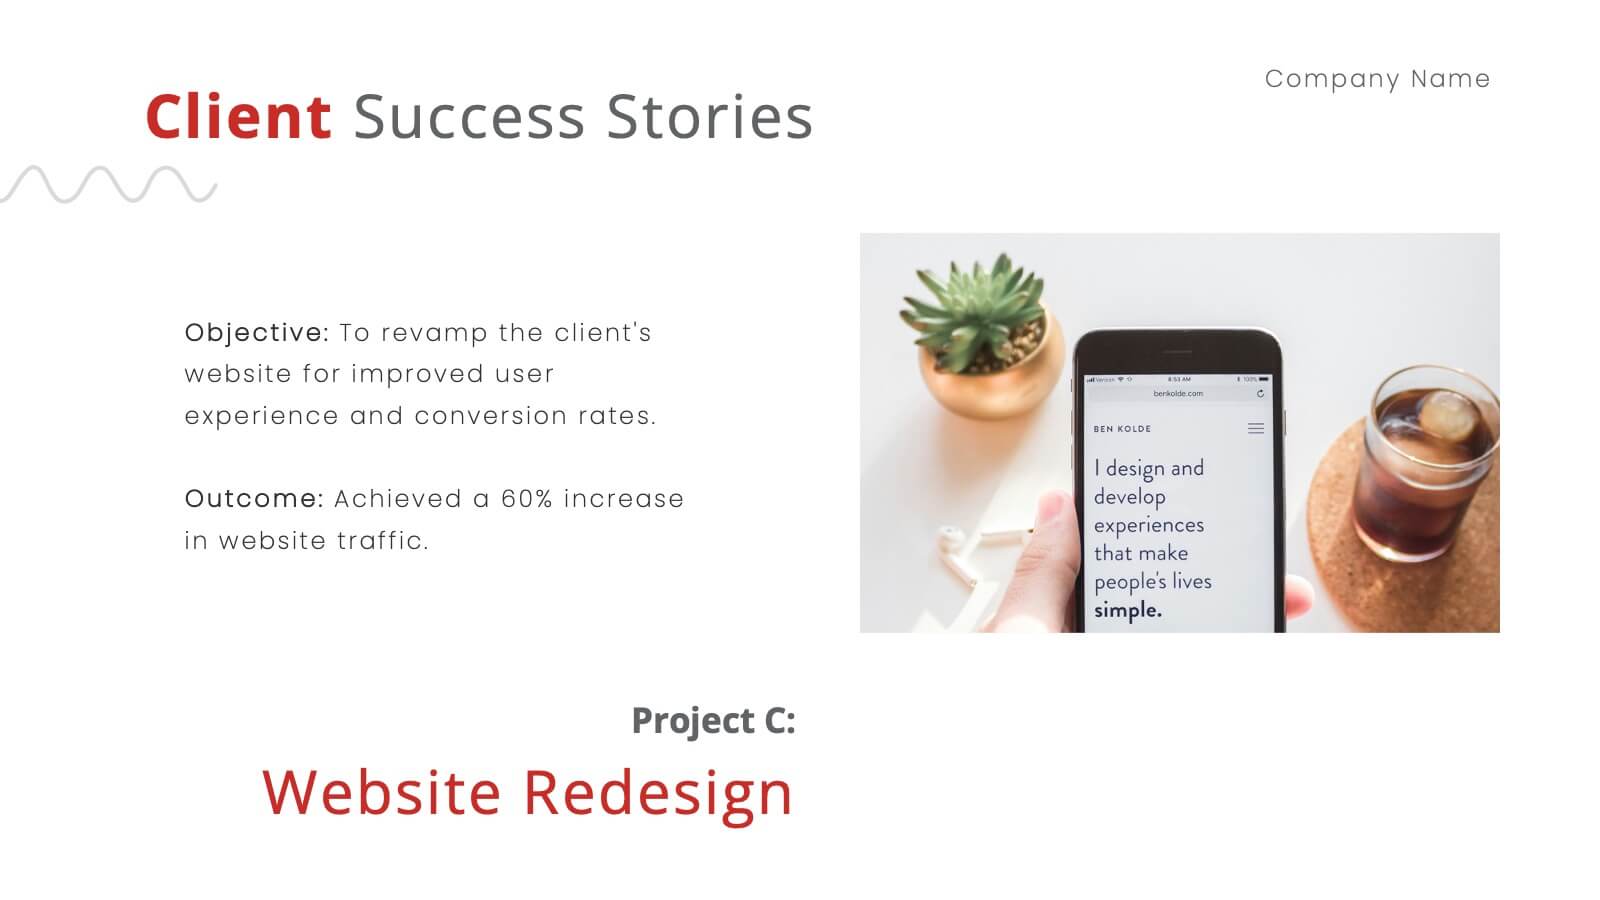
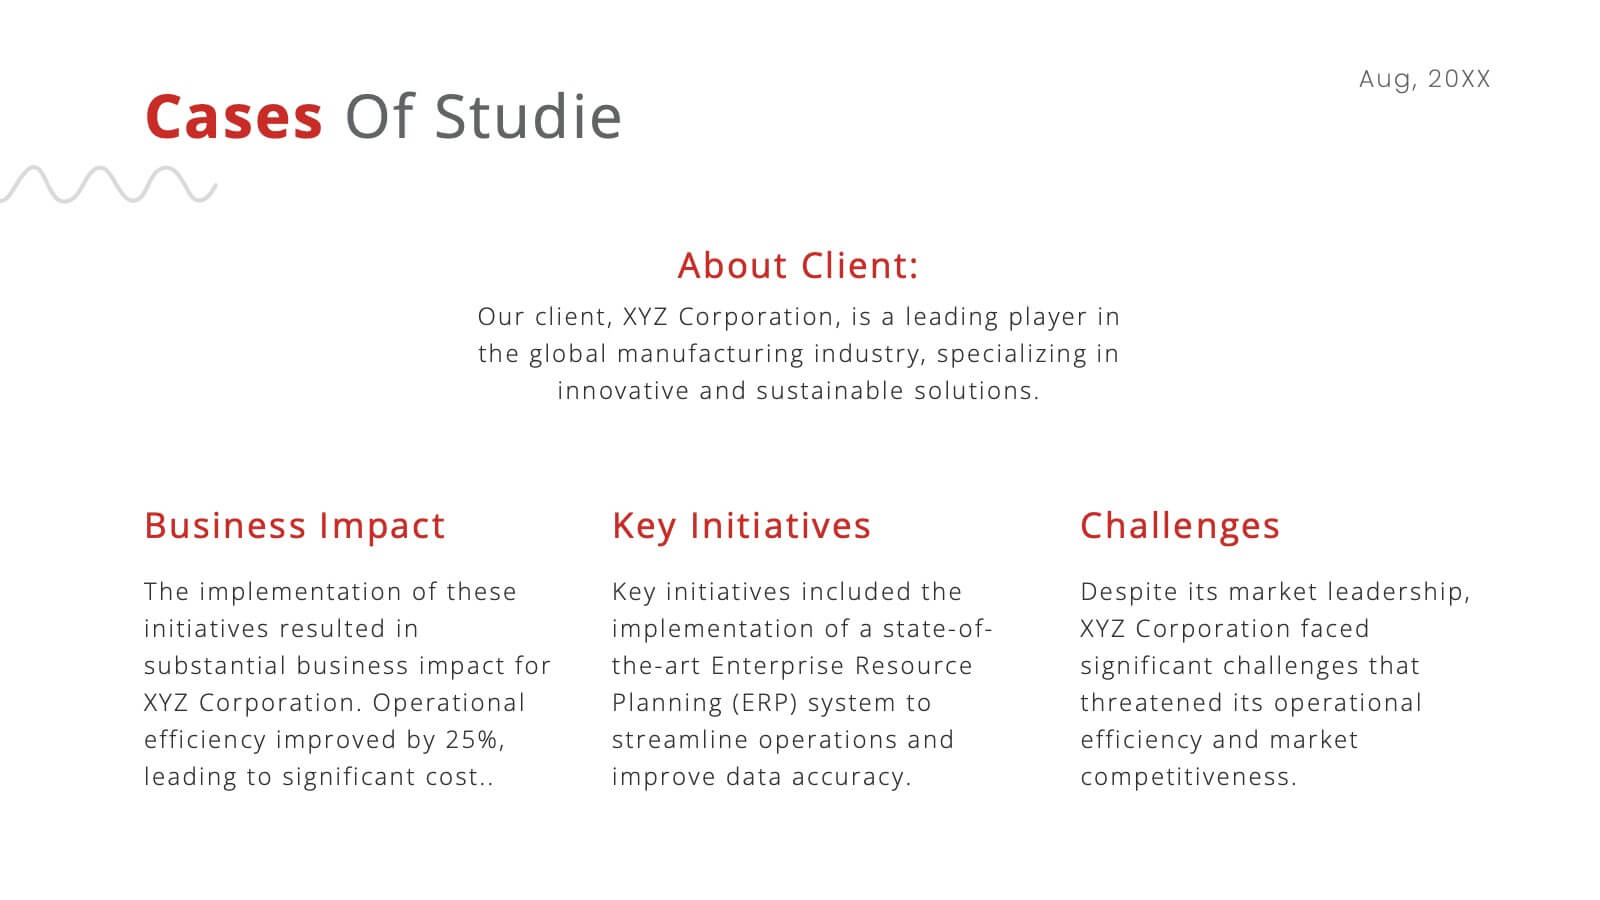
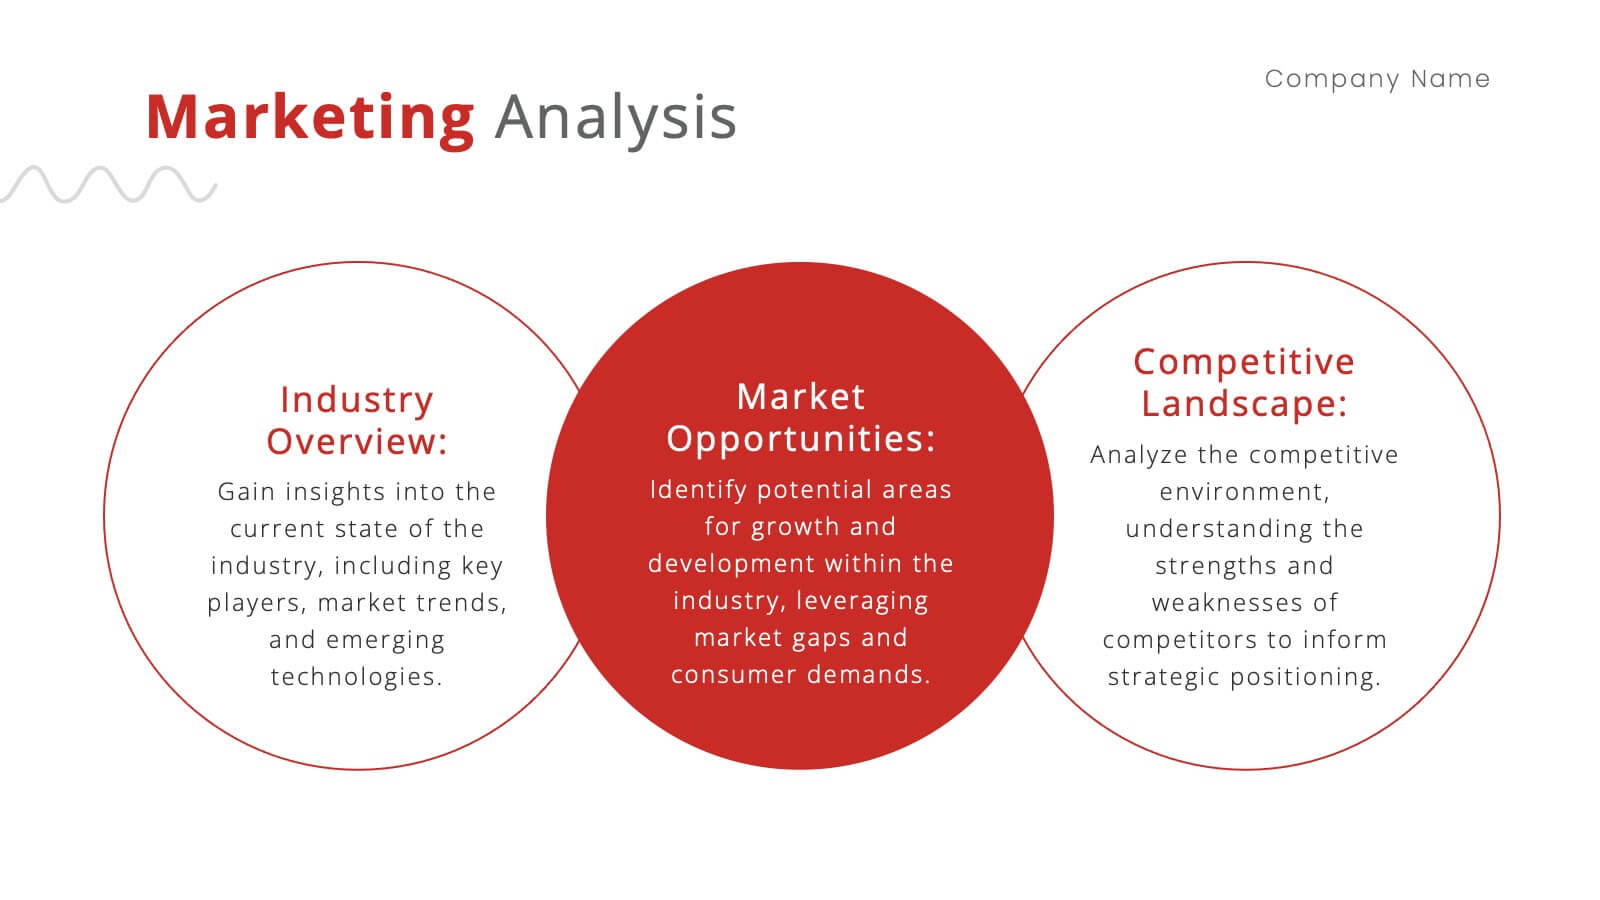
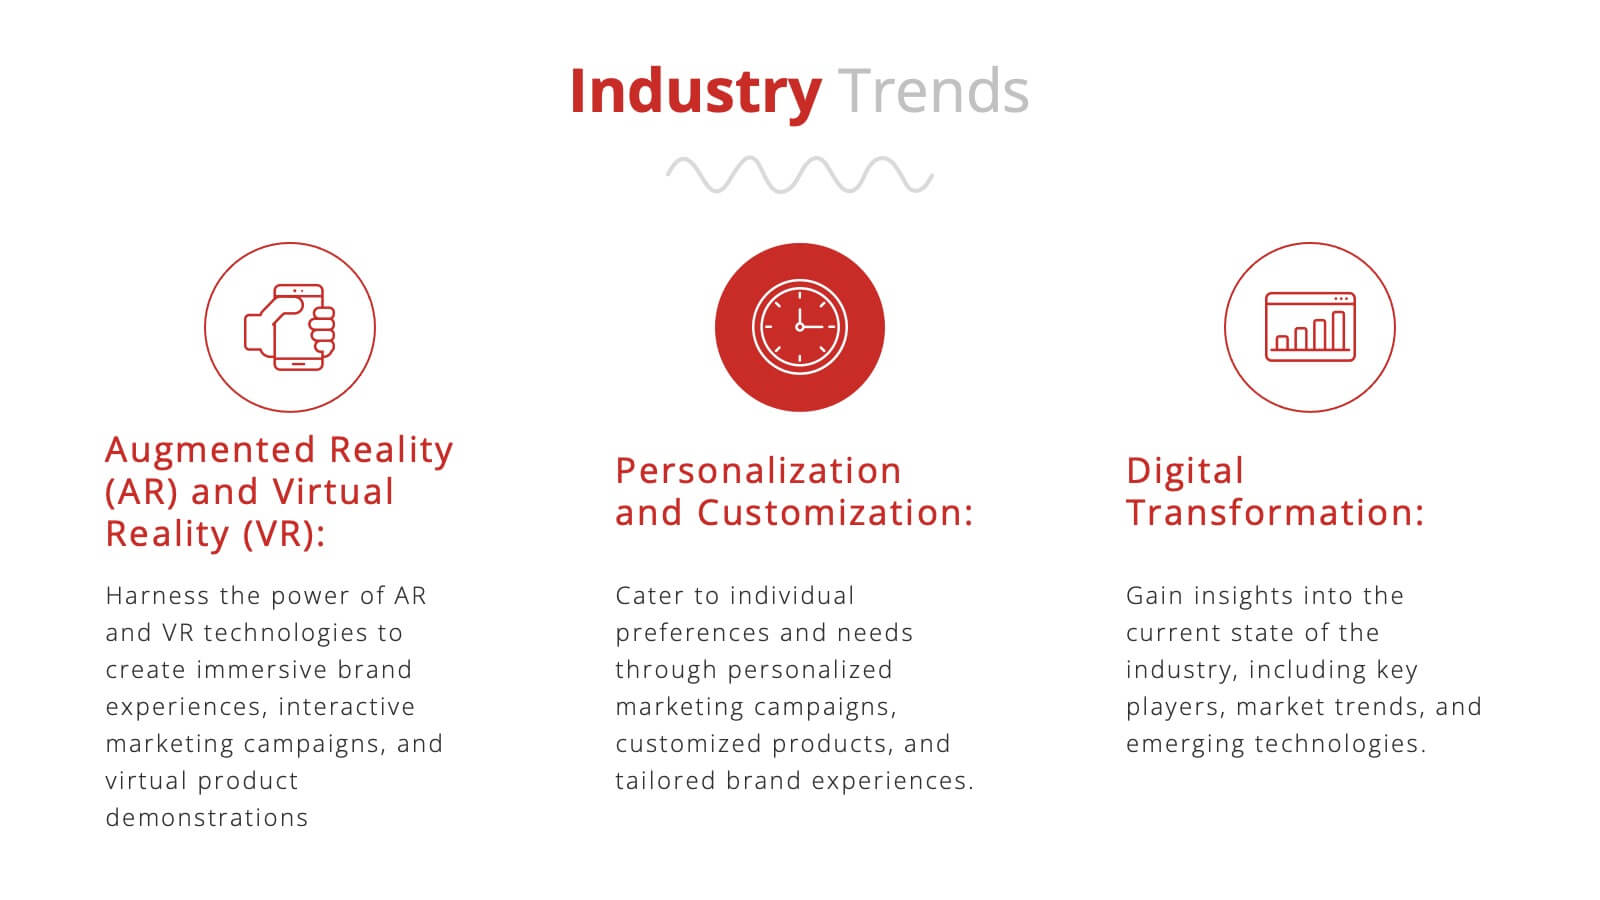
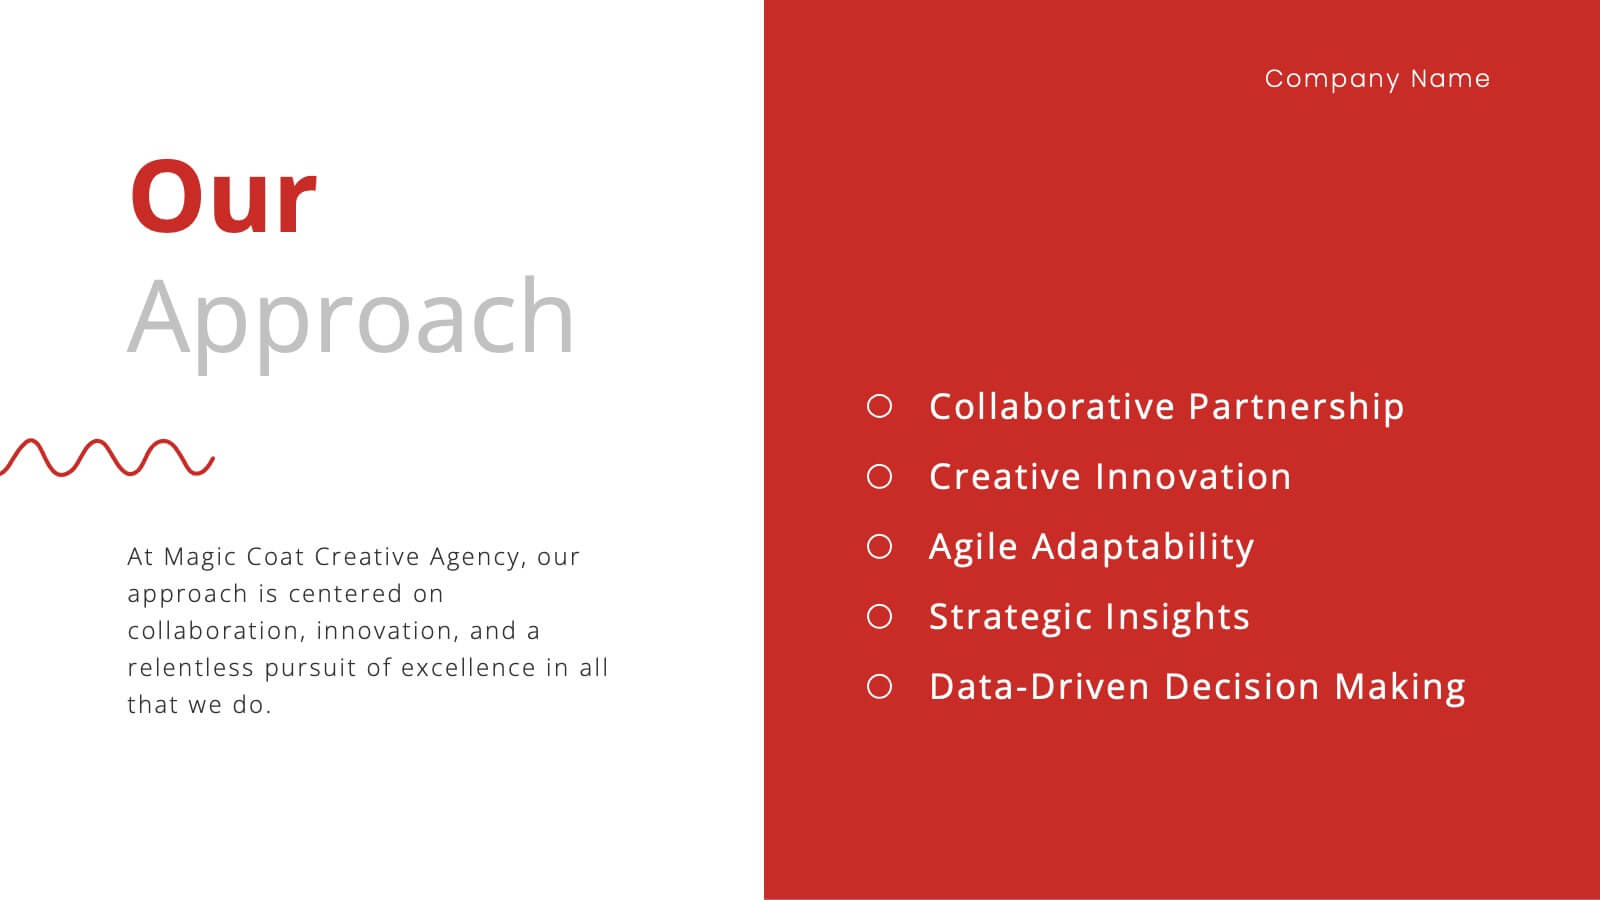
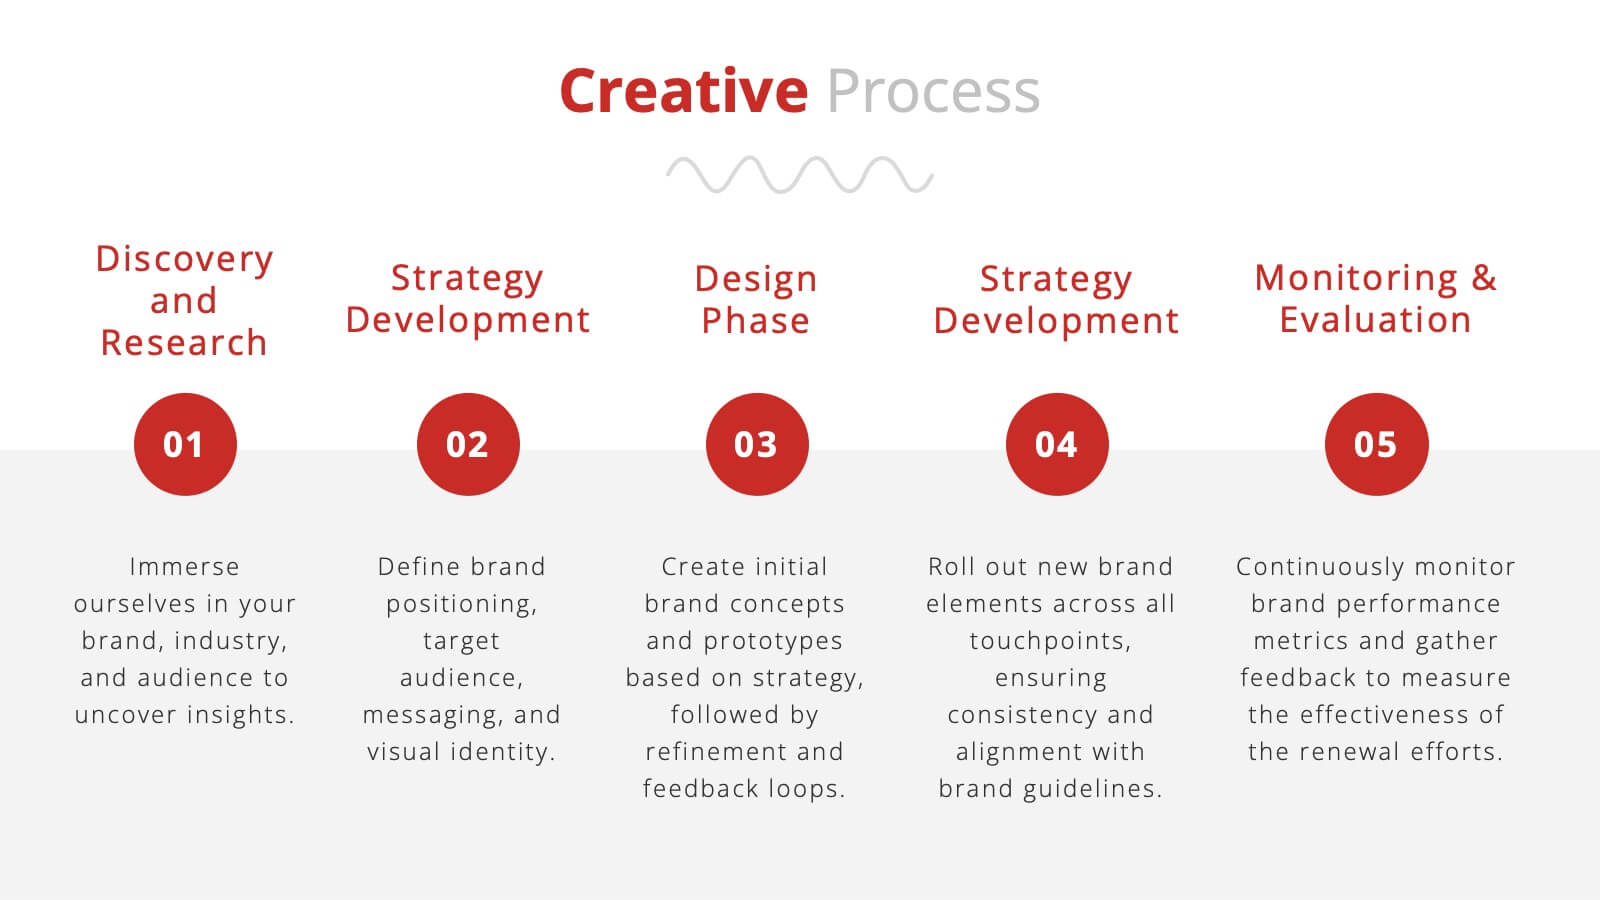
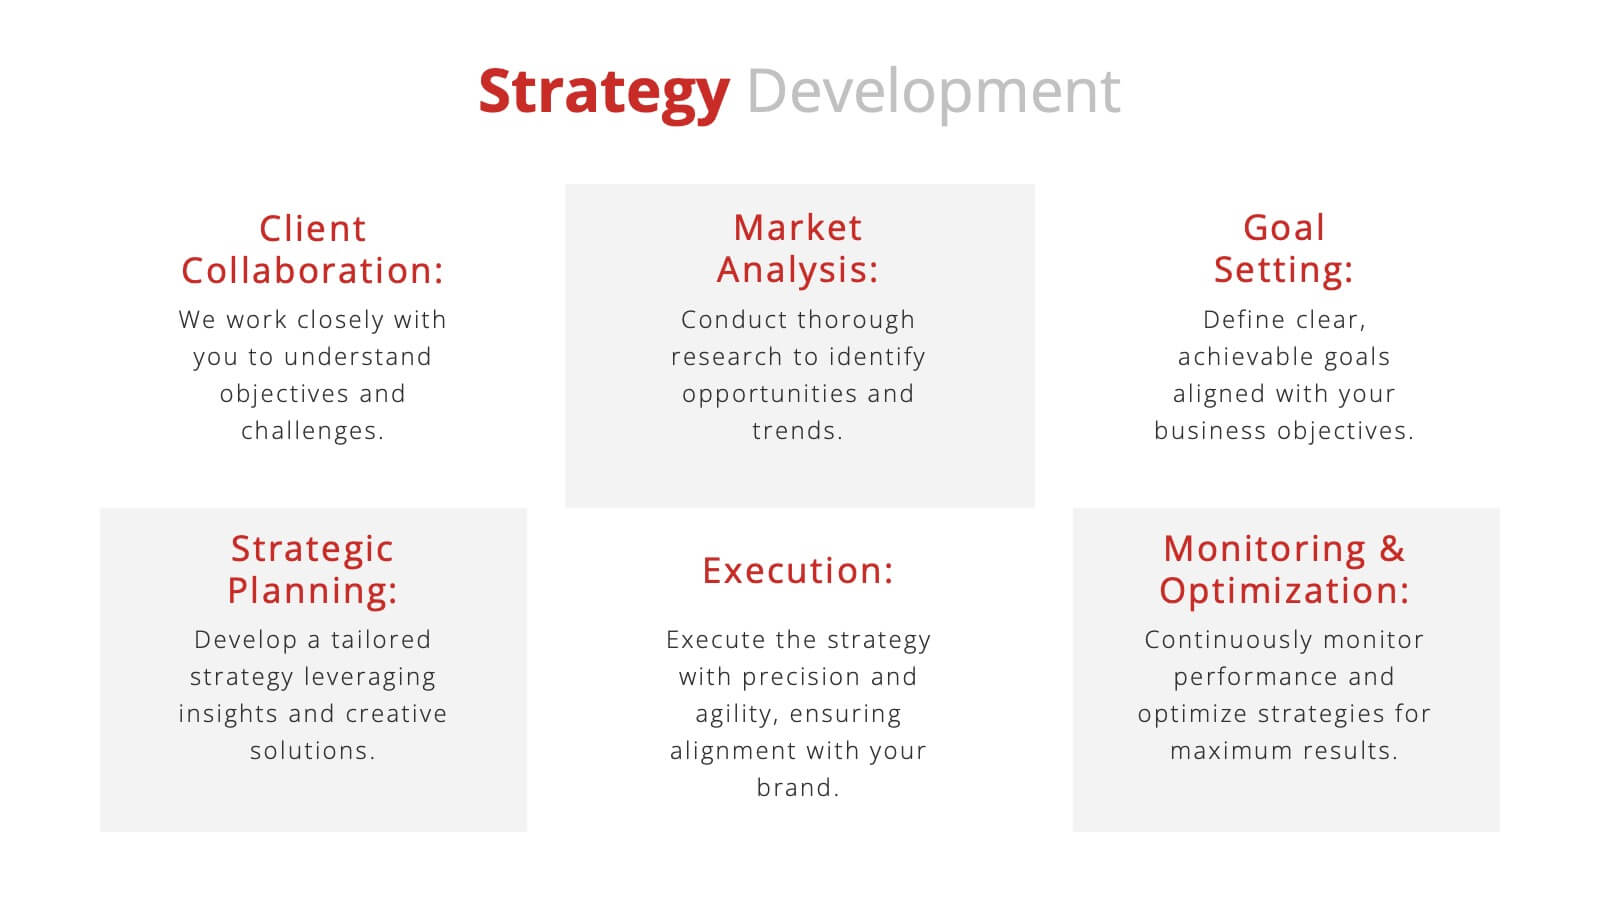
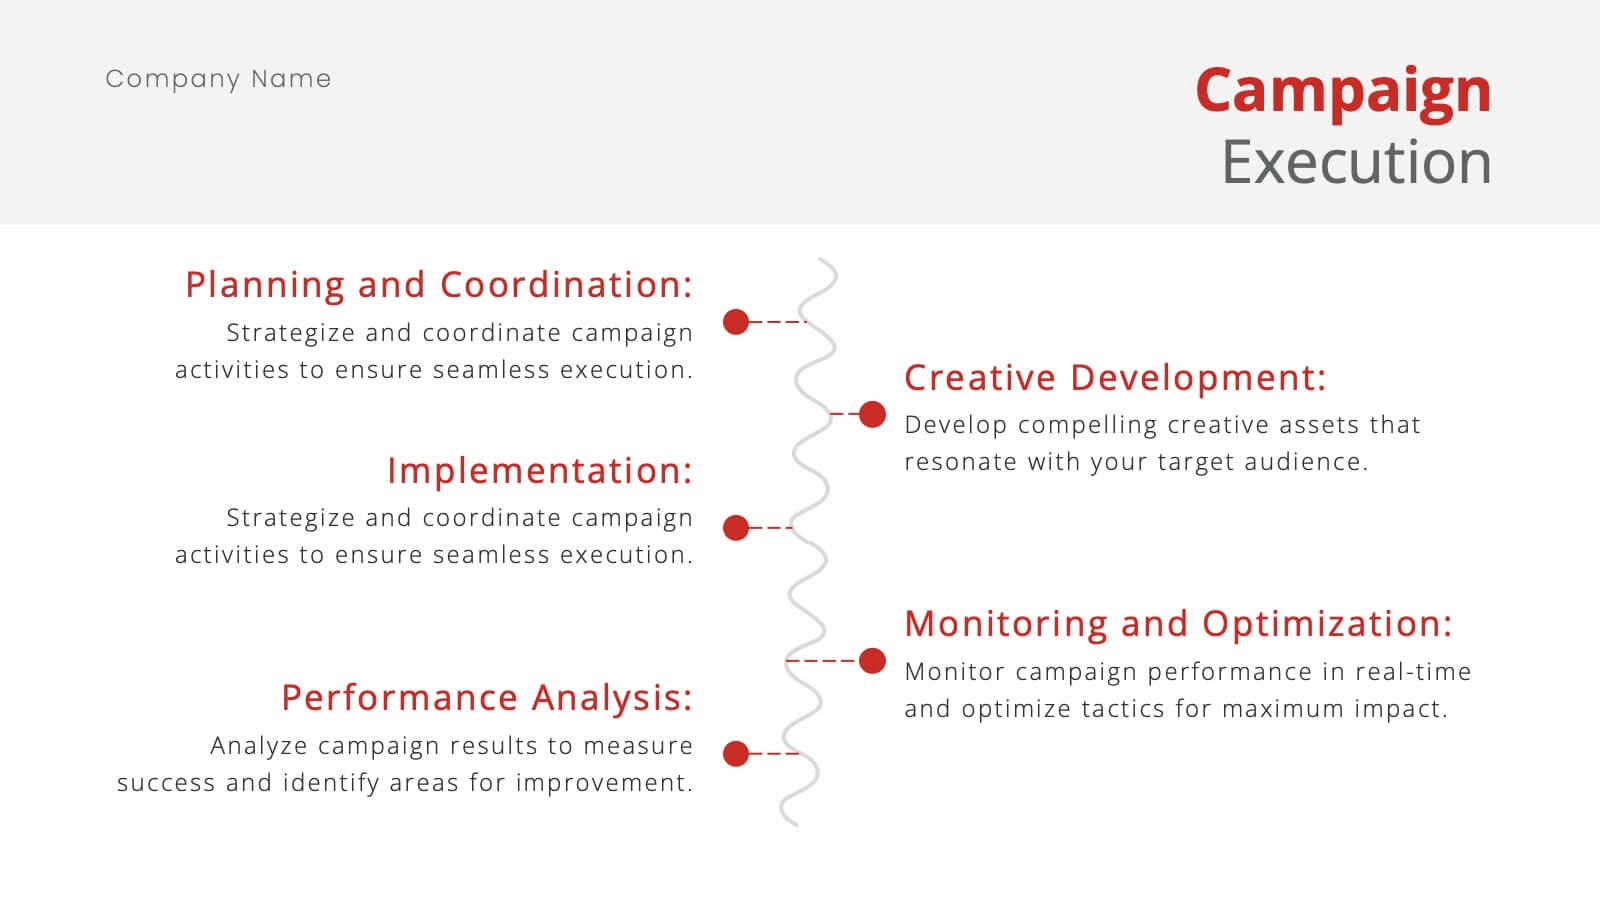
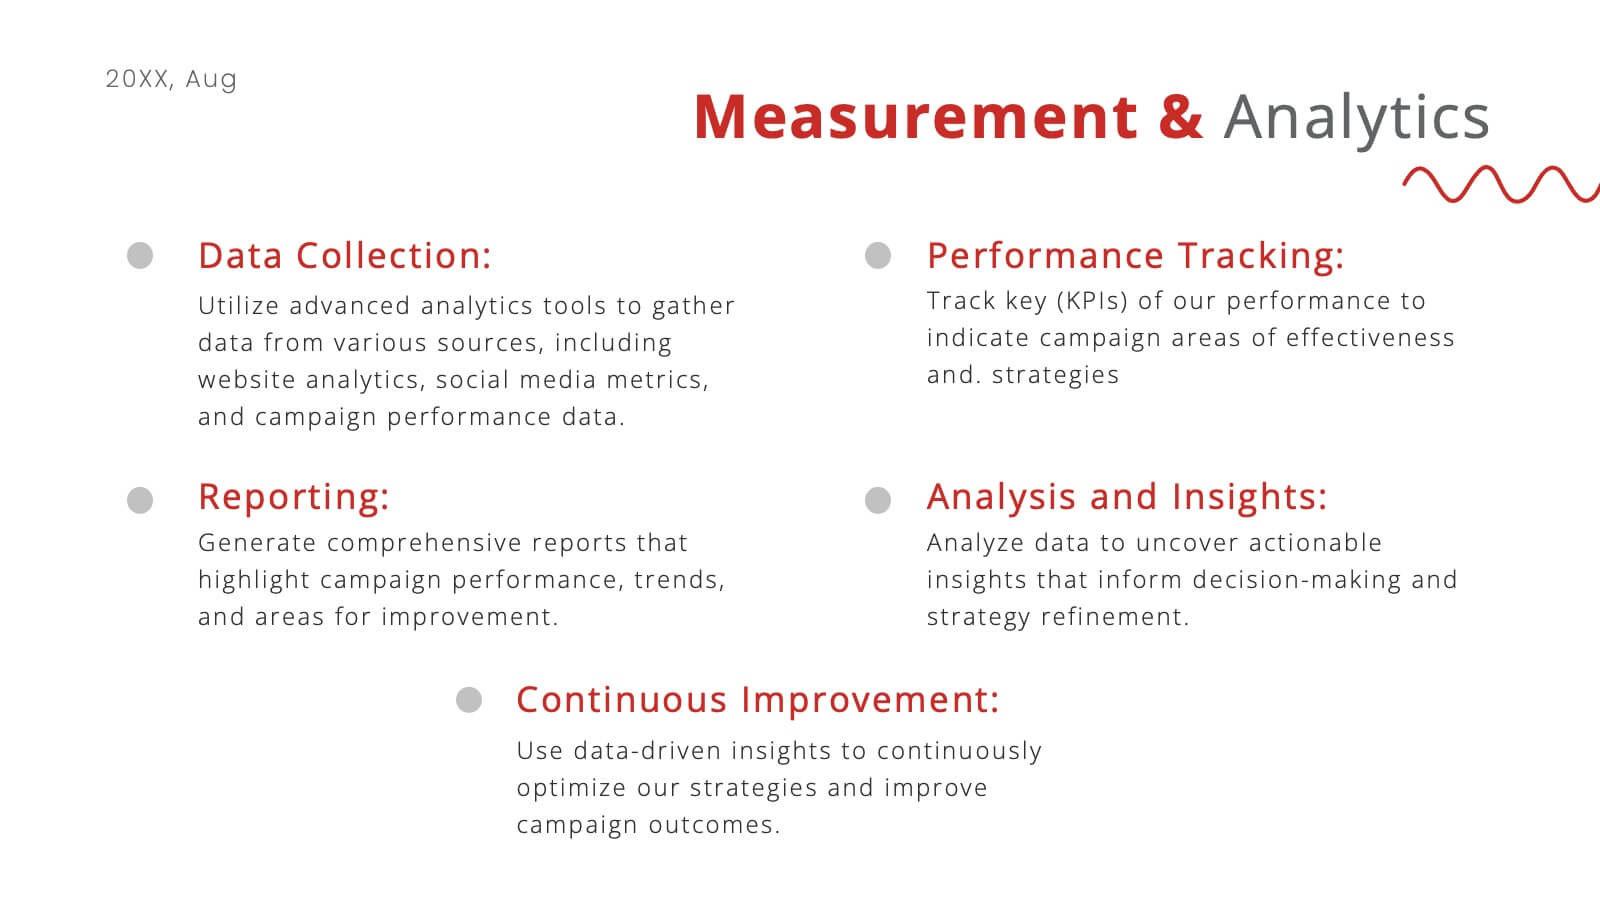
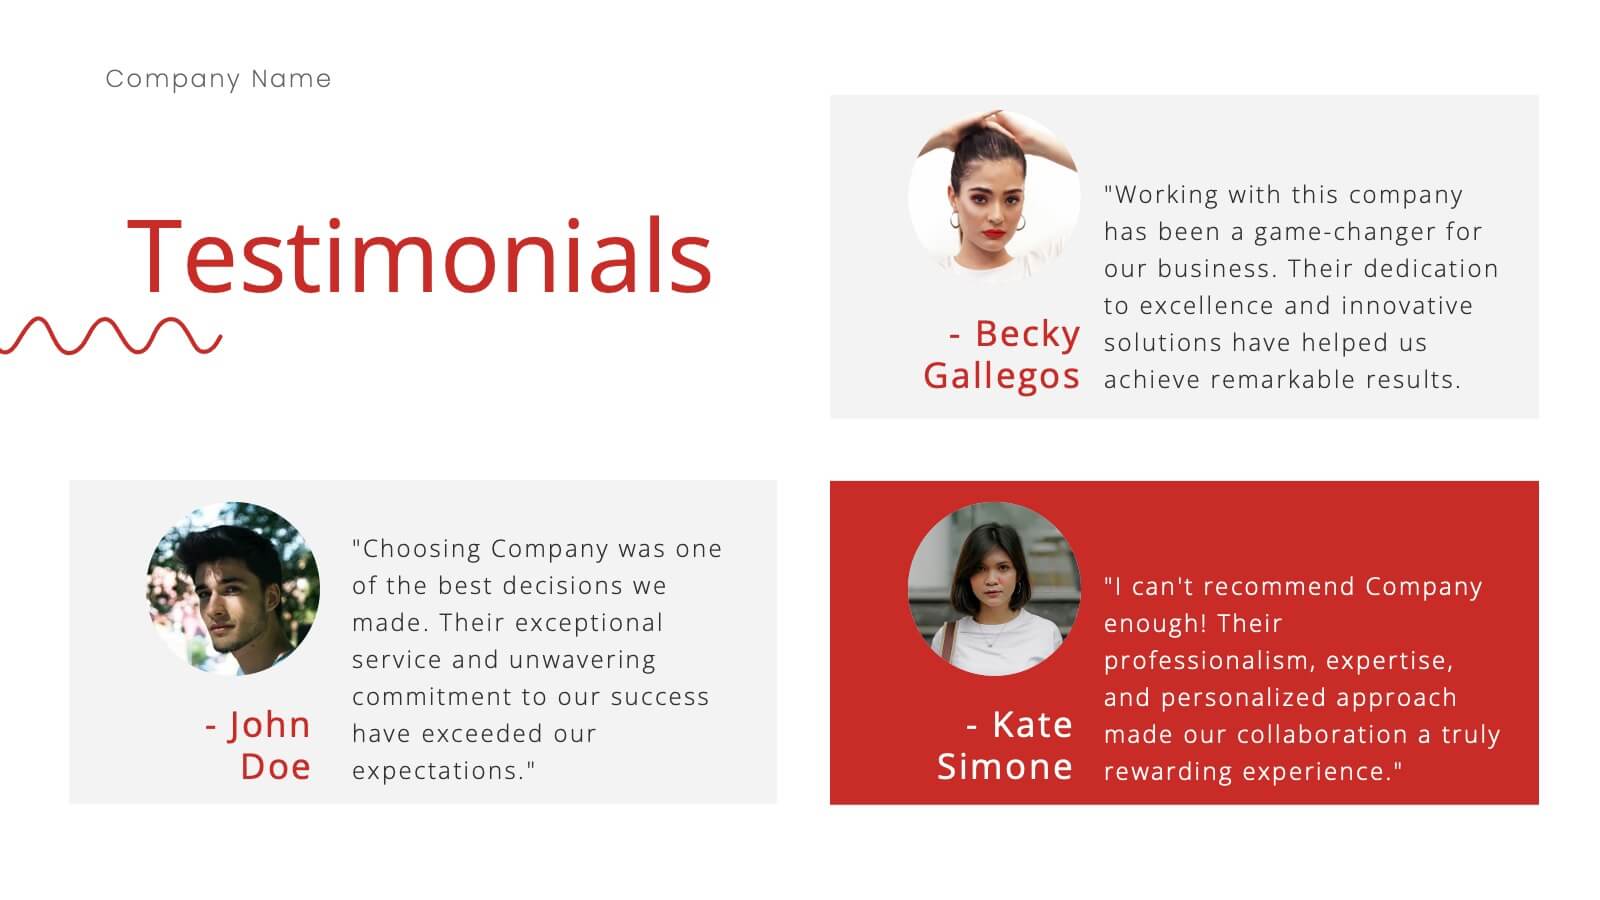
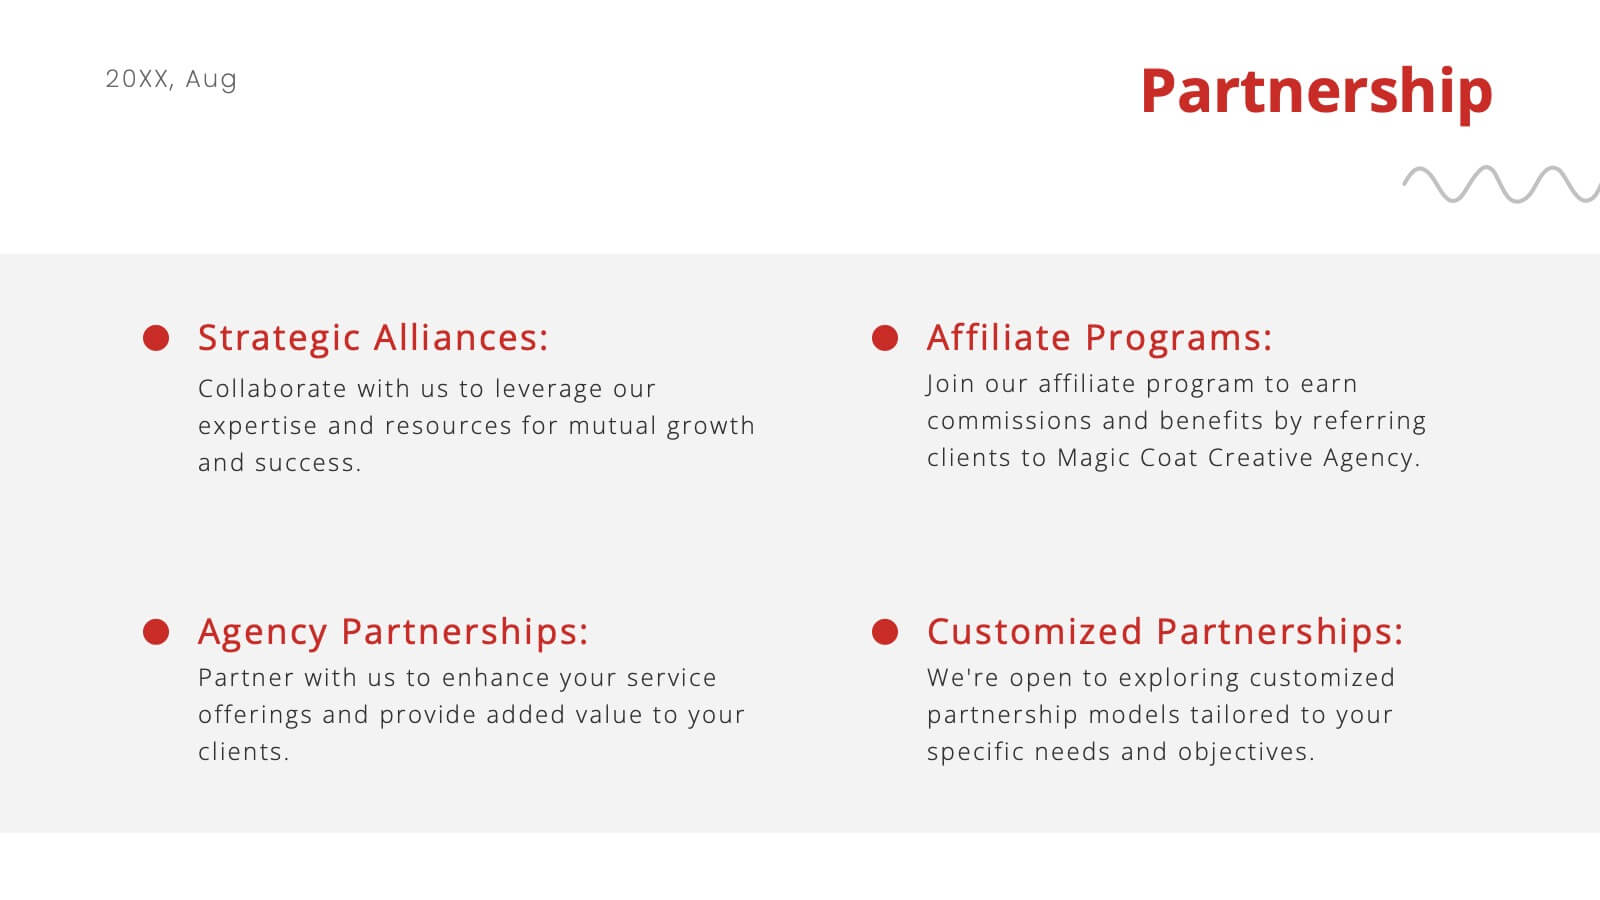
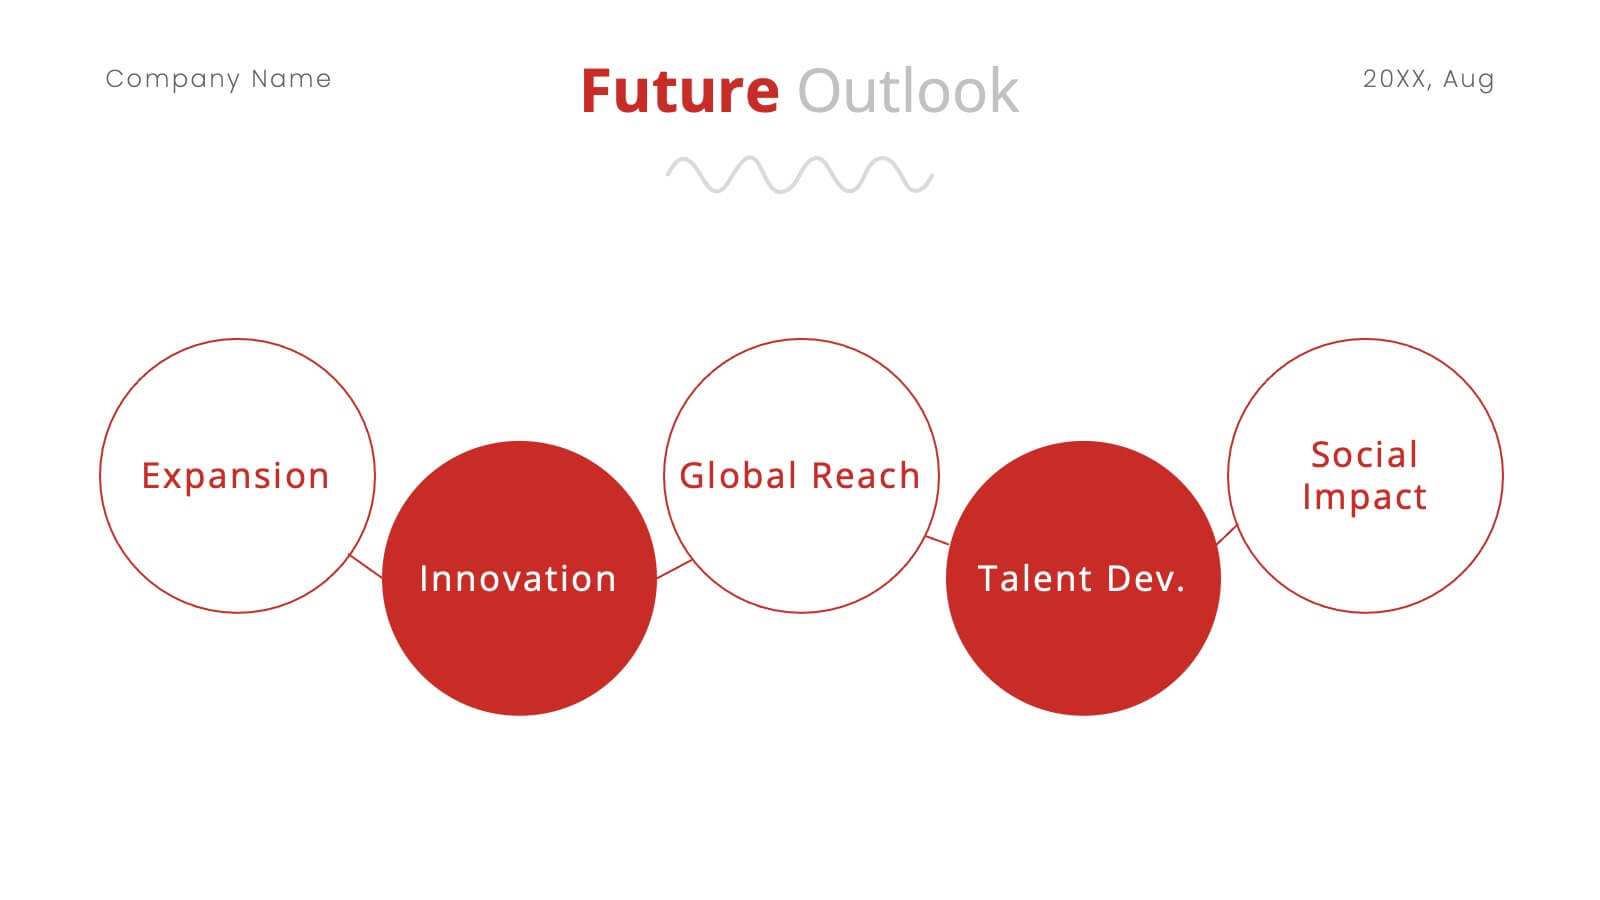
Nickel Advertising Agency Proposal Presentation
Take your advertising agency to the next level with this sleek and modern presentation template! Highlighting your services, team, success stories, and marketing strategies, it’s the perfect tool to showcase your agency’s strengths and capabilities. Fully customizable and compatible with PowerPoint, Keynote, and Google Slides, this template is ideal for impressing potential clients and partners.


6 diapositivas
Environmental Policy and Sustainability Plan Presentation
Bring your sustainability message to life with a visual that flows as smoothly as your plan. This infographic presentation template helps explain your environmental goals, action steps, and policy structure using a dynamic, easy-to-follow circular layout. Perfect for eco reports and green strategy briefs. Compatible with PowerPoint, Keynote, and Google Slides.


8 diapositivas
Geographic South America Template Presentation
Explore your data through a clean, professional map that highlights key insights and regional details across South America. Ideal for presenting demographics, business distribution, or performance metrics, this design combines clarity with impact. Fully compatible with PowerPoint, Keynote, and Google Slides for easy editing and seamless presentation.


4 diapositivas
Concentric Circles Business Model
Bring your ideas full circle—literally—with this bold and colorful diagram layout! This infographic template is ideal for presenting layered concepts, interconnected systems, or customer journeys using a visually engaging concentric circle design. It’s fully customizable and works seamlessly in PowerPoint, Keynote, and Google Slides for a polished, professional look.


4 diapositivas
Collaborative Team Workflow Presentation
Visualize seamless collaboration with the Collaborative Team Workflow Presentation. This slide design features team icons, branching layouts, and a clean structure to showcase group dynamics and process flow. Perfect for teamwork strategies, HR initiatives, or cross-functional planning. Fully editable in PowerPoint, Keynote, and Google Slides for tailored communication.


4 diapositivas
Customer Type Identification Strategy Deck Presentation
Visualize your customer segmentation strategy with this layered targeting slide. Perfect for identifying different customer types based on behavior or loyalty levels, this layout uses a human silhouette and concentric zones to highlight proximity to the core user. Fully editable and compatible with PowerPoint, Keynote, and Google Slides.


5 diapositivas
Health Awareness Campaign Presentation
Bright and uplifting, this slide brings awareness to important health causes through a clean ribbon-focused layout that’s easy to read and visually engaging. It helps present key messages, statistics, or campaign steps clearly while keeping the design calm and supportive. Fully compatible with PowerPoint, Keynote, and Google Slides.