


Características


¿Tienes alguna pregunta?
Recomendar


7 diapositivas
Communication Skills Infographics
Effective communication skills are essential in every aspect of life, including personal relationships, professional relationships, and societal interactions. This template provides you with a great resource for presenting your communication skills. This can help you present your ideas in an effective way. This template features customizable slide designs and graphics allowing you plenty of room to add your own content. The format makes this presentation easy to follow and understand visually as it focuses on what are the most important aspects of delivering effective communication skills.


7 diapositivas
Social Media Management Infographic Presentation
Social media is an important part of any business, which is why you need the right tools to stay organized, save time, and boost your productivity. With the template you can design a fun infographic for your presentations, blog posts and social media posts. This is a great way to present Social Media Management topics including: marketing strategy, content creation, engagement, and growth. This template is compatible with Keynote, PowerPoint and Google Slides, so you can customize it in seconds. Download this template, and show your audience how social media can help their business grow!


6 diapositivas
Industry Analysis with Porter's Forces Presentation
The Industry Analysis with Porter's Forces Presentation offers a clean and strategic layout for visualizing competitive dynamics. This deck illustrates the five forces—Buyers, Suppliers, Competitors, Substitutions, and New Entry—in a semi-circular flow that makes relationships easy to understand. Each force is paired with editable text and icons for clarity. Ideal for market research, business strategy, or consulting work. Fully compatible with PowerPoint, Keynote, and Google Slides.


5 diapositivas
Leadership and Workforce Culture
Inspire growth from the ground up with this bold, step-by-step visual that captures the journey of leadership and team development. From culture-building to individual progress, this layout helps you illustrate each stage clearly and confidently. Fully compatible with PowerPoint, Keynote, and Google Slides.

22 diapositivas
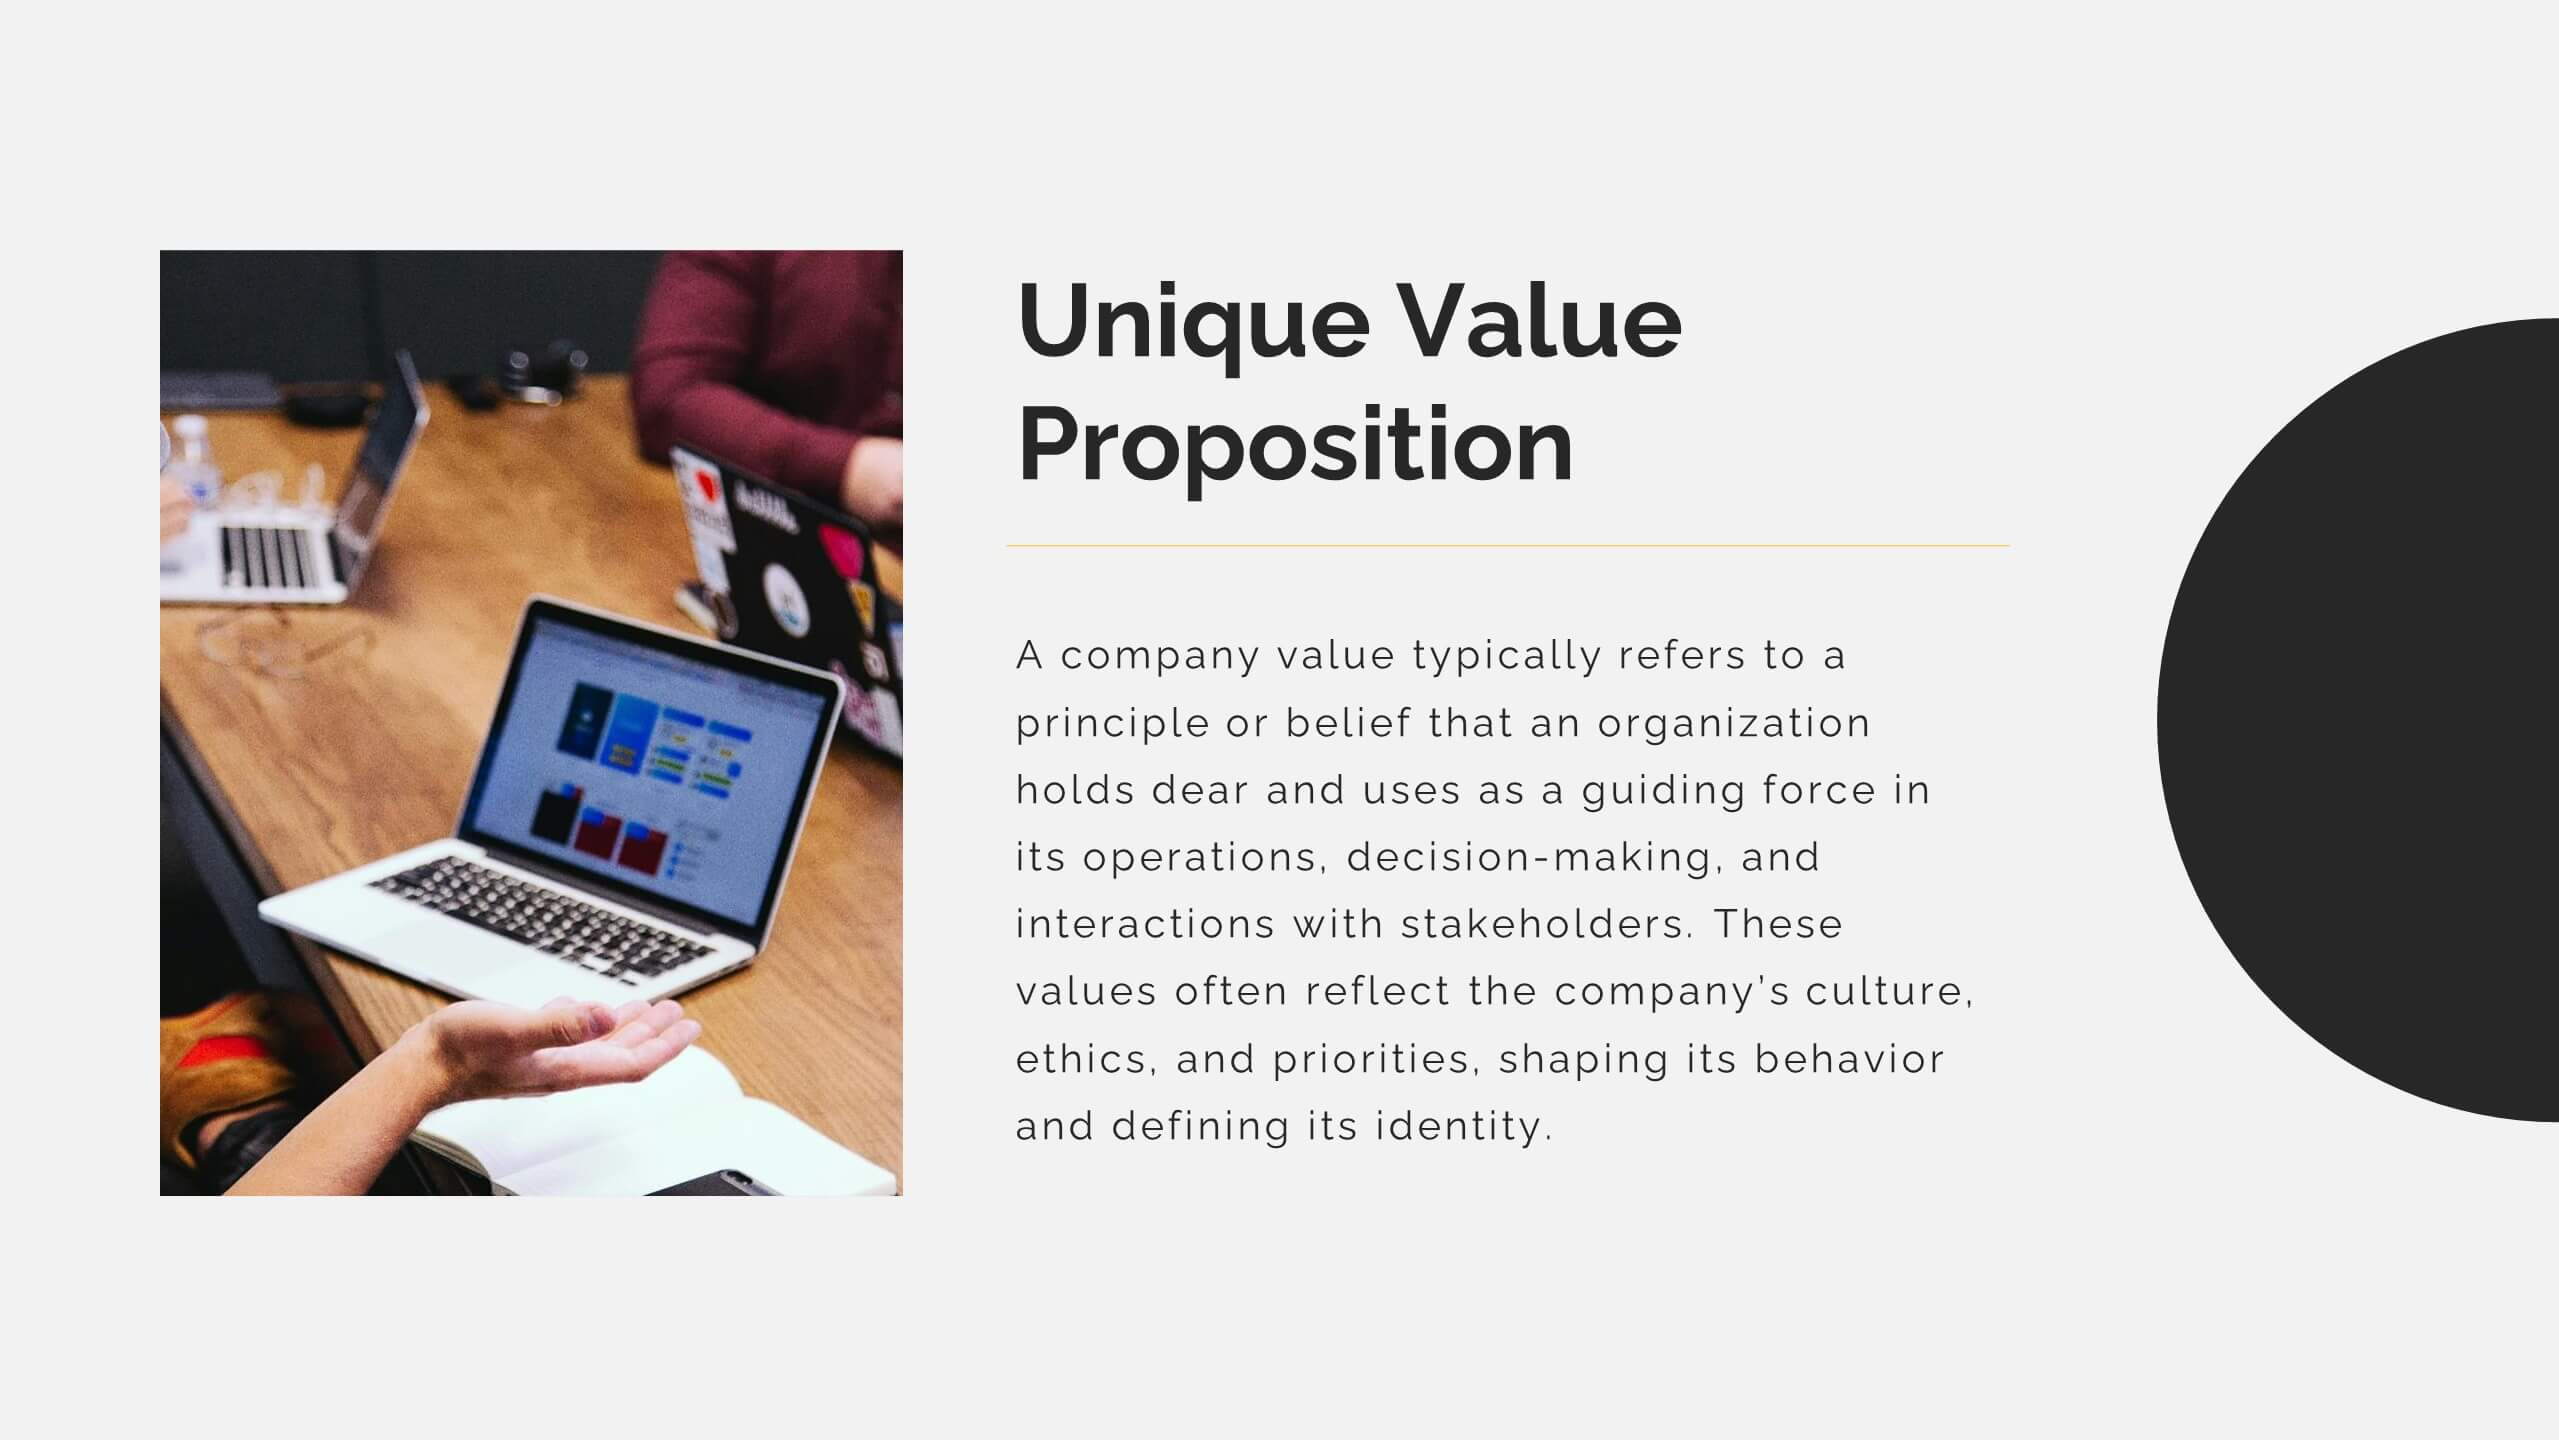
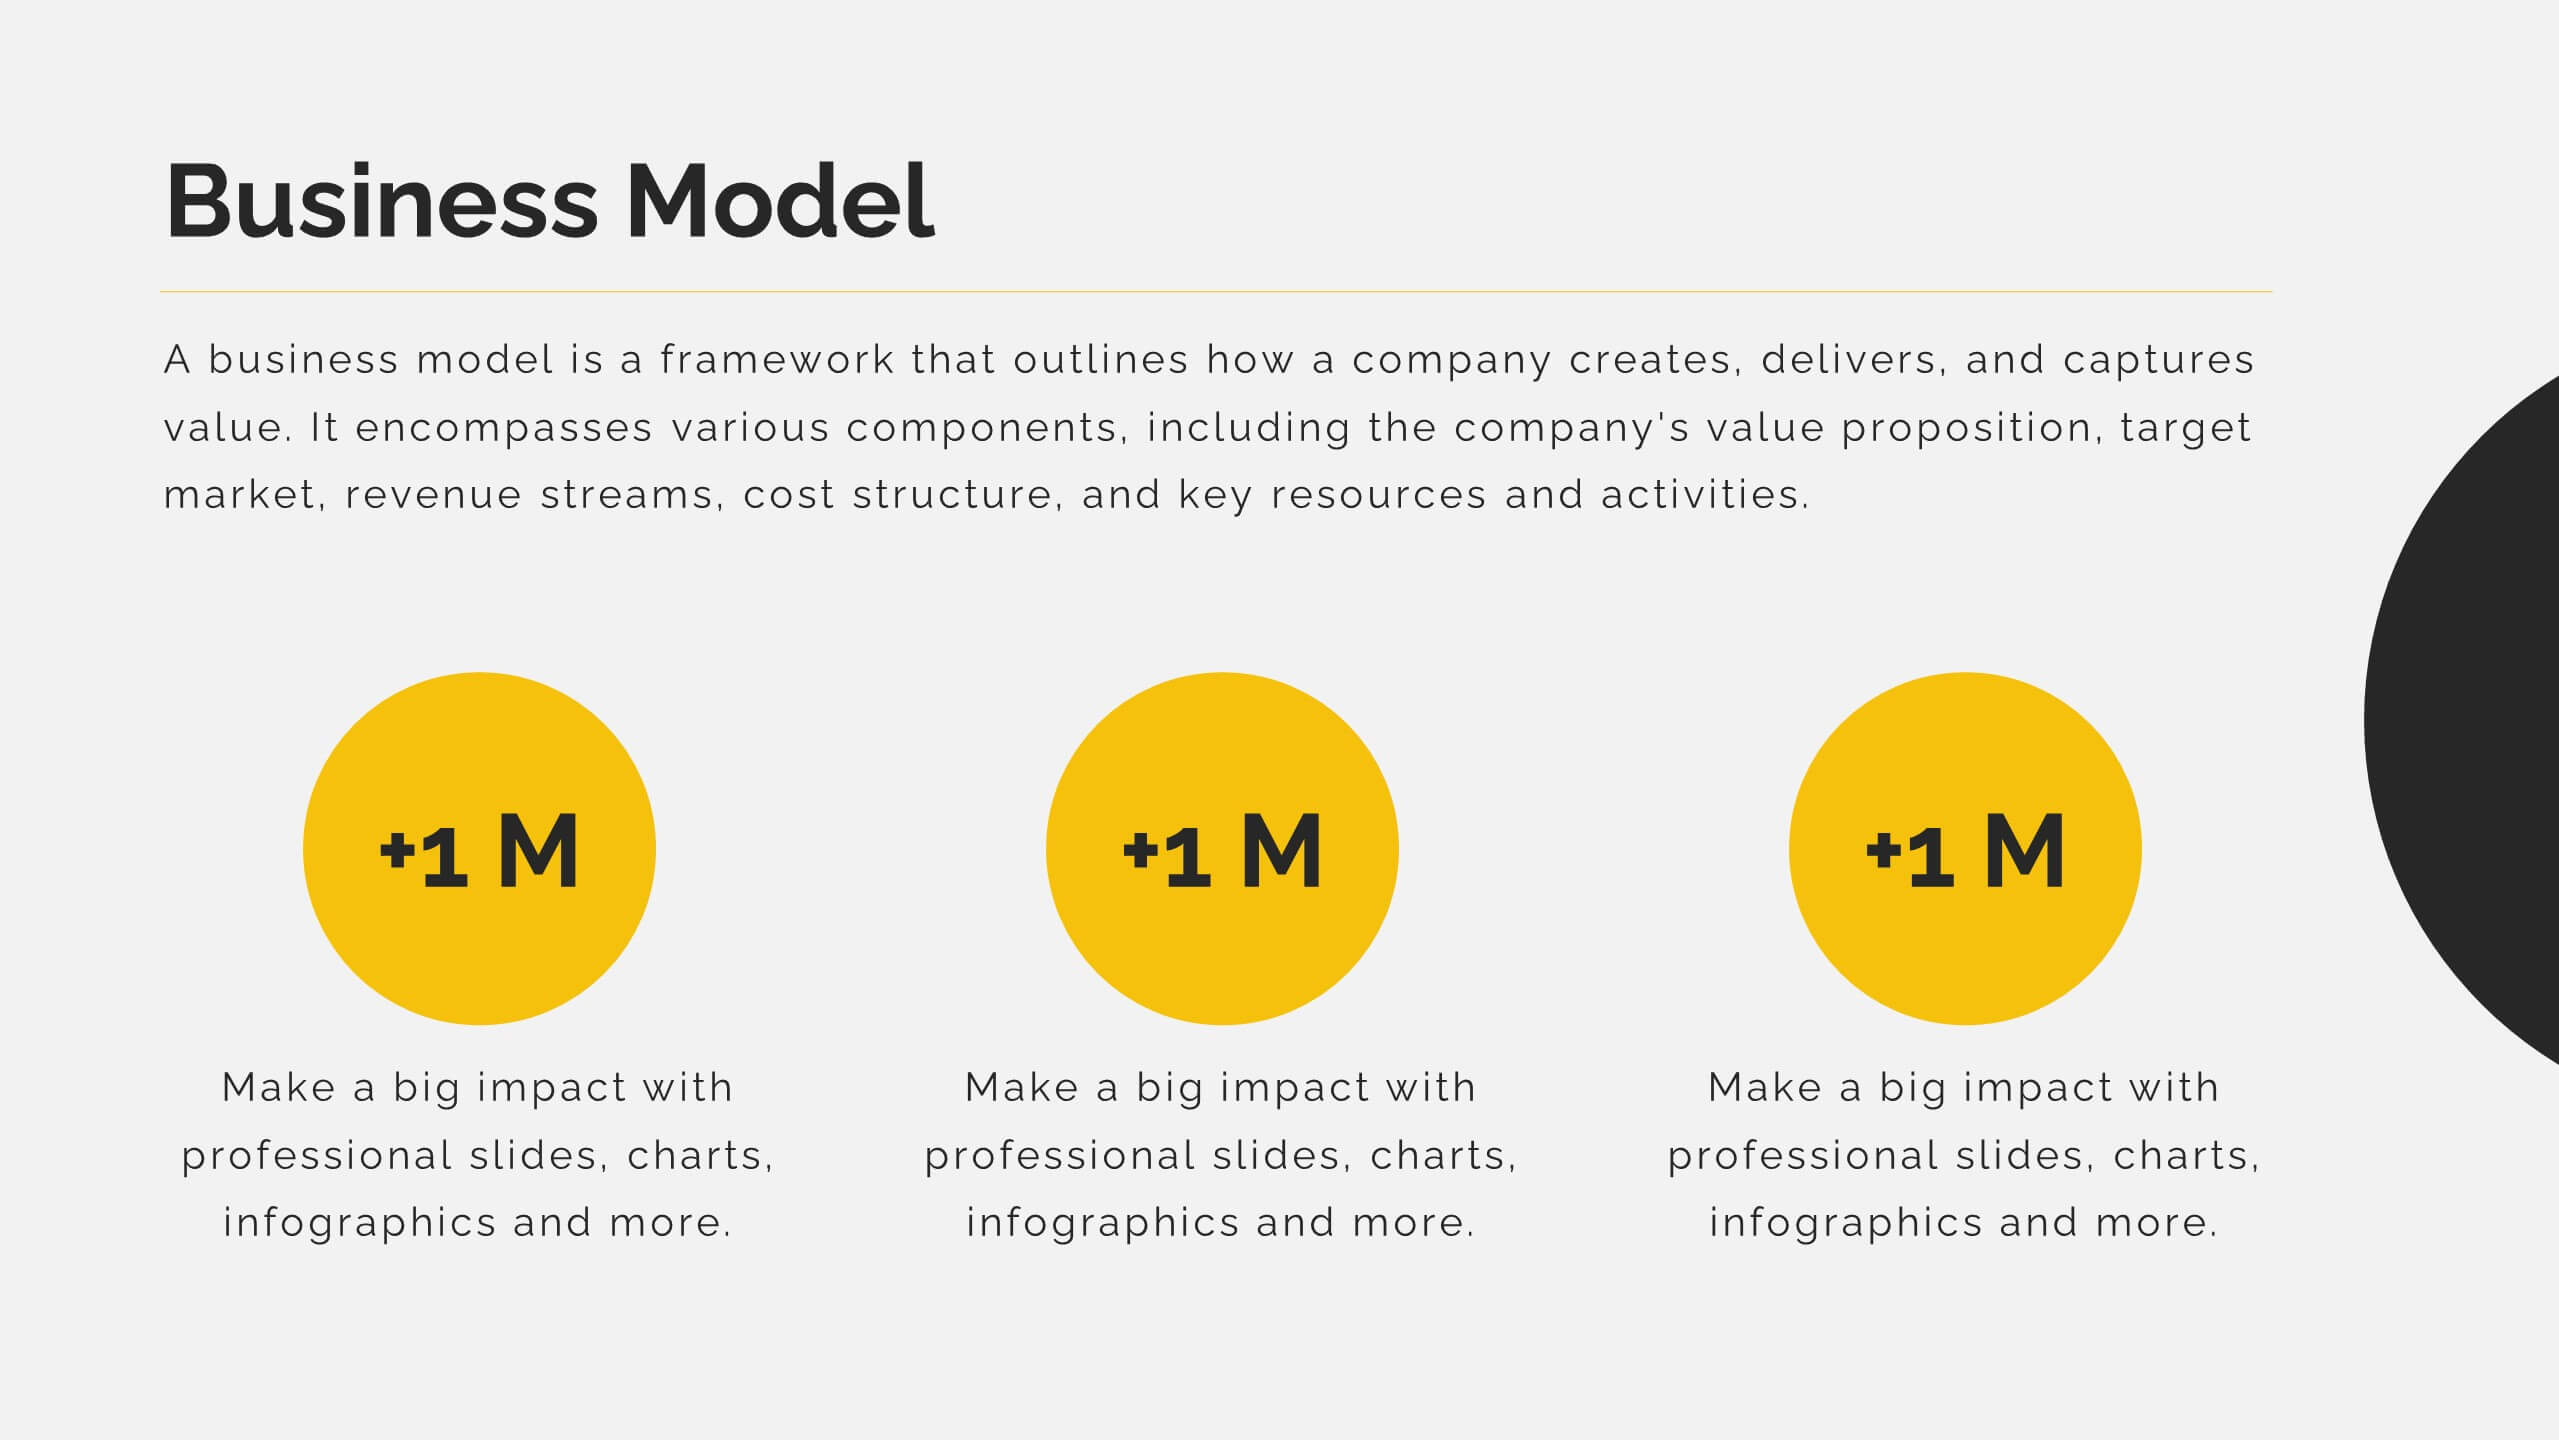
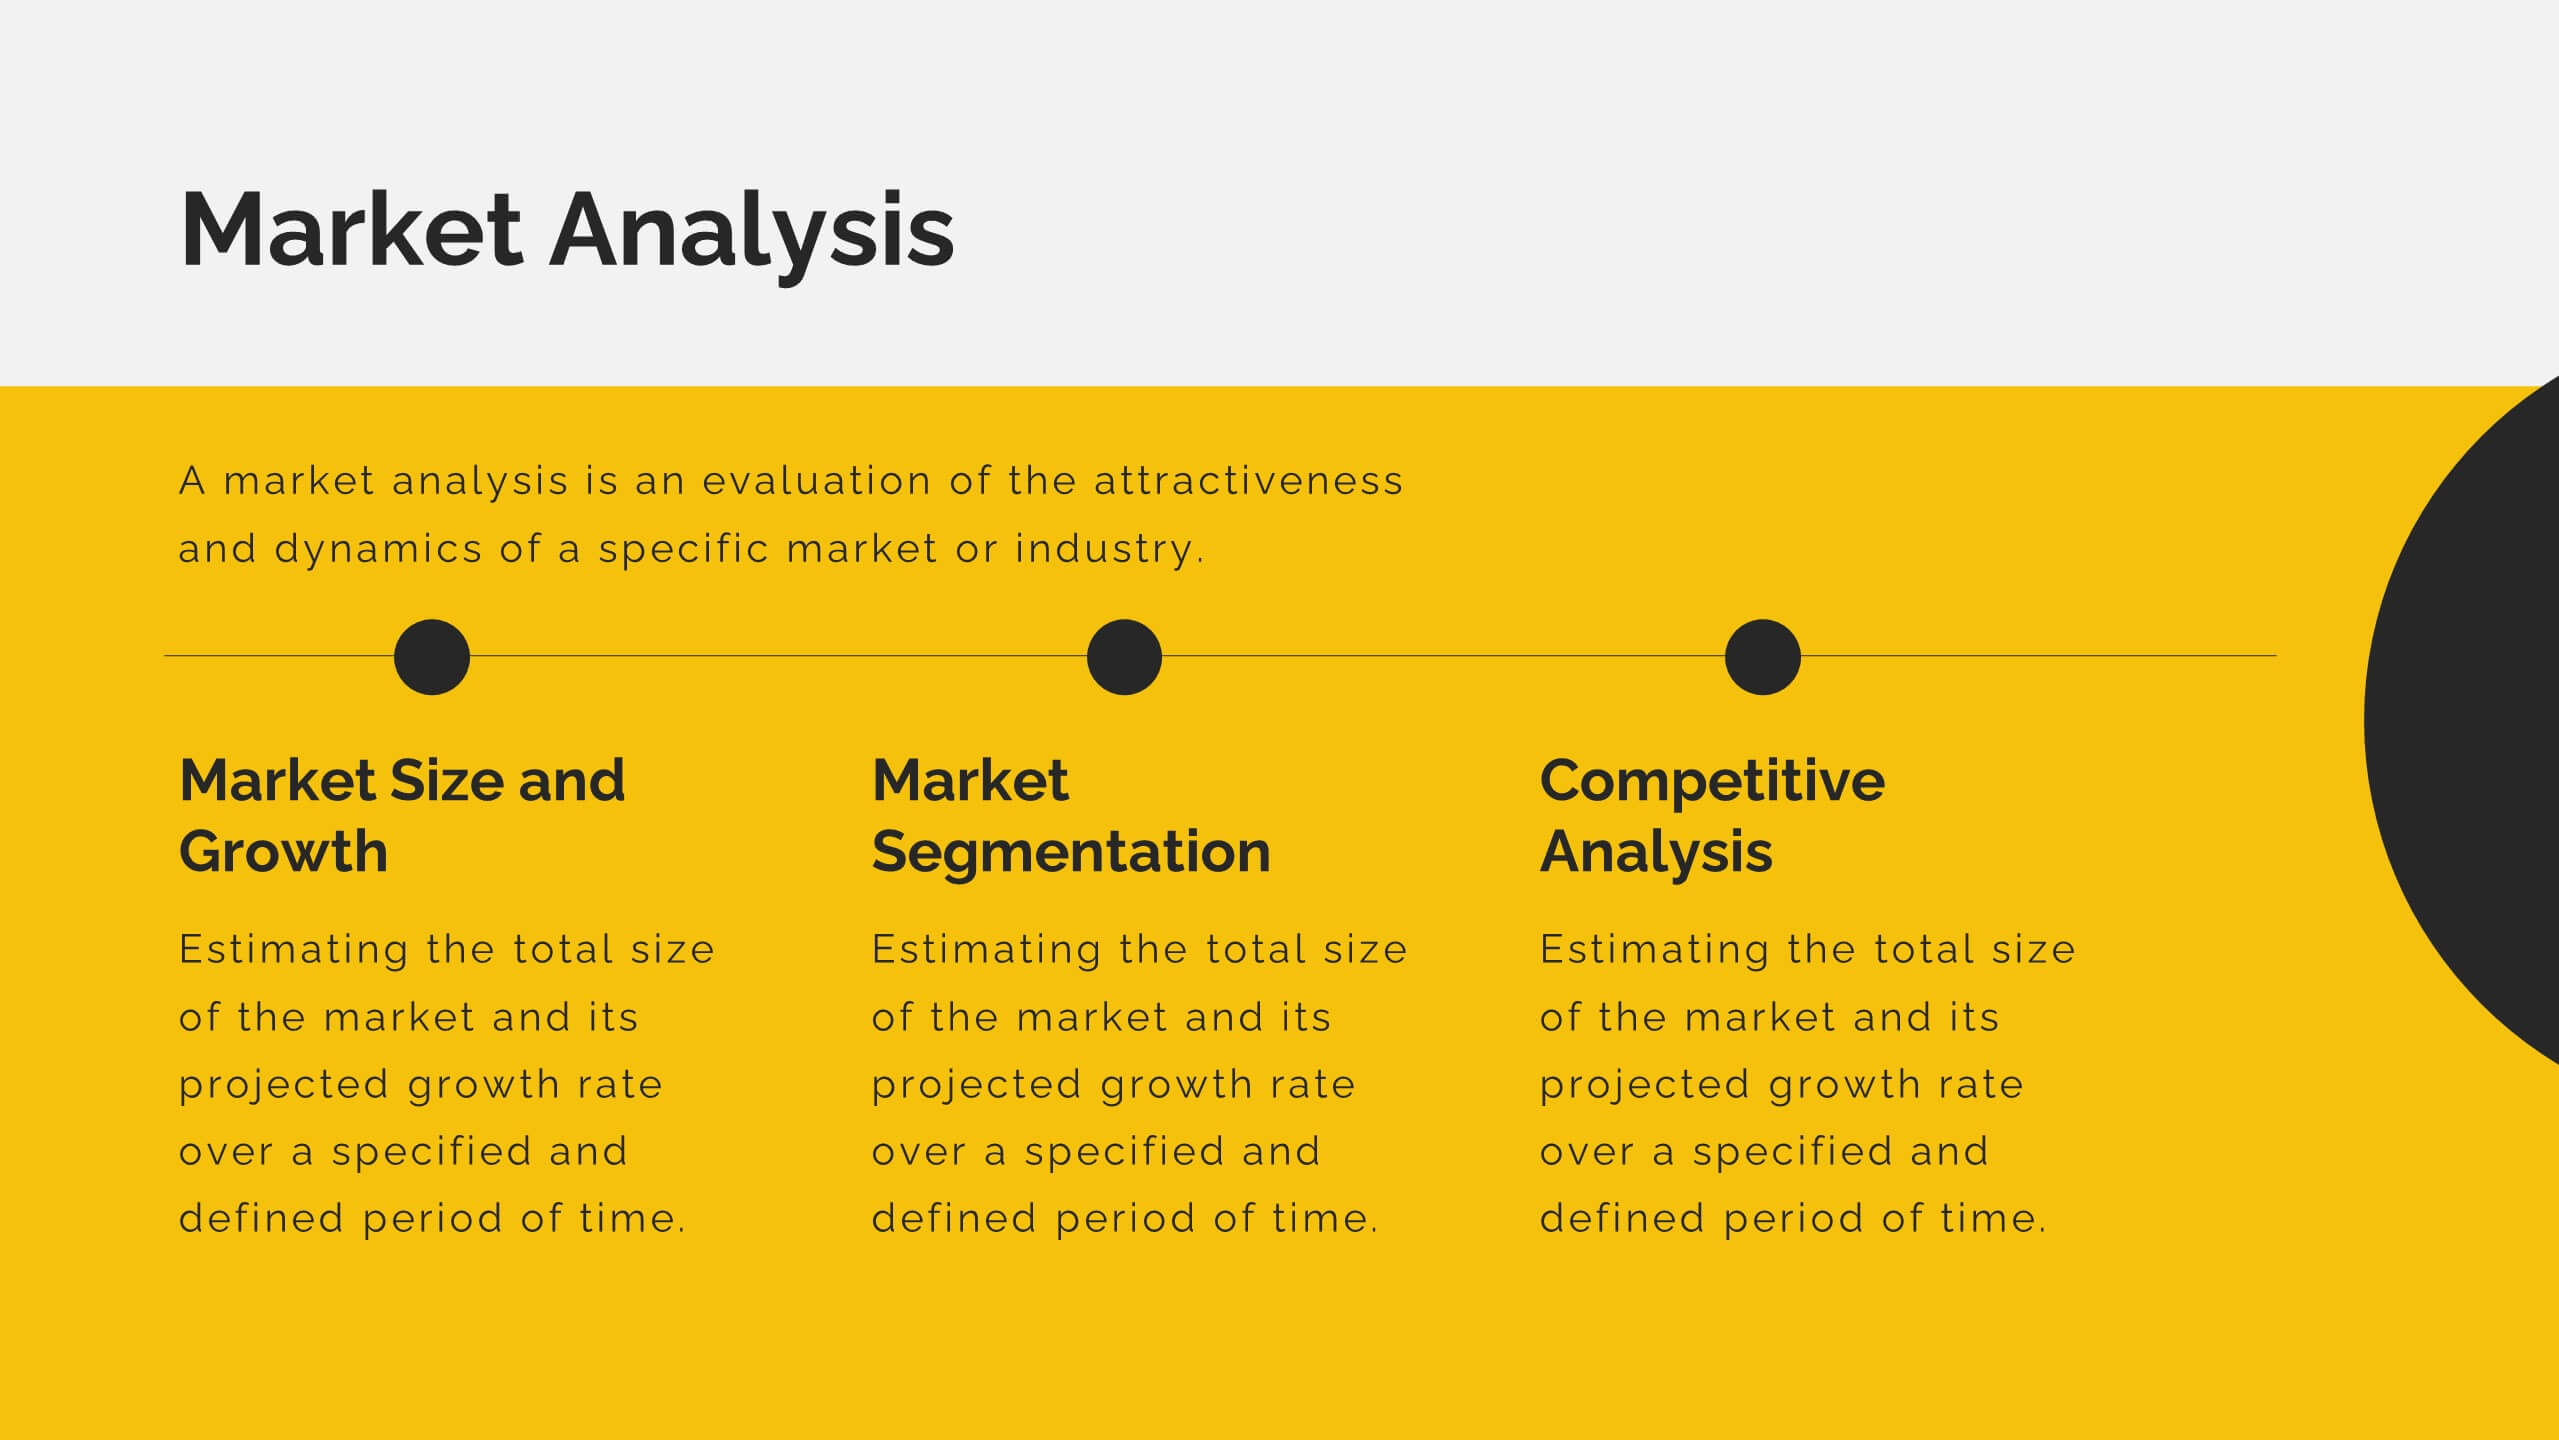
Mirage Startup Funding Proposal Presentation
Secure funding with this dynamic startup proposal template! Perfect for presenting your mission, vision, business model, and market analysis. Ideal for entrepreneurs aiming to impress investors and stakeholders. Compatible with PowerPoint, Keynote, and Google Slides, this template ensures your proposal is clear, professional, and compelling. Achieve your startup goals today!


5 diapositivas
Market Positioning and SWOT of Rivals Presentation
Clearly define your competitive edge with the Market Positioning and SWOT of Rivals Presentation. This layout helps you showcase strengths, weaknesses, opportunities, and threats across key market players using a unique interlinked format. Easy to edit in Canva, PowerPoint, Keynote, and Google Slides—perfect for strategic business overviews.


6 diapositivas
Medical Anatomy Study Presentation
Present complex medical data with the Medical Anatomy Study infographic. Featuring a human body silhouette with key anatomical points and percentage-based insights, this slide is ideal for healthcare presentations, medical research, and educational purposes. Fully editable and compatible with PowerPoint, Keynote, and Google Slides.


6 diapositivas
Agile Project Management Infographic
Agile methodology is an iterative and collaborative approach to project management and software development. This infographic template outlines the key principles and practices of the Agile project management approach. This template is designed to help project managers, teams, and stakeholders understand and implement Agile methodologies for efficient and collaborative project delivery. This serves as a comprehensive guide to understanding and implementing Agile methodologies in project management. It presents the key principles, frameworks, practices, and benefits of Agile in a visually engaging and easy-to-understand format.


6 diapositivas
Patient Care & Treatment Presentation
Highlight the pillars of patient care with this modern, block-style layout. Each icon-embedded cube represents a different treatment or healthcare process, perfect for outlining procedures, services, or stages of medical support. Fully editable in PowerPoint, Keynote, and Google Slides—customize colors, icons, and labels with ease to suit your medical presentation needs.


6 diapositivas
Business Project Proposal Template
Showcase your strategy with clarity and confidence using this sleek Business Project Proposal slide. Designed to highlight three core ideas or phases, it's perfect for pitching initiatives, presenting goals, or structuring deliverables. Compatible with PowerPoint, Google Slides, and Keynote for seamless editing and customization.


2 diapositivas
Creative Brainstorming Infographic Presentation
Spark fresh ideas with a bold, visually rich layout designed to inspire creative thinking and dynamic collaboration. This presentation blends engaging imagery with clear sections that help you organize concepts, map insights, and share innovative solutions effortlessly. Fully compatible with PowerPoint, Keynote, and Google Slides.


6 diapositivas
Effective Time Management Strategies
Master your productivity with this time-focused infographic template. Featuring a central clock illustration and six surrounding sections, it's perfect for showcasing time-blocking techniques, task prioritization, or team scheduling strategies. Customize each segment with your own insights in PowerPoint, Keynote, or Google Slides. Fully editable for any business use.


3 diapositivas
Time Management Techniques and Tips Presentation
Start your day like a pro—with structure, focus, and tools that work. This presentation template is designed to help you showcase effective time management strategies, productivity tips, and calendar planning methods with clean, modern visuals. Fully compatible with PowerPoint, Keynote, and Google Slides for effortless customization and professional results.


7 diapositivas
Business Process in Step-by-Step Presentation
Streamline operations with the Business Process in Step-by-Step presentation. This structured template breaks down complex workflows into clear, actionable steps, enhancing clarity and decision-making. Perfect for project planning, strategy execution, and workflow optimization. Fully customizable in PowerPoint, Keynote, and Google Slides for seamless presentation delivery.


5 diapositivas
Wedding Reception Program Infographics
Embrace the romance with our wedding reception program infographics, the quintessential guide for couples, wedding planners, and event organizers. This template, bathed in soothing light blue and light pink hues, provides an elegant backdrop for your wedding reception's flow of events. With a creative, vertical design, it offers an aesthetically pleasing layout that outlines the festivities, from heartfelt toasts to the final dance. It includes whimsical graphics, versatile icons, and customizable image placeholders, ensuring each moment is beautifully represented. Infuse personality and seamless organization into your special day, making it memorable for everyone involved.


7 diapositivas
Subsistence Agriculture Infographic
Bring the essence of sustainability to your presentations with our Subsistence Agriculture infographic, designed for seamless integration with Powerpoint, Keynote, and Google Slides. This infographic is perfect for educators, agricultural professionals, and sustainability advocates who need to convey the importance of self-sufficient farming practices and their impact on local communities. Our Subsistence Agriculture infographic illustrates the fundamentals of agriculture that relies on the self-production of food by individuals and small communities. It highlights how this method supports sustainability, food security, and ecological balance. The visually engaging elements emphasize traditional farming techniques, crop diversity, and the role of agriculture in rural livelihoods. By incorporating this infographic into your presentations, you present a compelling narrative on the significance of subsistence farming in today's world. It not only educates your audience on the basics but also inspires discussions on the broader implications for global food systems. Use this infographic to effectively communicate the value of subsistence agriculture in maintaining community resilience and environmental stewardship.


5 diapositivas
Root Cause Analysis Fishbone Slide Presentation
Give your problem-solving sessions a fresh visual spark with a tree-style diagram that makes tracing causes feel clear and intuitive. This presentation helps you break down issues, organize insights, and present findings with clean, structured flow. Perfect for teams and workshops. Fully compatible with PowerPoint, Keynote, and Google Slides.