


Características


¿Tienes alguna pregunta?
Recomendar


4 diapositivas
3-Level Tree Chart Presentation
Grow your ideas from concept to execution with this beautifully designed visual layout. Perfect for showcasing layered strategies, hierarchical processes, or business development stages, it balances clarity and creativity through a clean, tree-inspired design. Fully editable and compatible with PowerPoint, Keynote, and Google Slides for seamless professional use.


34 diapositivas
Validation Pitch Deck
A Validation Pitch Deck, is a visual presentation that provides an overview of a startup company's business idea, market opportunity, value proposition, and progress towards validation of its concept or product. This template consists of a series of slides that are designed to convey the key elements of your business model in a concise and persuasive manner. Use this template as a tool to communicate your vision, market opportunity, and progress to potential investors or other stakeholders. Compatible with PowerPoint, Keynote, and Google Slides. The color scheme and design elements can be easily customized to match your brand or business.


26 diapositivas
Philp Presentation Template
Our Philp template is perfect for presenting your furniture shop business. It has a modern design, allowing you to make your product/service stands out from the crowd, and it’s easily customizable so that it can be tweaked to your exact needs. This template contains slides with beautiful graphics and captions describing the most important aspects of your business. Our presentation template can be used to promote your products, services, benefits and much more! This template can also be used to present your company's vision and mission, business strategy, portfolio and more.


5 diapositivas
North America Business Landscape Map Presentation
Explore the business terrain with the "North America Business Landscape Map" template, which delivers a comprehensive visualization of business data across various regions. Designed for strategic presentations, it enables clear communication of market insights and data points, crucial for decision-making. This template is compatible with PowerPoint, Keynote, and Google Slides, enhancing its utility for professionals in diverse fields.


23 diapositivas
Ionian Corporate Strategy Report Presentation
The Ionian Corporate Strategy Report template offers a modern and dynamic approach to corporate presentations, designed to keep your audience engaged throughout. With a sleek, contemporary design in black, white, and purple tones, this template is perfect for presenting strategic plans, conference overviews, session breakdowns, and more. Each slide is crafted to facilitate a seamless flow of information, whether you're introducing a keynote speaker, discussing key objectives, or outlining conference agendas. The template includes placeholders for breakout sessions, networking breaks, Q&A sessions, and more, making it versatile and adaptable for various corporate events. It's fully compatible with PowerPoint, Keynote, and Google Slides, ensuring easy customization and a professional presentation experience. Use the Ionian Corporate Strategy Report template to make your next corporate presentation both impactful and memorable.


4 diapositivas
Cost Breakdown Table Presentation
Make your numbers speak with style using a clean, structured layout that simplifies pricing and cost analysis. This presentation is perfect for comparing plans, budgets, or expenses in a clear and visually engaging way. Fully editable and compatible with PowerPoint, Keynote, and Google Slides.


5 diapositivas
Health and Safety Training Presentation
Ignite your team's commitment to safety with our 'Health and Safety Training' presentation template. Designed to highlight key safety practices and emergency procedures, this tool is essential for effective training sessions. Ideal for any organization, it's compatible with PowerPoint, Keynote, and Google Slides, ensuring wide accessibility.


21 diapositivas
Solara Business Strategy Presentation
Craft a winning plan with this comprehensive business strategy presentation! It covers essential sections like market analysis, SWOT, strategic initiatives, and performance metrics, helping you align goals and opportunities. Perfect for executive meetings or stakeholder reviews, this template ensures seamless collaboration. Fully compatible with PowerPoint, Keynote, and Google Slides.


5 diapositivas
Employee Feedback Survey Report Presentation
Deliver clear insights into team sentiment with this employee rating slide. Designed with star rating visuals and thumbs-up iconography, it's perfect for showcasing staff satisfaction, engagement, and performance reviews. Easy to customize in PowerPoint, Keynote, and Google Slides.


5 diapositivas
Final Thoughts and Project Recap Presentation
Wrap up your presentation with clarity using this Final Thoughts and Project Recap Presentation. Designed with a modern vertical hexagon layout, this slide highlights four key conclusions or reflections with matching icons and clean text alignment. It's perfect for summarizing insights, actions, or final outcomes. Fully editable in PowerPoint, Keynote, Google Slides, and Canva.


6 diapositivas
PESTEL Analysis Business Presentation
The "PESTEL Analysis Business Presentation" template effectively facilitates a comprehensive review of the political, economic, social, technological, environmental, and legal factors that impact strategic business decisions. This template is designed to help strategists, analysts, and managers evaluate and present external factors that could affect their business operations and market environment. Each segment of the analysis is visually represented through connected circles, making complex data easily understandable. This layout encourages a structured discussion on each PESTEL aspect, ensuring that all critical elements are covered, making it an essential tool for businesses looking to align their strategies with external conditions.


7 diapositivas
Sales Infographic Presentation Template
A Sales Infographic is a visual representation of data or information related to sales. They can include charts, graphs, and diagrams that show how much money a company has made, how many products they have sold, and what their best-selling products are. This template is perfect for anyone who wants to show off their sale numbers in a fun and easy-to-understand way. This template has colorful pictures and charts that make it easy to see how much you've sold and how well your sales are doing. This template is a perfect way to help a company make decisions and track progress.


7 diapositivas
SEO Strategy and Keyword Plan Presentation
Spark your marketing roadmap with a bold, idea-driven layout that makes every action step clear and memorable. This presentation helps you outline search goals, explore keyword opportunities, and map out strategic priorities in a simple, visual flow. Fully compatible with PowerPoint, Keynote, and Google Slides.


5 diapositivas
Meeting Schedule and Agenda Layout Presentation
Plan, track, and communicate multi-day meetings with this Meeting Schedule and Agenda Layout presentation. Ideal for organizing conference sessions, workshops, or internal team agendas, this layout lets you present key topics by day and time. Clean, structured, and fully editable in Canva, PowerPoint, and Google Slides for easy customization.


10 diapositivas
HR Management Presentation
The HR Management Presentation template is expertly designed to communicate crucial aspects of human resource management. It features a visually engaging layout that systematically breaks down important HR elements such as recruitment, training, employee engagement, and performance metrics. Each section is clearly labeled and accompanied by intuitive icons that aid in quick comprehension, making it an ideal choice for HR professionals aiming to present complex data in an accessible format. This template enhances audience engagement through its structured presentation of information, focusing on strategic management within HR. It is perfectly suited for showcasing HR strategies, policy updates, or organizational improvements in a clear and effective manner.


5 diapositivas
Project Milestone Timeline Presentation
Bring your project’s journey to life with this vibrant and organized presentation layout. Designed to showcase milestones, releases, and key phases clearly, it helps teams stay aligned and focused on goals. Fully editable and compatible with PowerPoint, Keynote, and Google Slides for smooth, professional presentations every time.


26 diapositivas
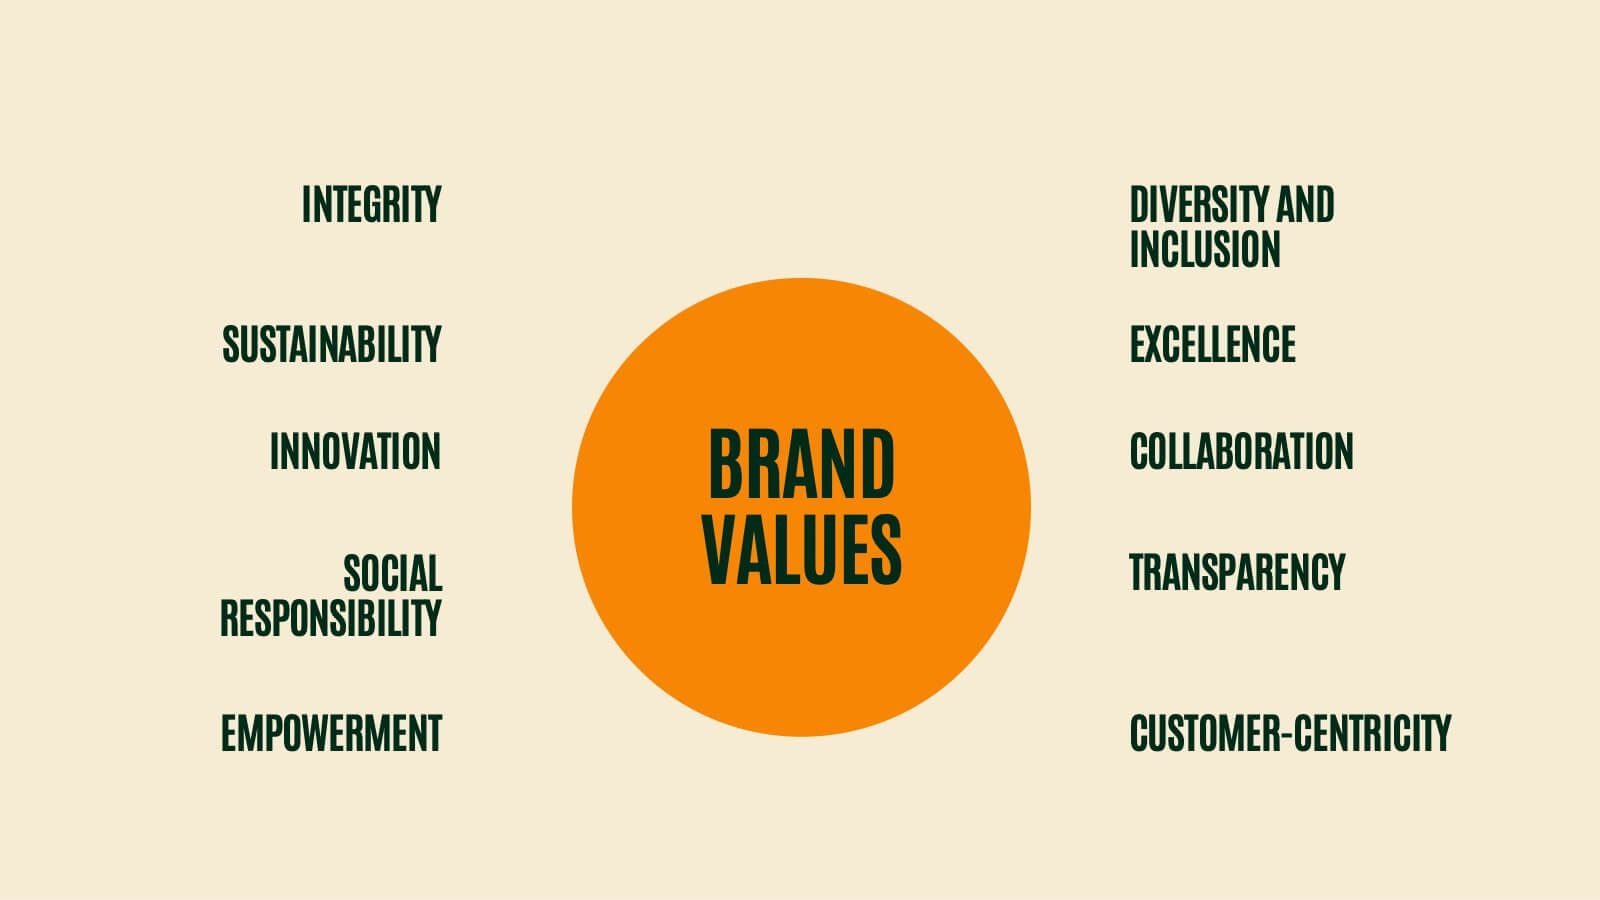
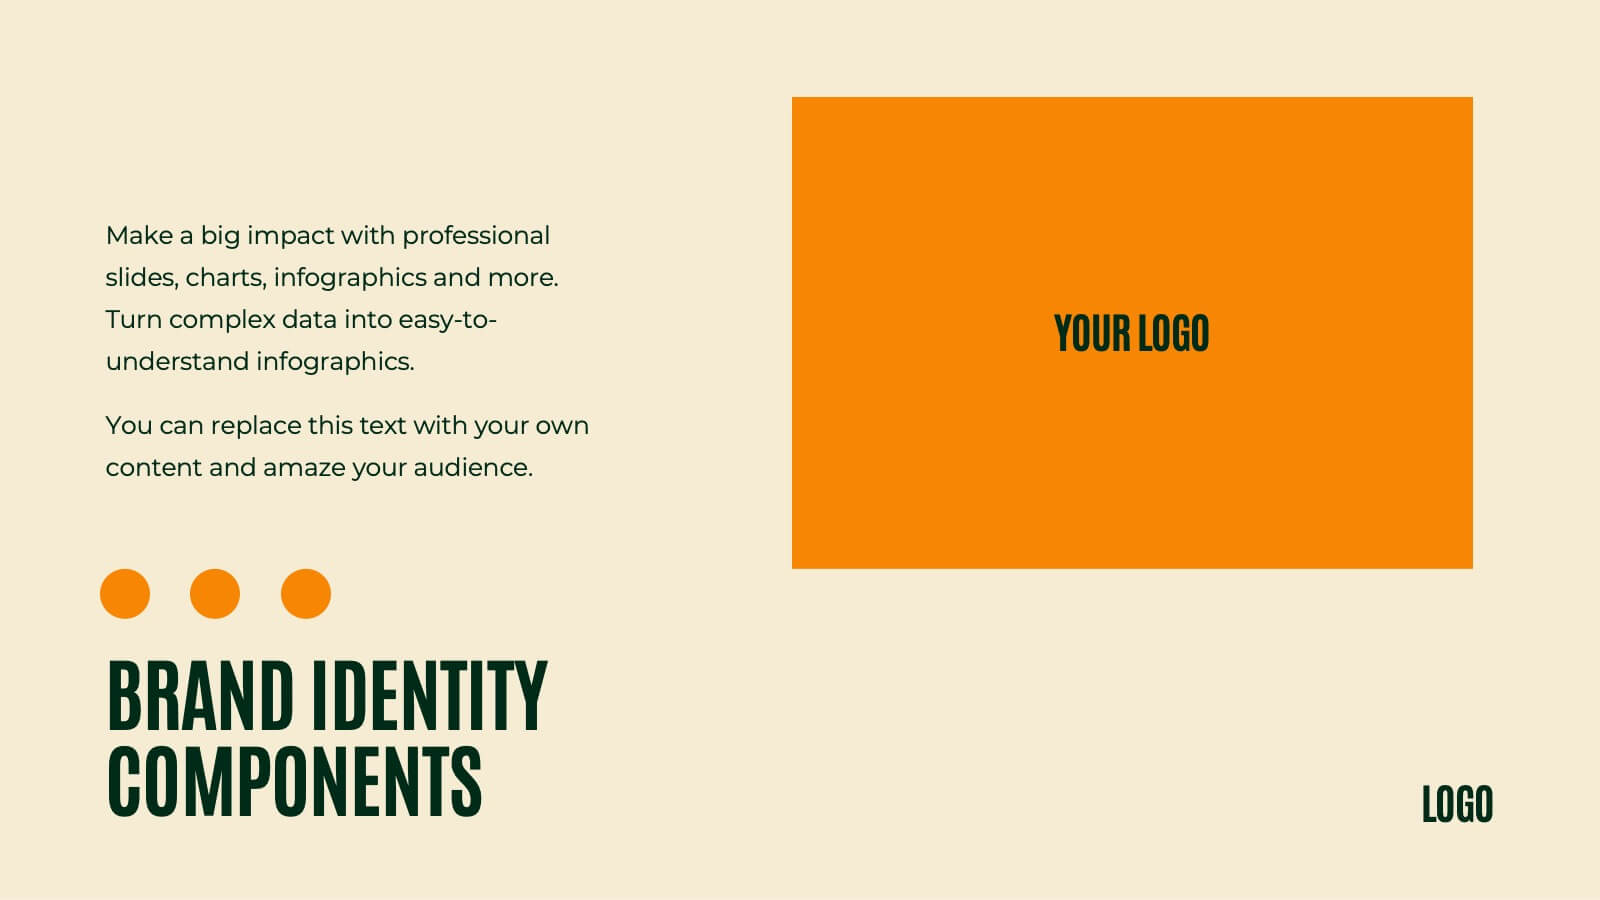
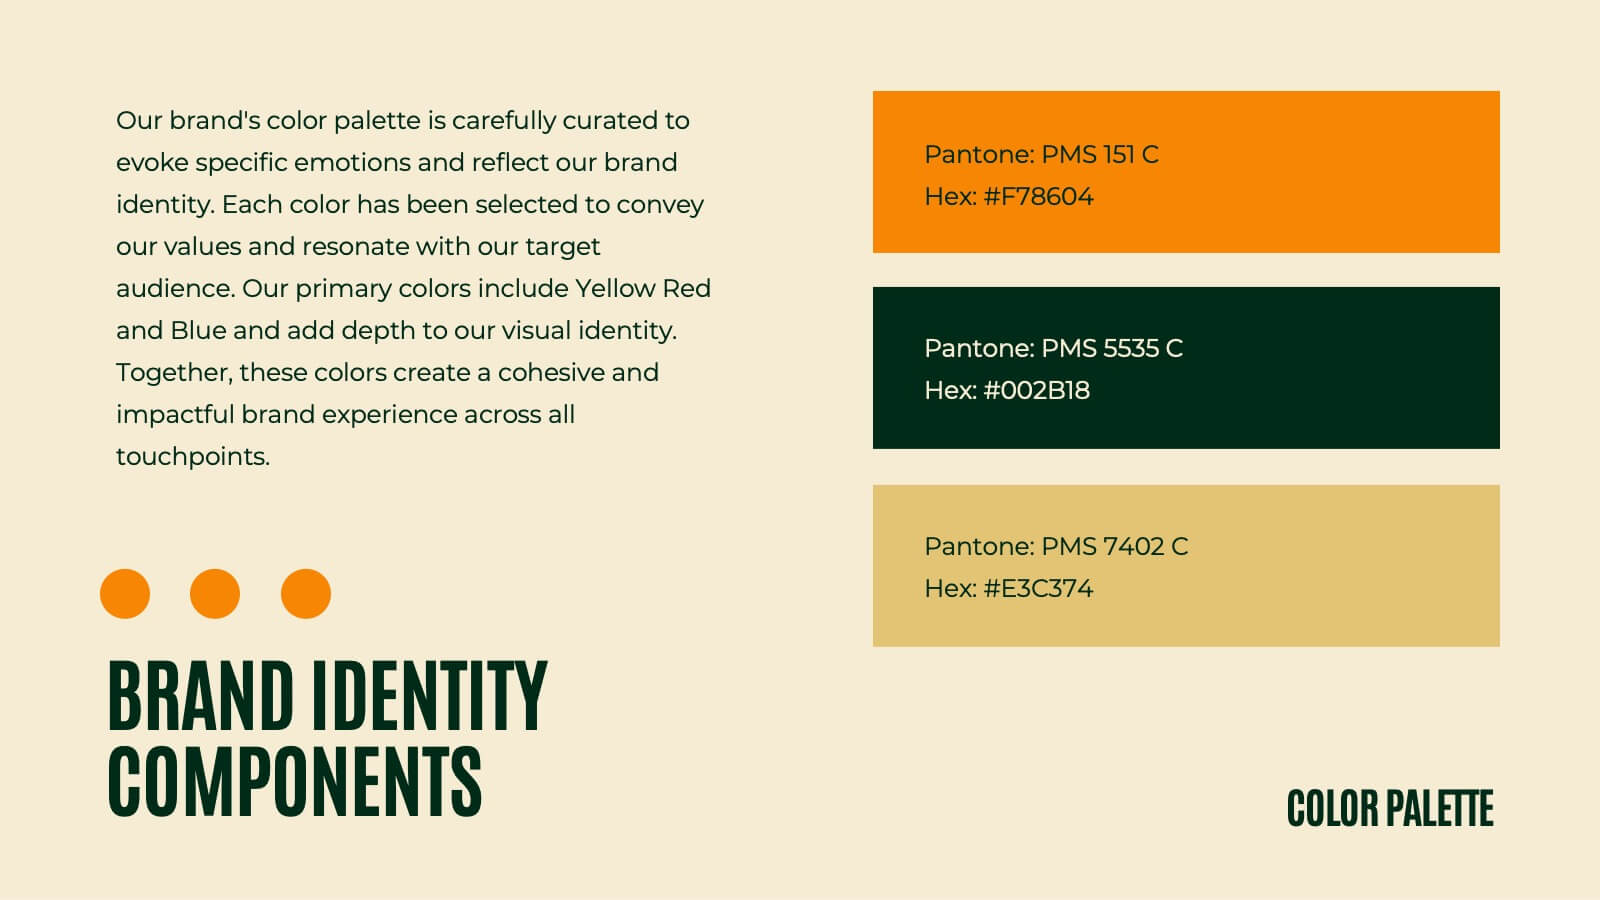
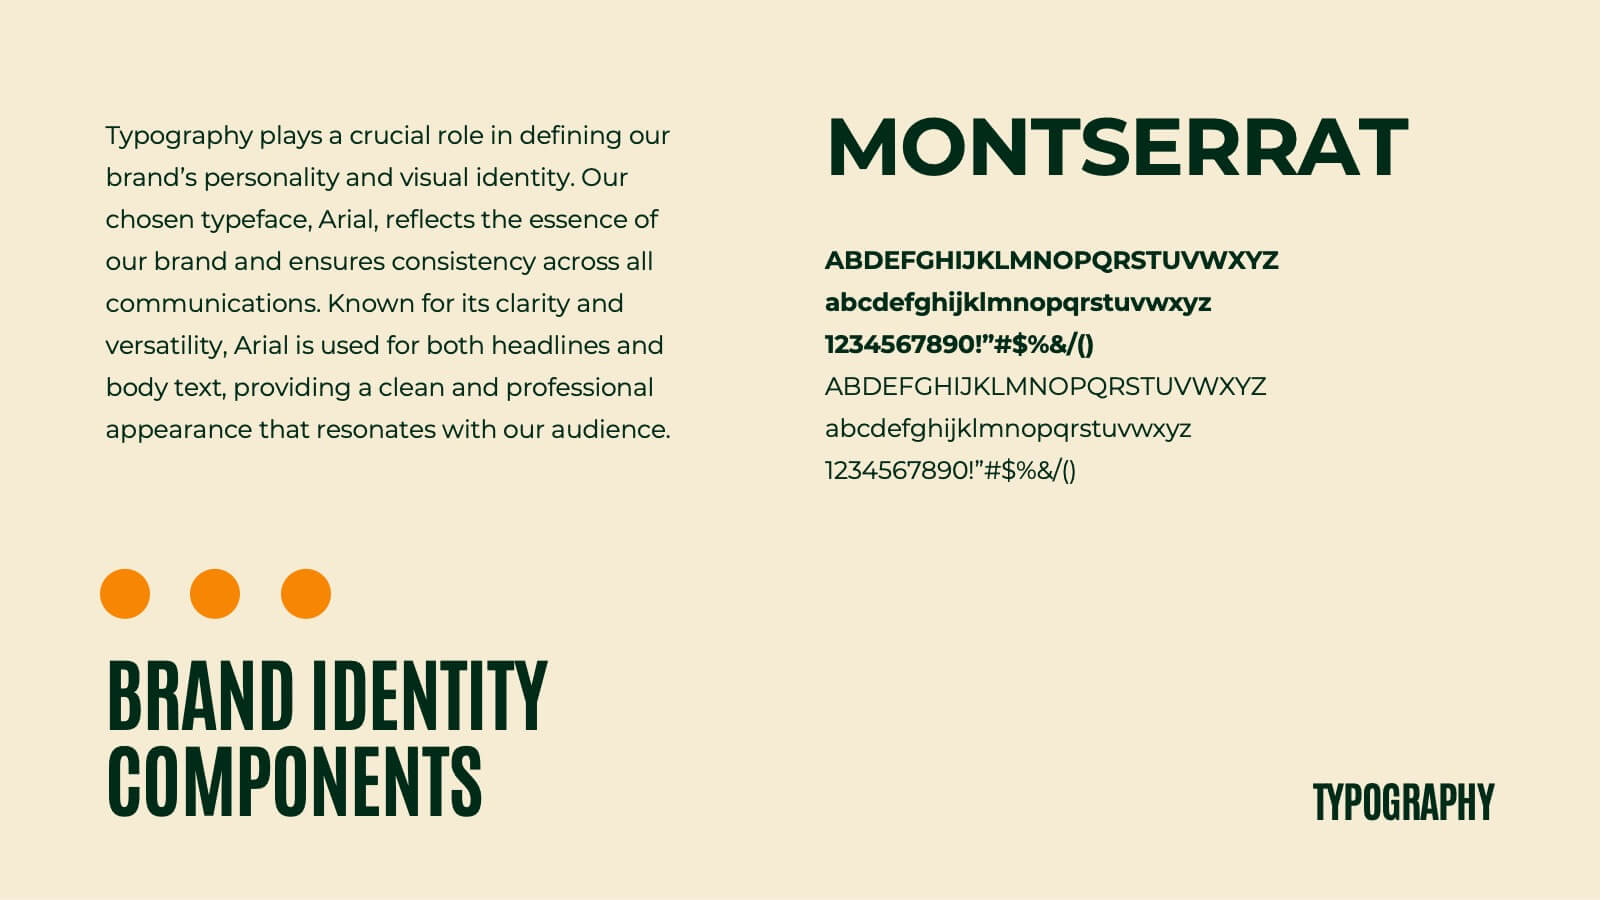
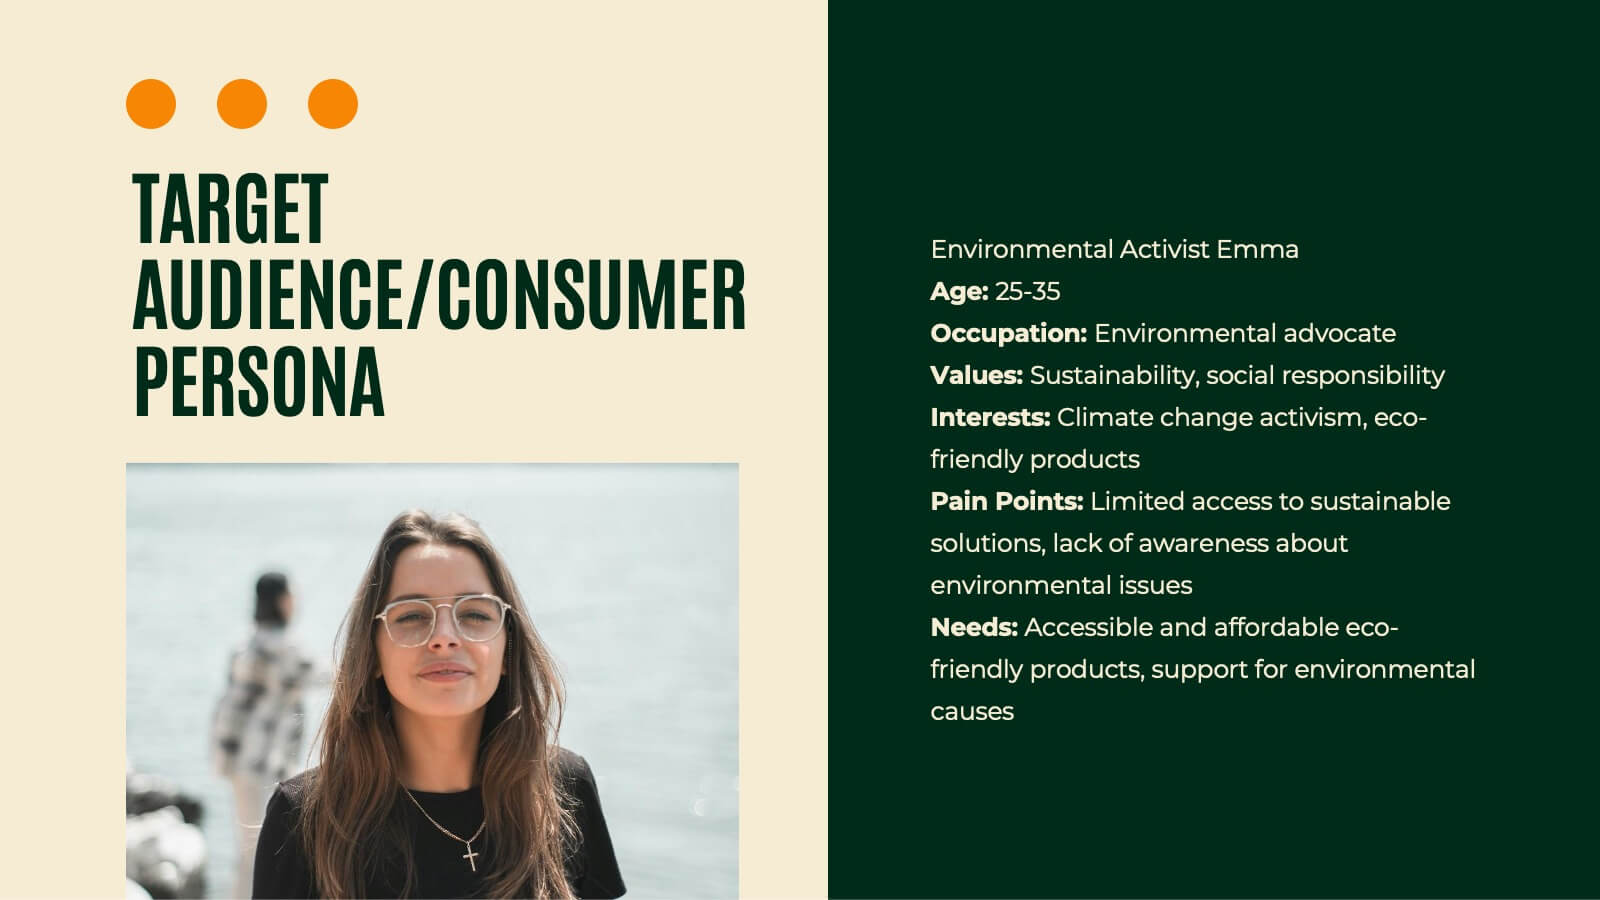
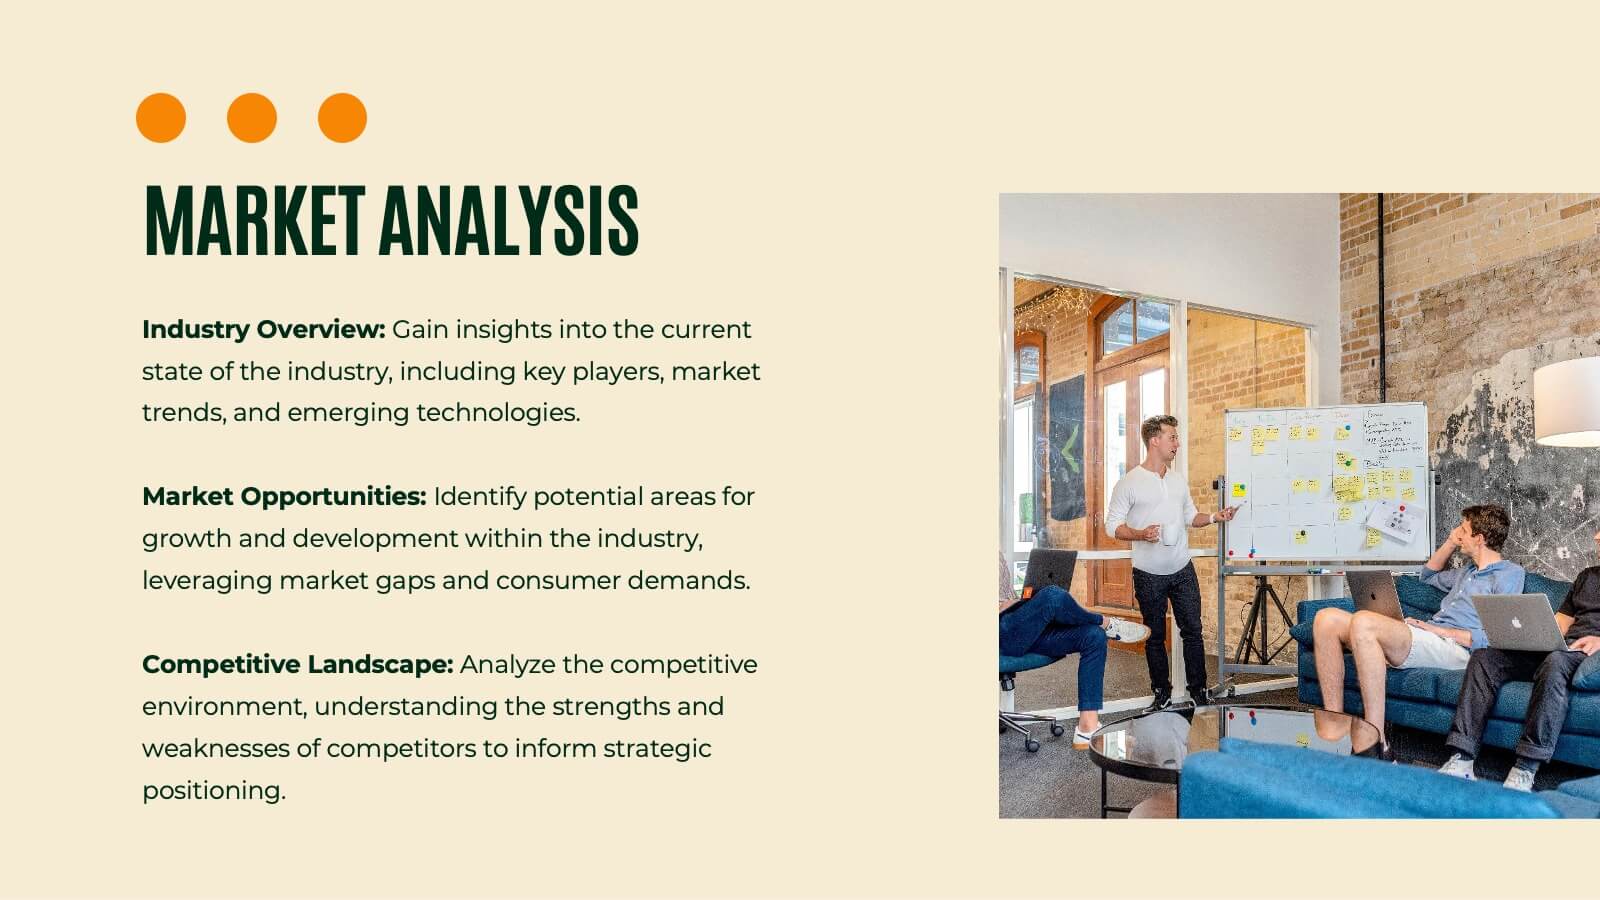
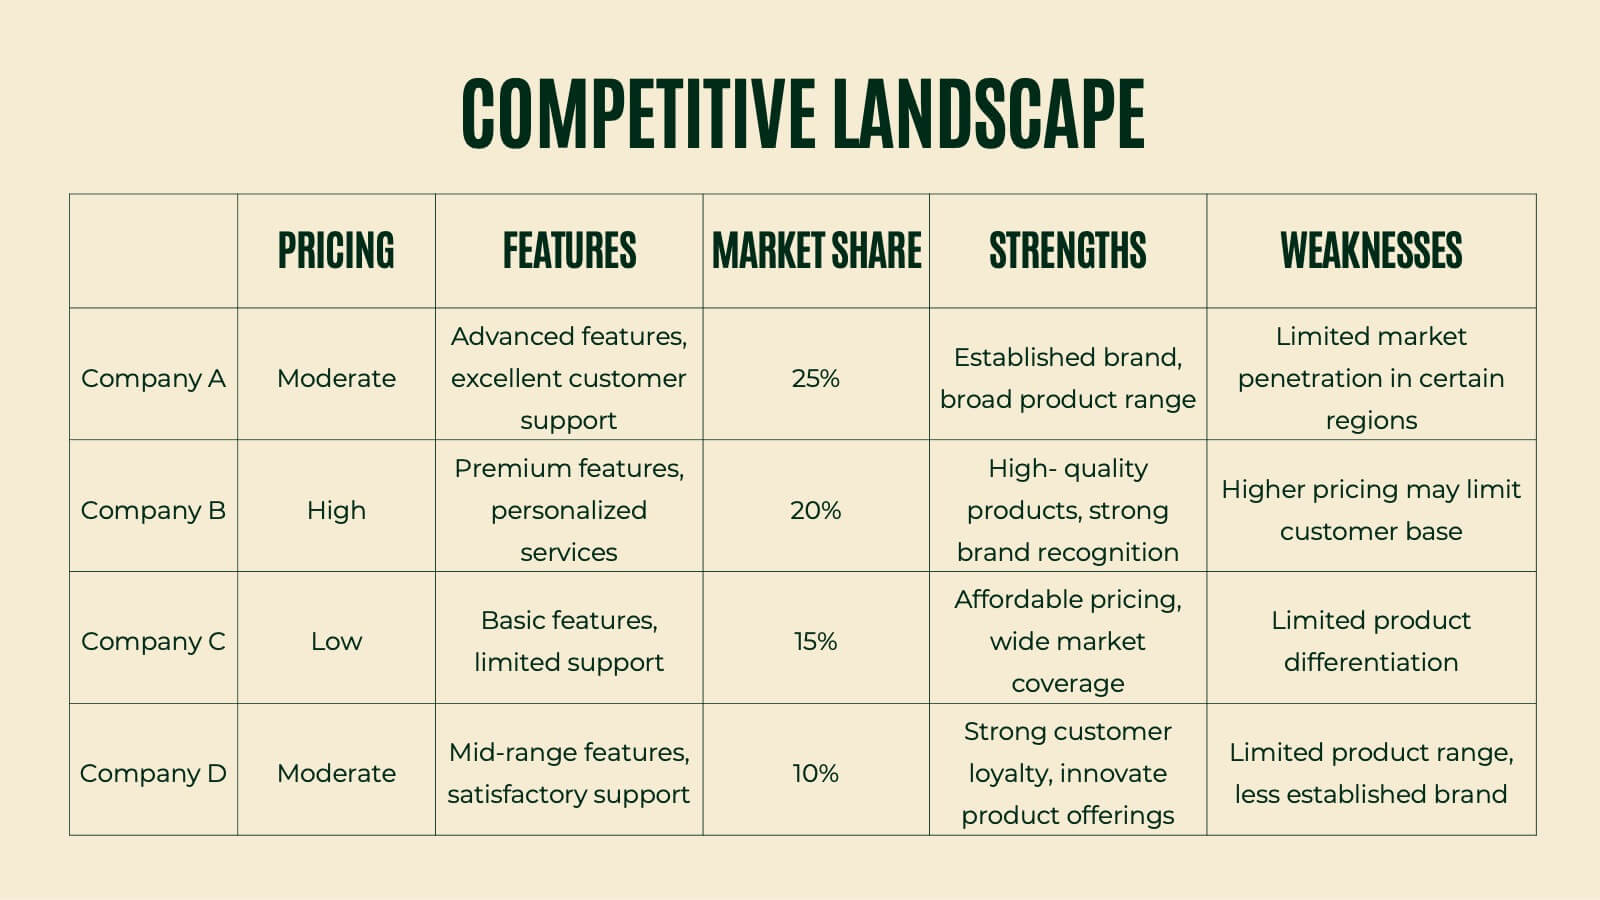
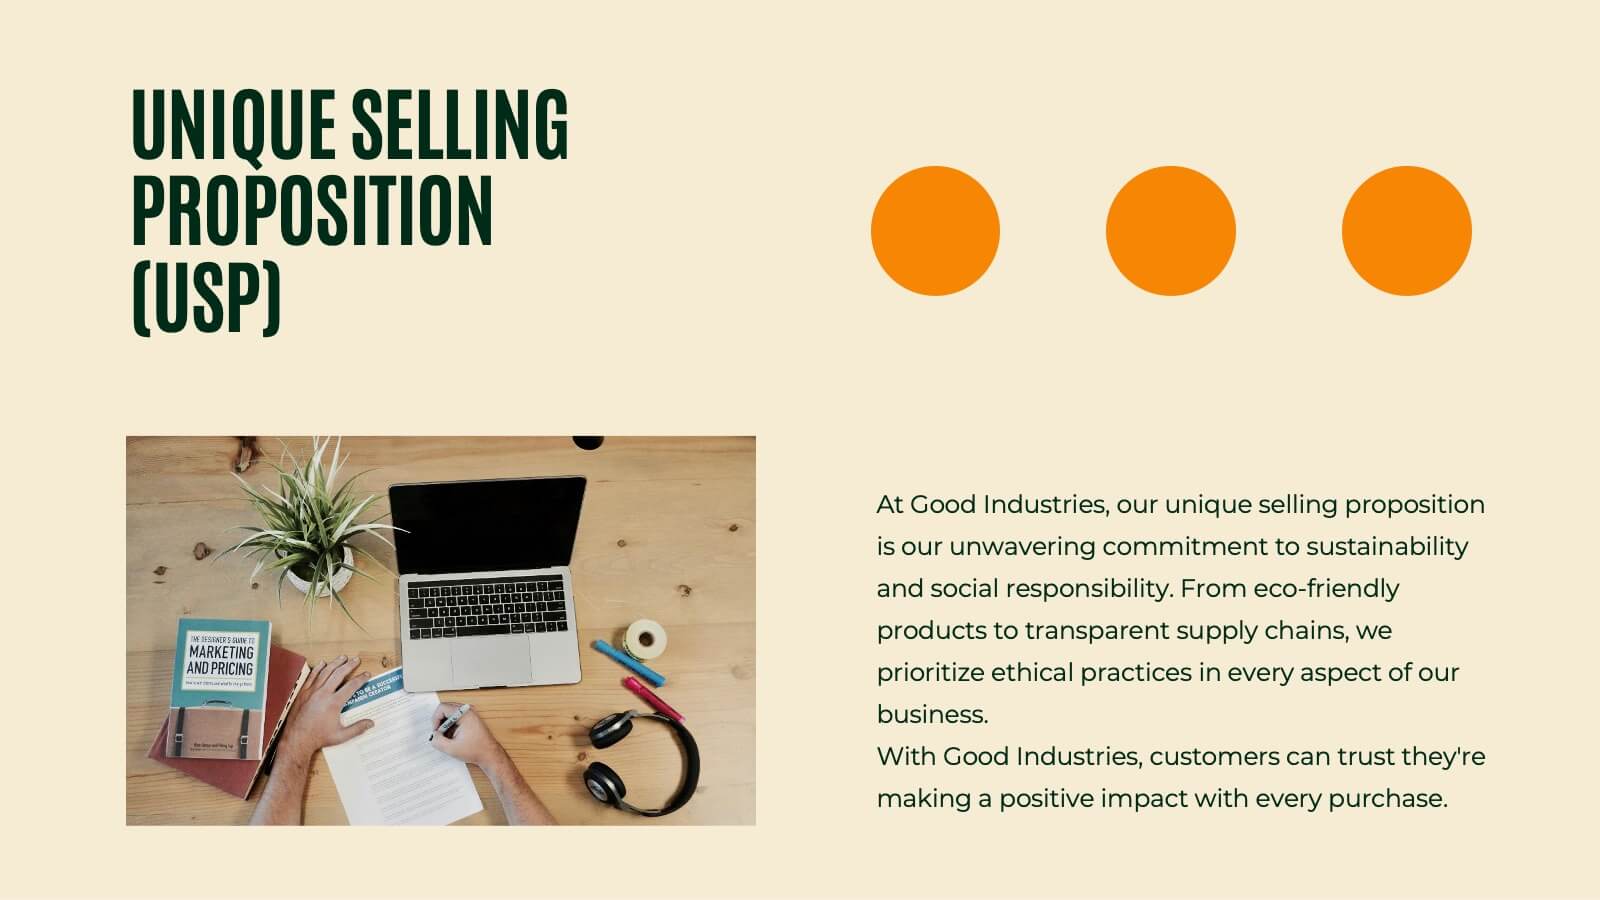
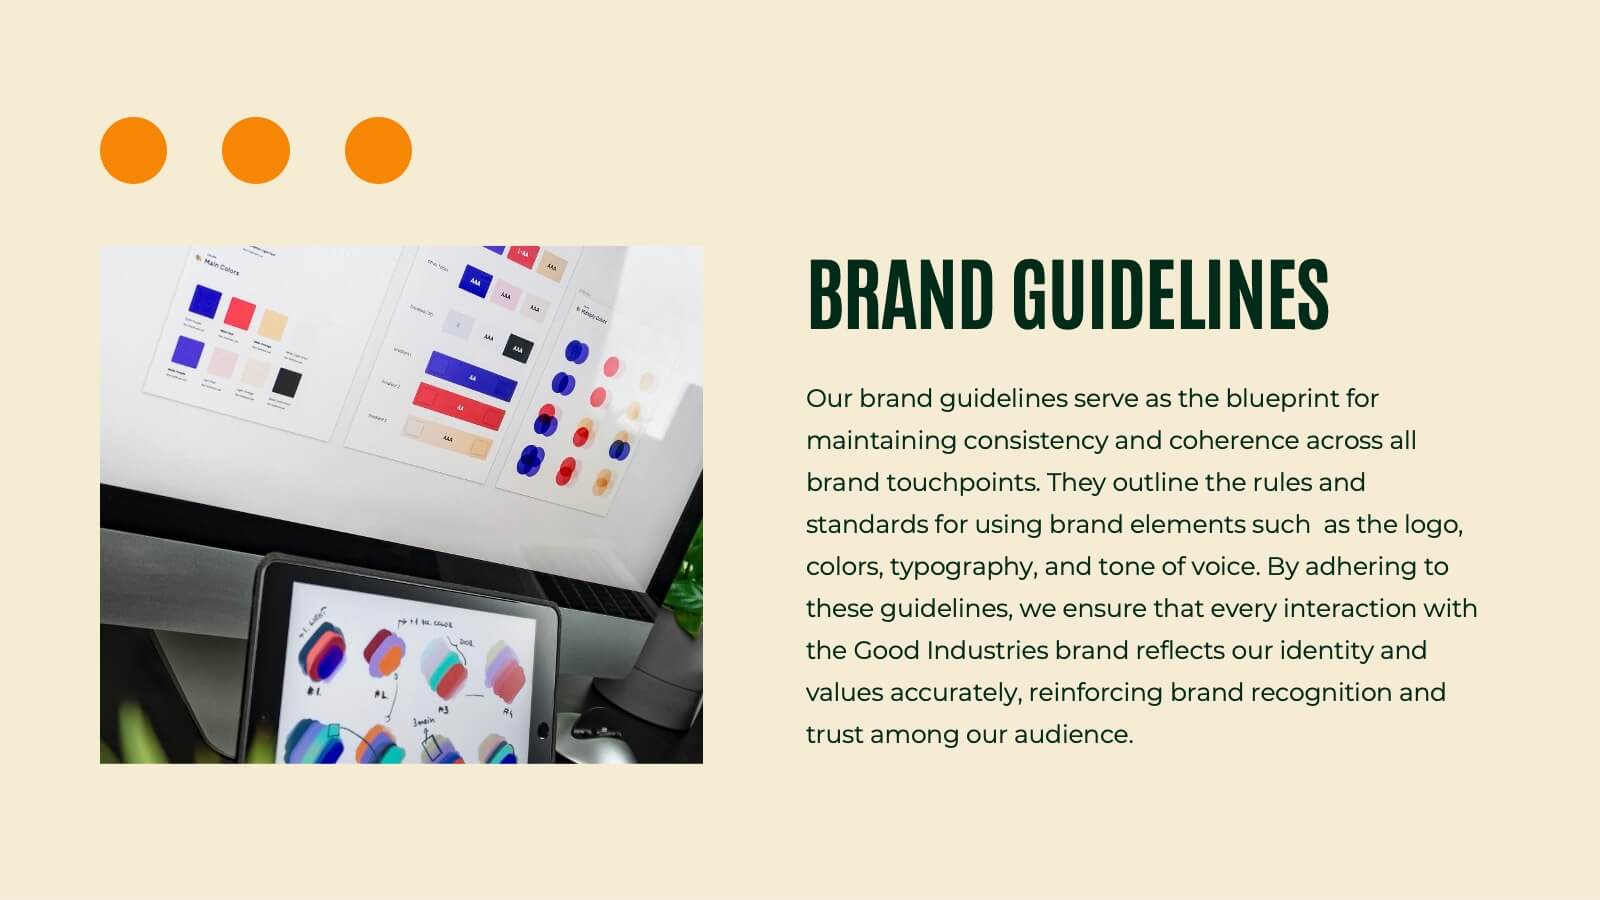
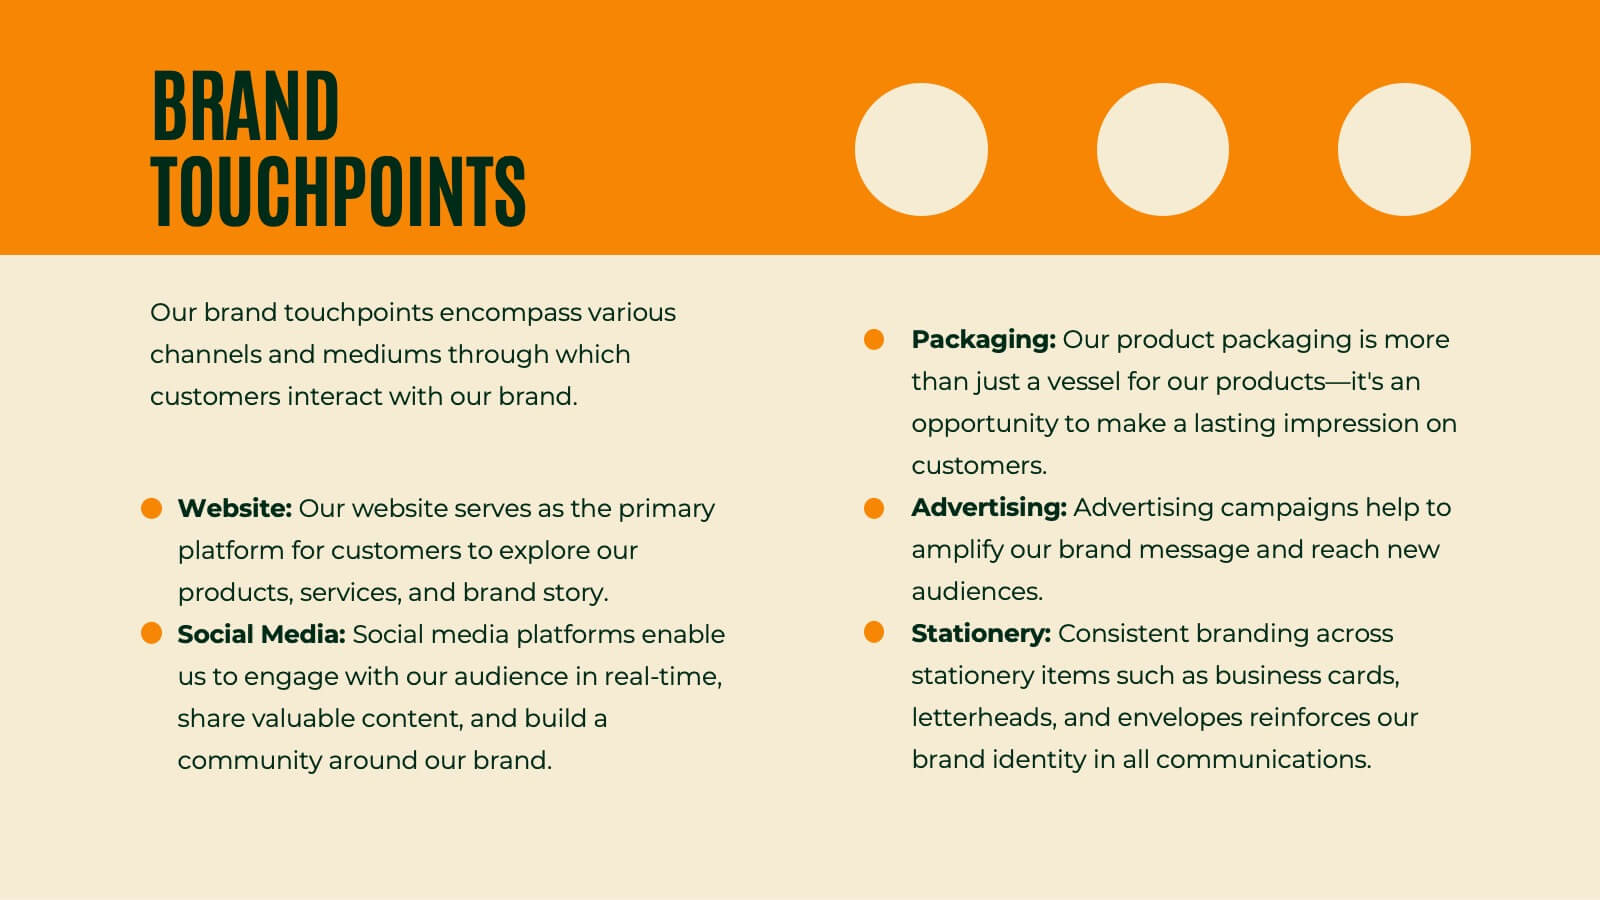
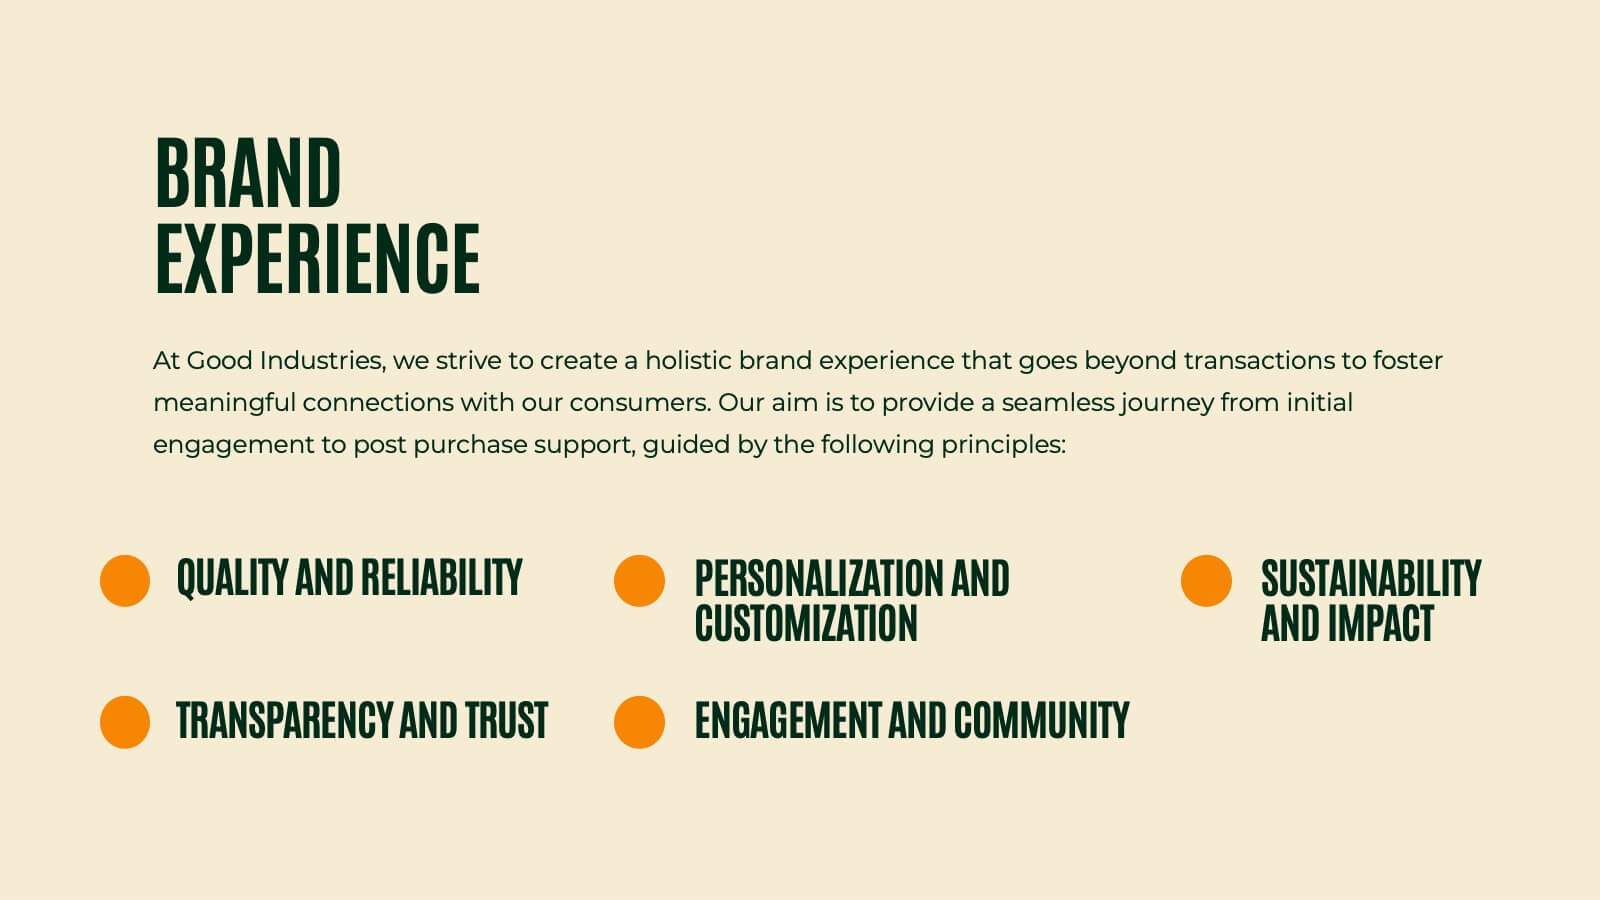
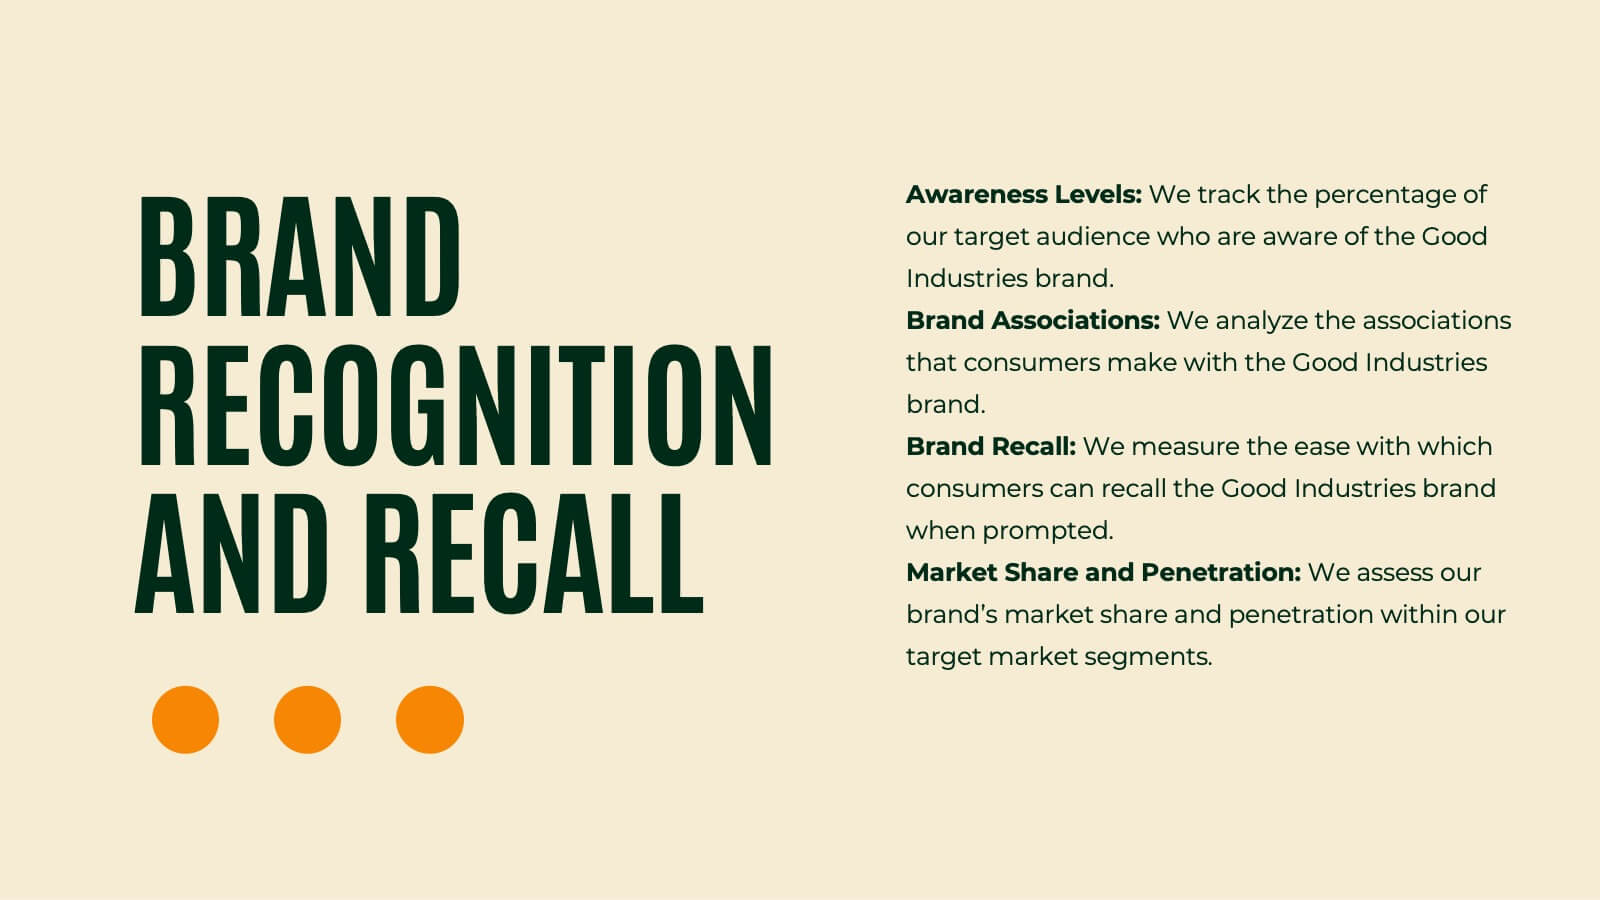
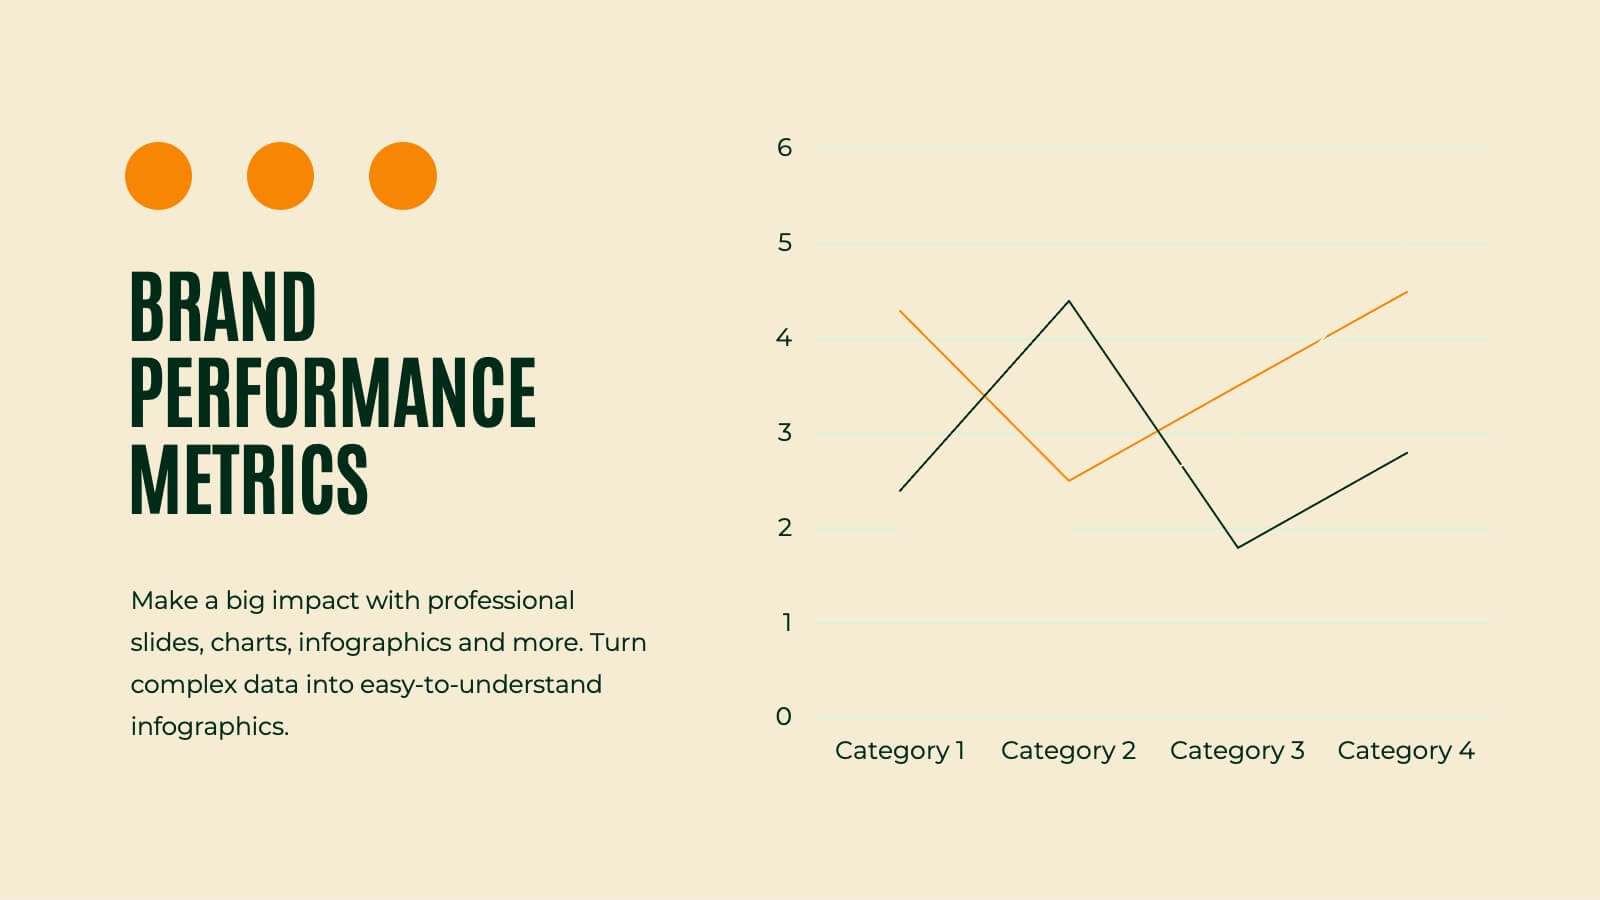
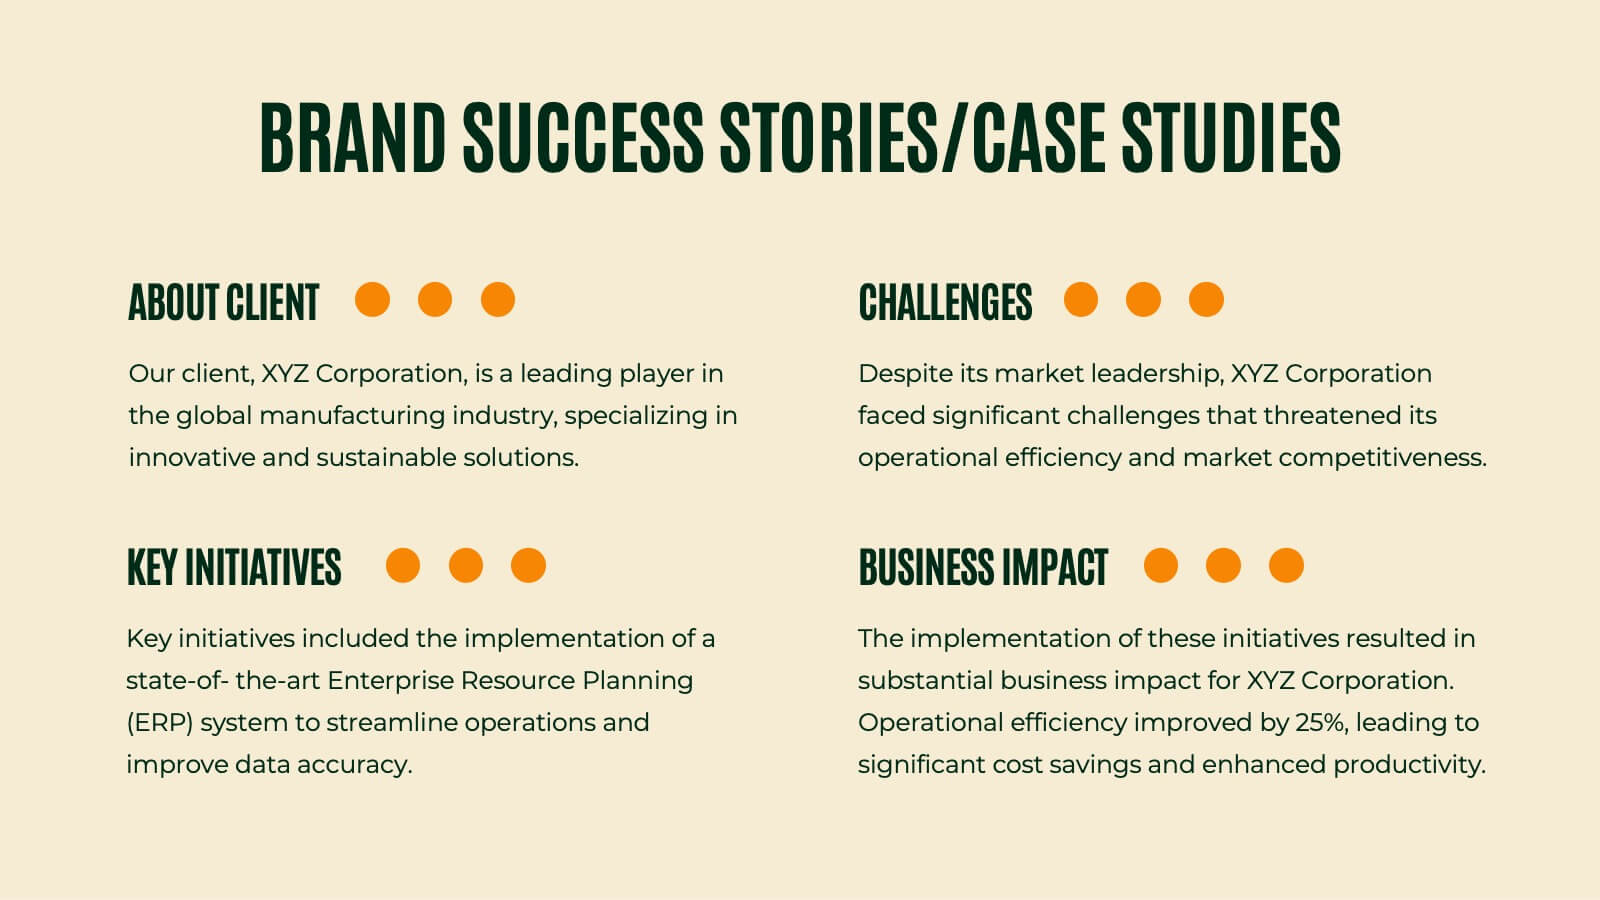
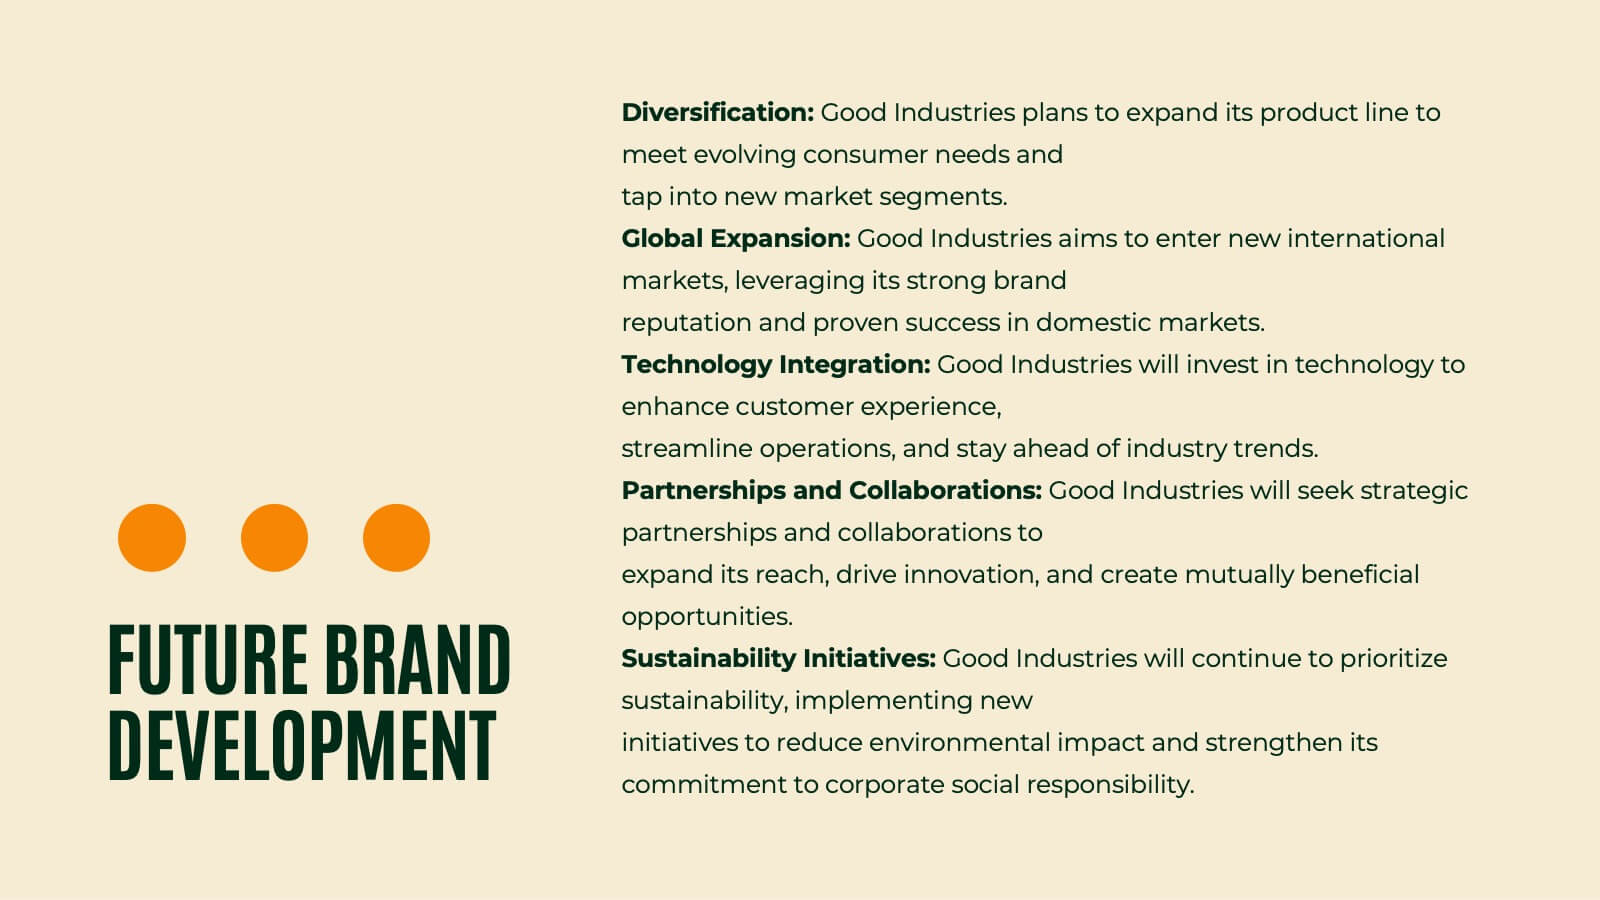
Griffin Rebranding Project Plan Presentation
Unleash the power of branding with this vibrant presentation template! This tool guides you through essential brand elements like identity, voice, and strategy. Perfect for marketers and brand managers aiming to make a memorable impact. Compatible with PowerPoint, Keynote, and Google Slides, it's a must-have for any branding project.