


Características


¿Tienes alguna pregunta?
Recomendar


5 diapositivas
Signs of Diabetes Infographics
There are several common signs and symptoms of diabetes that may indicate the presence of the condition. It's important to note that the symptoms can vary depending on the type of diabetes (Type 1 or Type 2) and individual differences. These infographic templates are informative tools made to help educate individuals about the signs and symptoms of diabetes. These are designed to raise awareness about diabetes, its early warning signs, and the importance of early detection and management. These infographic templates can be effective tools for health professionals, educators, and individuals seeking to understand the signs and symptoms of diabetes.


7 diapositivas
Digital Marketing Strategies Infographic
The Digital Marketing Strategies Infographic provides a colorful and organized presentation of key performance indicators and metrics essential for evaluating the success of digital marketing campaigns. It covers various platforms and strategies, illustrating comparative engagement rates, follower counts, and other relevant data points. This infographic is an excellent resource for marketers looking to convey their campaign results in a clear, concise manner. It is suitable for use in PowerPoint, Google Slides, and Keynote presentations, ideal for illustrating progress, setting benchmarks, and sharing insights with team members, stakeholders, or clients.


10 diapositivas
Water Resource Management Presentation
Present your strategy with this clean and modern Water Resource Management slide. Featuring droplet graphics and percentage visuals, it's ideal for showcasing water usage, sustainability goals, or conservation data. Easily customizable with titles, icons, and insights. Compatible with PowerPoint, Keynote, and Google Slides for seamless editing.


5 diapositivas
User Experience Empathy Map Strategy Presentation
Step into the user’s mindset with the User Experience Empathy Map Strategy Presentation. This template helps you visualize your audience’s thoughts, feelings, behaviors, and perceptions using a structured empathy map format. Ideal for UX workshops, customer journey analysis, or product design strategy sessions. Fully customizable in PowerPoint, Keynote, Canva, and Google Slides.


5 diapositivas
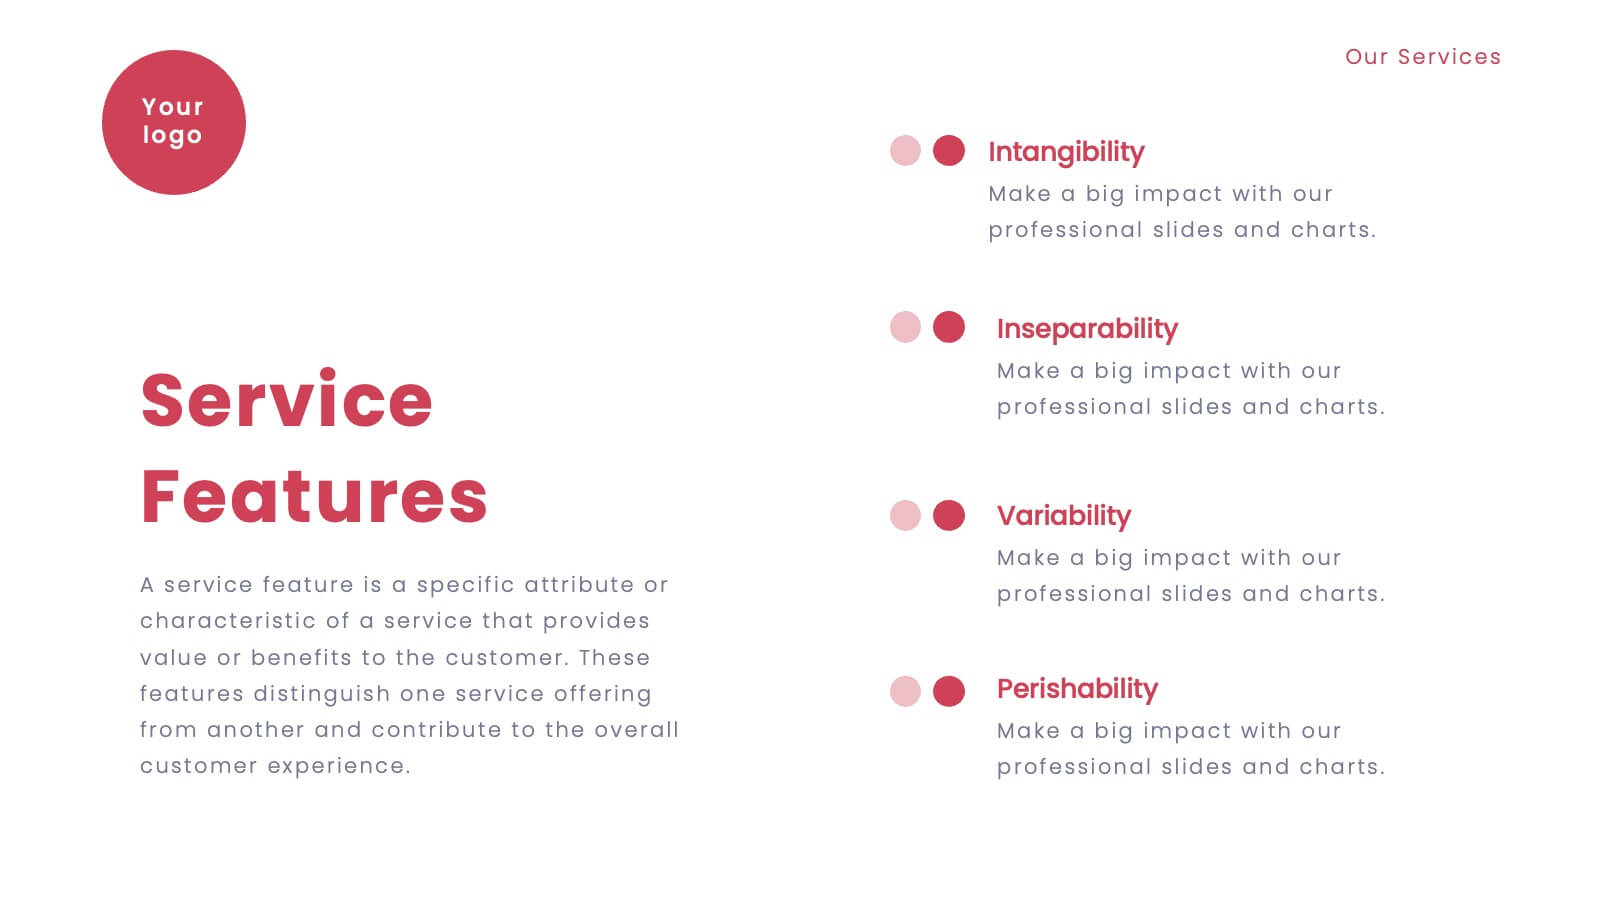
Medical Services Infographics
Navigate the complexities of healthcare information with our medical services infographics. Rendered in a life-affirming palette of blue and red, these infographics elucidate various facets of medical services. The template serves as a lifeline for healthcare professionals, and public health advocates by providing a clear, visual narrative of services, processes, and advancements in the medical field. Compatible with Powerpoint, Keynote, and Google Slides. Its creative yet informative style, enhanced with relevant graphics and icons, ensure that critical information catches the eye, improves understanding, and encourages engagement.


6 diapositivas
Effective Meeting Strategies Presentation
Maximize meeting productivity with the "Effective Meeting Strategies" presentation template. This tool offers a visually engaging layout that helps you outline and implement meeting tactics that promote efficiency and focus. Ideal for team leads and managers looking to streamline communication within meetings, it is compatible with PowerPoint, Keynote, and Google Slides, ensuring accessibility across various platforms.


22 diapositivas
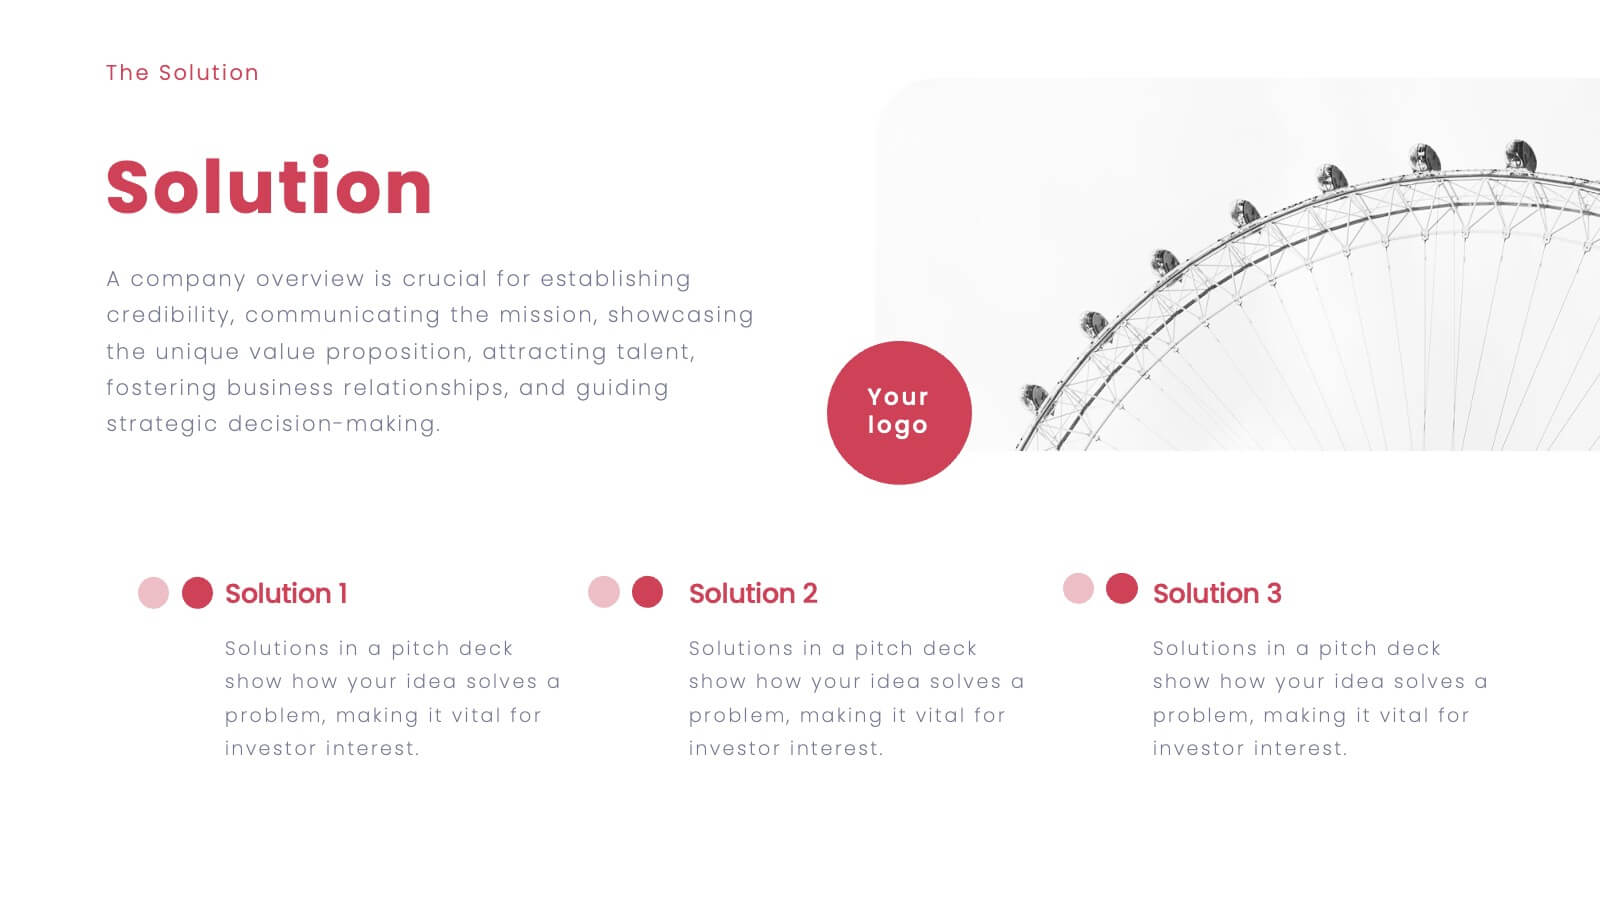
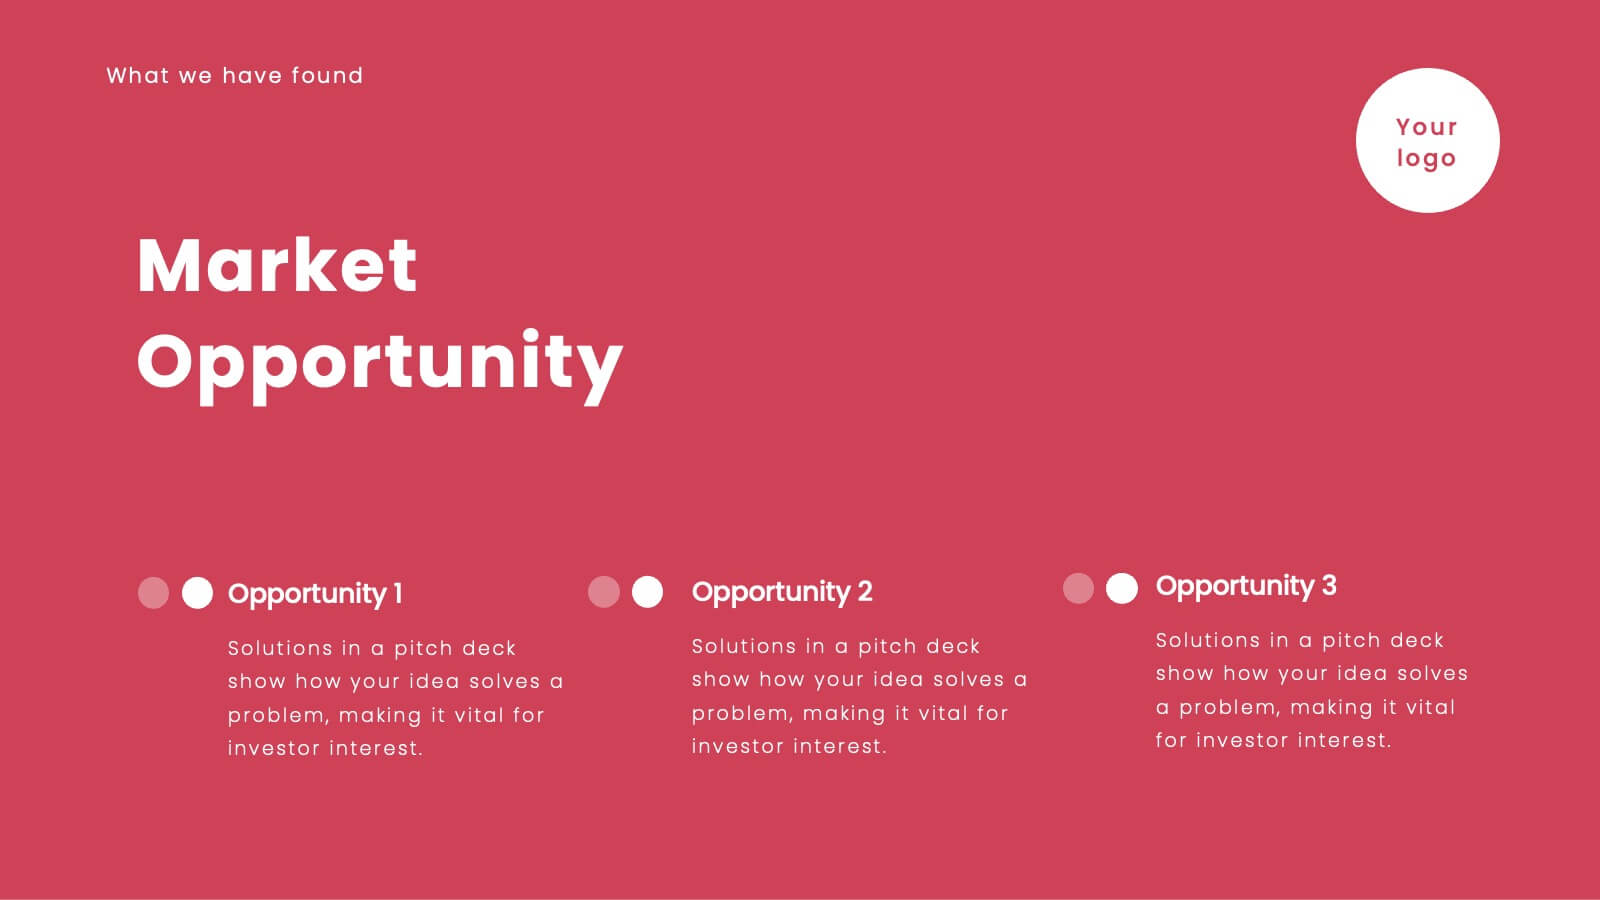
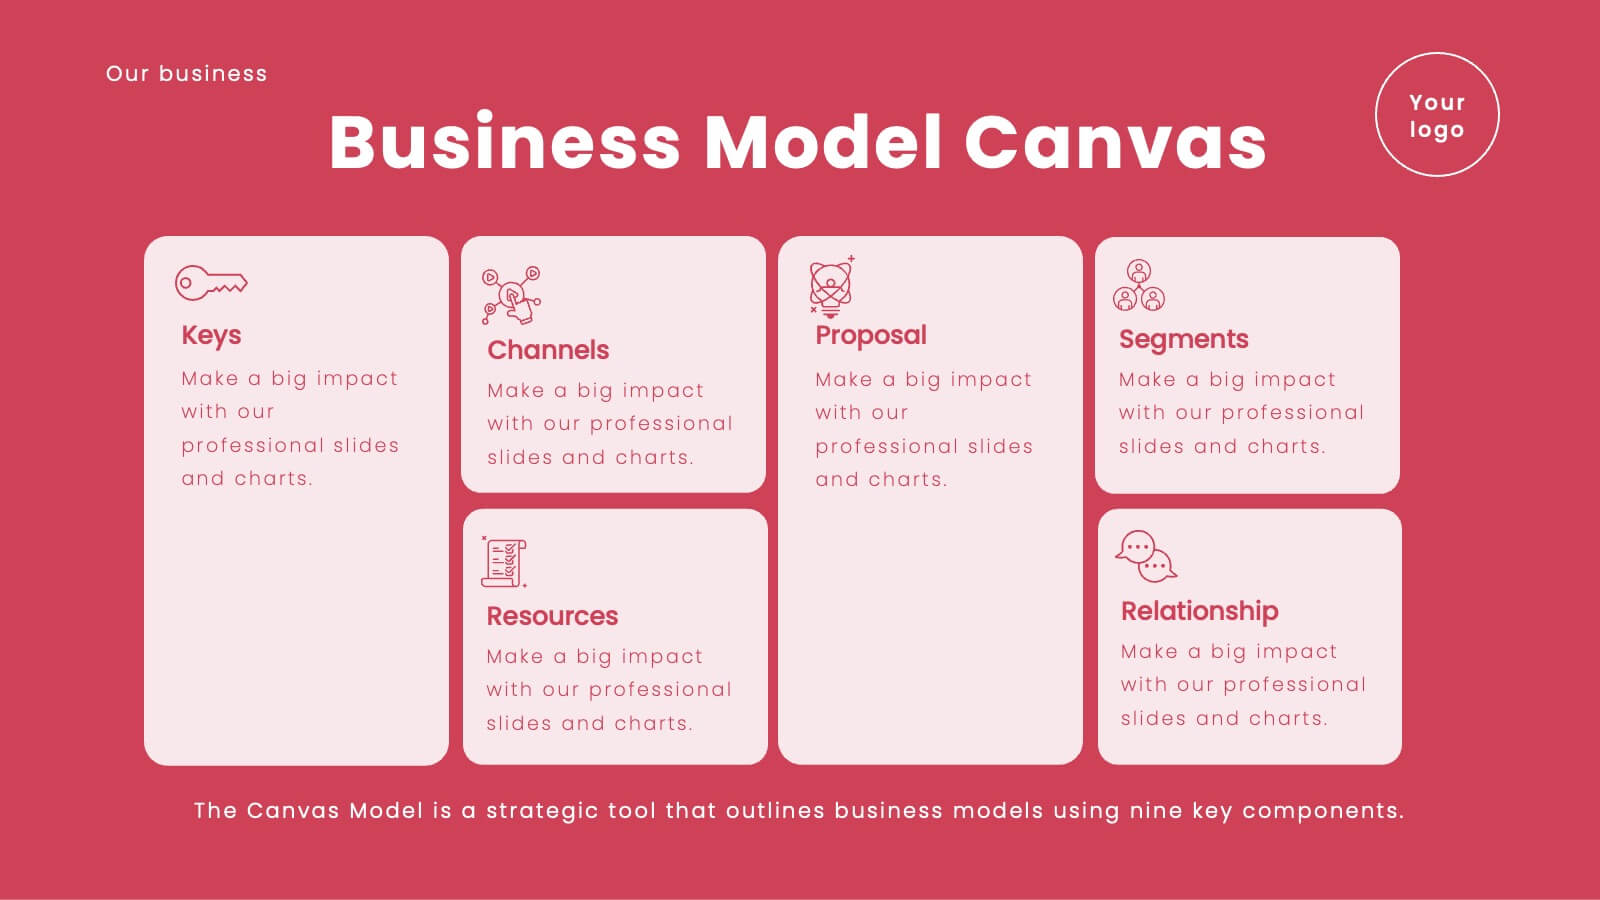
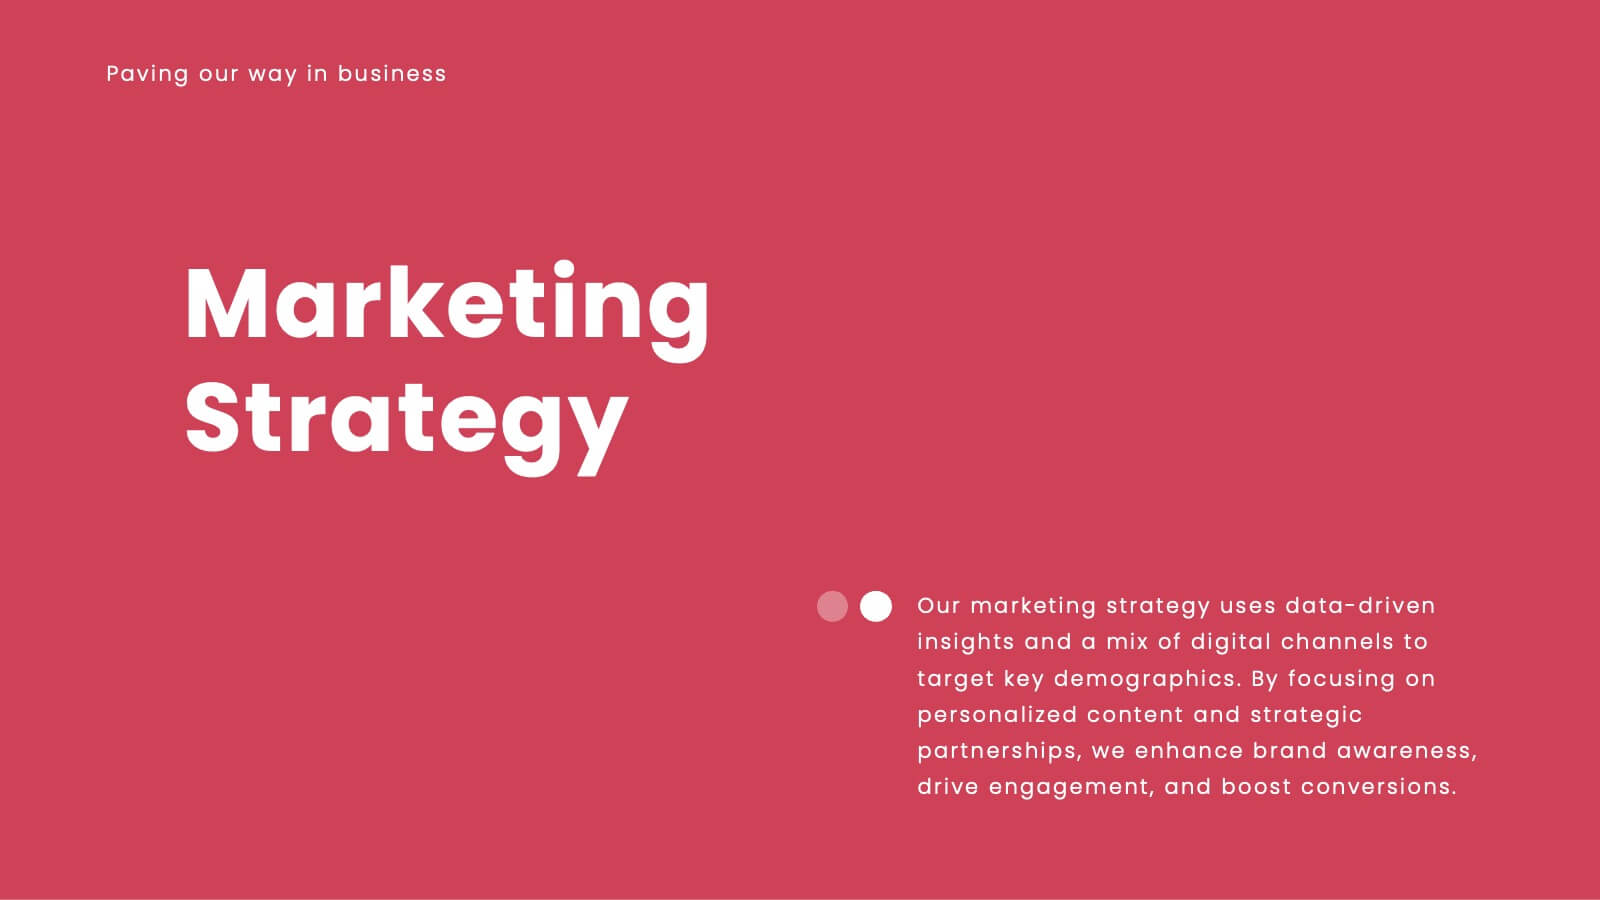
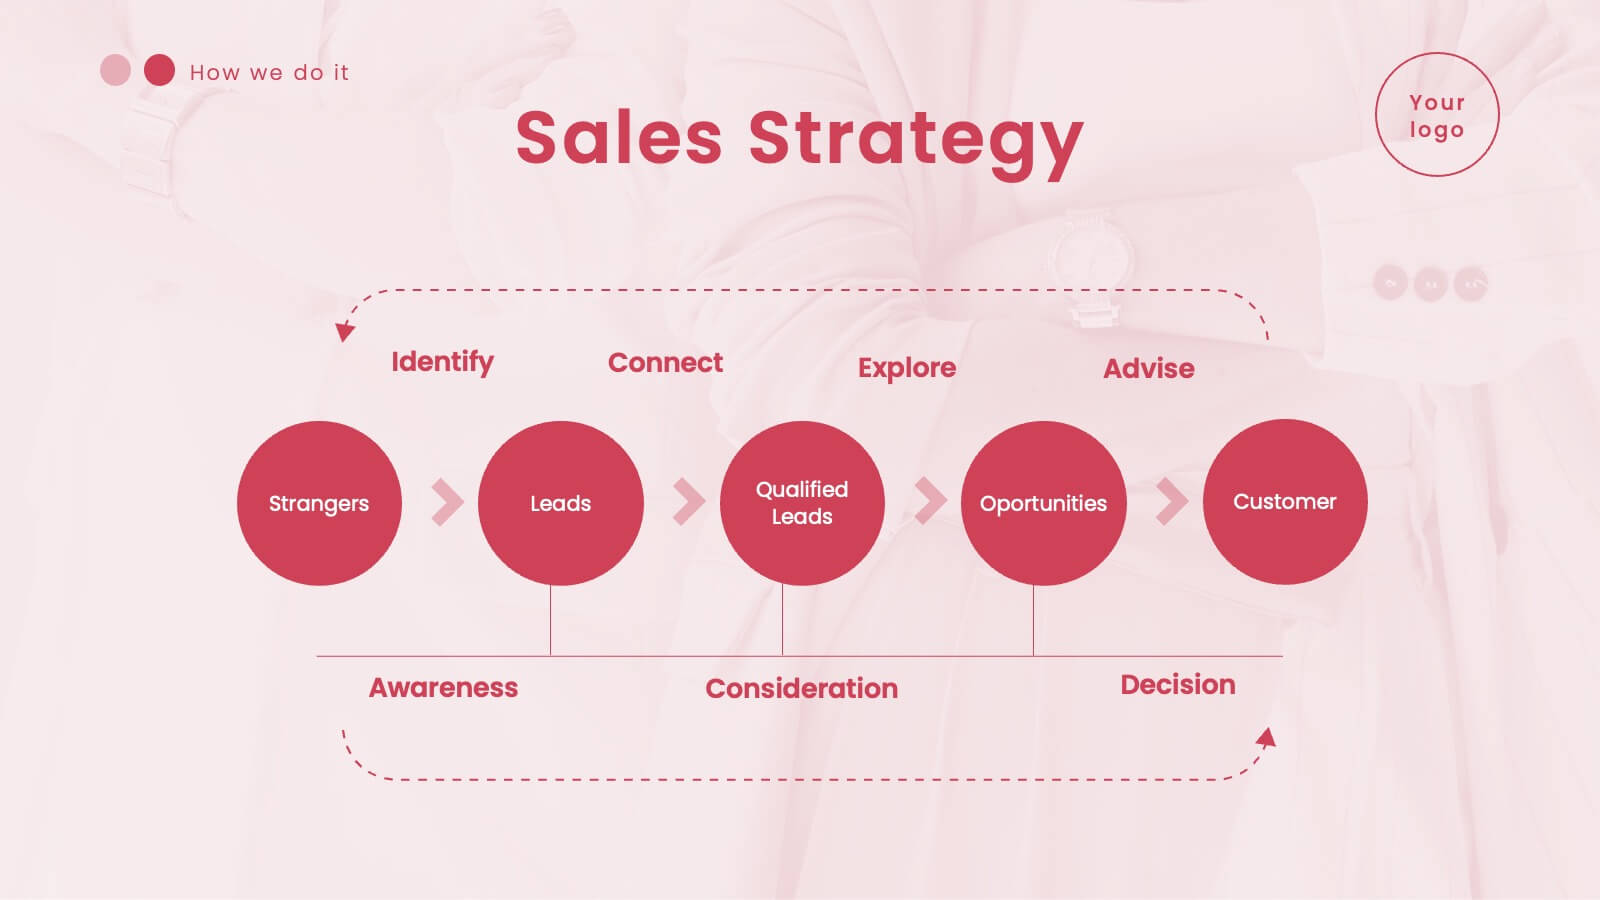
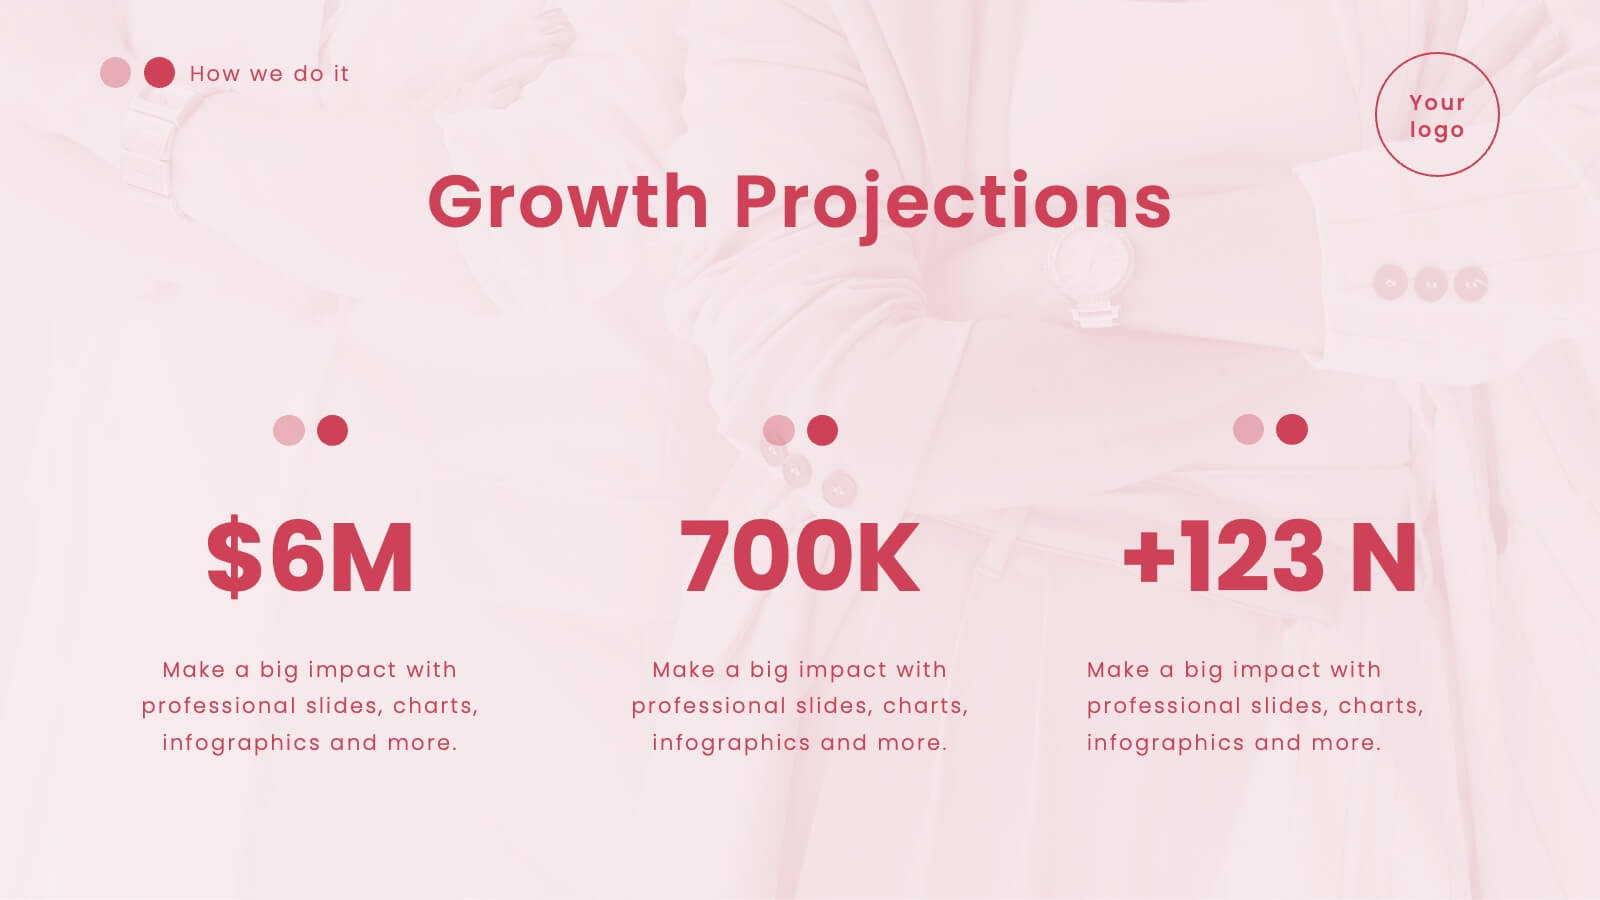
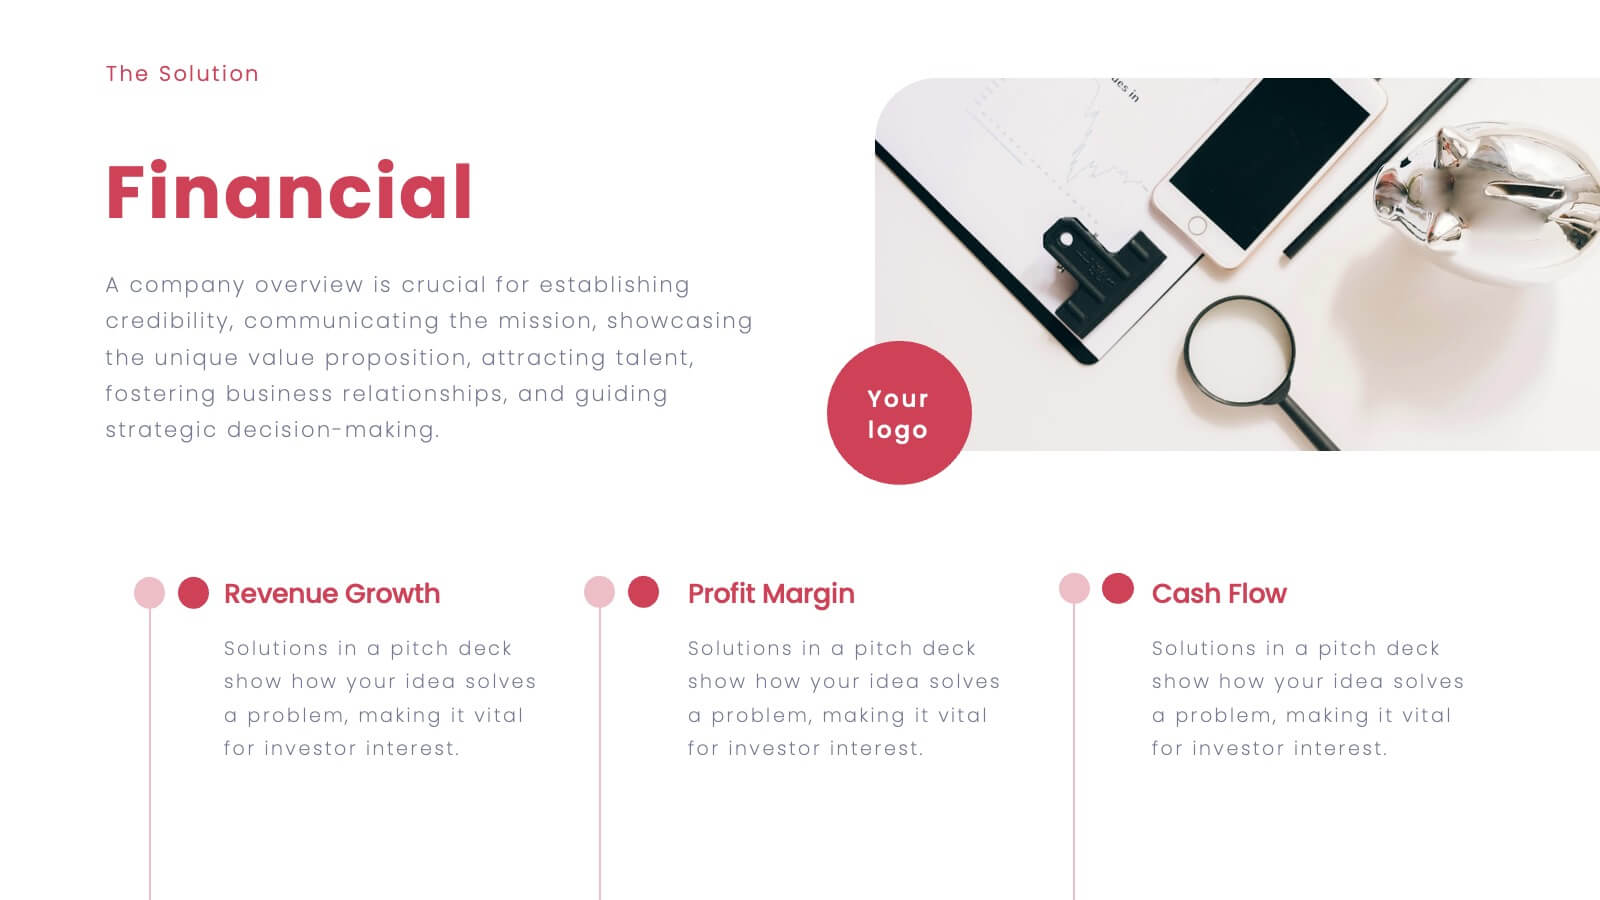
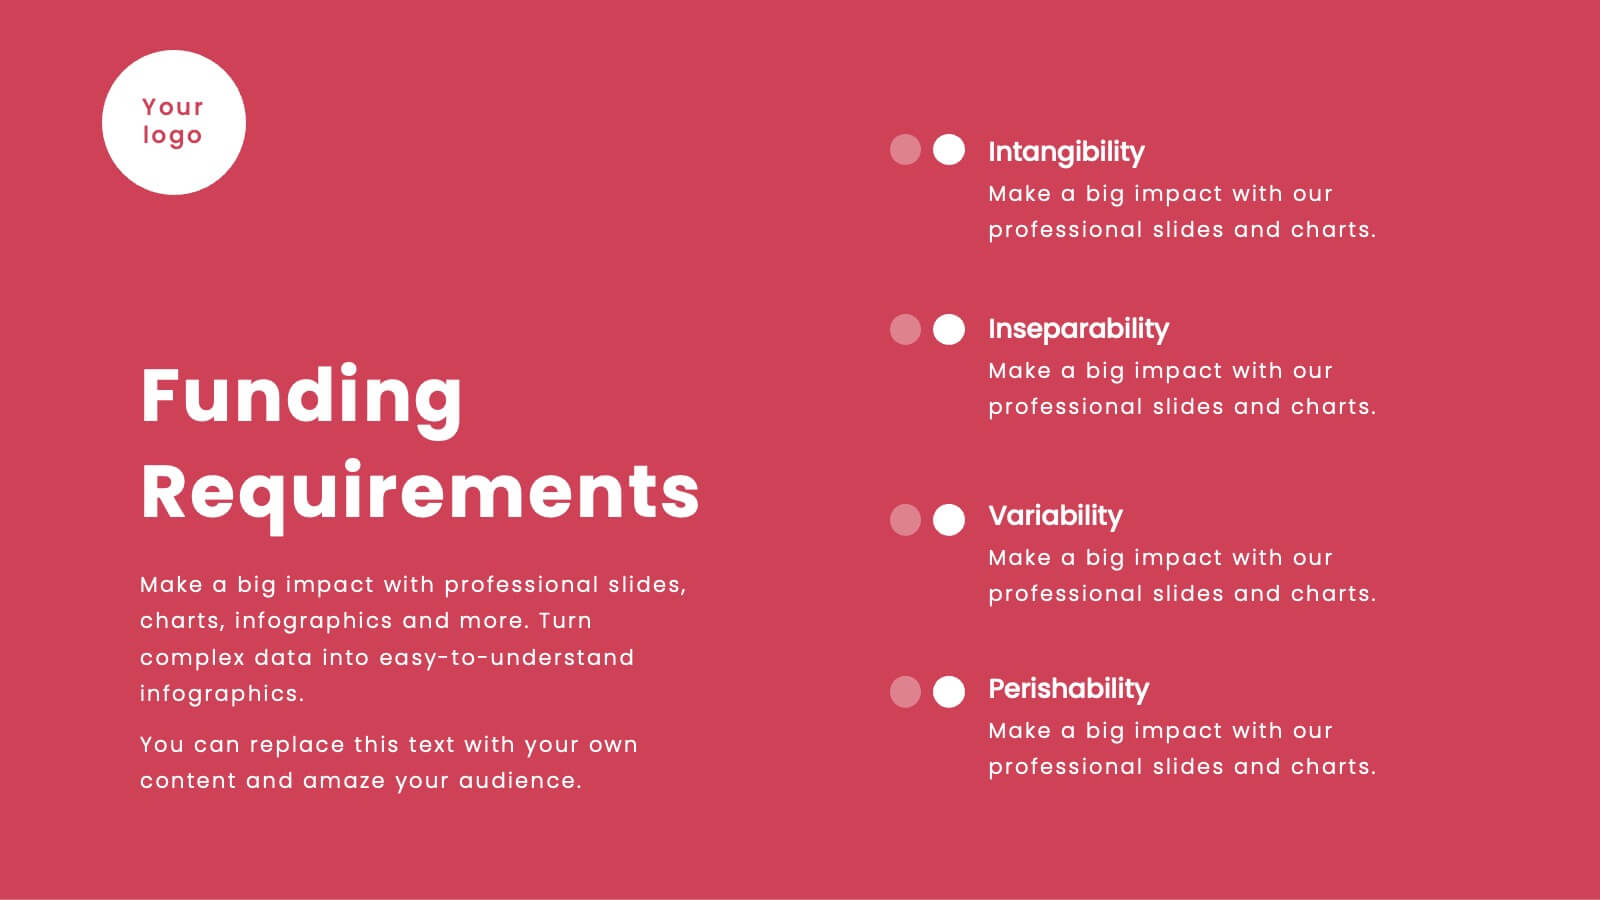
Vortex Startup Pitch Deck Presentation
Launch your ideas into action with this vibrant red pitch deck template, designed to captivate and inform potential investors. It covers everything from company overview to financials and market strategy, ensuring your vision is communicated effectively. Compatible with PowerPoint, Google Slides, and Keynote, this template is perfect for startups seeking to impress and engage.


6 diapositivas
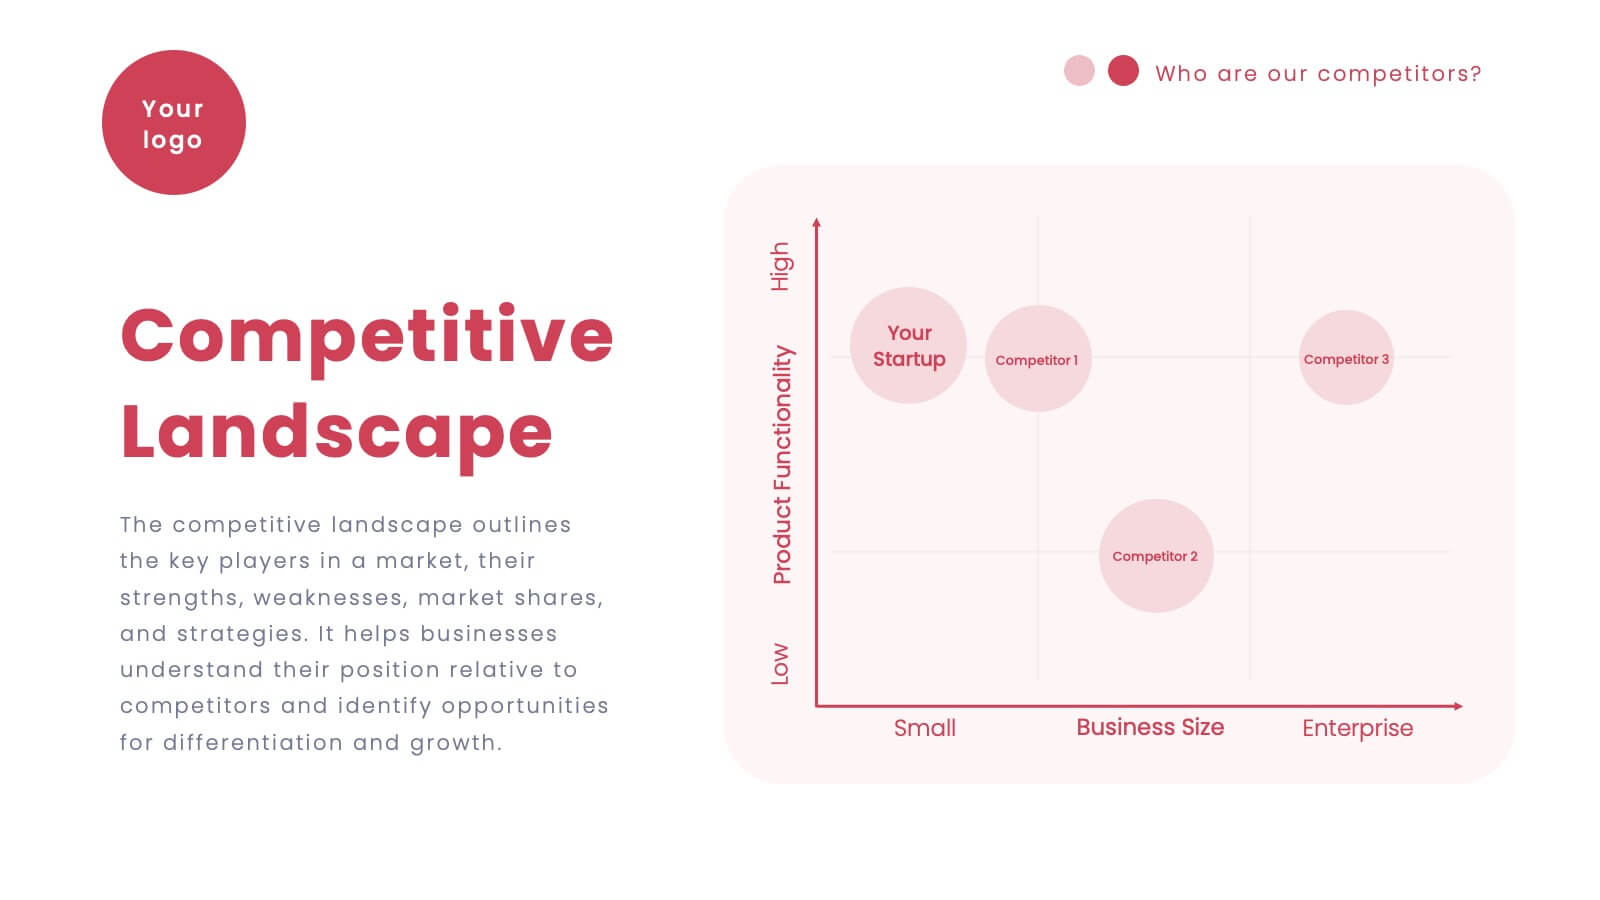
Competitive Market Forces Analysis Presentation
Elevate your insights with a dynamic circular layout that turns complex market pressures into a clear, structured story. This presentation helps you compare key forces, highlight competitive advantages, and communicate strategic recommendations with confidence and simplicity. Fully editable and compatible with PowerPoint, Keynote, and Google Slides.


6 diapositivas
Visual Resource Allocation Gantt
Easily map out team workload over time with the Visual Resource Allocation Gantt Presentation. This slide helps you assign tasks across monthly intervals, track resource distribution, and identify scheduling conflicts. Perfect for project managers, department heads, and HR planners aiming to balance capacity and timelines. Fully editable in PowerPoint, Keynote, and Google Slides.


5 diapositivas
Scrum Methodology for Product Development Presentation
Visualize each phase of your product development lifecycle using this Scrum methodology diagram. Highlight team roles, sprint cycles, and delivery steps with clear, color-coded sections. Ideal for Agile coaches, product managers, and tech teams. Fully editable in PowerPoint, Keynote, and Google Slides to align with your project planning needs.


5 diapositivas
Wedding Itinerary Infographics
A Wedding Itinerary is a detailed schedule or timeline that outlines the events and activities planned for a wedding day. These infographic templates aim to assist couples in creating a visually appealing and informative itinerary for their wedding events. These infographics are perfect for preparing a presentation for guests, sharing details with the wedding party, or showcasing wedding planning services, this template will help you create a memorable and well-organized wedding experience. This is compatible with PowerPoint, Keynote, and Google Slides making it easily editable to personalize the template with your information.


5 diapositivas
USA Regional Map Slide Presentation
Bring your data to life with a bold, colorful snapshot of regional insights across the United States. This presentation makes it easy to highlight state-level trends, compare demographics, and visualize performance using clean map graphics and simple icons. Fully compatible with PowerPoint, Keynote, and Google Slides.


6 diapositivas
Market Challenges and Competitive Solutions Presentation
Visually map out business hurdles and strategic responses with this sleek 6-step infographic layout. Perfect for showcasing pain points on one side and proposed solutions on the other, it's ideal for sales decks, strategy reports, or competitor analysis. Customize each icon, title, and section easily in PowerPoint, Keynote, or Google Slides.


7 diapositivas
South America Countries Map Infographic
This South America Countries Map infographic template is designed for detailed presentations on the geographical and statistical information of South American countries. Compatible with PowerPoint, Google Slides, and Keynote, the template set includes maps with data points indicating various statistics such as population percentages, and demographic information. Visual aids like pie charts, bar graphs, and icon representations help to depict data in an easily understandable manner. The color-coding and labels are clear, making it easy to differentiate between countries and regions. This template is ideal for educators, analysts, and business professionals needing to present country-specific data across South America.


4 diapositivas
IT Network Infrastructure Presentation
Optimize your IT infrastructure with this IT Network Infrastructure template. Designed with a cloud-based network architecture layout, this slide helps illustrate data flow, system components, and key IT connections in a structured format. Perfect for IT professionals, network engineers, and tech strategists, this fully customizable slide works seamlessly with PowerPoint, Keynote, and Google Slides.


2 diapositivas
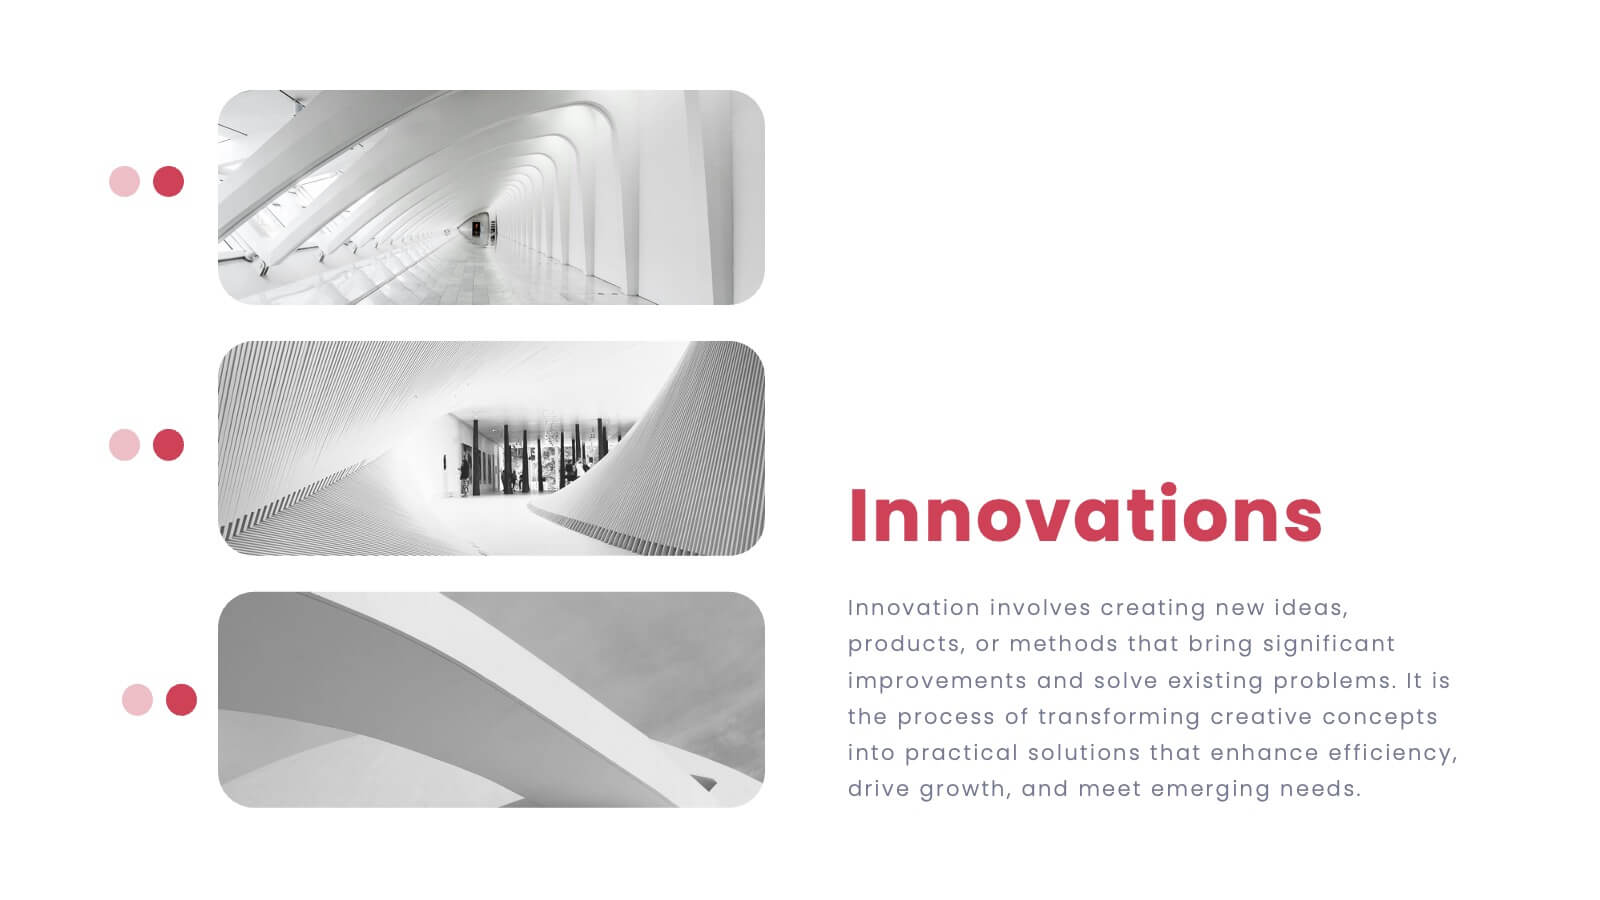
Creative Work Portfolio Collection Presentation
Present your projects with impact using the Creative Work Portfolio Collection Presentation. Designed for photographers, artists, and creators, this layout highlights visuals while leaving space for thoughtful captions or project notes. Easily editable and fully compatible with Canva, PowerPoint, Keynote, and Google Slides to match your brand and showcase your style.


7 diapositivas
30 60 90 Business Plan Infographic
A 30-60-90 day plan is a strategic outline of goals and objectives that a person plans to achieve within specific timeframes—30, 60, and 90 days. Dive into the heart of strategic planning with our 30 60 90 business plan infographic. This bold and dynamic template is a visual roadmap, guiding you through the critical phases of a business plan and setting a solid course for success. Compatible with Powerpoint, Keynote, and Google Slides. This infographic is a powerful tool, illustrating the journey from inception to triumph in 90 days. Explore each crucial phase in crafting an effective business plan.