


Características


¿Tienes alguna pregunta?
Recomendar


6 diapositivas
Circle Diagram for Organizational Structure Presentation
Visualize team roles and functions with the Circle Diagram for Organizational Structure Presentation. This hexagon-centered circular layout clearly displays six departments or categories around a unified core, using icons and color coding for easy interpretation. Perfect for showcasing business units, workflows, or collaborative systems. Fully editable in PowerPoint, Google Slides, and Canva.


12 diapositivas
Risk Management and Security Compliance Presentation
Enhance your organizational resilience with the 'Risk Management and Security Compliance' presentation template. This intuitive design helps you communicate complex compliance standards and risk mitigation strategies effectively. Ideal for training sessions, board meetings, and compliance audits, ensuring your team stays informed and proactive in managing risks.


2 diapositivas
App Design Mockup Presentation
Present your mobile app in style with the App Design Mockup slide. This sleek and modern template features a large smartphone frame to showcase your UI/UX designs with a creative touch. Ideal for app developers, designers, and pitch decks. Fully customizable and compatible with PowerPoint, Keynote, and Google Slides.


10 diapositivas
Revenue Growth Strategies and Metrics Presentation
Highlight your key success drivers with the Revenue Growth Strategies and Metrics Presentation. This upward arrow-based layout is perfect for showcasing growth phases, financial KPIs, or strategic revenue initiatives. Clean, professional, and fully editable in PowerPoint, Keynote, and Google Slides—ideal for business reviews, sales pitches, and quarterly updates.


4 diapositivas
Stock Market Insights and Trends Presentation
Visualize complex financial data with ease using the Stock Market Insights and Trends presentation template. This layout features a bold line chart with labeled milestones to highlight key shifts in performance, market patterns, or strategic indicators. Ideal for investment reports, financial briefings, and economic updates. Perfect for analysts, finance professionals, and business strategists. Fully editable and compatible with PowerPoint, Keynote, and Google Slides.


28 diapositivas
Pitch Deck Entrepreneur's Canvas Presentation
Sharpen your business presentation with this Pitch Deck template. It covers essential areas such as market opportunity, business model, and competitive analysis, designed for startups and entrepreneurs. Fully customizable and compatible with PowerPoint, Keynote, and Google Slides, it's ideal for impressing investors and partners with your business vision.


6 diapositivas
Data Analysis Statistics Infographic
Data analysis refers to the process of inspecting, cleaning, transforming, and modeling data with the goal of discovering useful information, making informed decisions, and drawing meaningful conclusions. This infographic is an effective way to present complex data and insights in a visually appealing and easily understandable format. The goal of this data analysis Infographic is to make complex data understandable and engaging. By using appropriate visualizations, clear explanations, and an attractive design, you can effectively convey insights to your audience. Compatible with Powerpoint, Keynote, and Google Slides.


8 diapositivas
Market Expansion Strategies in North America Map Presentation
Visualize your market growth plans with this strategic North America map slide. Highlight four regional expansion points with vibrant markers and customizable labels. Perfect for showcasing entry strategies, regional goals, or sales plans. Fully editable in PowerPoint, Keynote, and Google Slides—ideal for professional business and marketing presentations.


7 diapositivas
Aviation Management Infographic
Aviation management encompasses the effective and efficient operation of various facets within the aviation industry. This vibrant and informative infographic is designed to take you through the skies of efficient aviation operations and successful management strategies. Compatible with Powerpoint, Keynote, and Google Slides. This template involves planning, organizing, directing, and coordinating the activities of airlines, airports, and other organizations related to aviation and aerospace. The featured jet visuals symbolizes the aviation industry's movement and efficiency, setting the tone for the informative adventure.


6 diapositivas
Value Chain Management Infographics
Optimize your business operations with our Value Chain Management infographic template. This template is fully compatible with popular presentation software like PowerPoint, Keynote, and Google Slides, enabling you to effortlessly customize it to visualize and improve your value chain. The Value Chain Management infographic template offers a visually engaging platform to depict the various activities and processes involved in creating value for your customers. Whether you're a supply chain professional, business owner, or manager, this template provides a user-friendly canvas to create informative presentations and strategies for value chain optimization. Boost your business's efficiency and competitiveness with this SEO-optimized Value Chain Management infographic template, thoughtfully designed for clarity and ease of use. Customize it to highlight key components of your value chain, identify areas for improvement, and streamline your operations for enhanced value creation. Start crafting your personalized infographic today to excel in value chain management.


5 diapositivas
Fitness Trainings Infographics
Fitness Training refers to structured physical activities or exercises designed to improve and maintain physical fitness, overall health, and athletic performance. Using these infographic templates, you can effectively educate your audience about different fitness training techniques, inspire them to adopt a healthy and active lifestyle, and provide them with practical tips and guidance for their fitness journey. These are designed to showcase various fitness training concepts, techniques, and tips. Whether you're a fitness instructor, personal trainer, or fitness enthusiast, this template is a valuable resource to educate and motivate your audience about fitness training.


6 diapositivas
Project Summary Report Presentation
Enhance your project reviews with our "Project Summary Report Presentation" template. This slide is expertly designed to summarize key project aspects such as objectives, milestones, and outcomes, structured into sections labeled A, B, and C. Featuring an image of a collaborative team setting, the template underscores the essence of teamwork and productivity in project management. Each section is organized to clearly communicate your project’s progress and results to stakeholders. Ideal for project managers and teams, this template supports effective storytelling in project updates. Compatible with PowerPoint, Keynote, and Google Slides, it’s an essential tool for delivering impactful and organized project presentations.


5 diapositivas
User Experience Empathy Map Strategy Presentation
Step into the user’s mindset with the User Experience Empathy Map Strategy Presentation. This template helps you visualize your audience’s thoughts, feelings, behaviors, and perceptions using a structured empathy map format. Ideal for UX workshops, customer journey analysis, or product design strategy sessions. Fully customizable in PowerPoint, Keynote, Canva, and Google Slides.


7 diapositivas
Pricing Comparison Table Infographic
Dive into the strategic world of pricing with our intricately designed pricing table infographic. Imbued with the trustworthiness of blue, the crisp clarity of white, the optimism of yellow, and the urgency of red, our template visualizes pricing strategies in an engaging manner. Furnished with detailed infographics, distinct icons, and adaptable image placeholders, it translates complex pricing data into an easy-to-grasp format. Seamlessly crafted for Powerpoint, Keynote, or Google Slides. A vital asset for business analysts, marketers, sales professionals, or any brand strategizing its pricing model. Engage your audience; let every slide be a value proposition.


5 diapositivas
User-Centered Design with Empathy Map Presentation
Improve User Insights with the Empathy Map for User-Centered Design! This User-Centered Design with Empathy Map template provides a structured approach to understanding user behaviors, motivations, and needs. Designed with clear quadrant sections, this template helps teams map out key insights for UX research, customer journey mapping, and product development. Ideal for designers, marketers, and strategists, this fully editable slide deck works seamlessly with PowerPoint, Keynote, and Google Slides for a hassle-free customization experience.


20 diapositivas
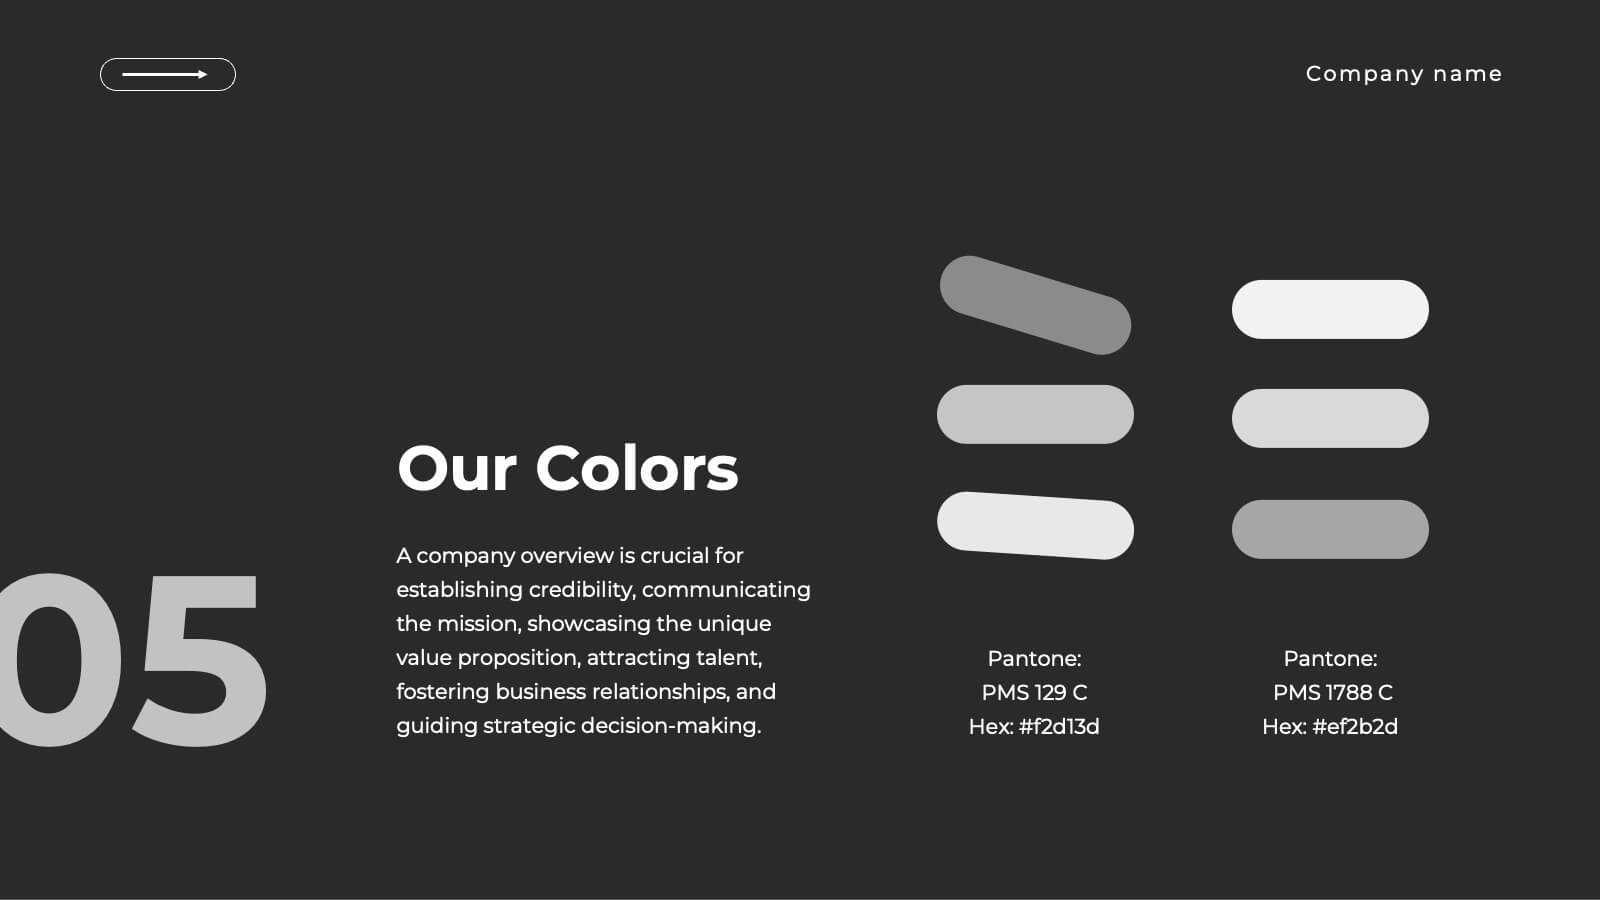
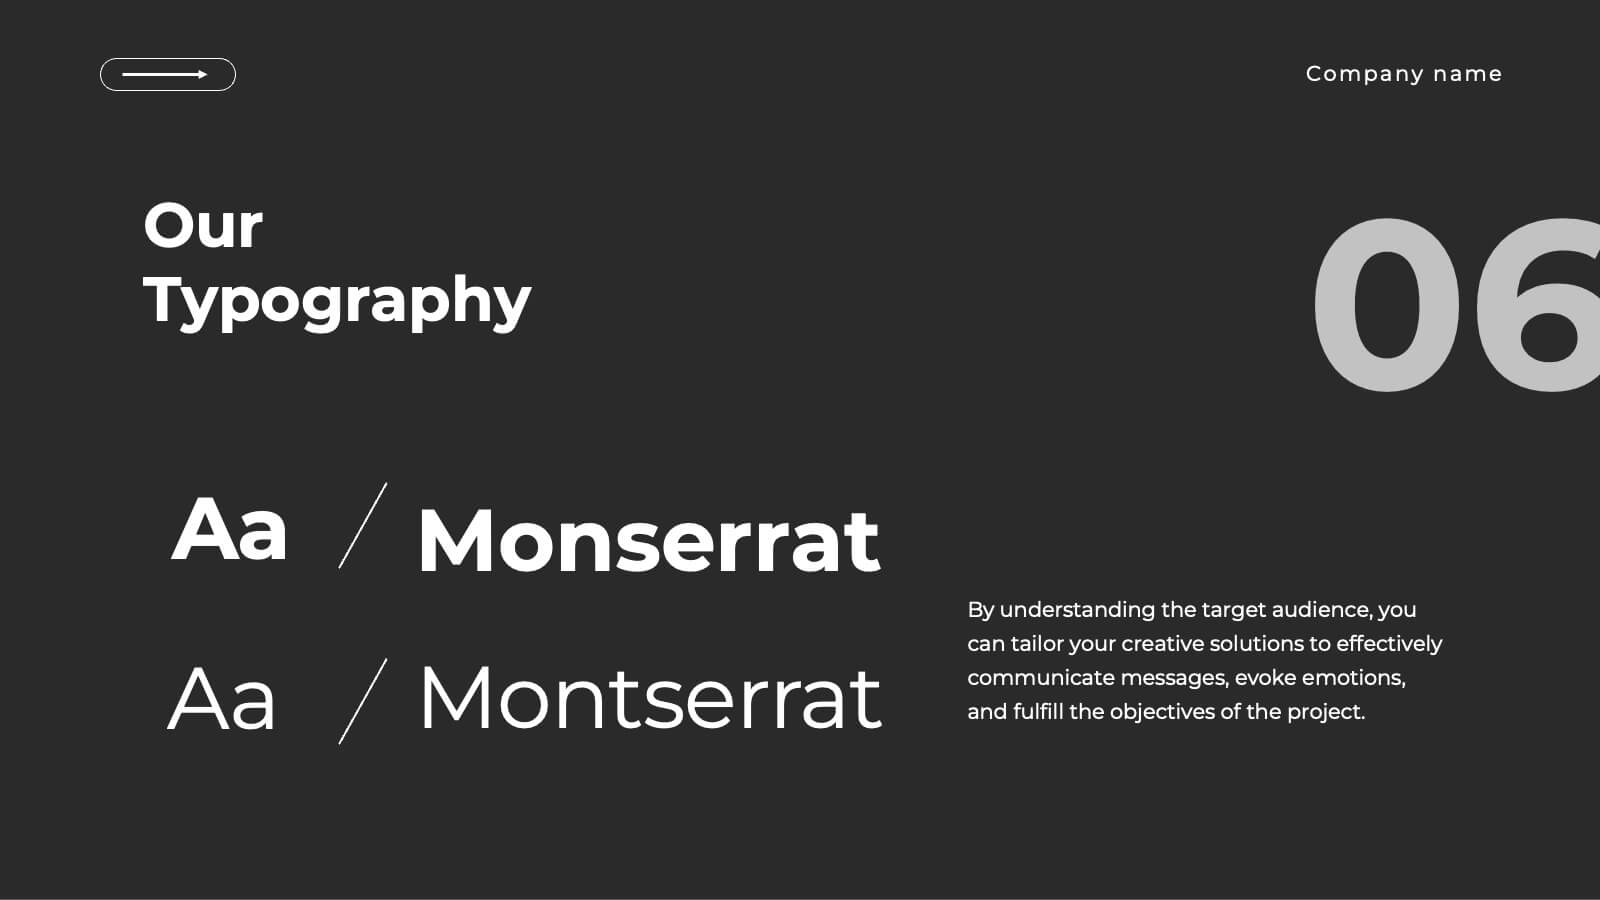
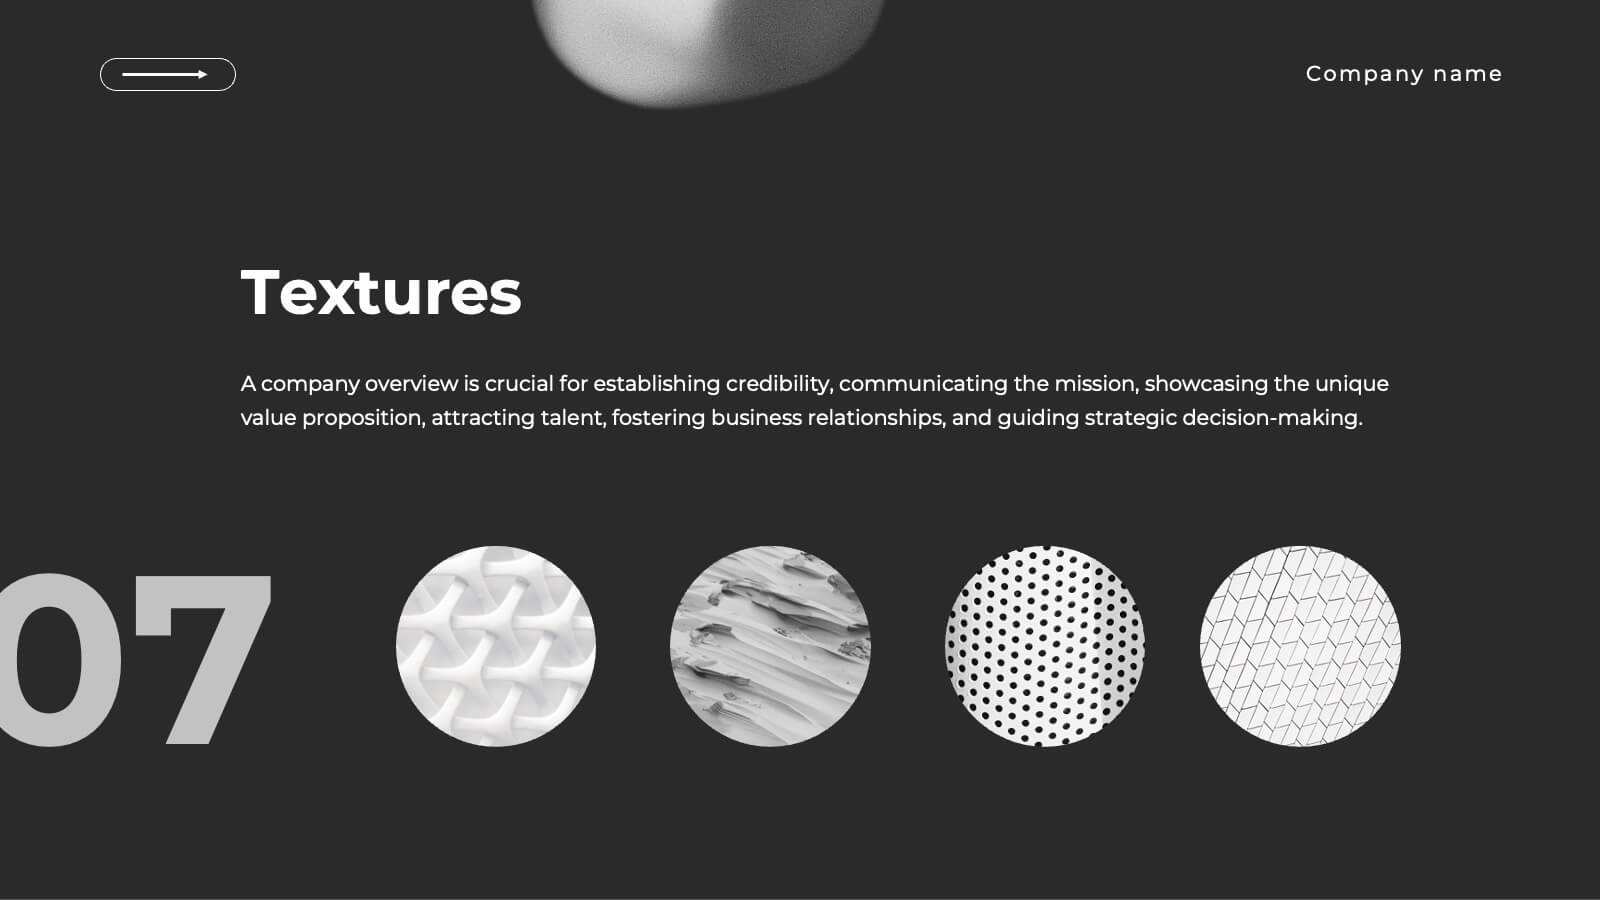
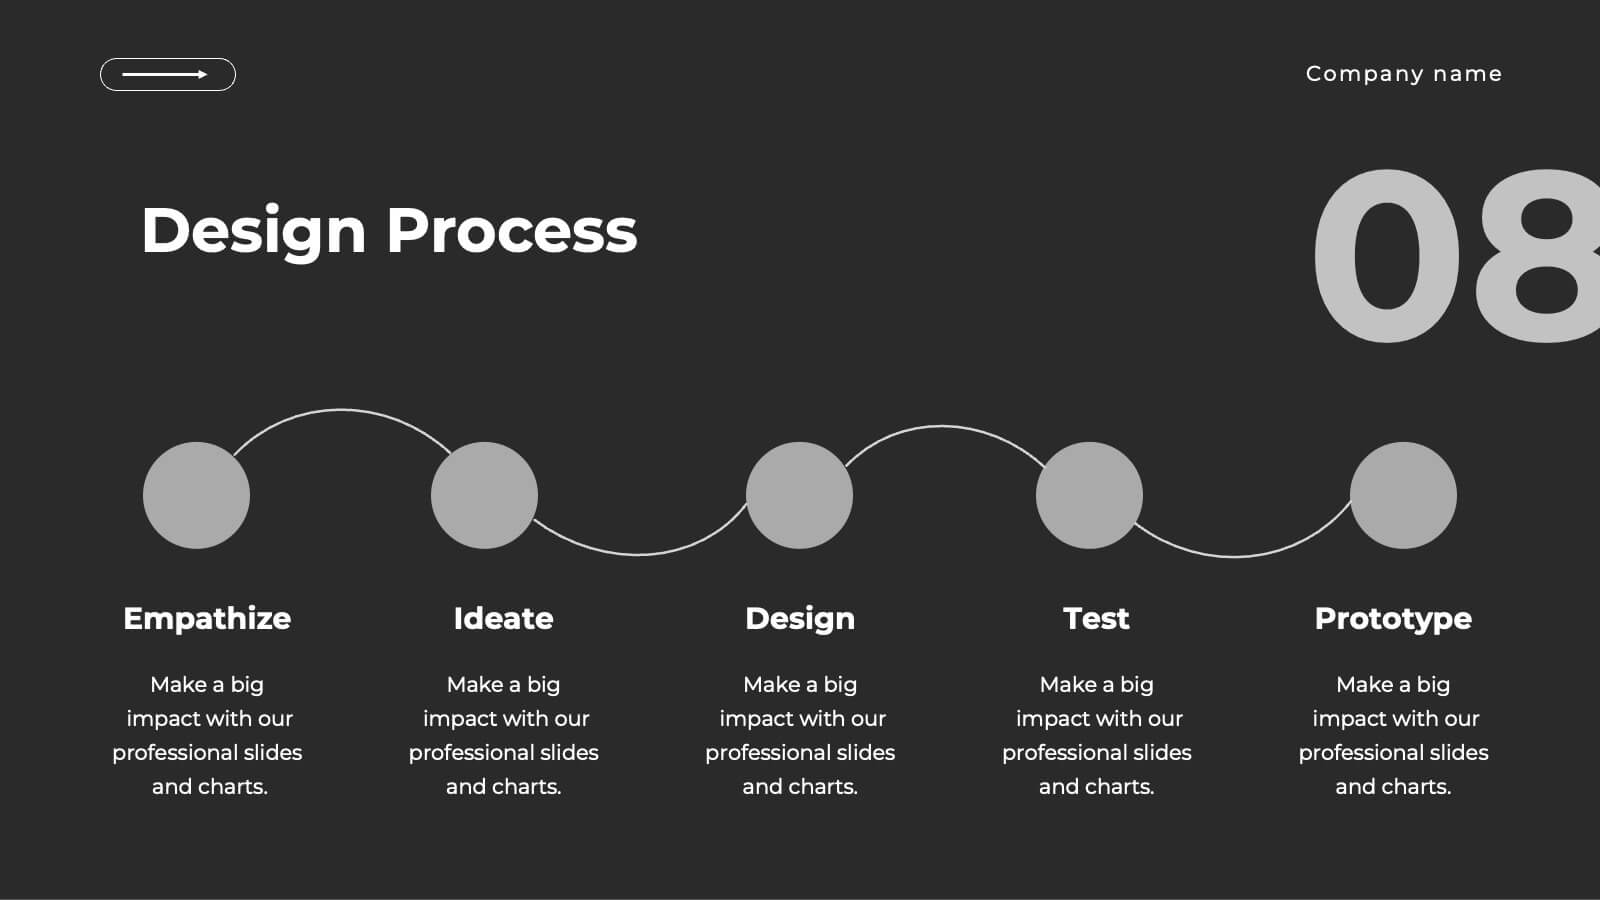
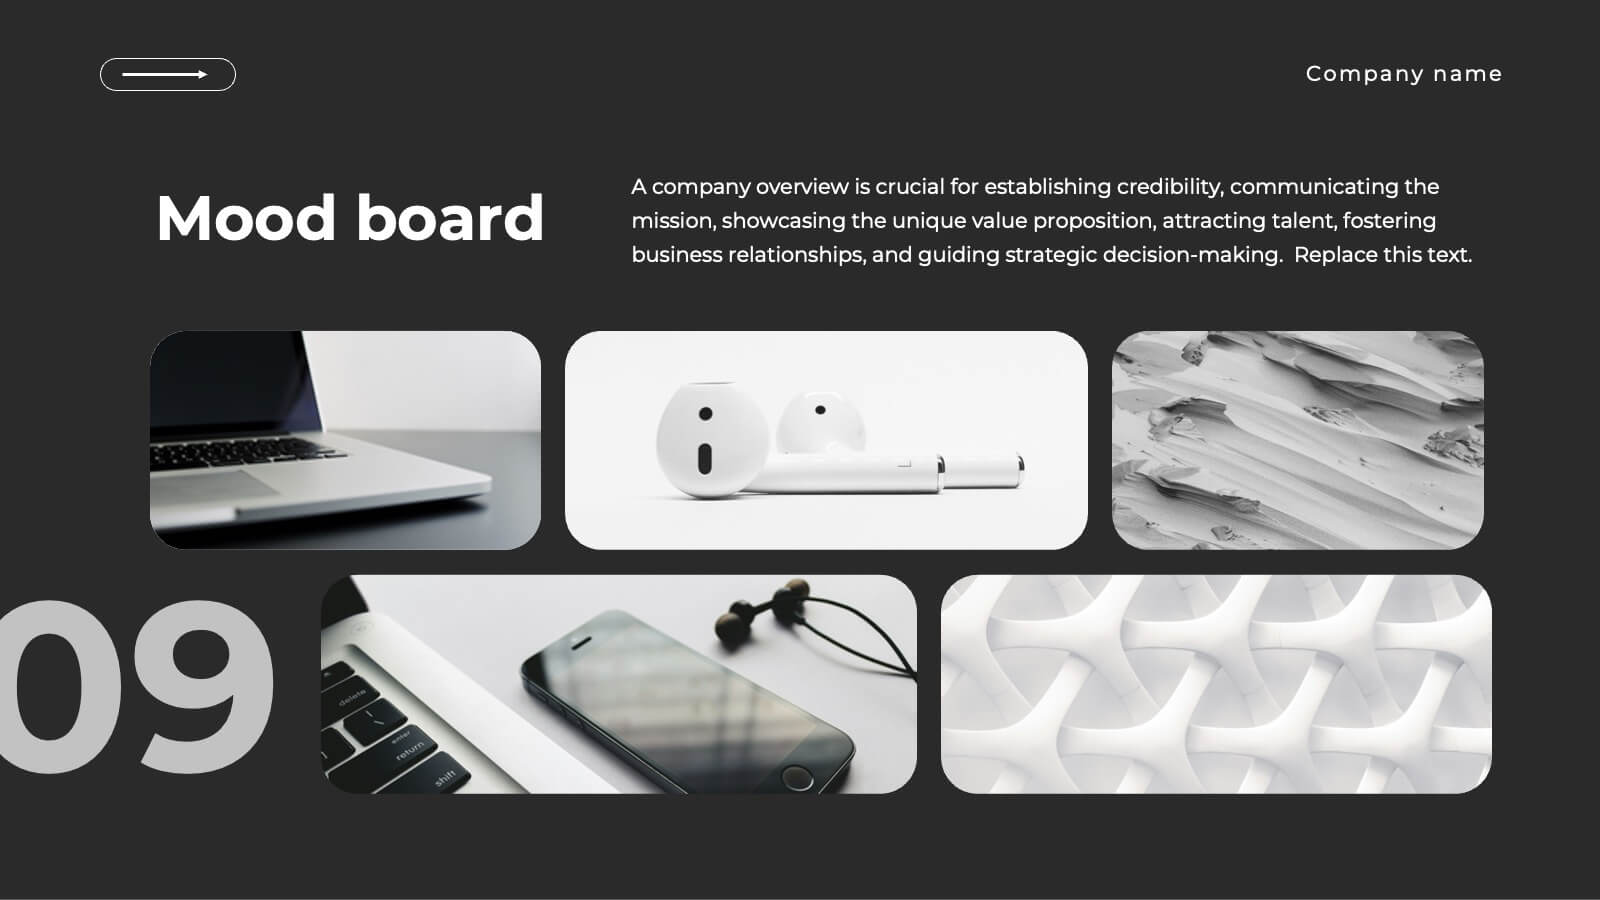
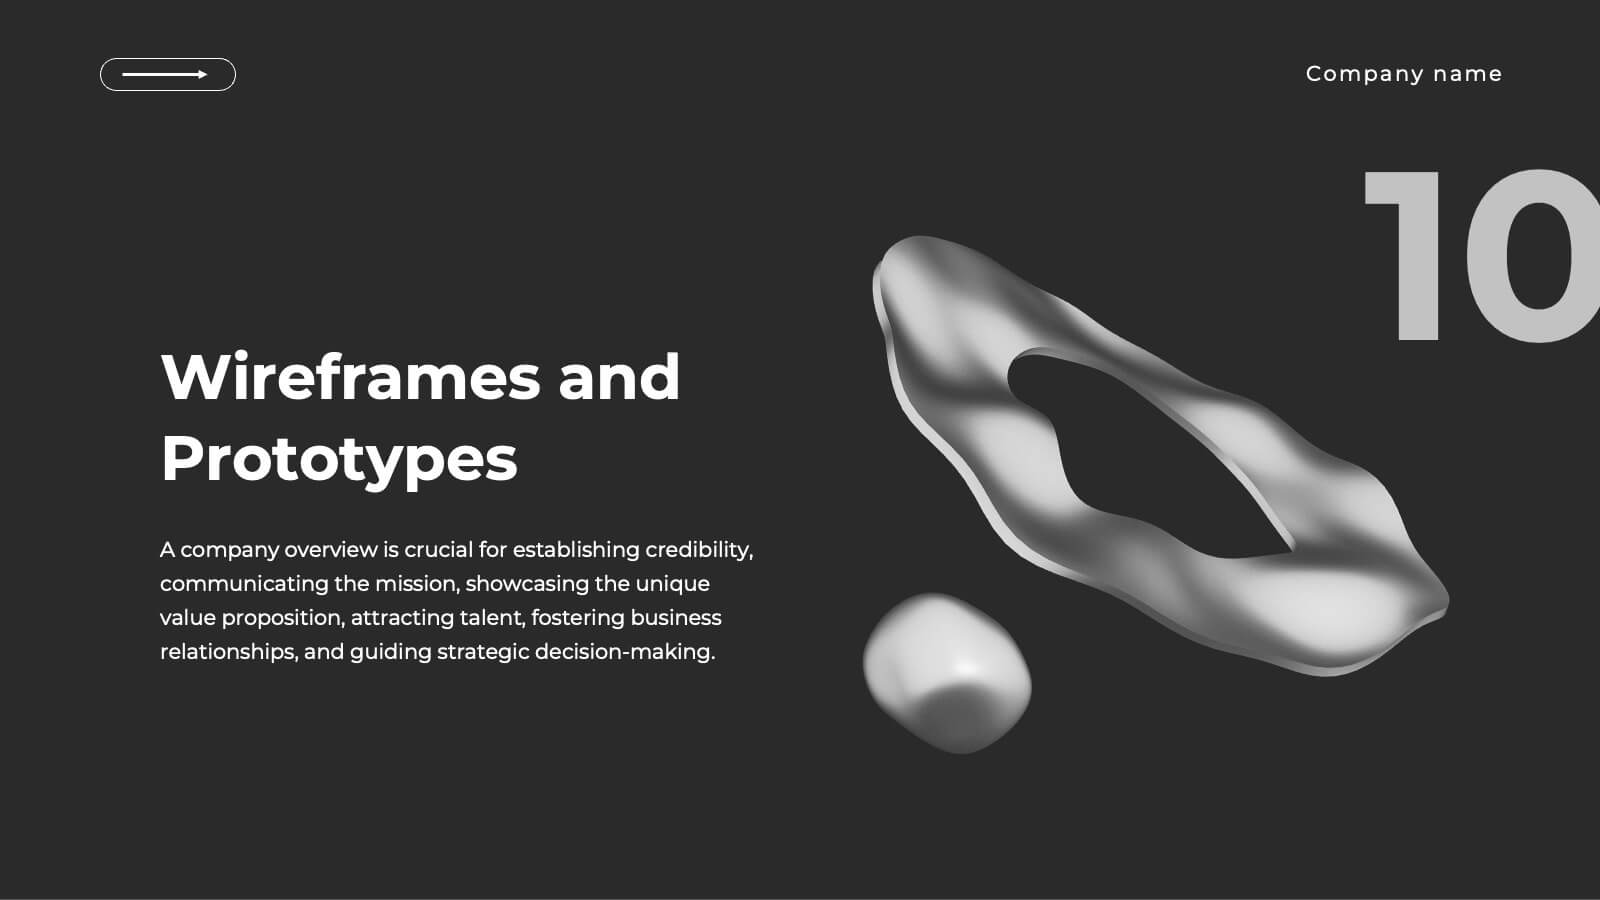
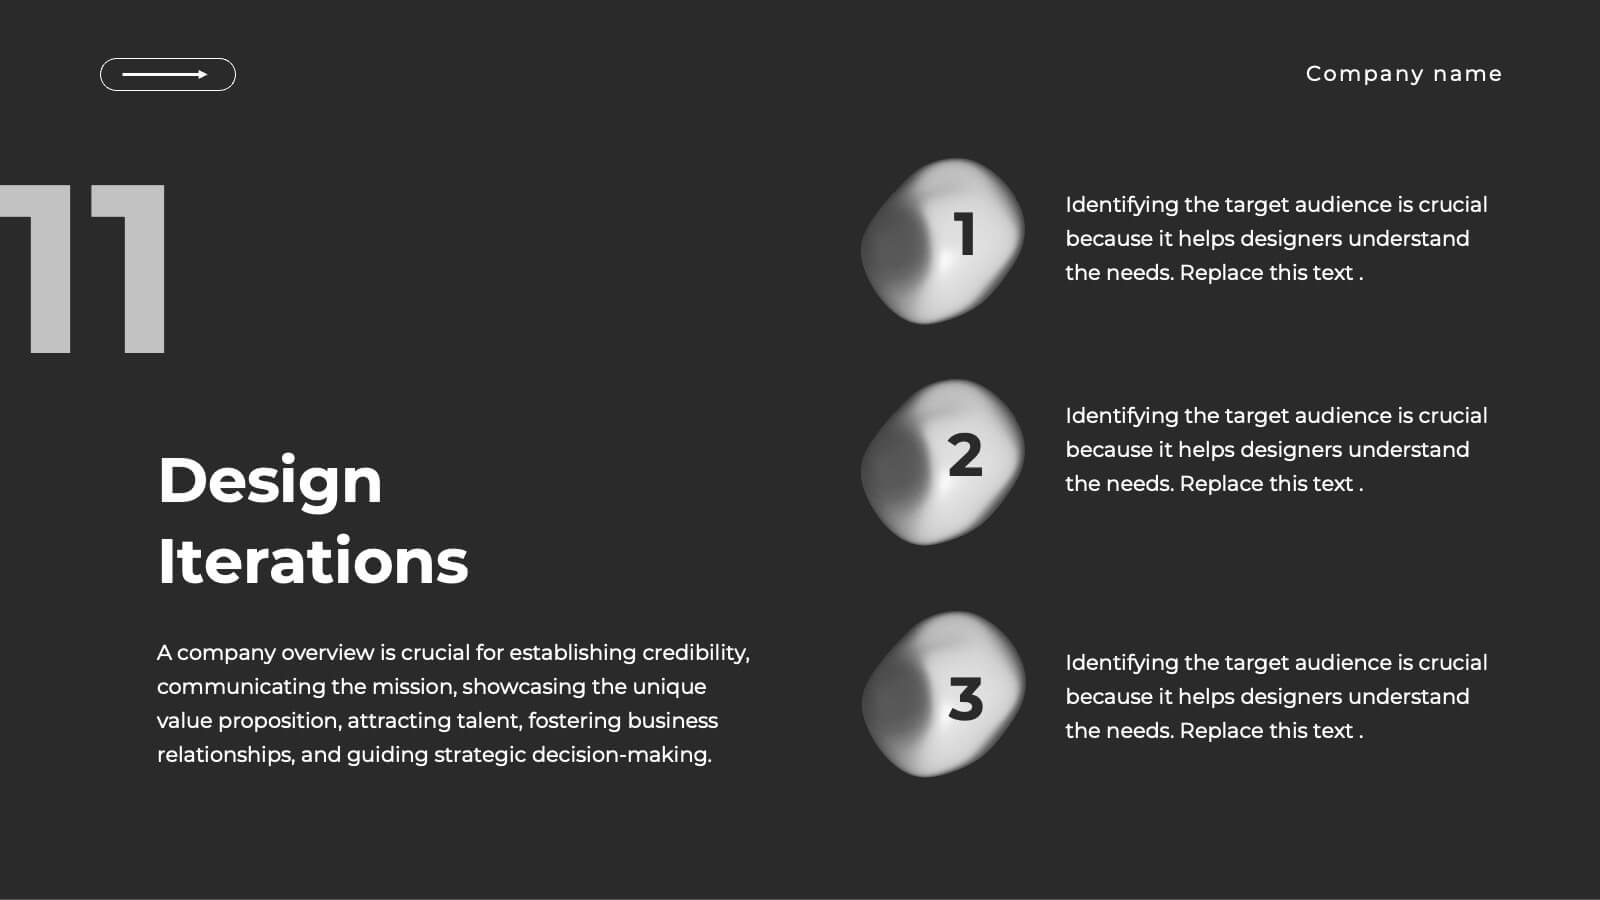
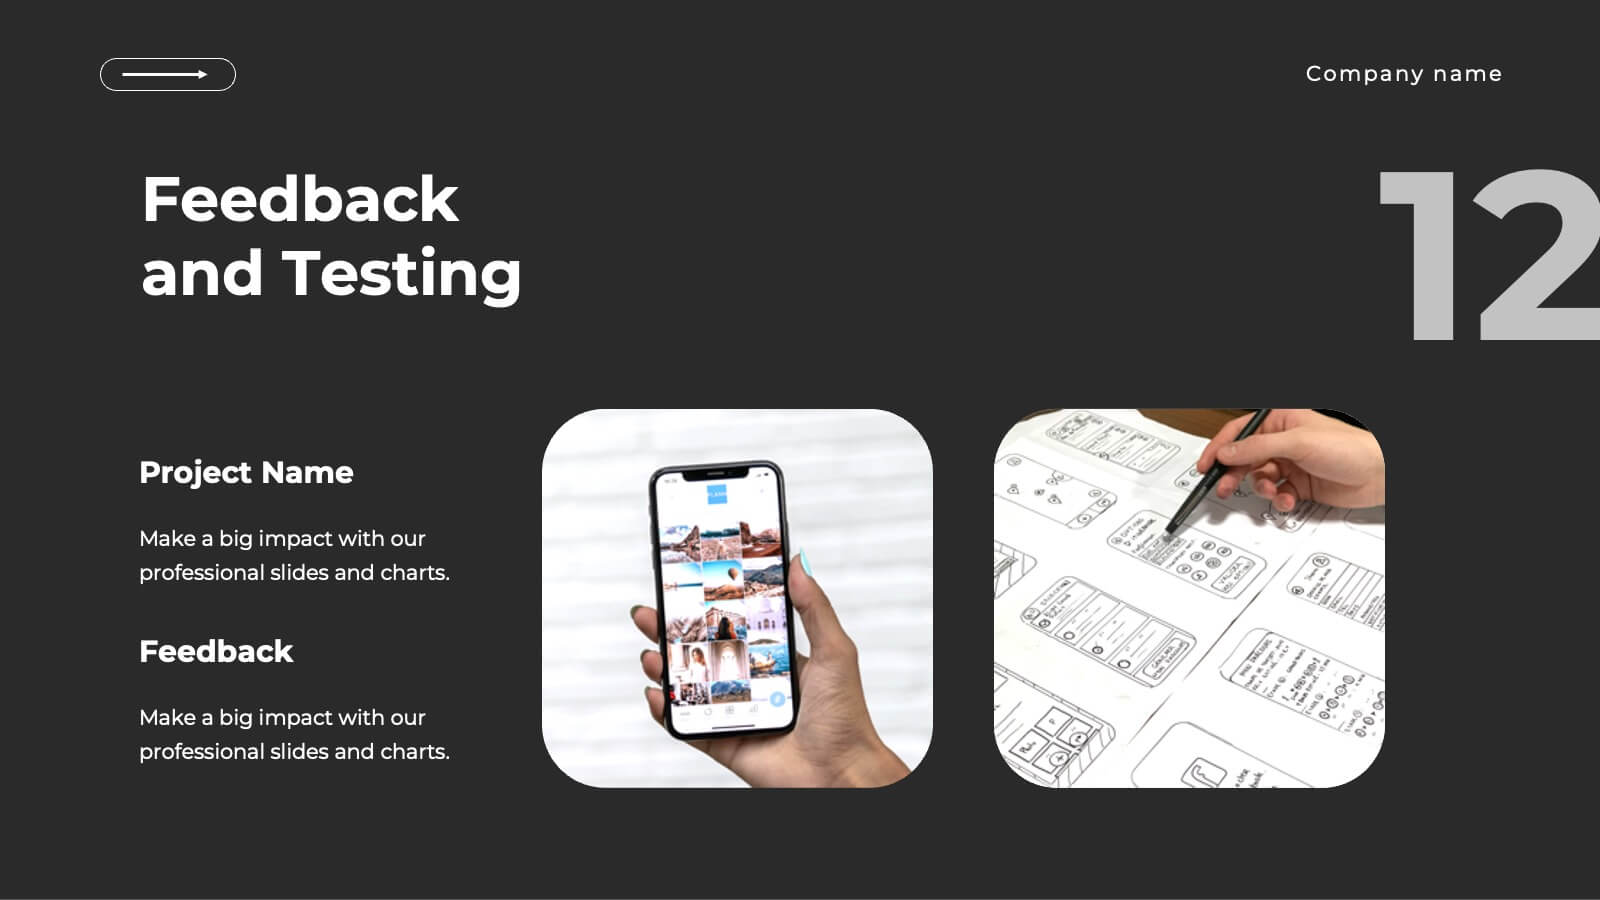
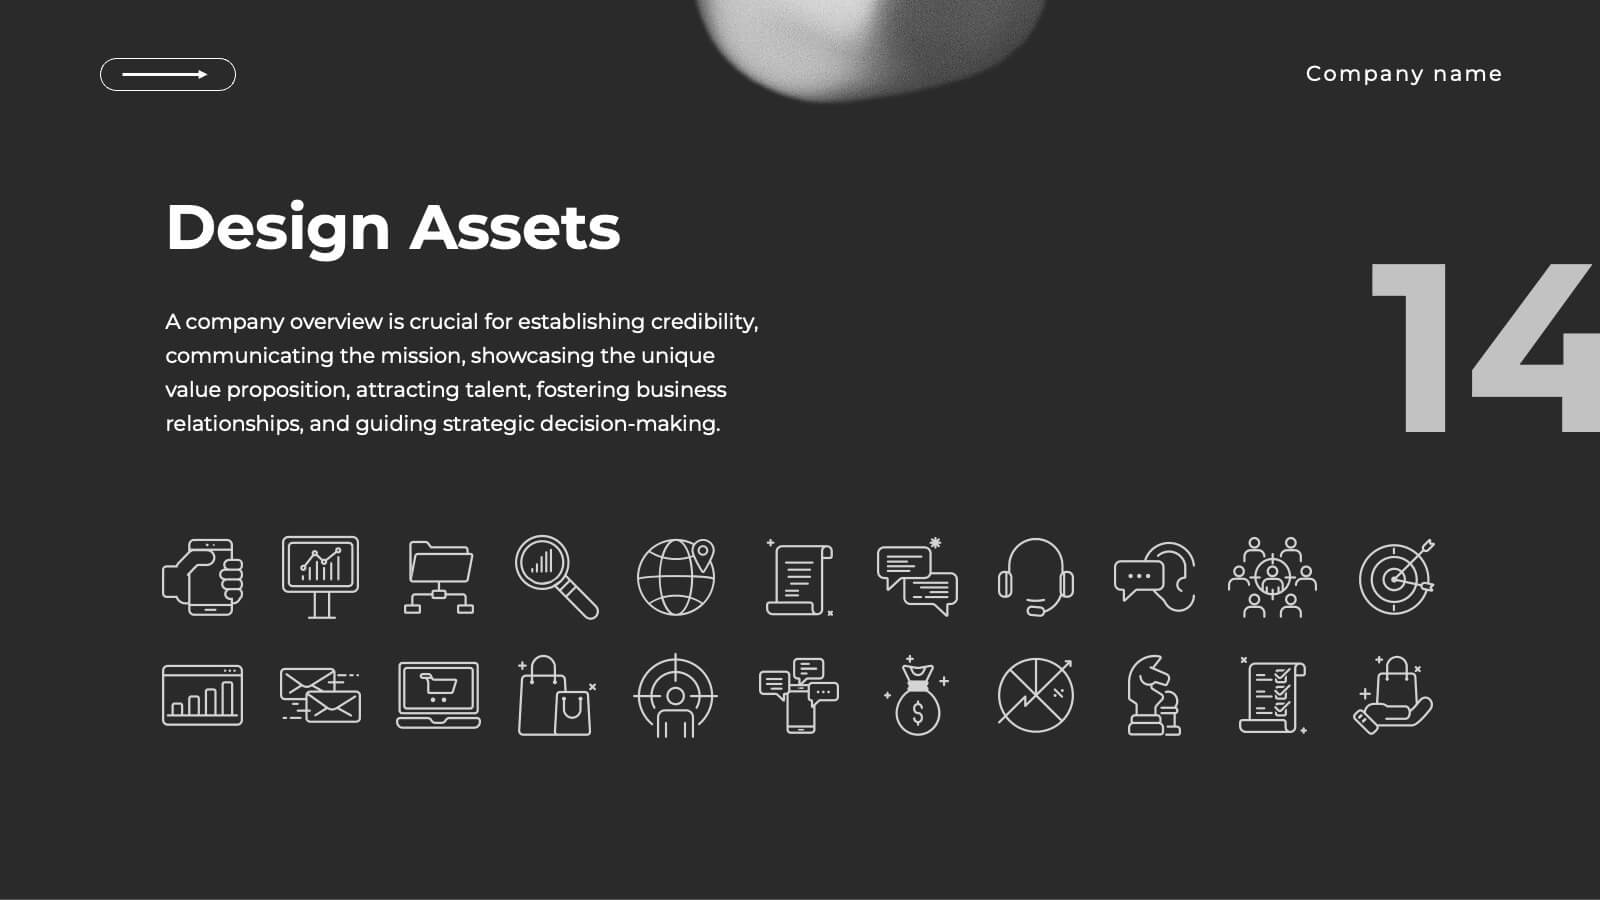
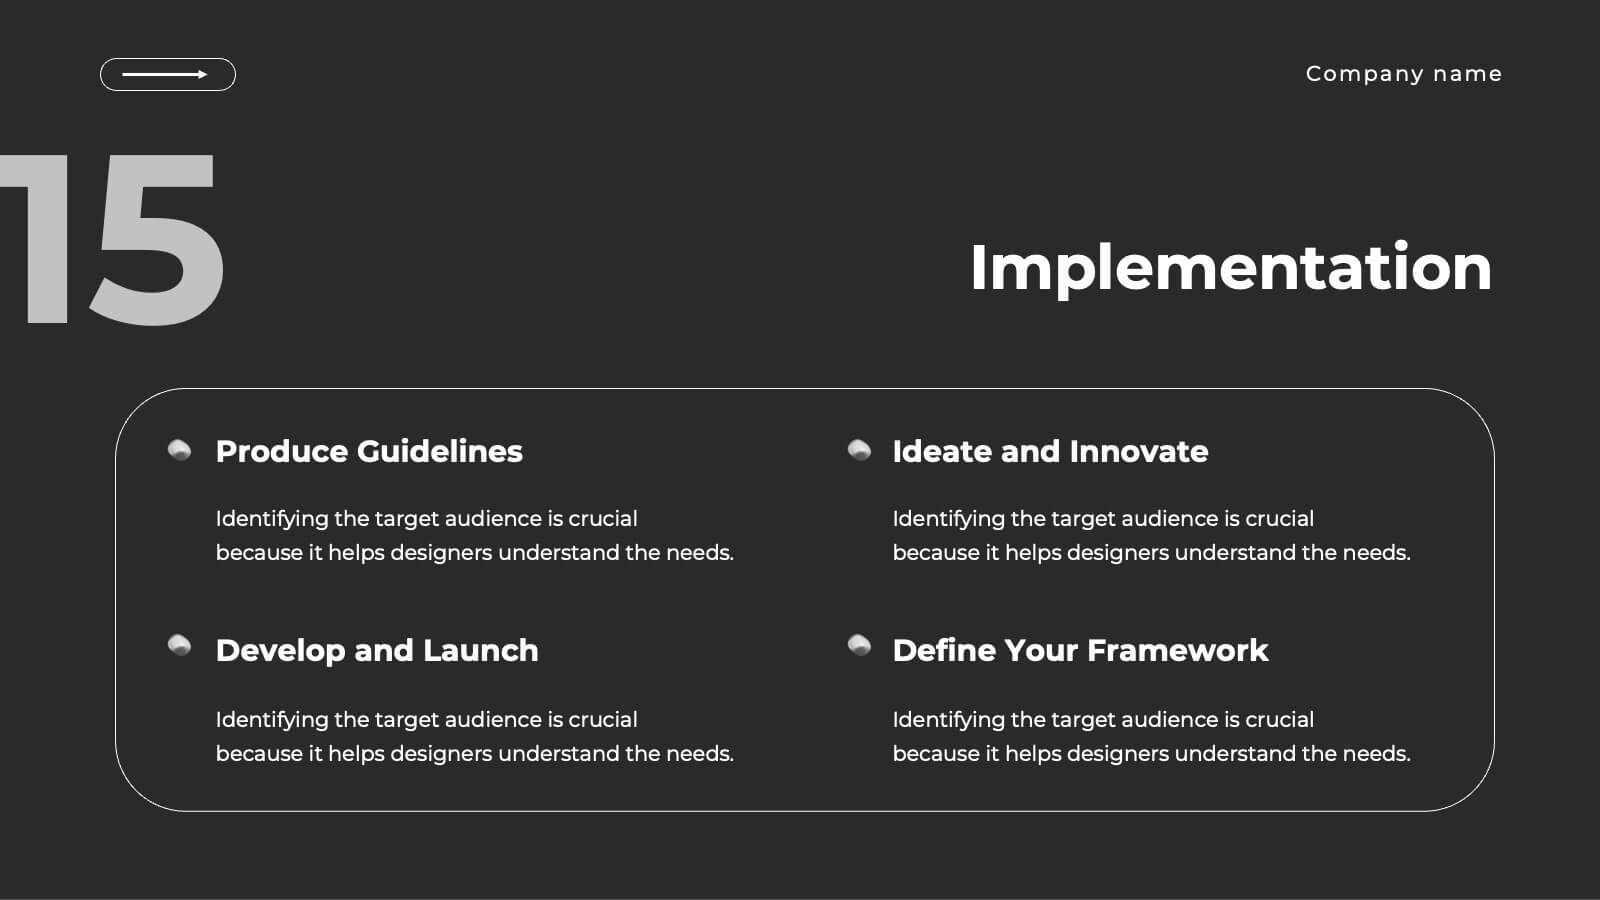
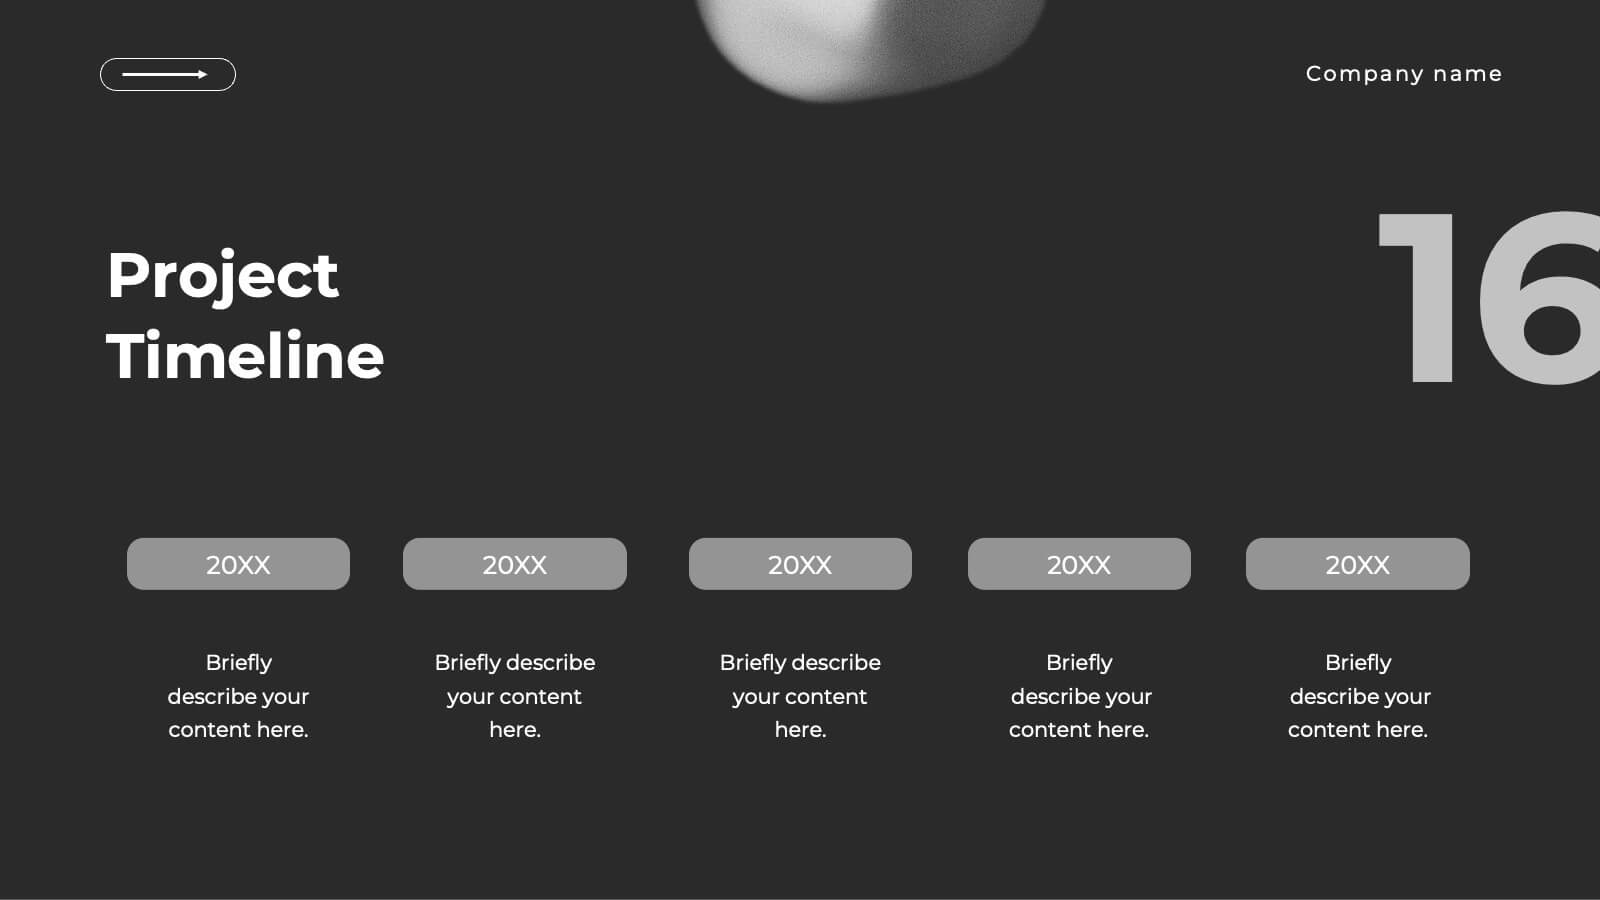
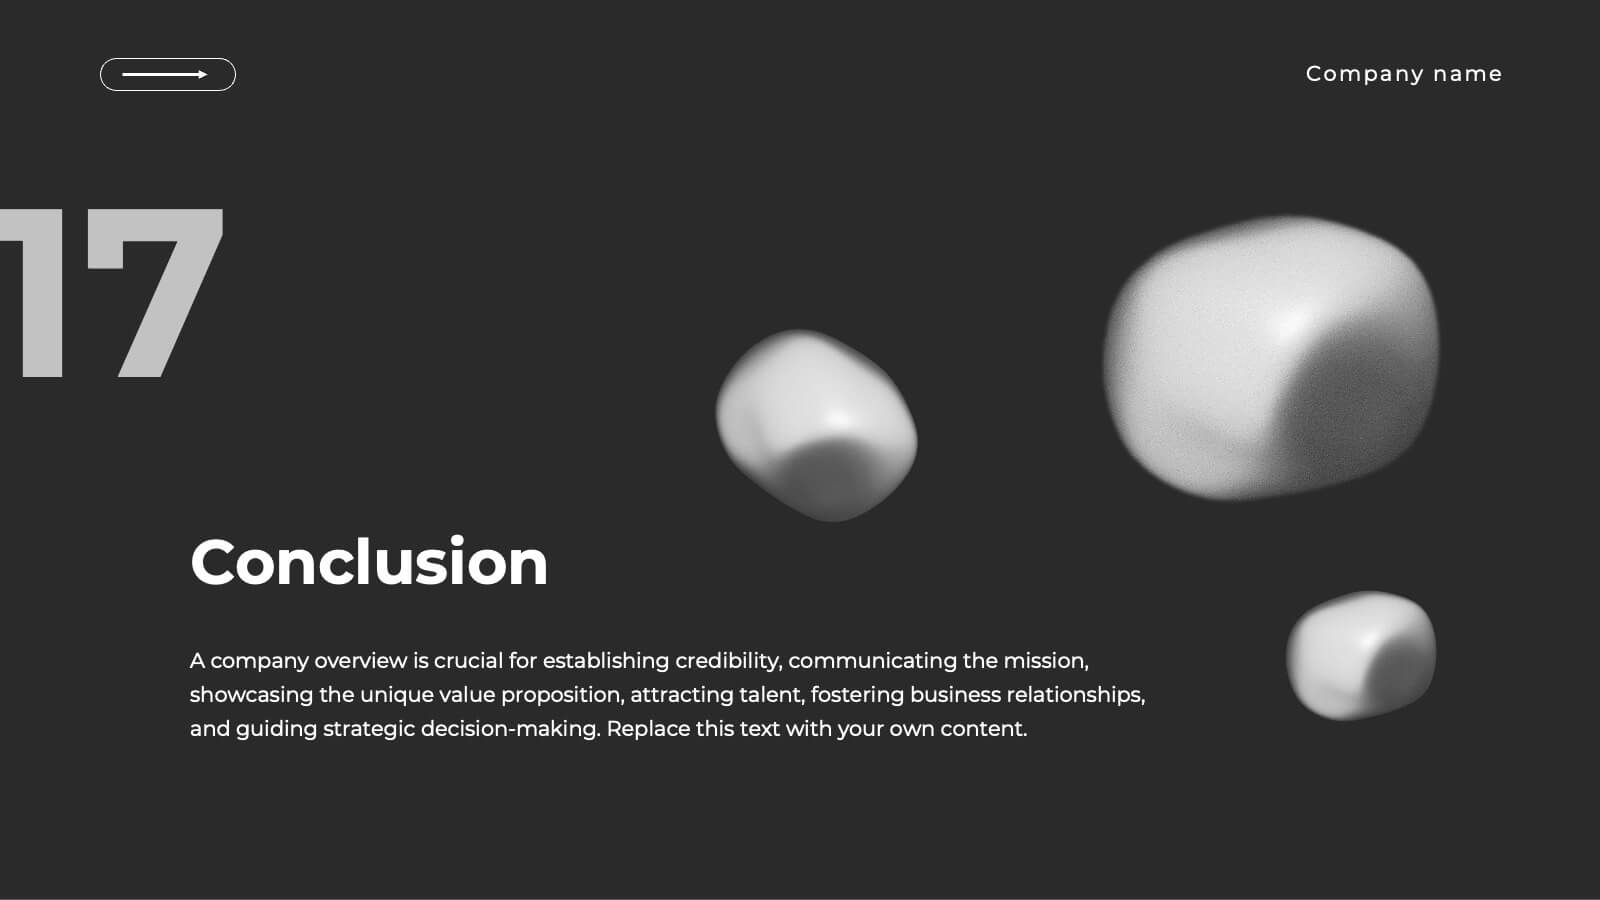
Realm UX UI Design Pitch Deck Presentation
Present your UX/UI design process with this sleek and modern design template! It covers everything from concept development to wireframes, prototypes, design iterations, and final design presentation. Fully customizable and compatible with PowerPoint, Keynote, and Google Slides, it’s perfect for design teams and professionals looking to showcase their creative process effectively.


6 diapositivas
Creative Interior Design Portfolio Showcase Presentation
Showcase your creativity with the Creative Design Portfolio Showcase presentation. This template is perfect for graphic designers, architects, and creative professionals looking to display their work in a visually compelling format. Featuring modern layouts, high-quality image placeholders, and structured text sections, it allows for easy customization to highlight key insights. Fully compatible with PowerPoint, Keynote, and Google Slides.