


Características


¿Tienes alguna pregunta?
Recomendar


21 diapositivas
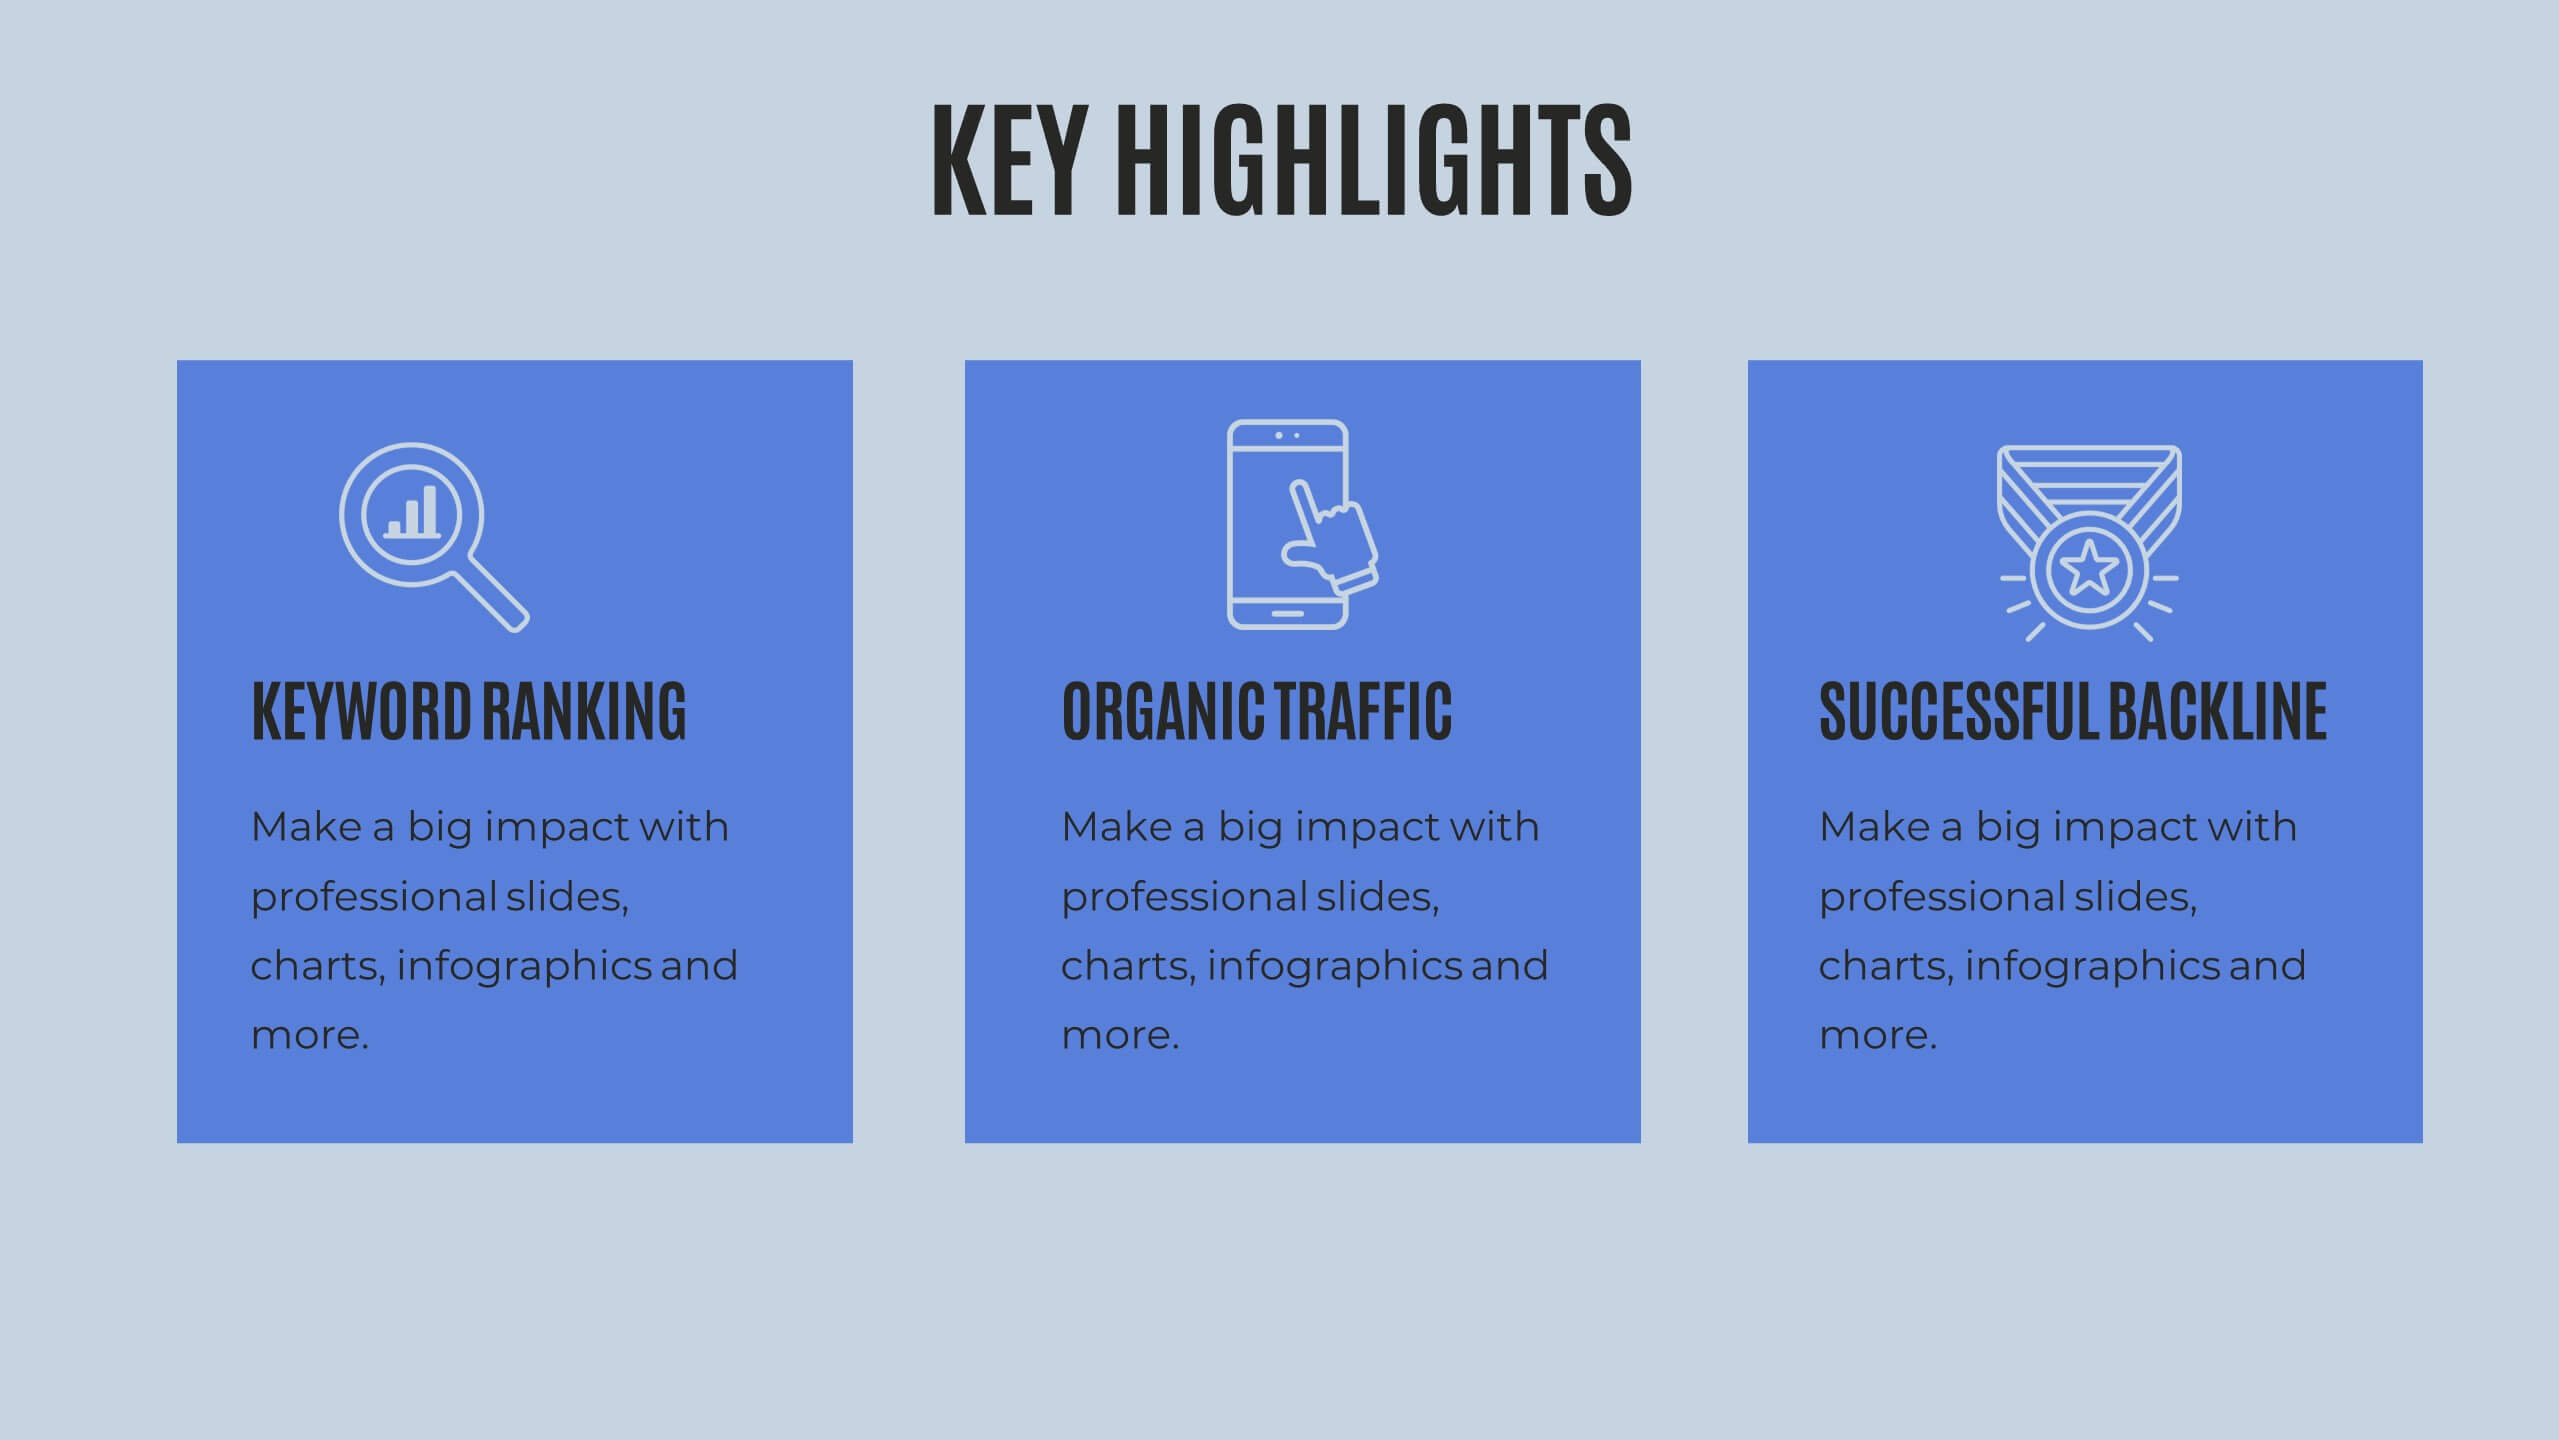
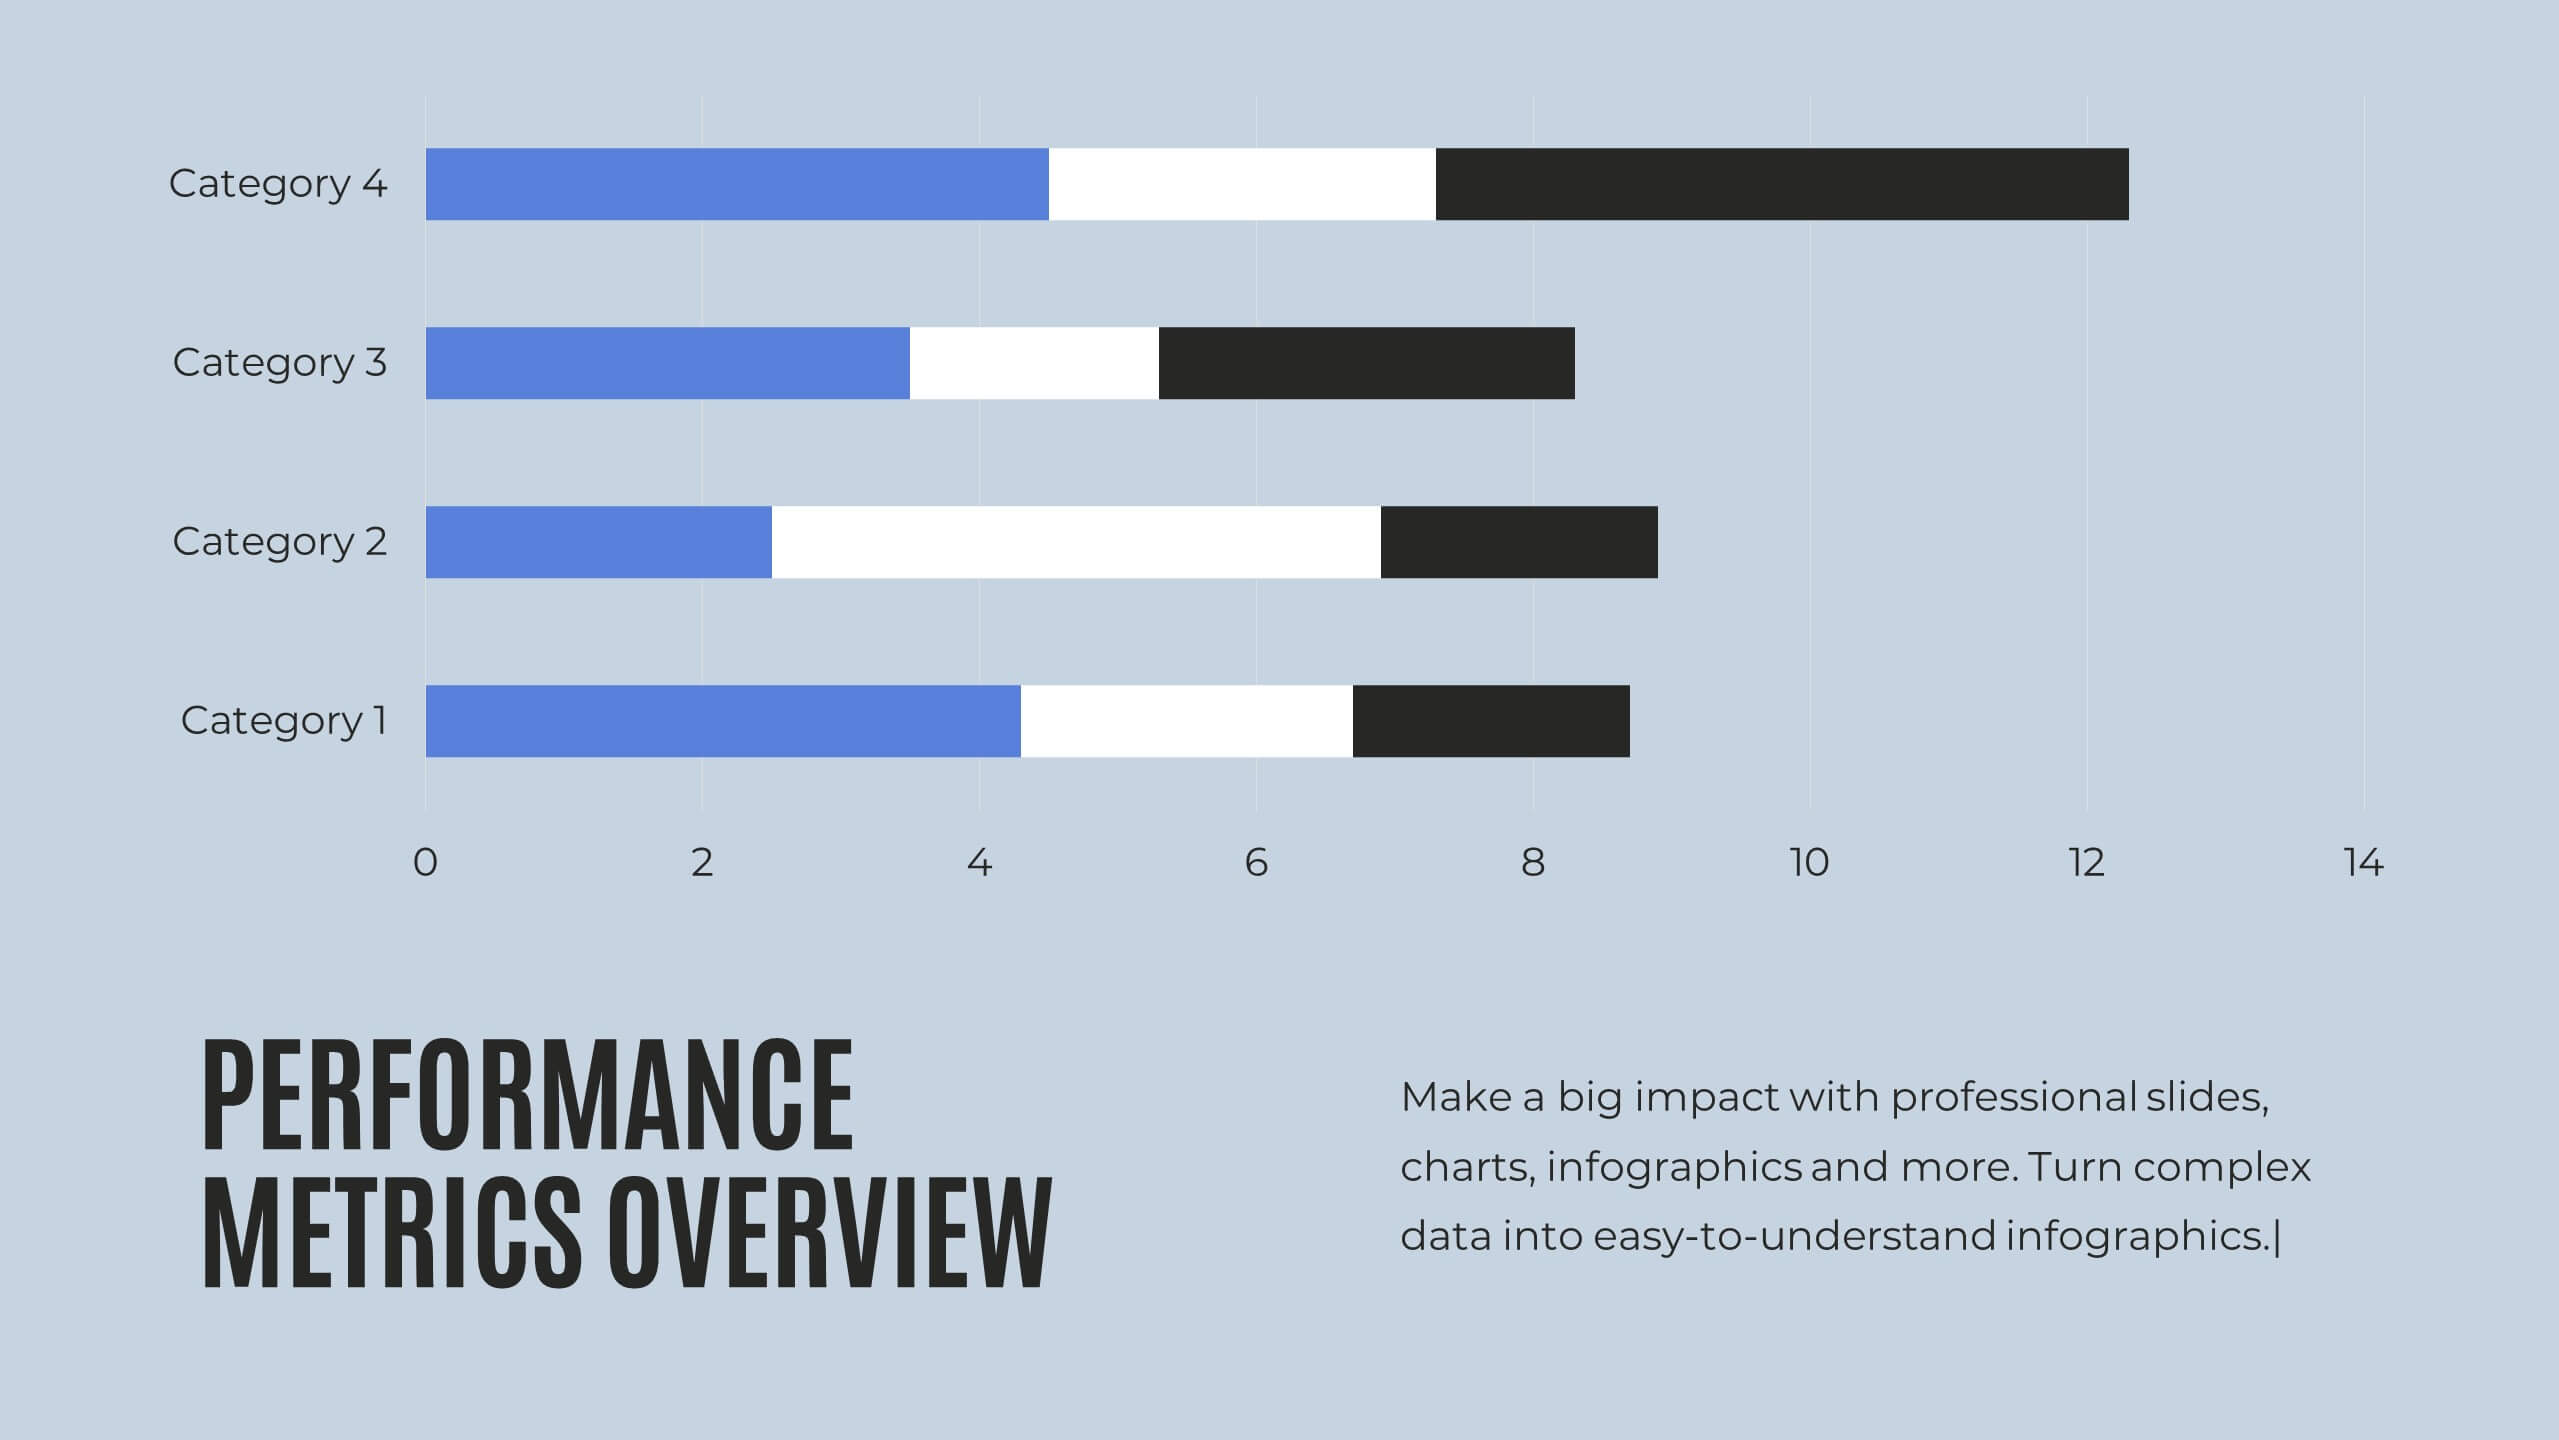
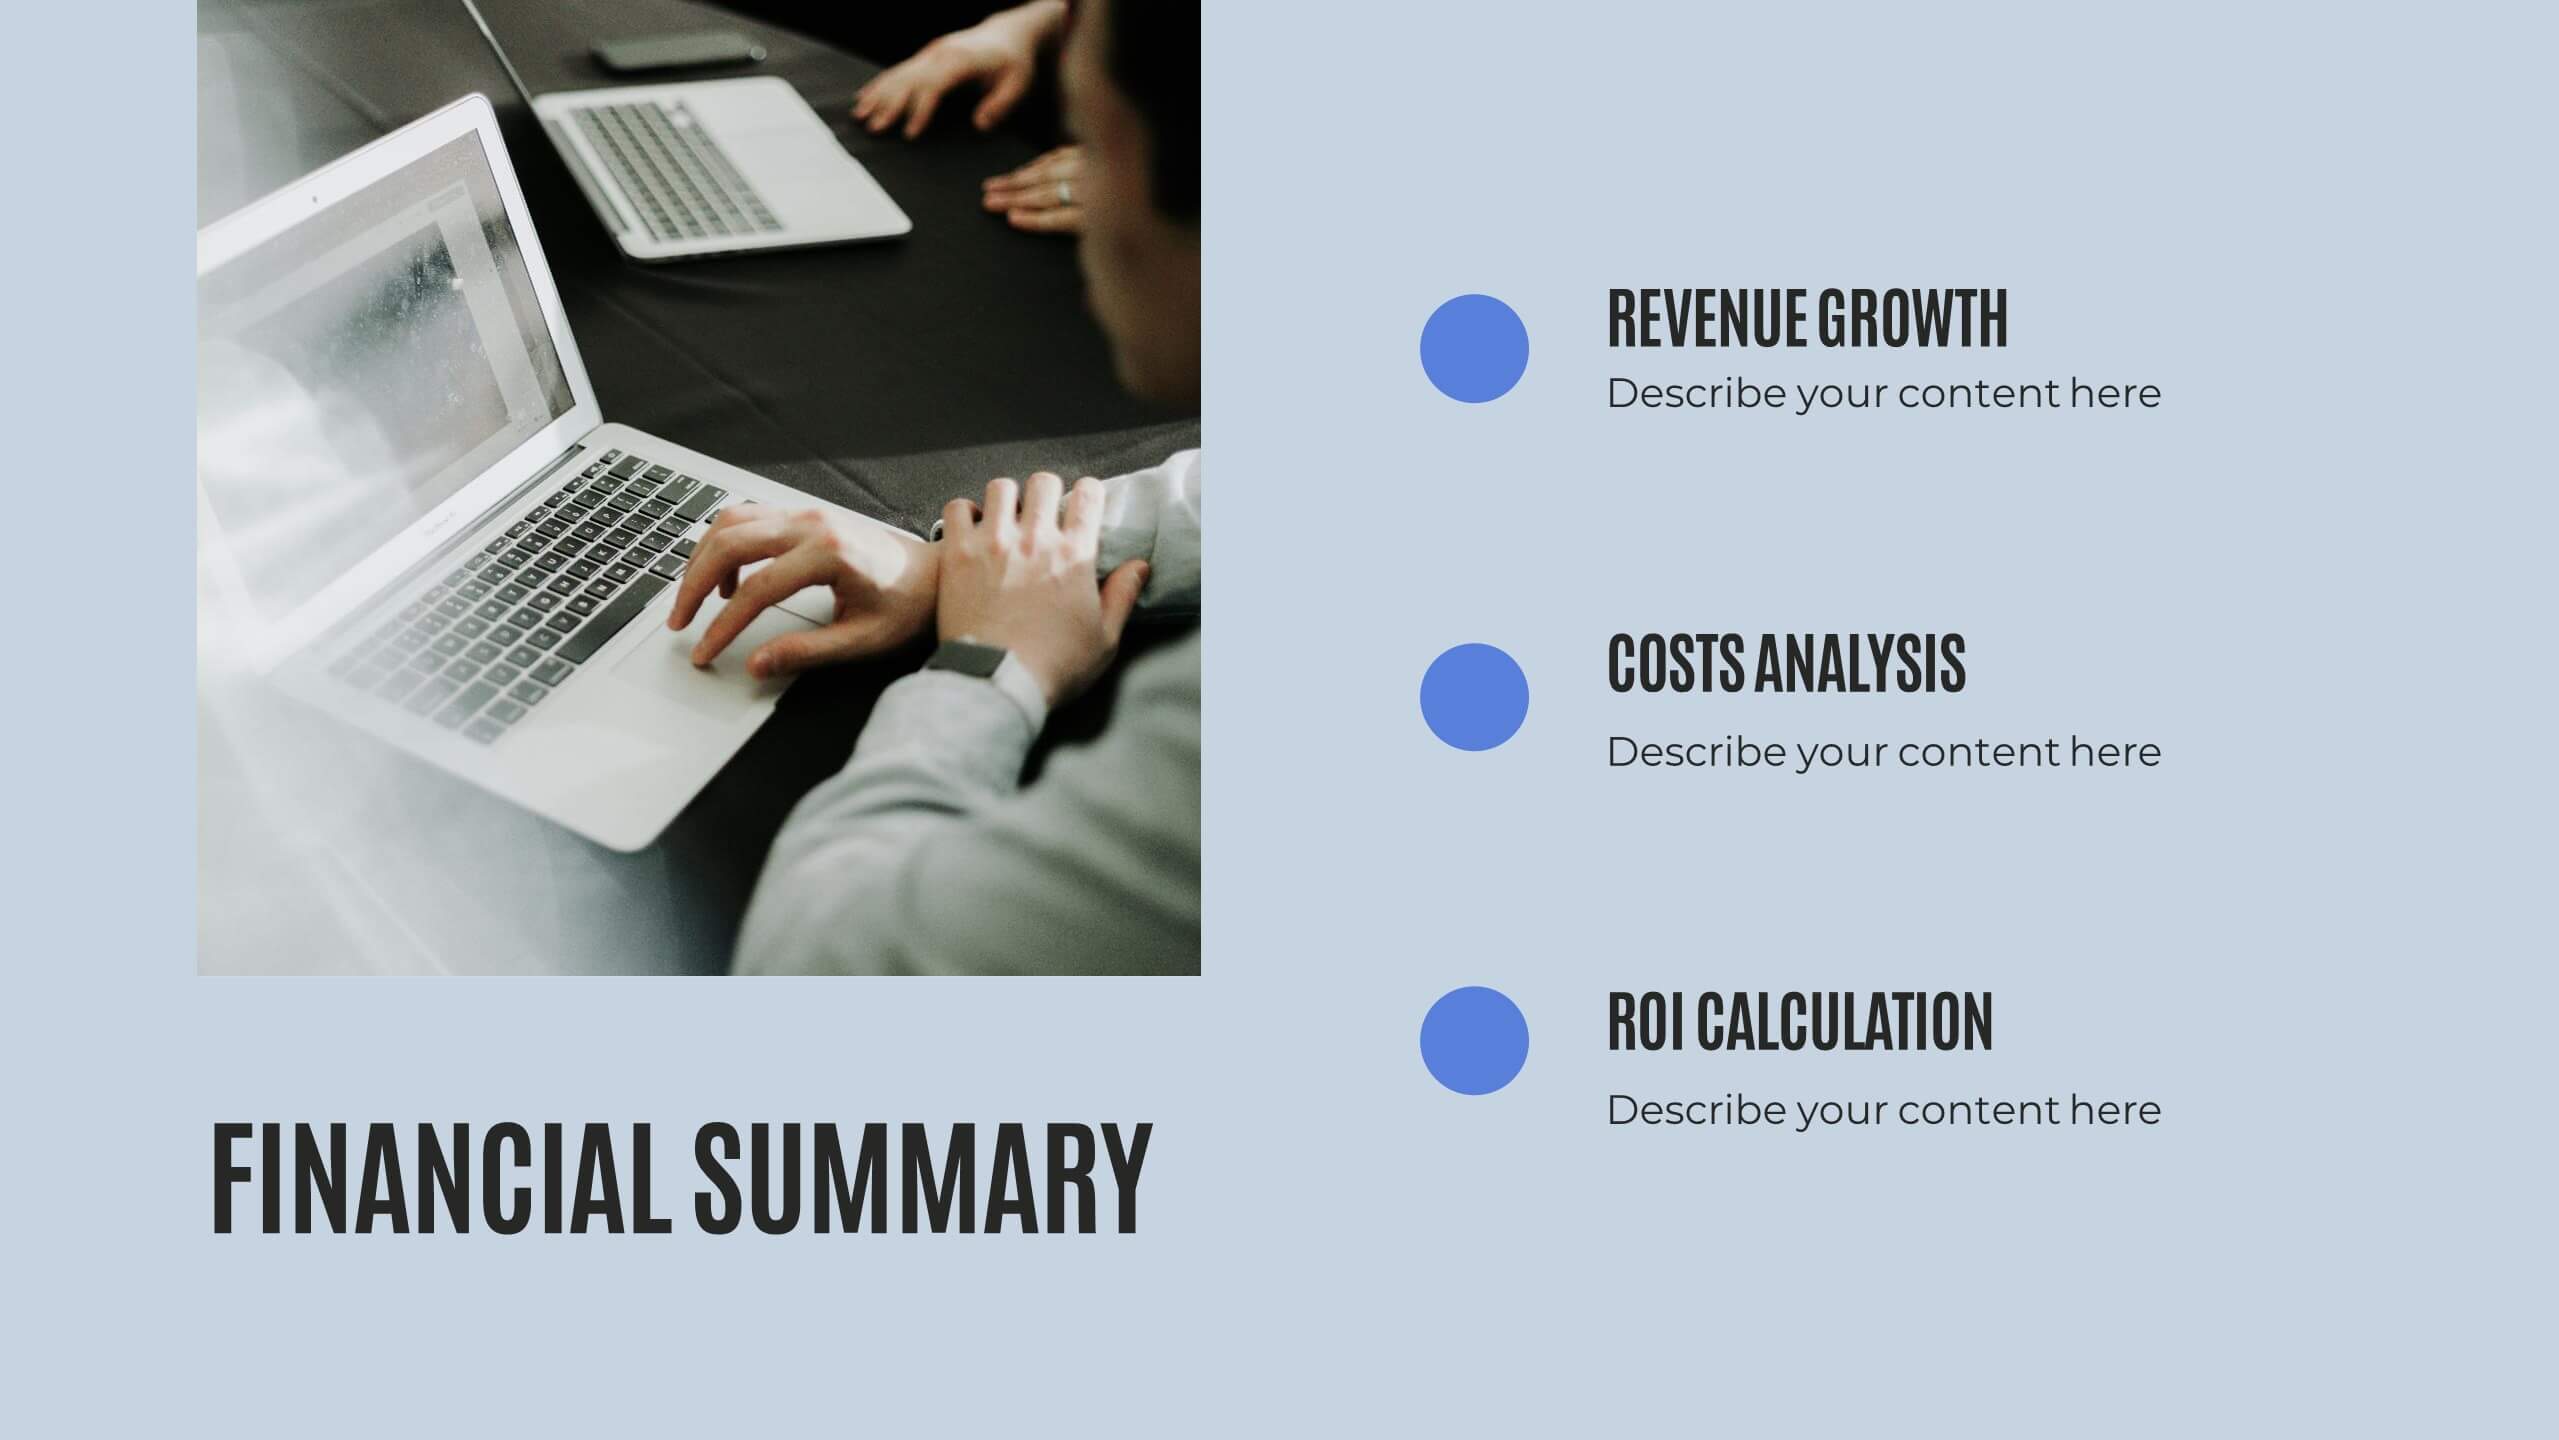
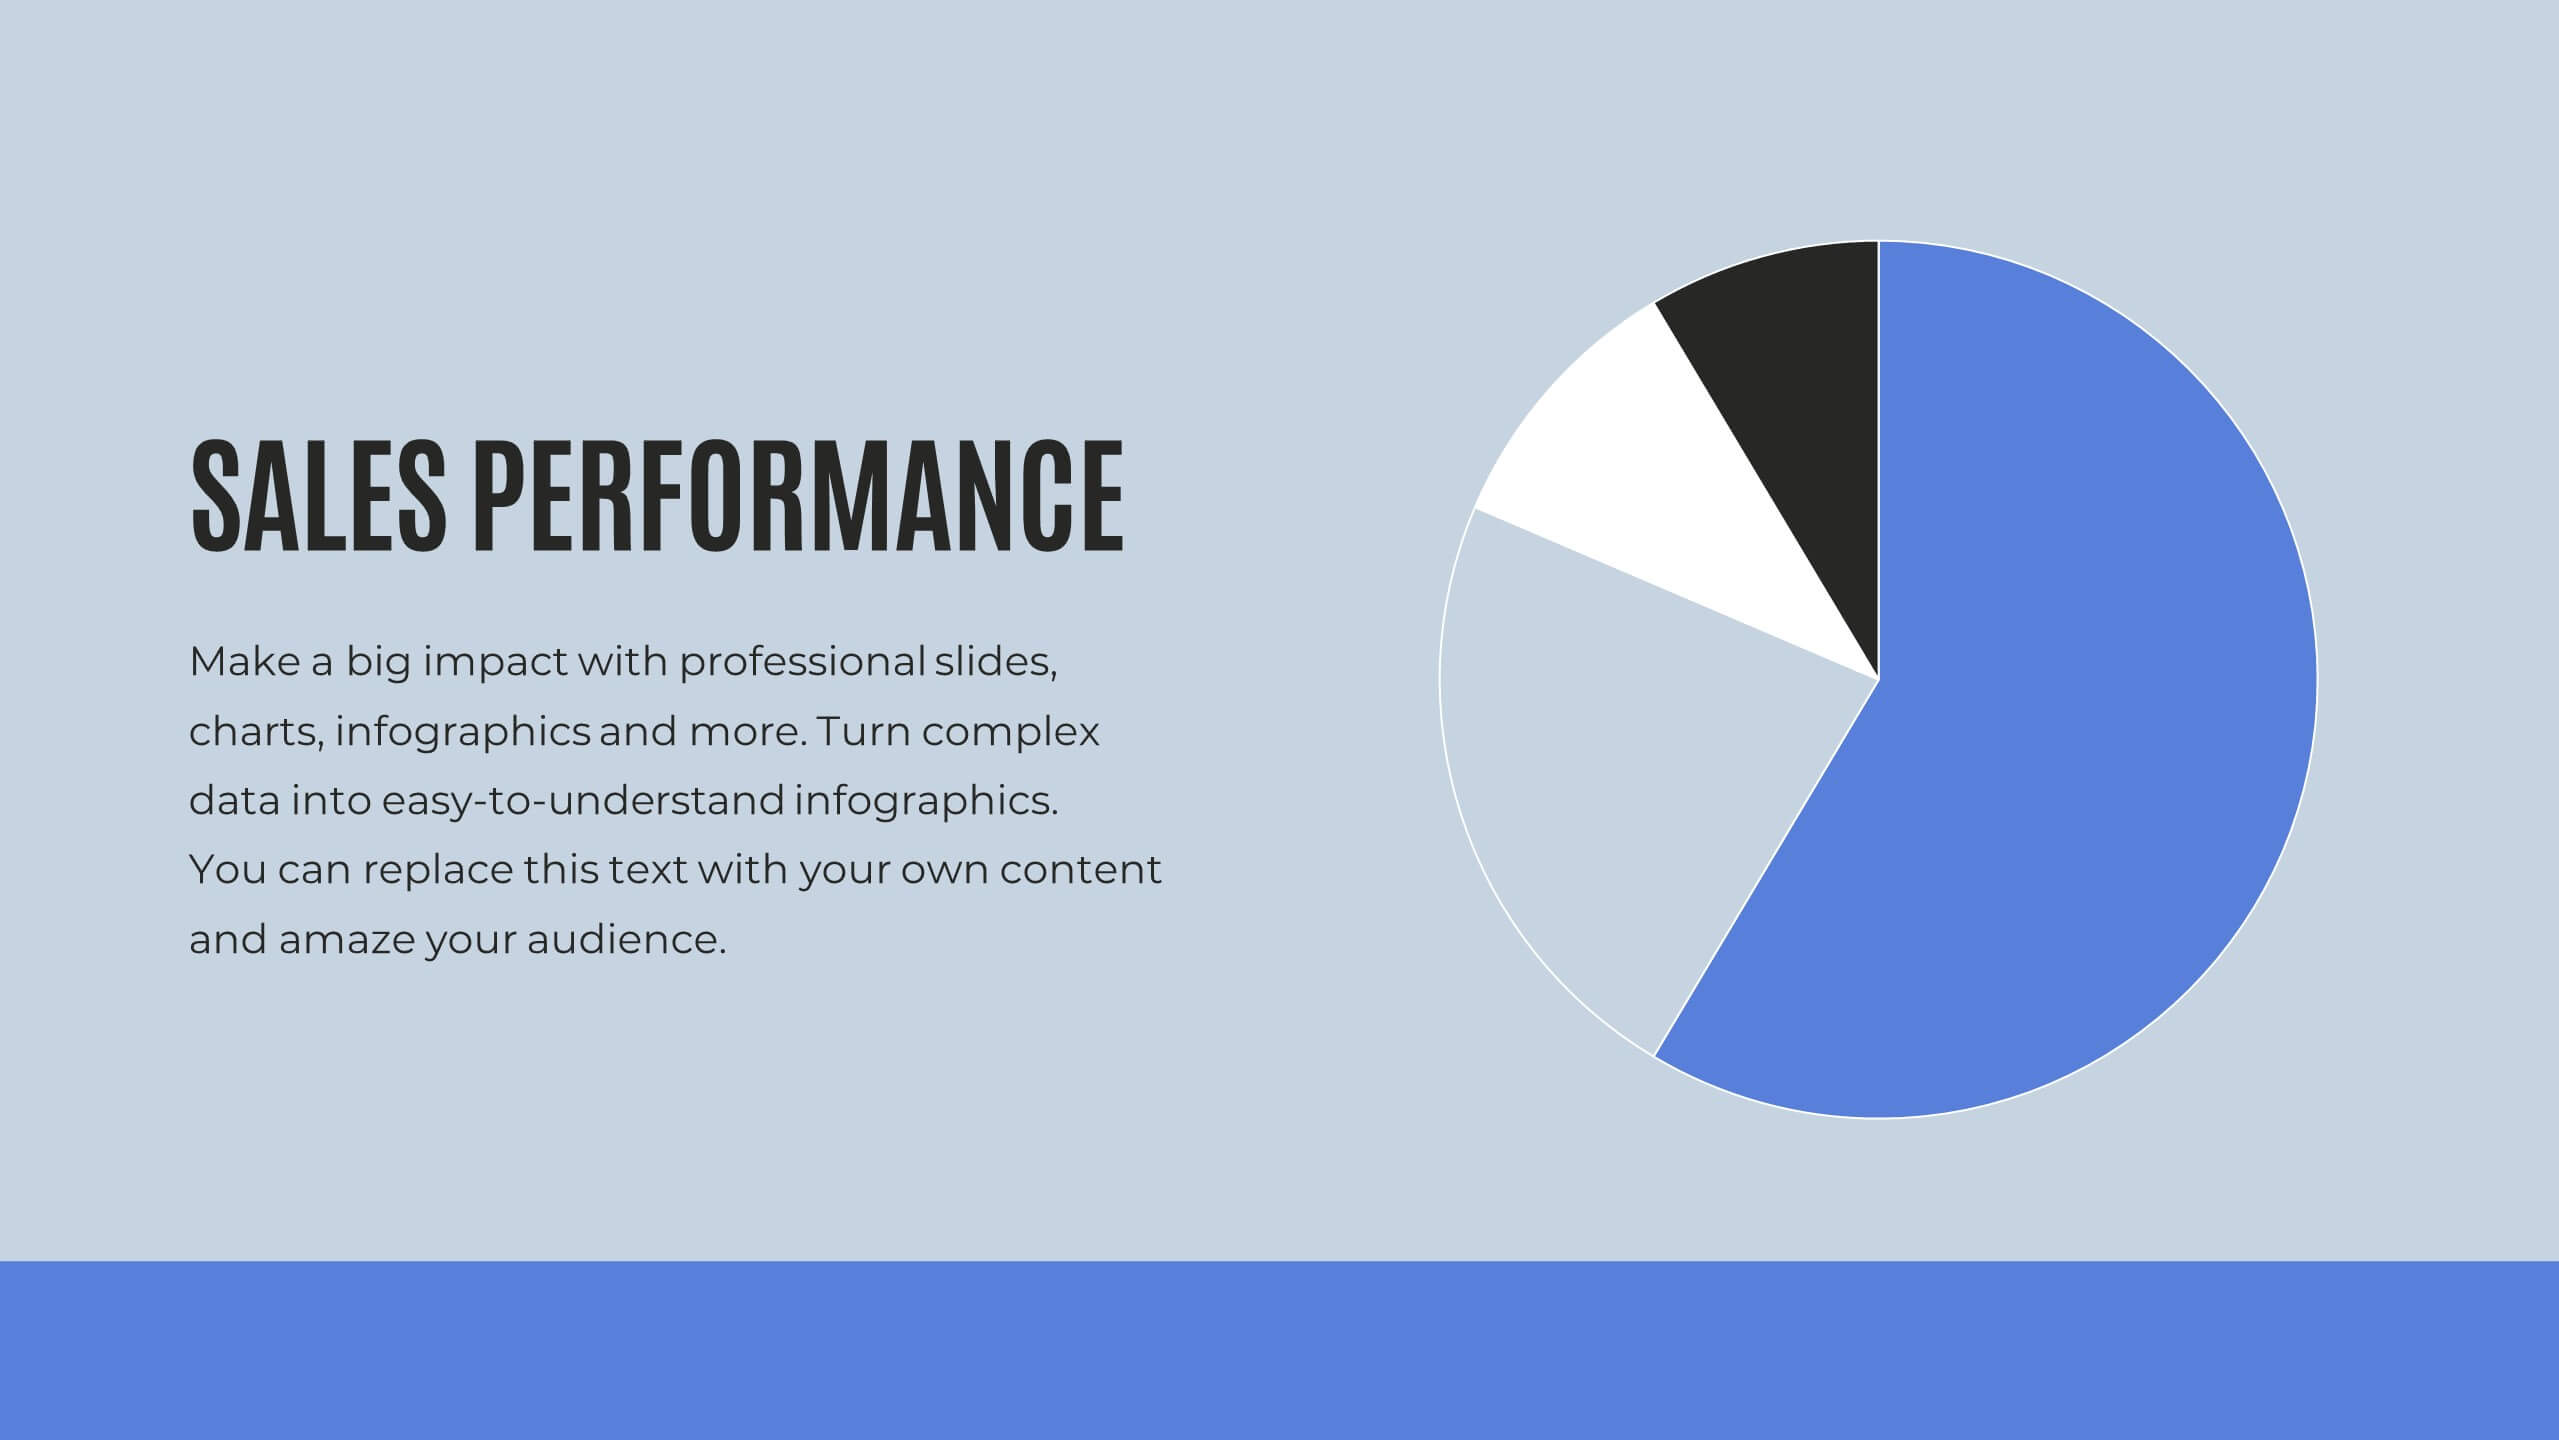
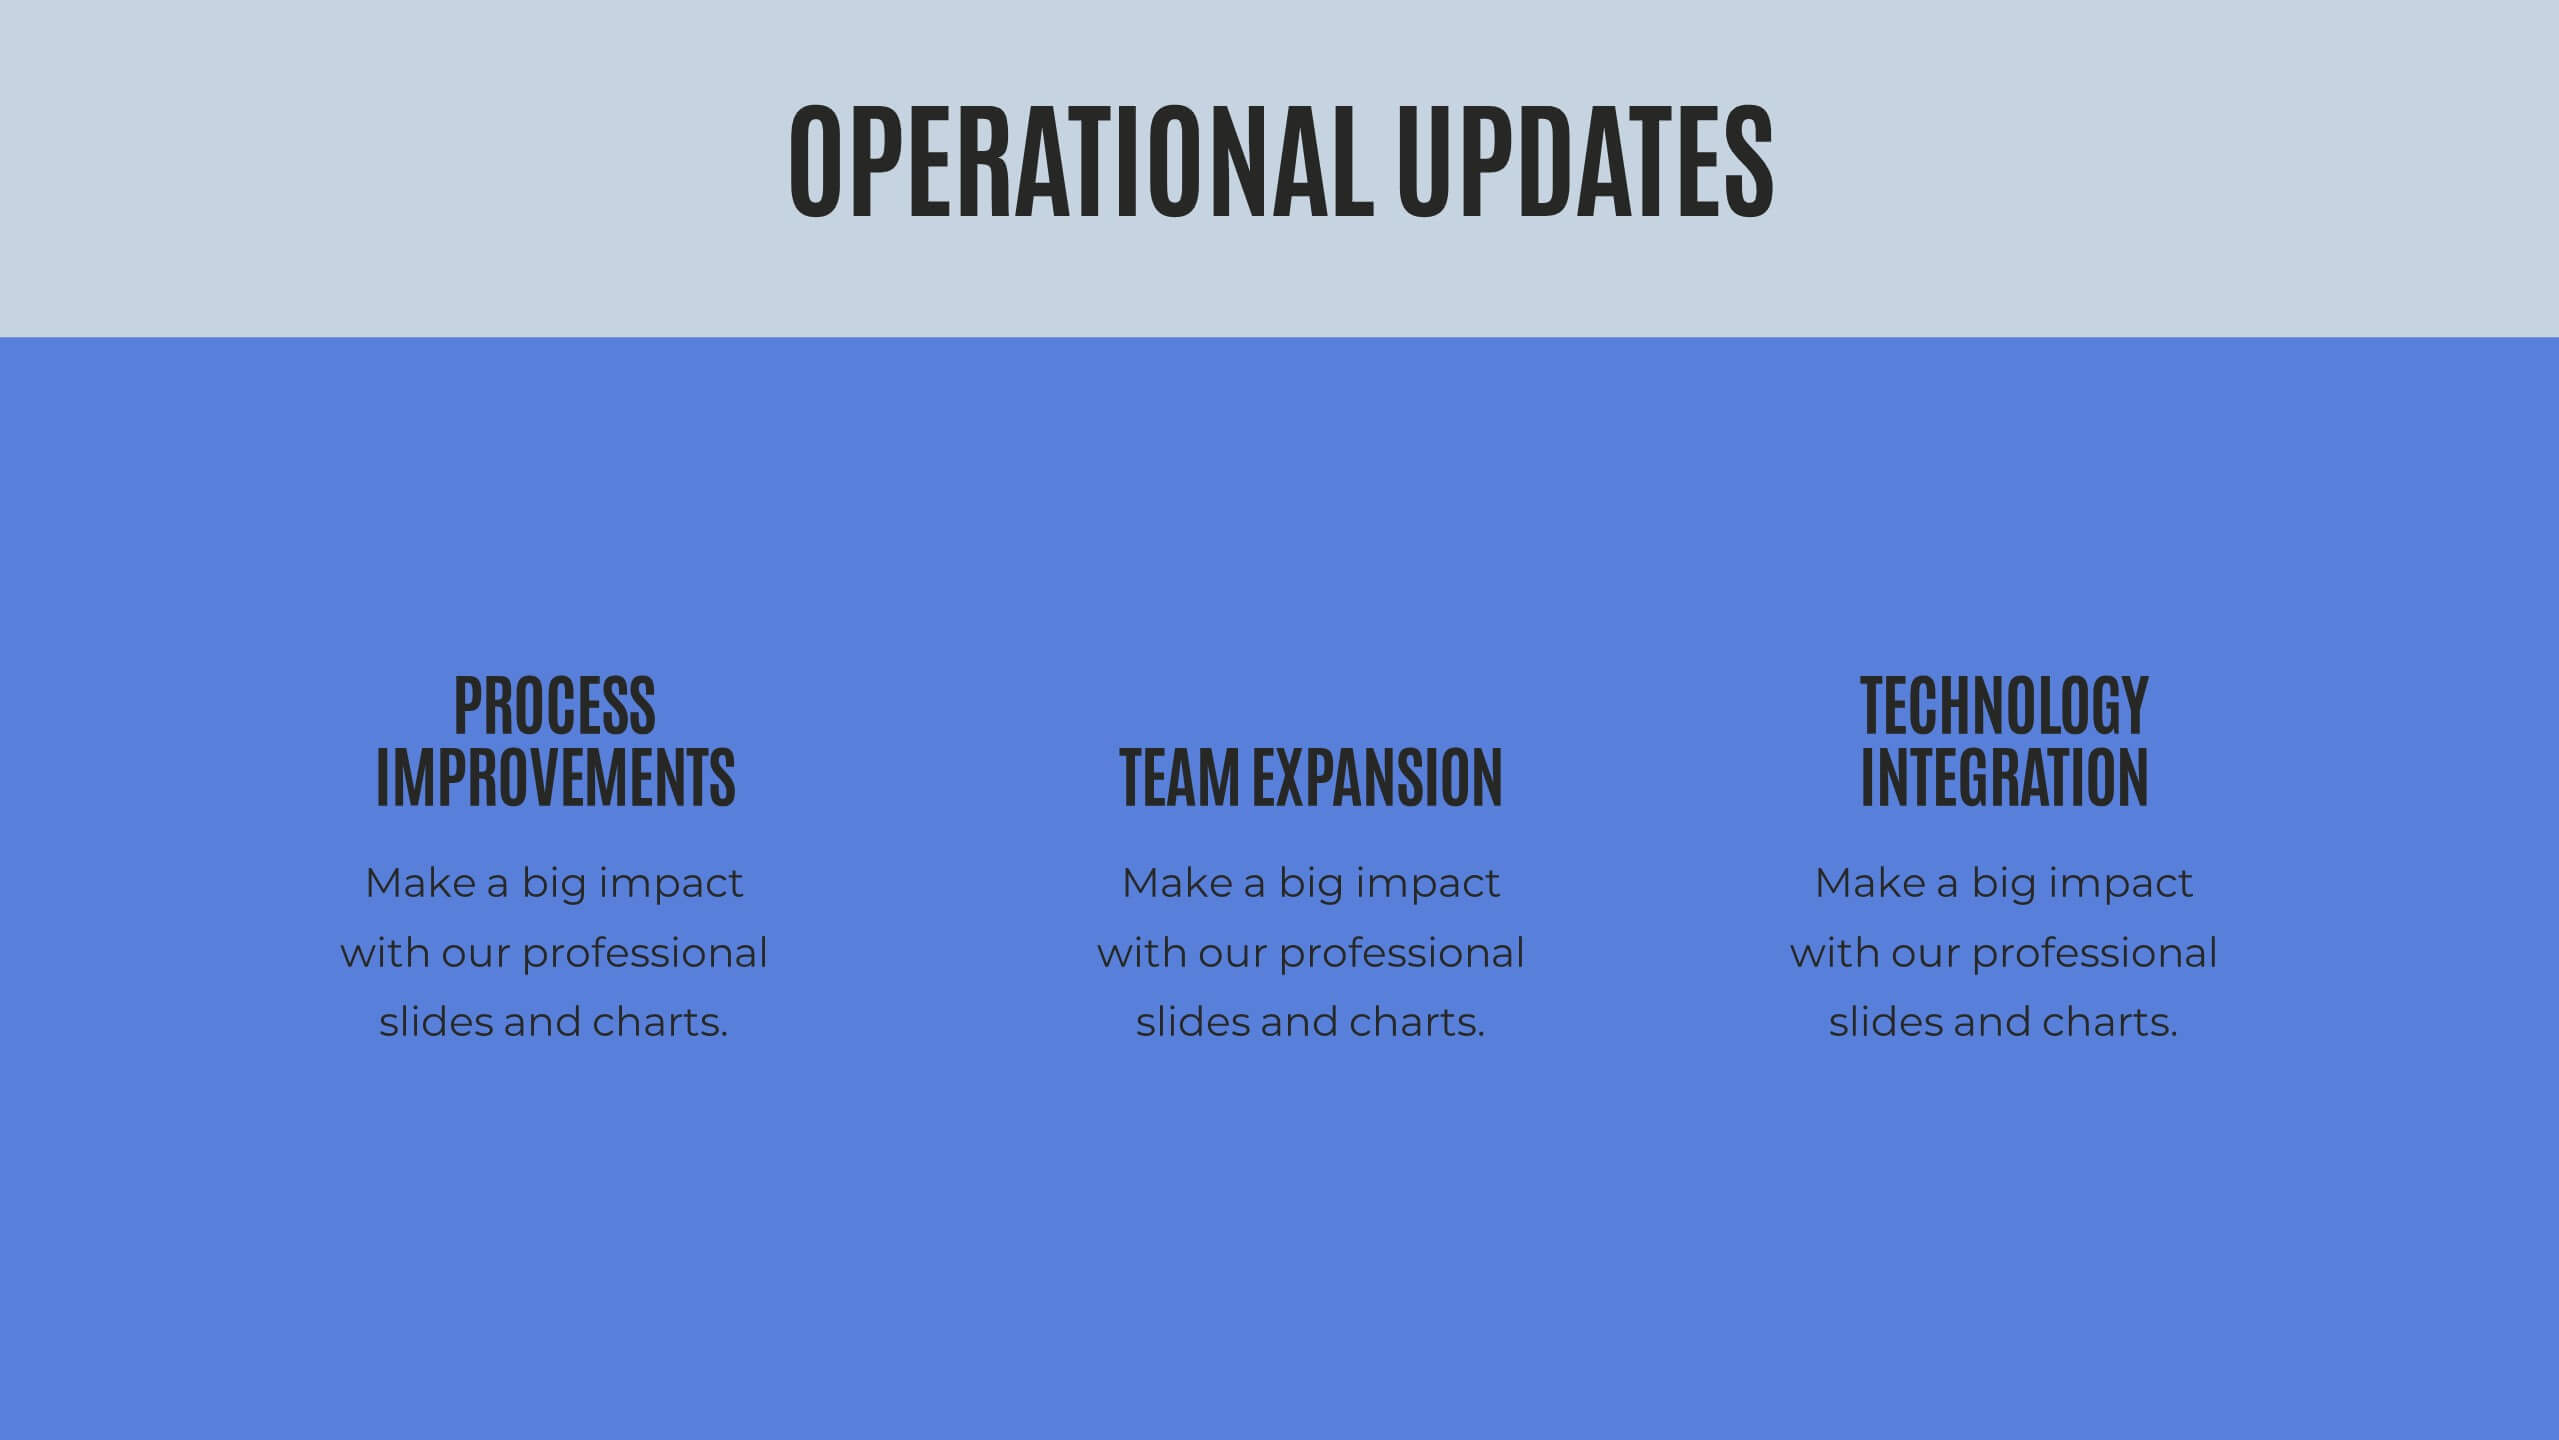
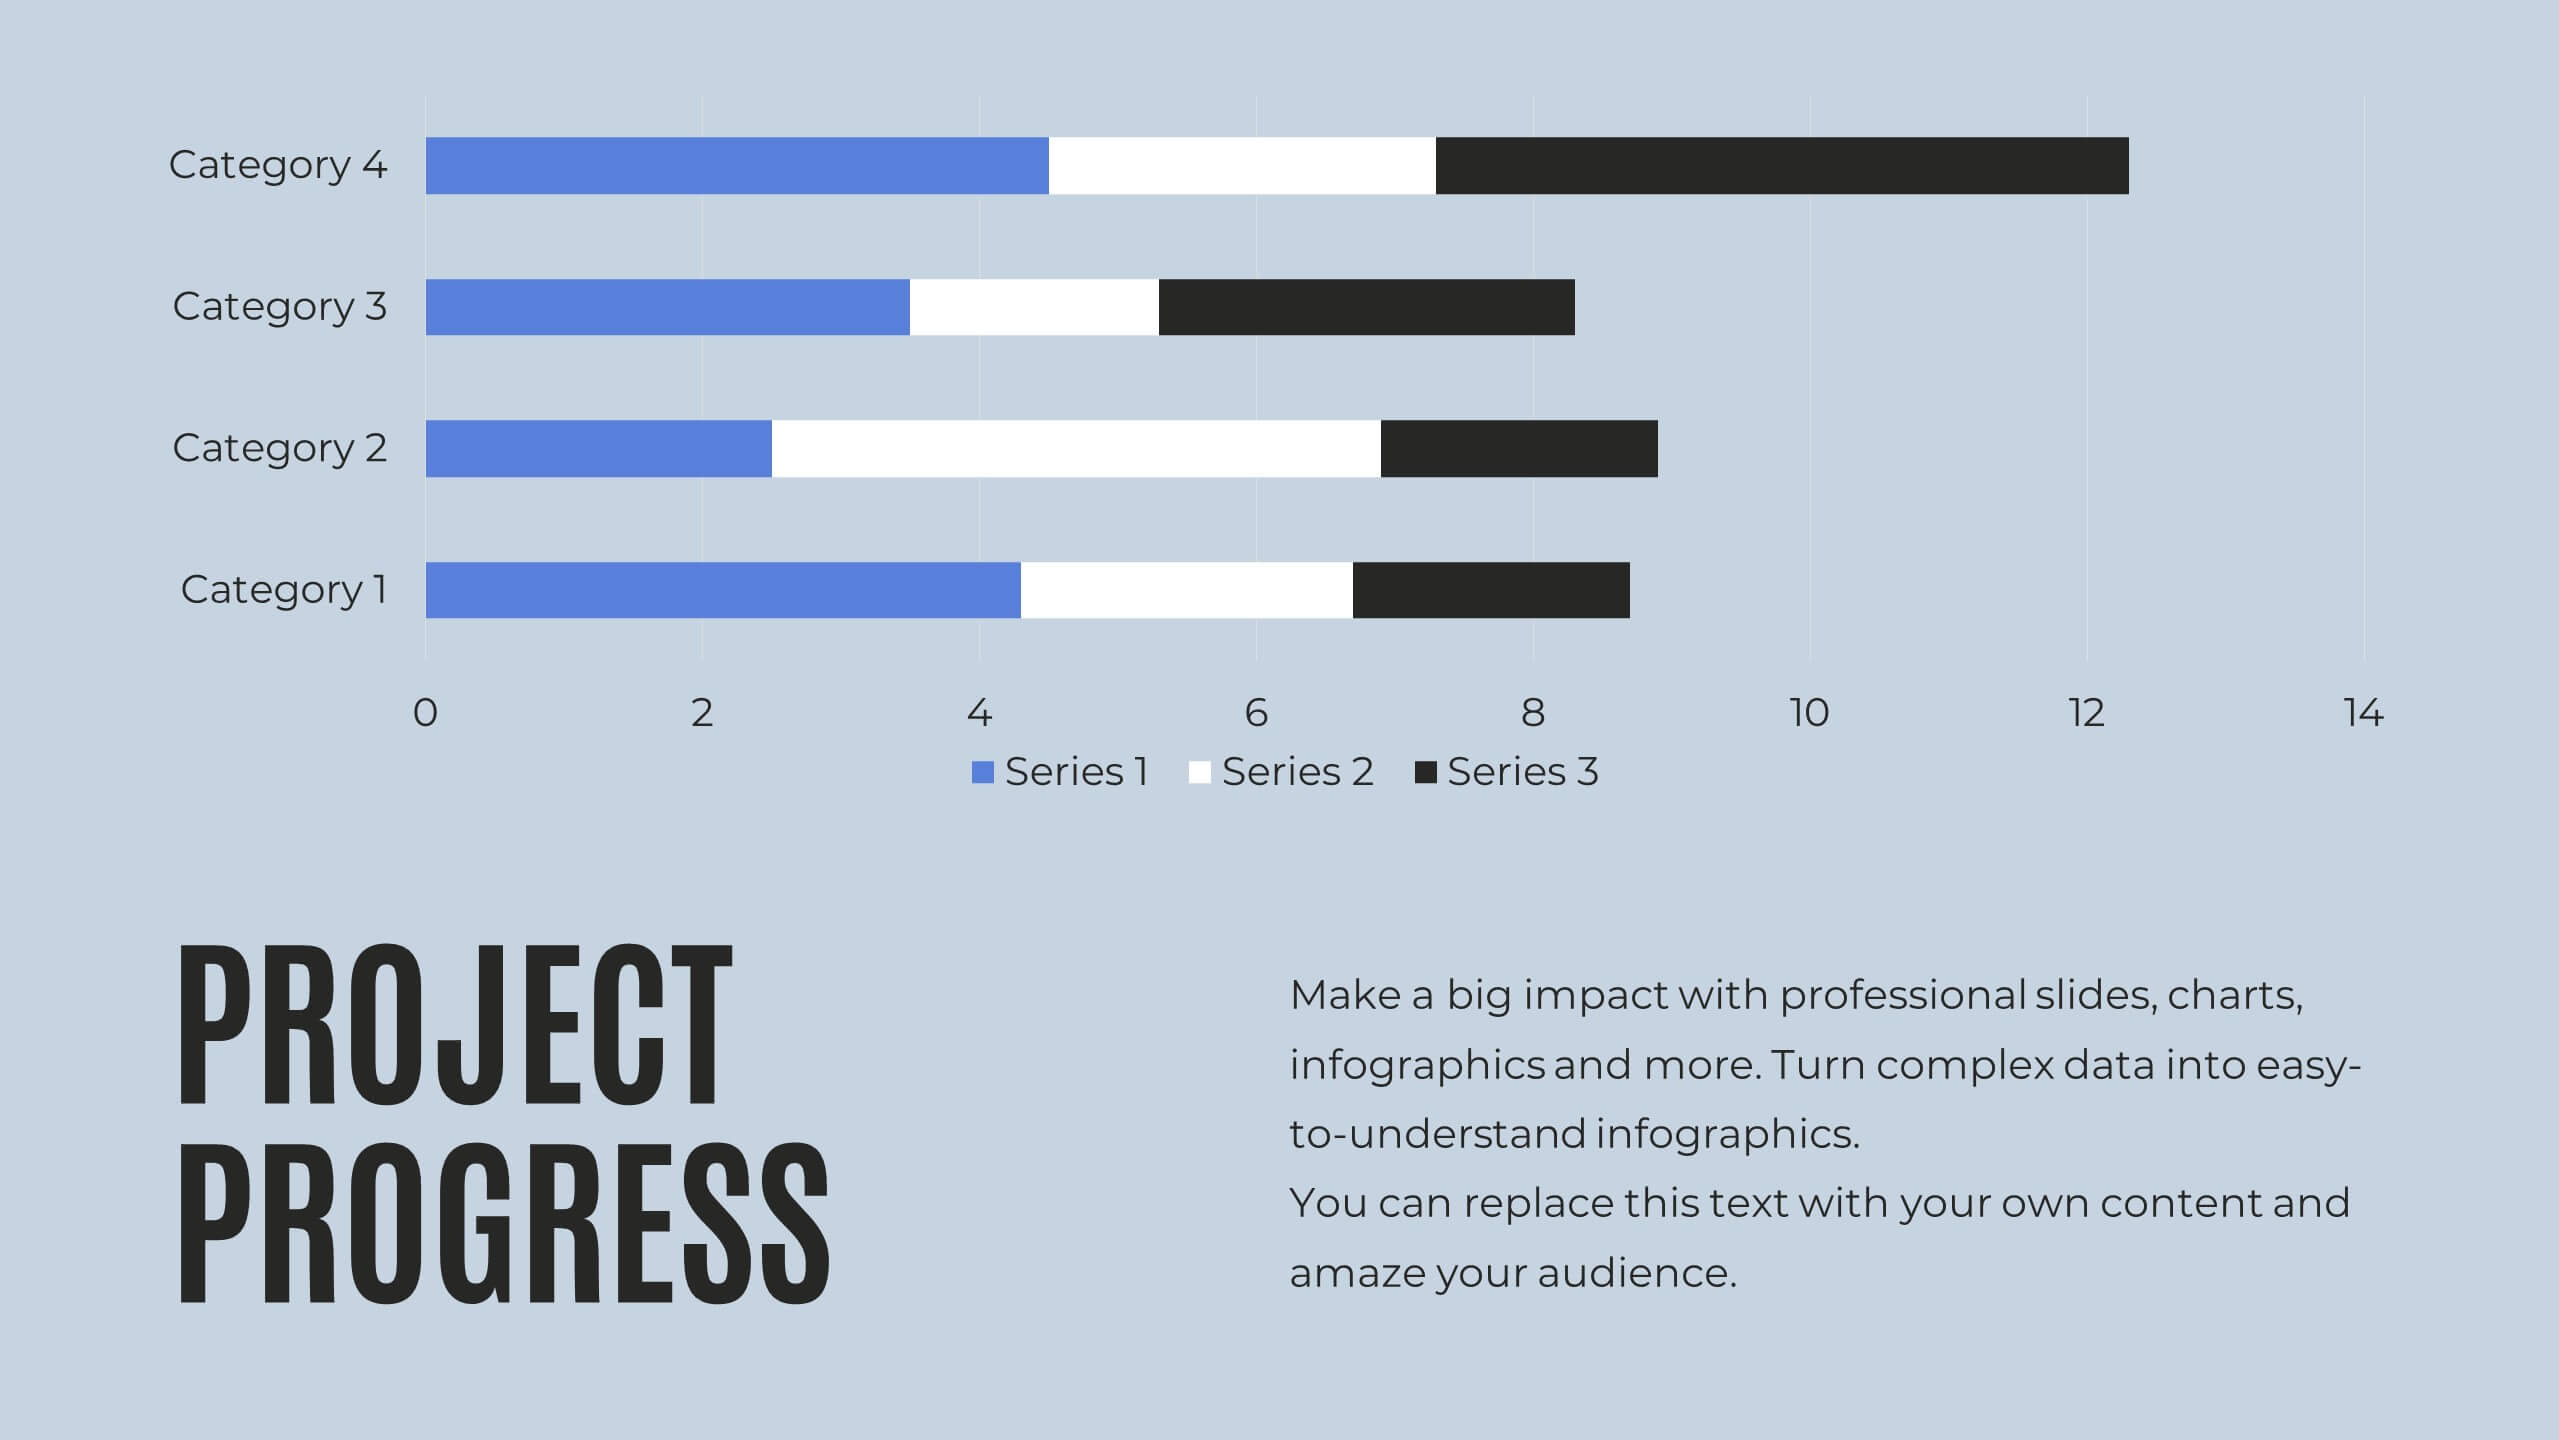
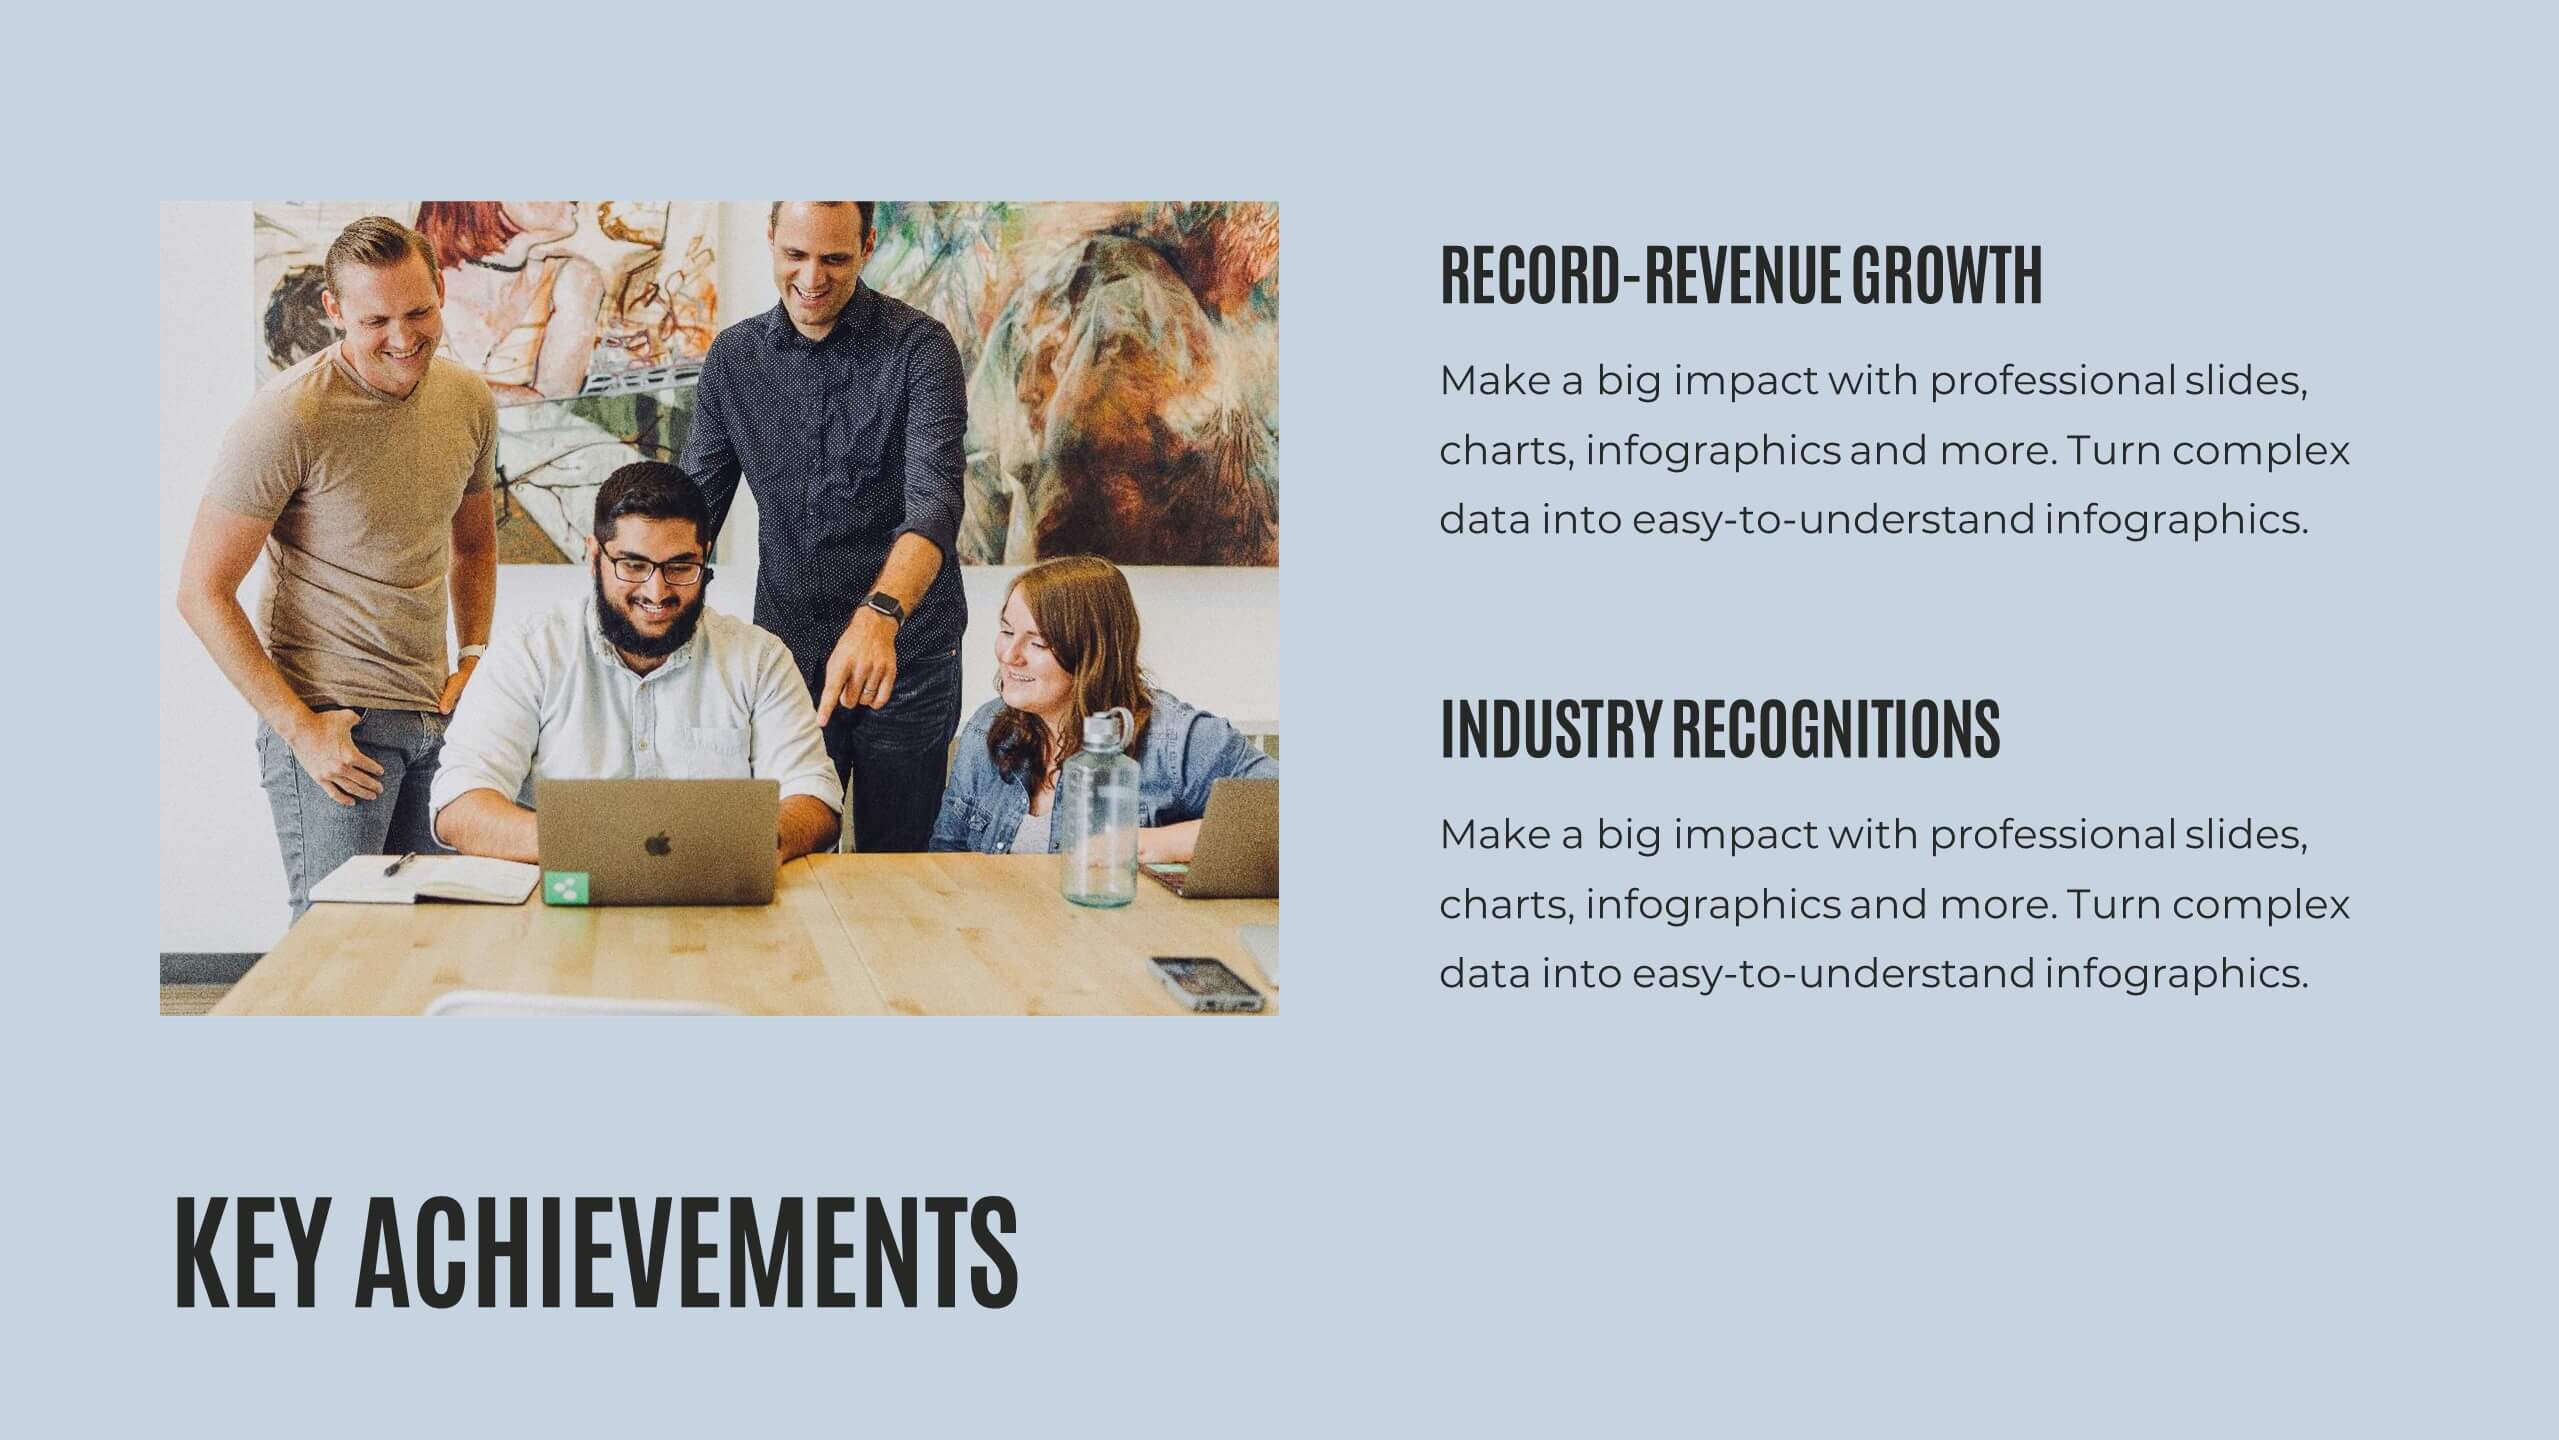
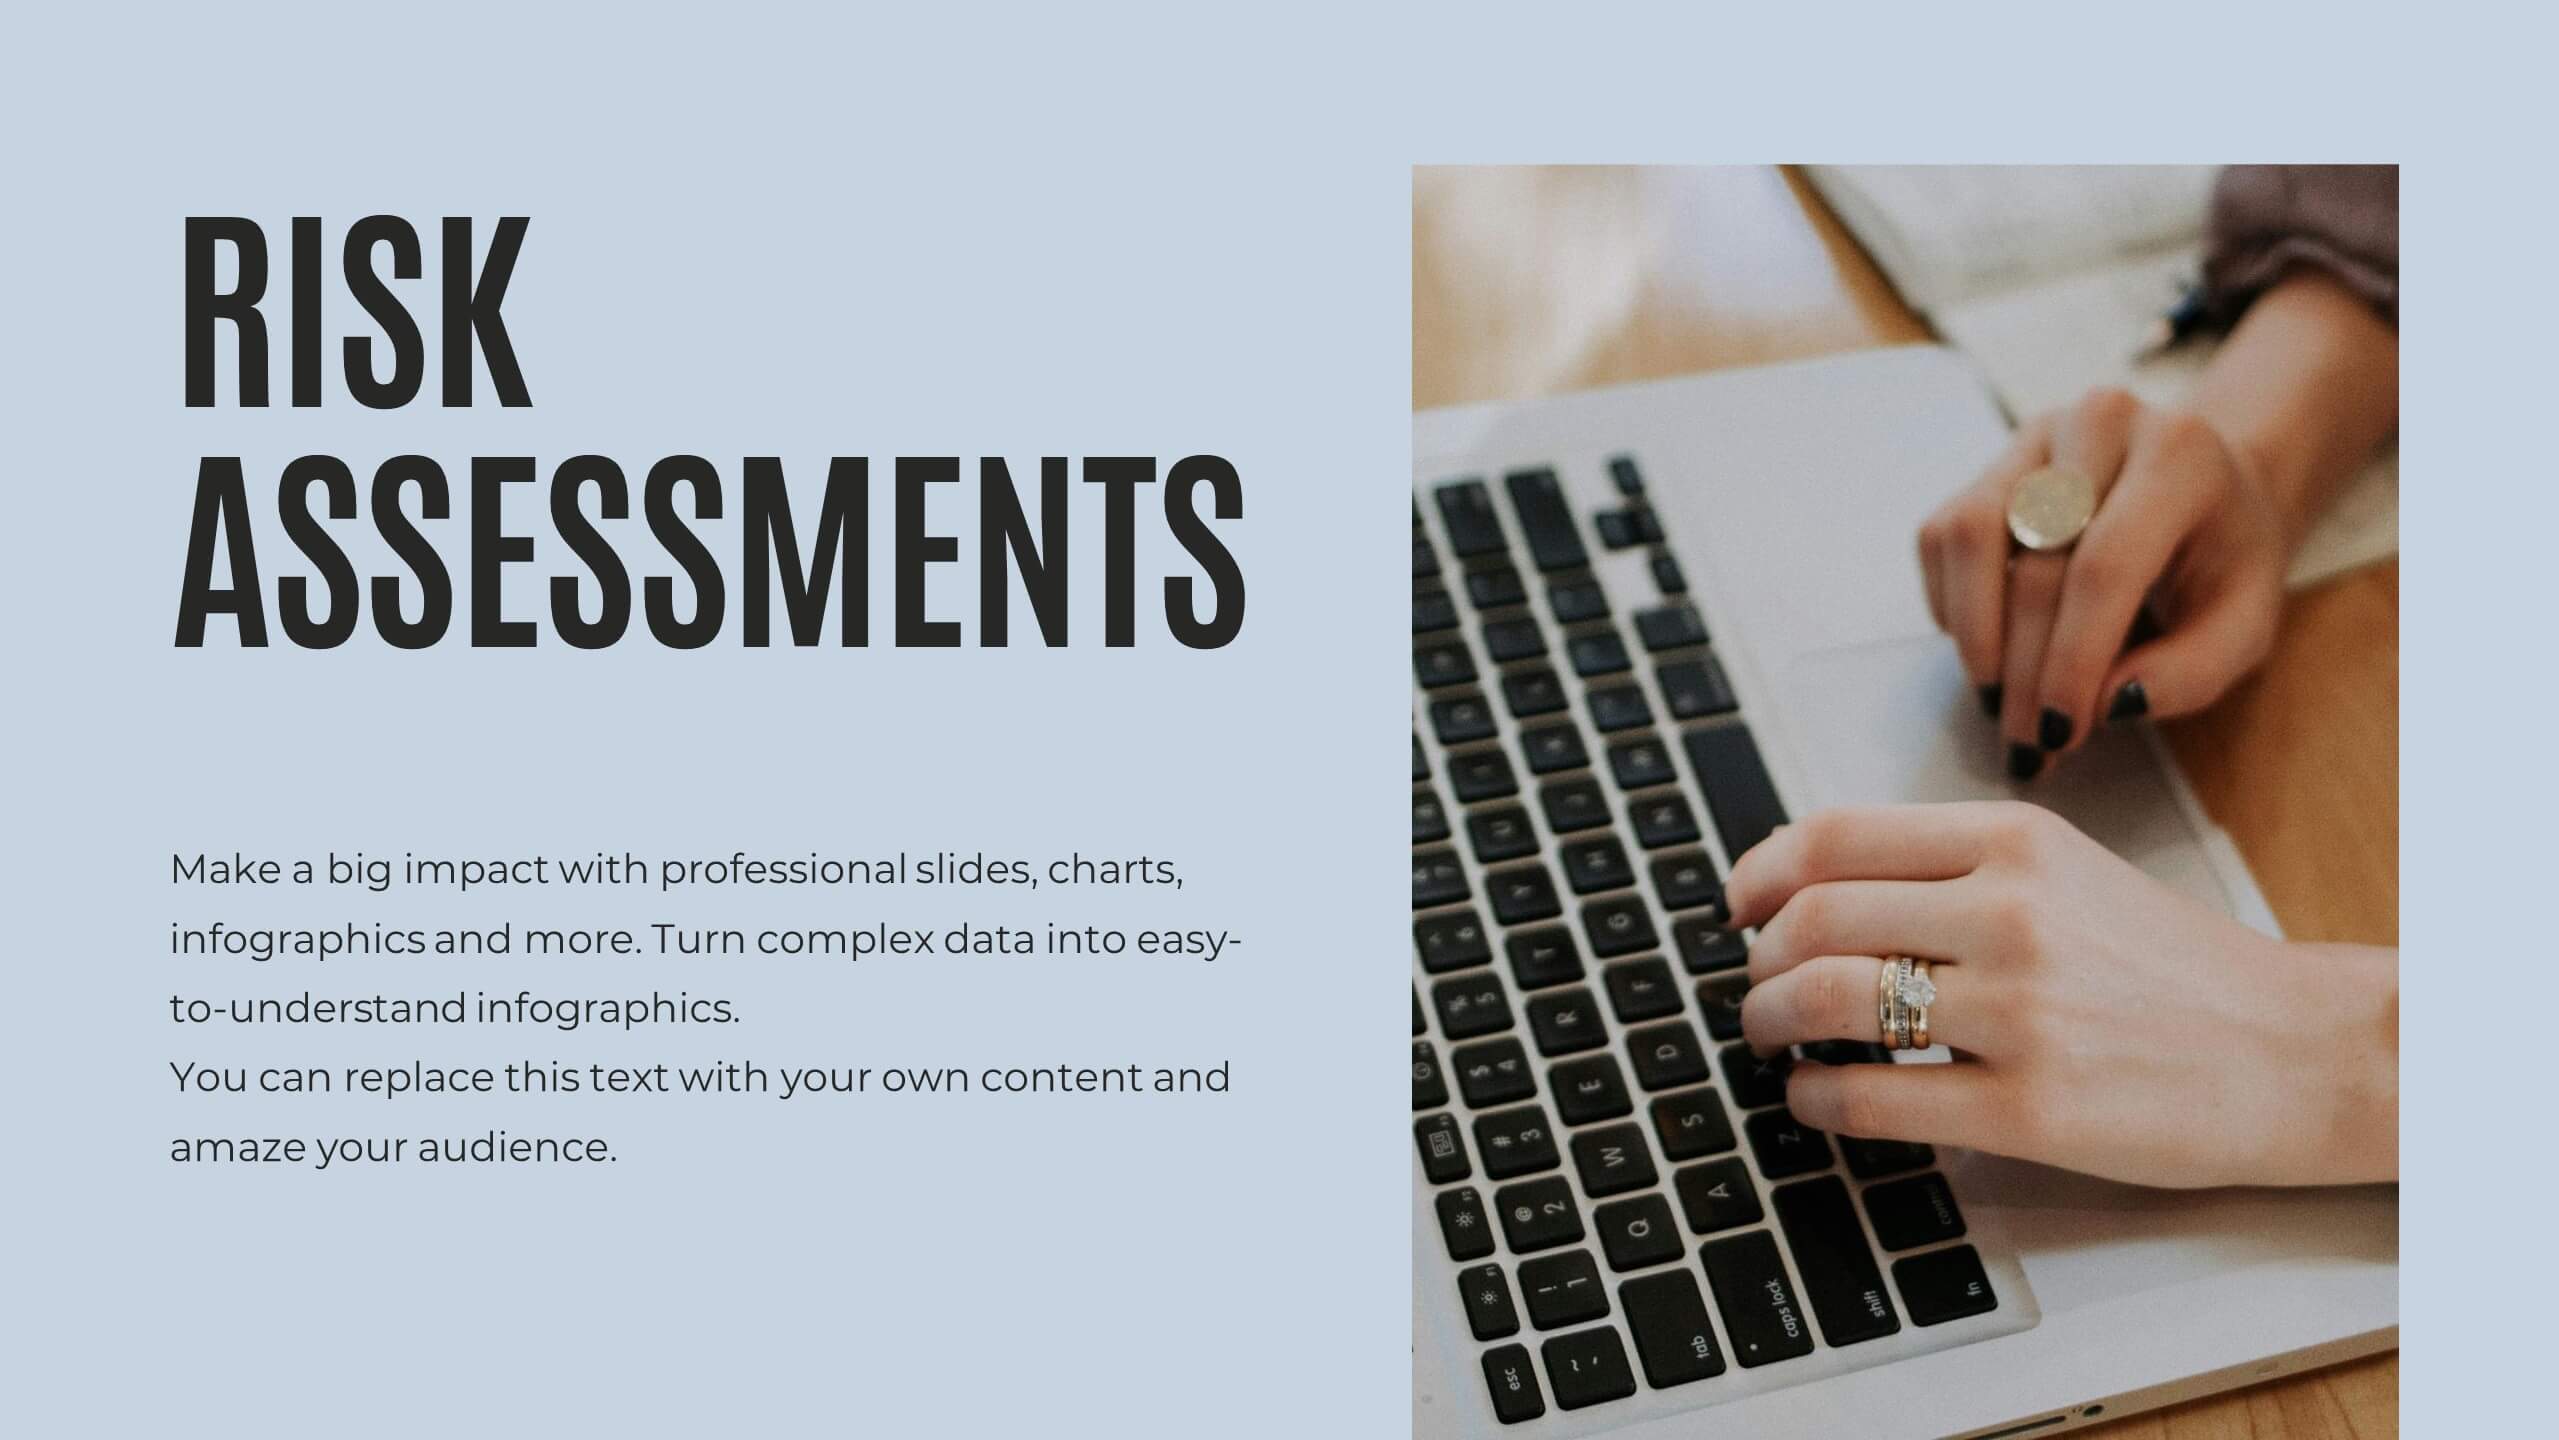
Quill Research Findings Report Presentation
Illuminate your findings with this comprehensive research report template! Perfect for presenting key highlights, performance metrics, and financial summaries, it features professional slides for project progress, risk assessments, and market trends analysis. Engage your audience with clear visuals and detailed content. Compatible with PowerPoint, Keynote, and Google Slides for seamless presentations on any platform.


5 diapositivas
Brief Overview of Key Insights Presentation
Present essential information at a glance with this Brief Overview of Key Insights slide. Designed around a bold key graphic, this layout highlights up to four major takeaways with icons and concise descriptions. Ideal for summaries, analysis highlights, or recommendations. Fully editable in Canva, PowerPoint, or Google Slides.


4 diapositivas
Roadmap to Personal and Business Success Presentation
Guide your audience through a strategic journey with this roadmap-themed presentation. Featuring traffic cones on a winding path, it’s ideal for illustrating goals, milestones, or stages of development. Fully editable in PowerPoint, Keynote, and Google Slides—perfect for growth plans, personal development, project timelines, or business success strategies.

20 diapositivas
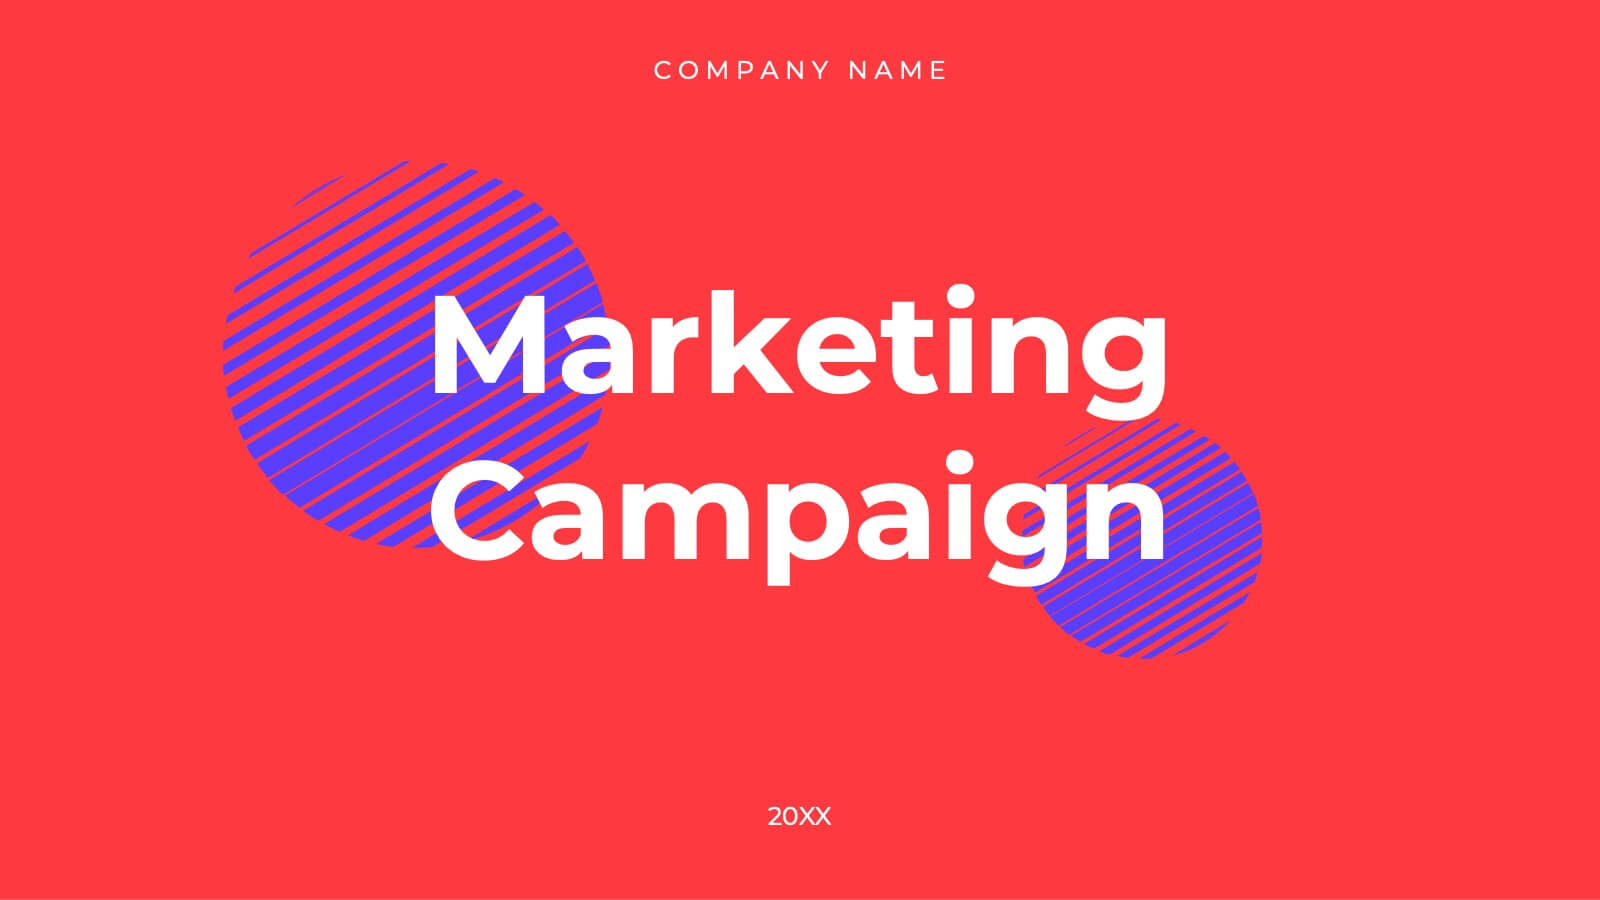
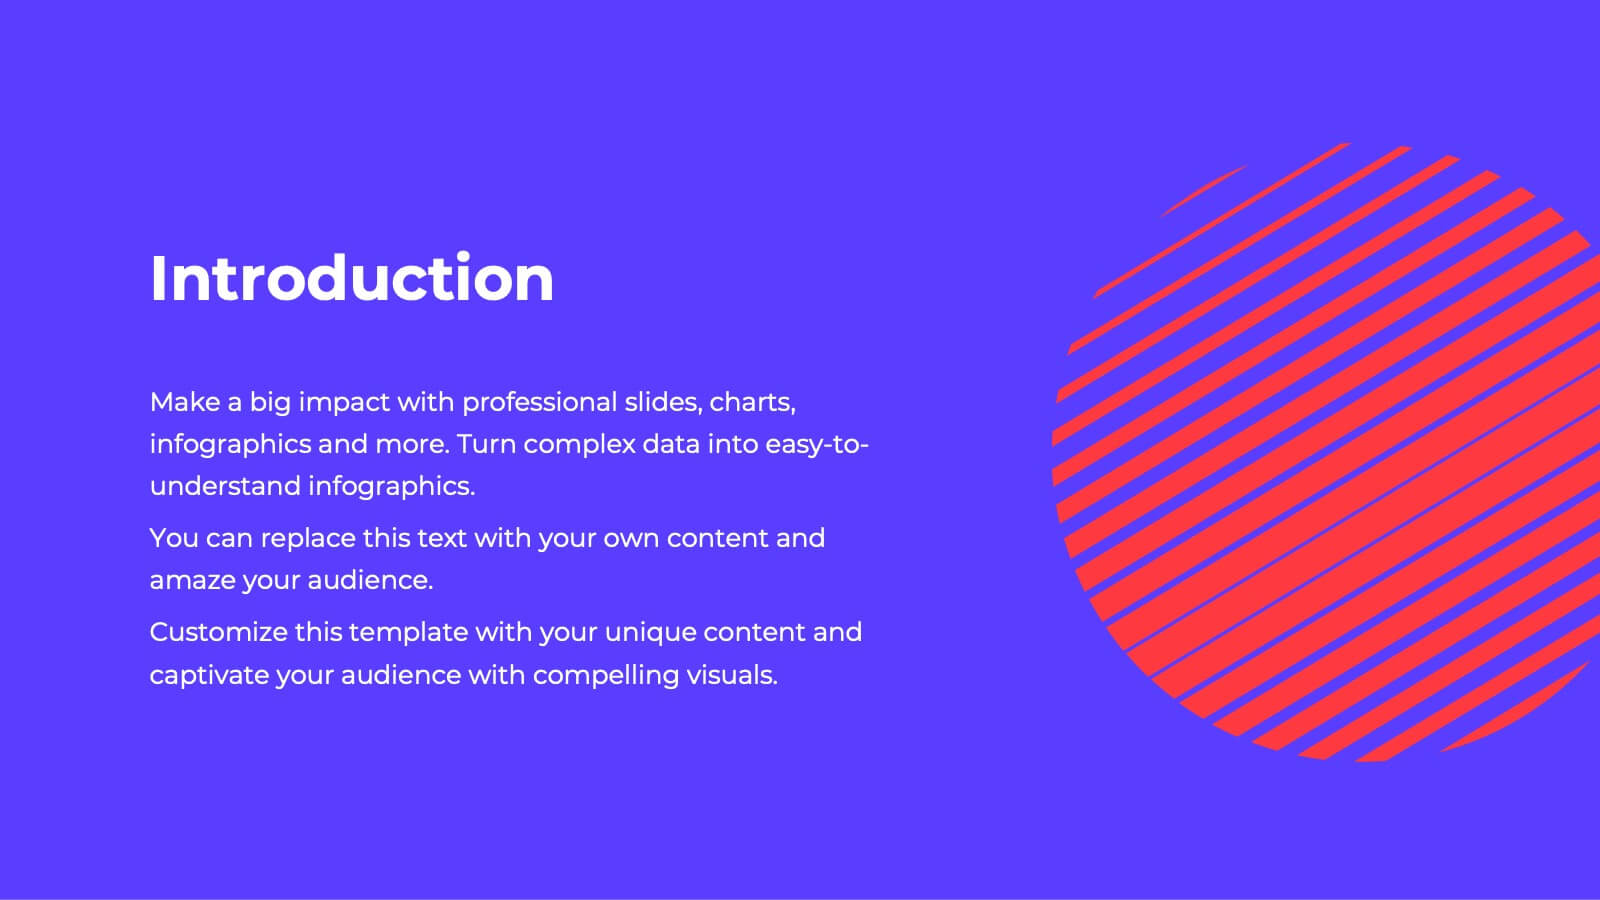
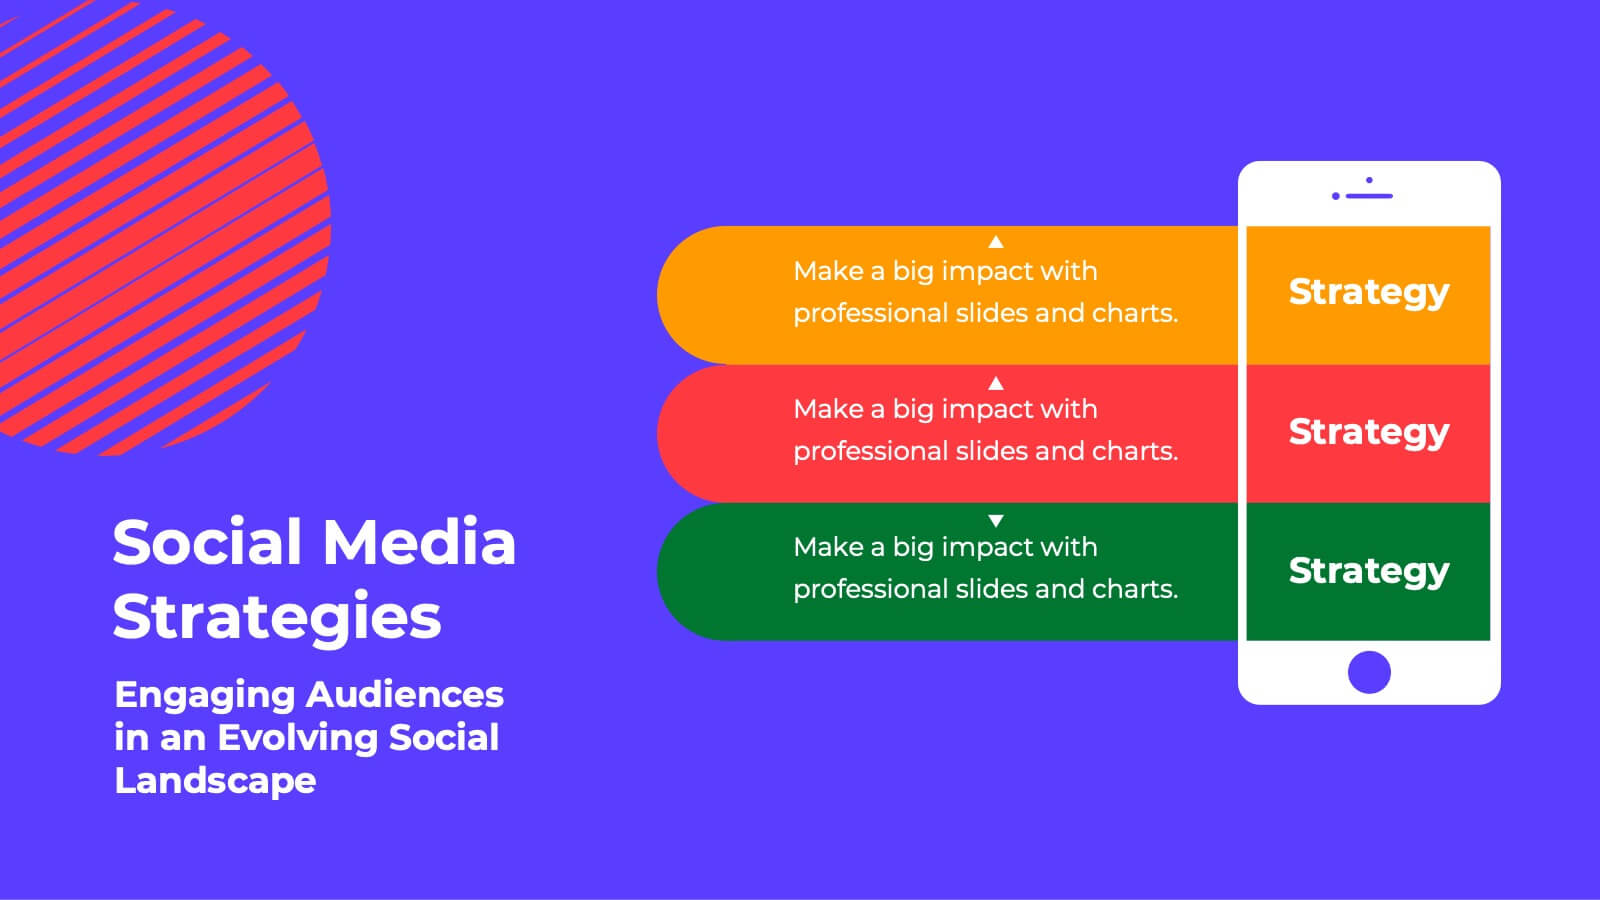
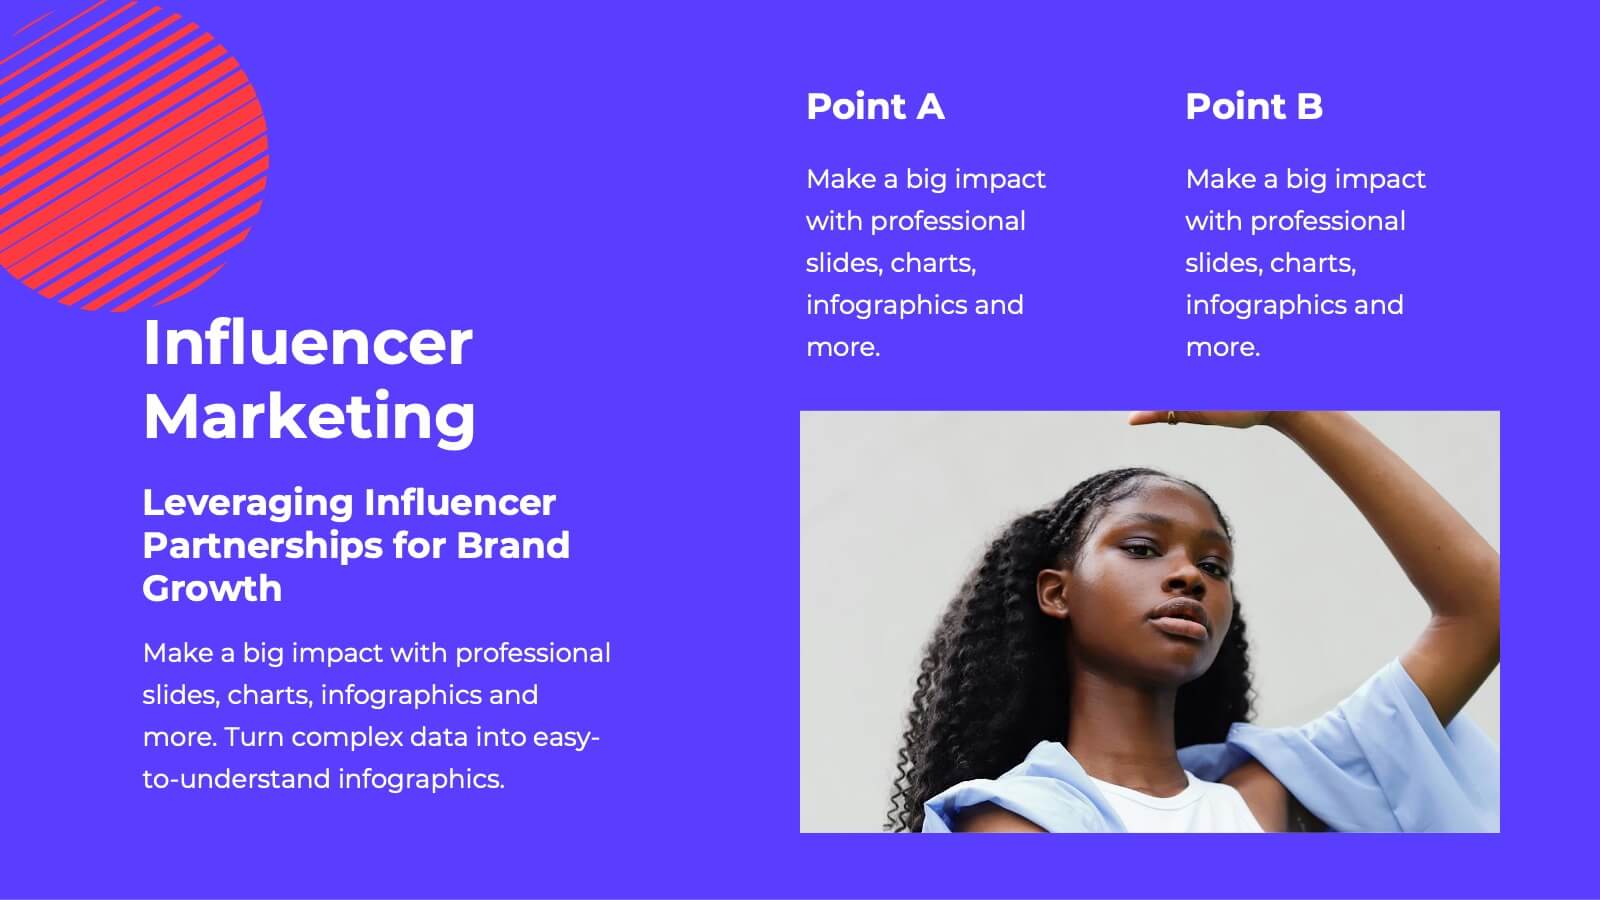
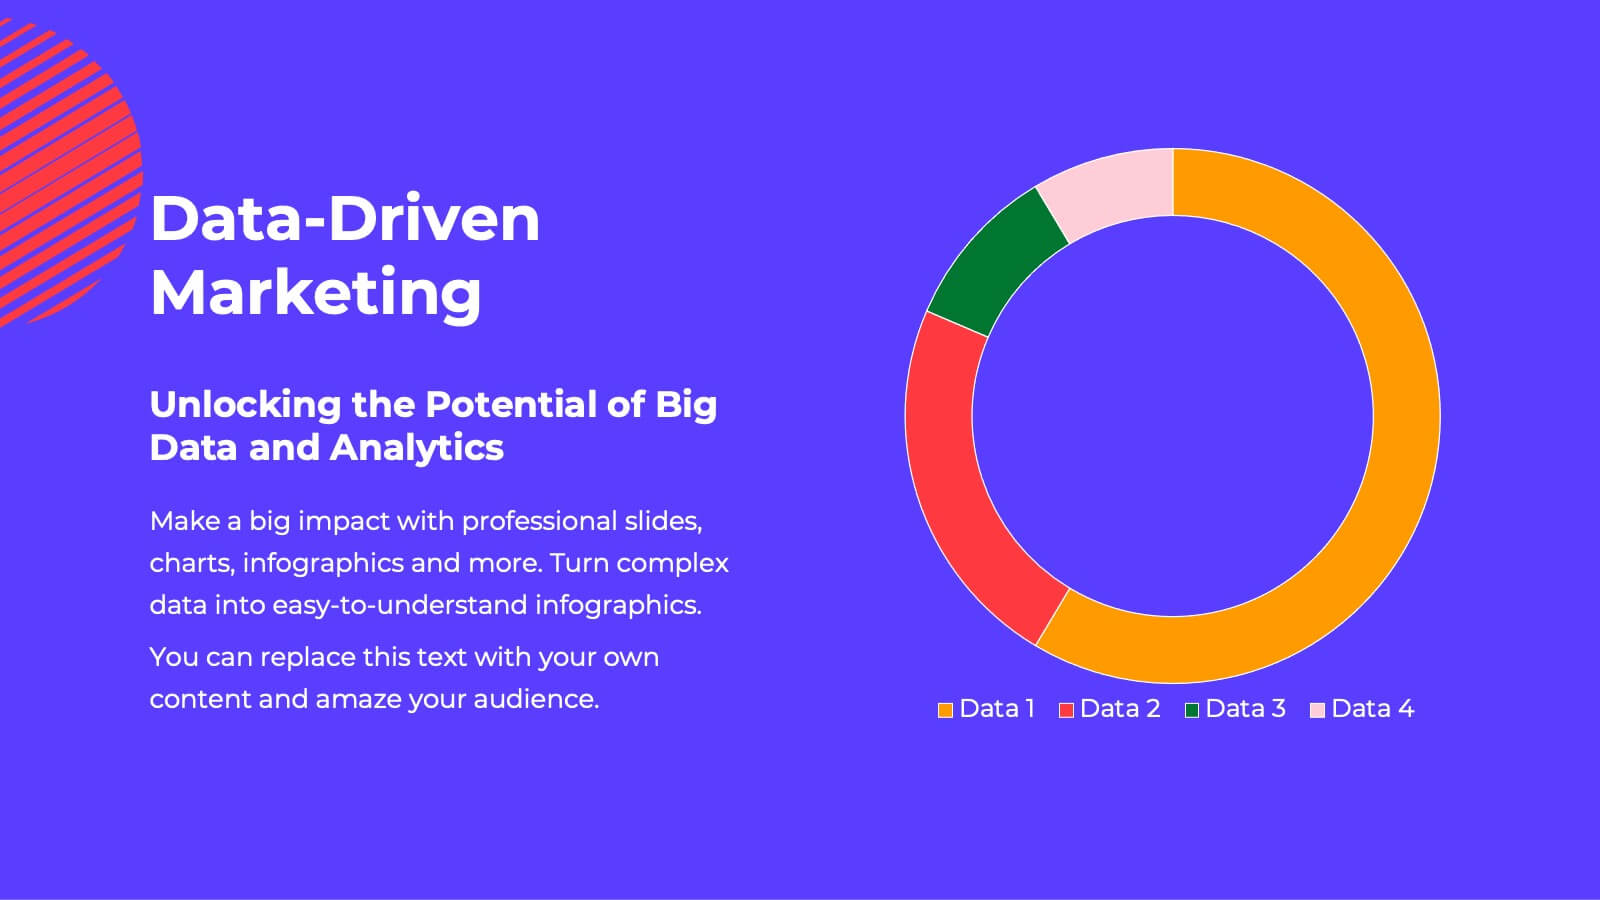
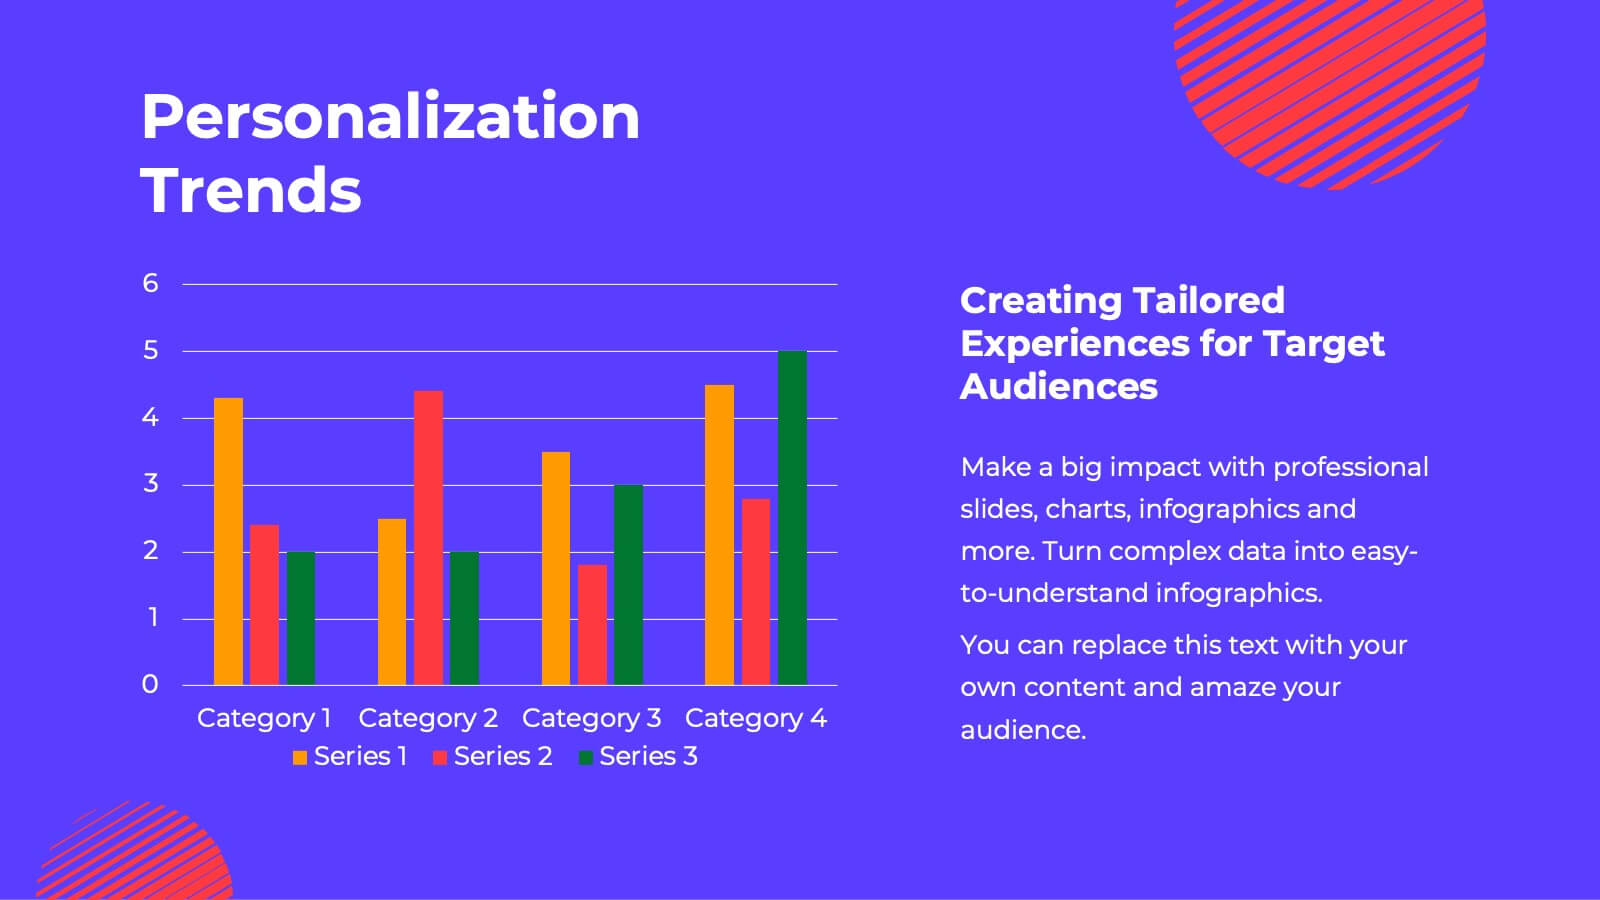
Fusion Marketing Campaign Presentation
Unleash the power of your marketing campaigns with this vibrant marketing campaign template! Dive into social media strategies, influencer marketing, data-driven insights, and more. Perfect for presenting to stakeholders and team members. Fully customizable and compatible with PowerPoint, Keynote, and Google Slides.


26 diapositivas
Maev Presentation Template
Maev is a perfect modern template with a clean and professional feel. Maev was designed by professionals to help businesses connect with their audience. This template has a modern, chic aesthetic and very detailed look which is extremely appealing. The colors are fresh which help keep the look clean and easy to read. The theme comes packed with features to target your audience and help you get your message across. Charts, timelines and easy to edit text, this template is perfect for businesses seeking to make an impression on their audience. by demonstrating they are transparent and reliable.


5 diapositivas
Human Resource Management Infographics
Human Resources Management is a critical function within organizations that focuses on managing and developing the human capital of an organization. These infographic templates are designed to showcase key concepts and strategies related to HR management. These infographics are in vertical form and offer a range of slide layouts to cover various aspects of HR. This offers a visually appealing and informative way to present key concepts and strategies. Compatible with Powerpoint, Keynote, and Google slides, Its customizable features and logical structure make it an effective tool for HR presentations or educational purposes related to HR management.


21 diapositivas
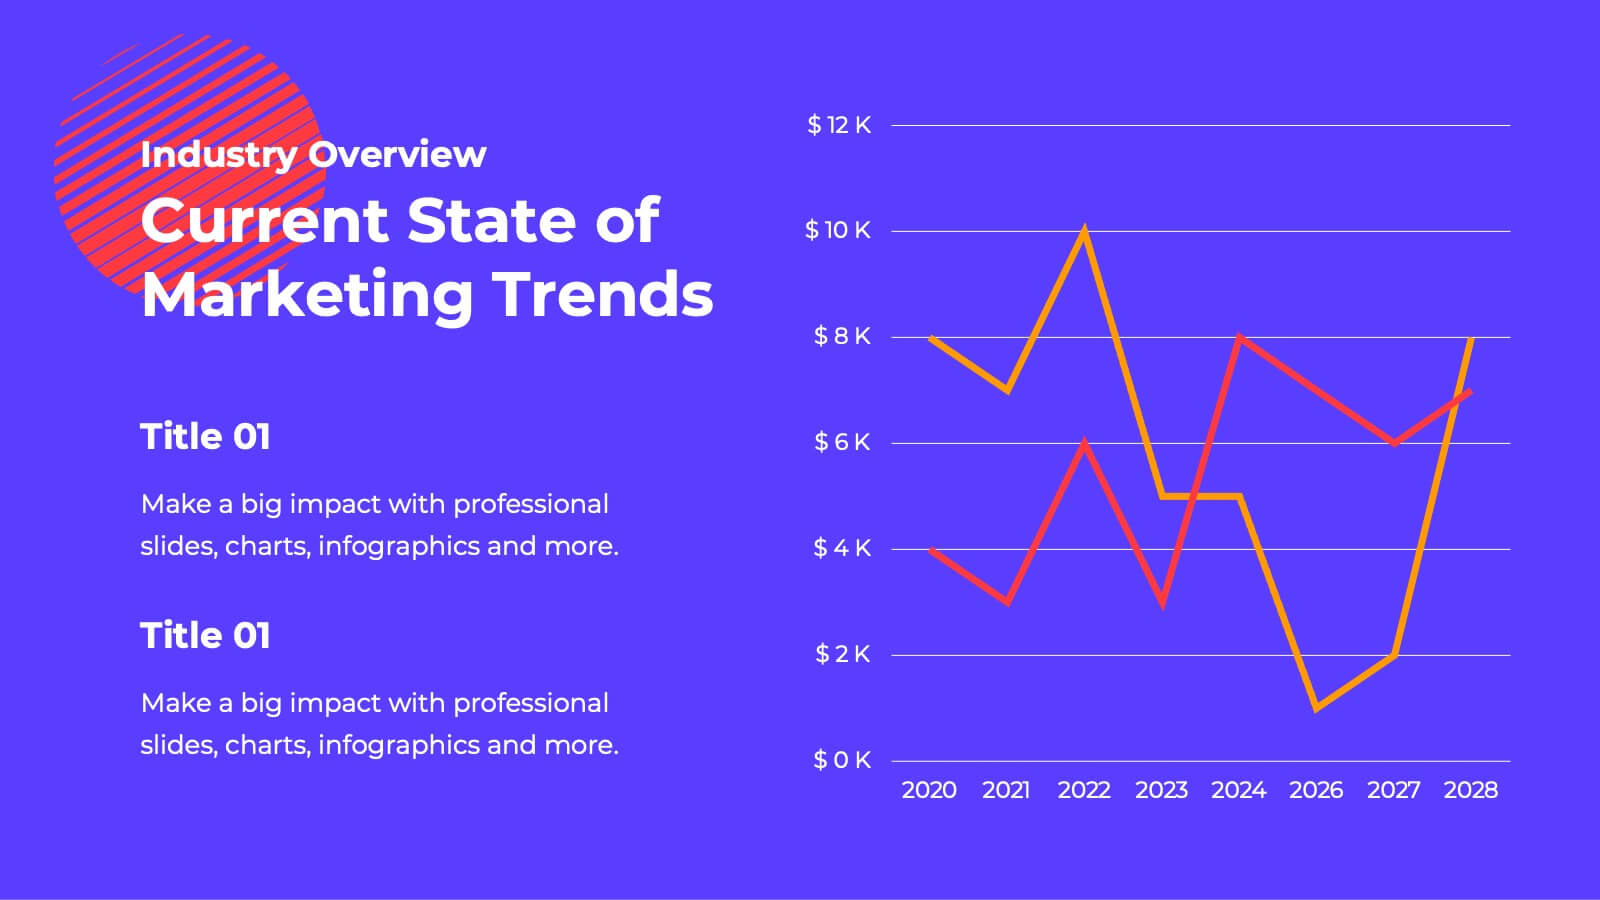
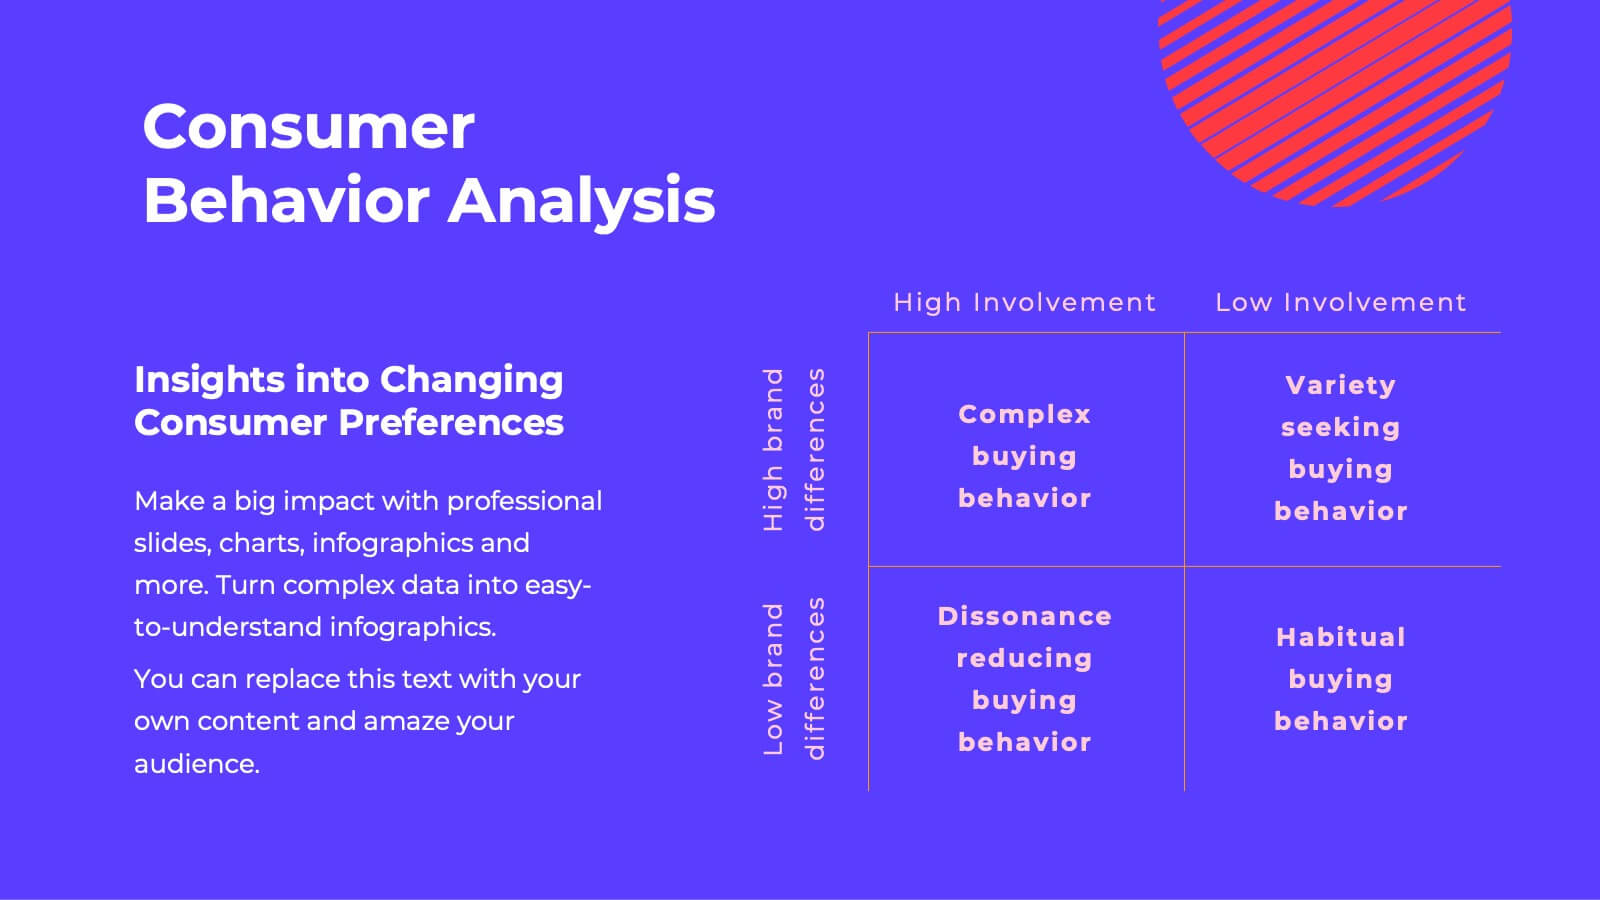
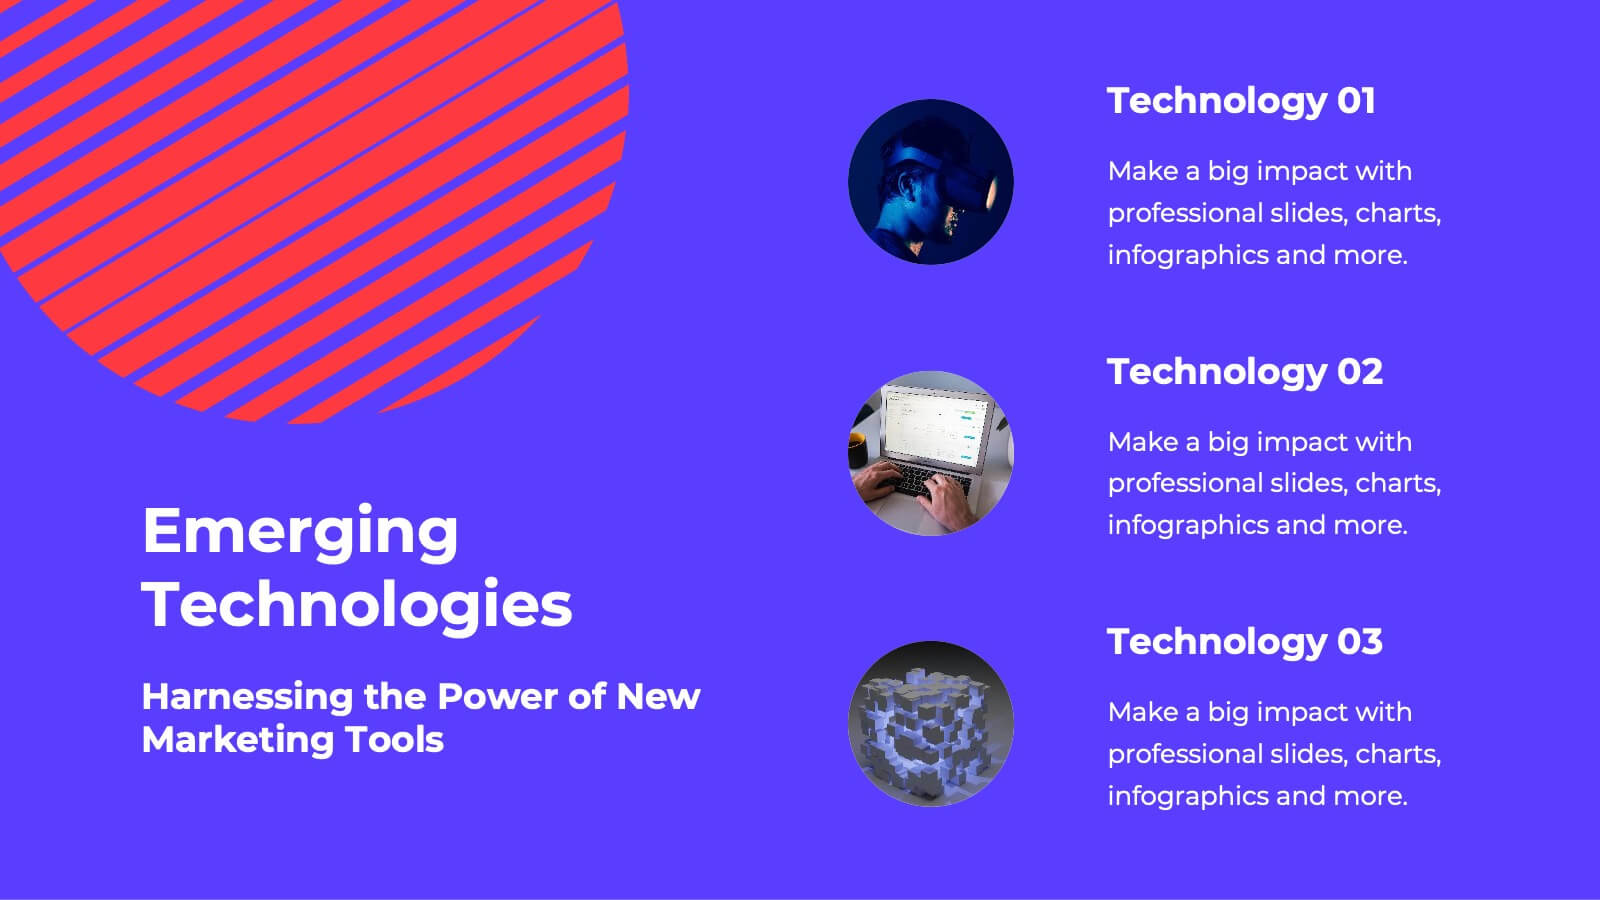
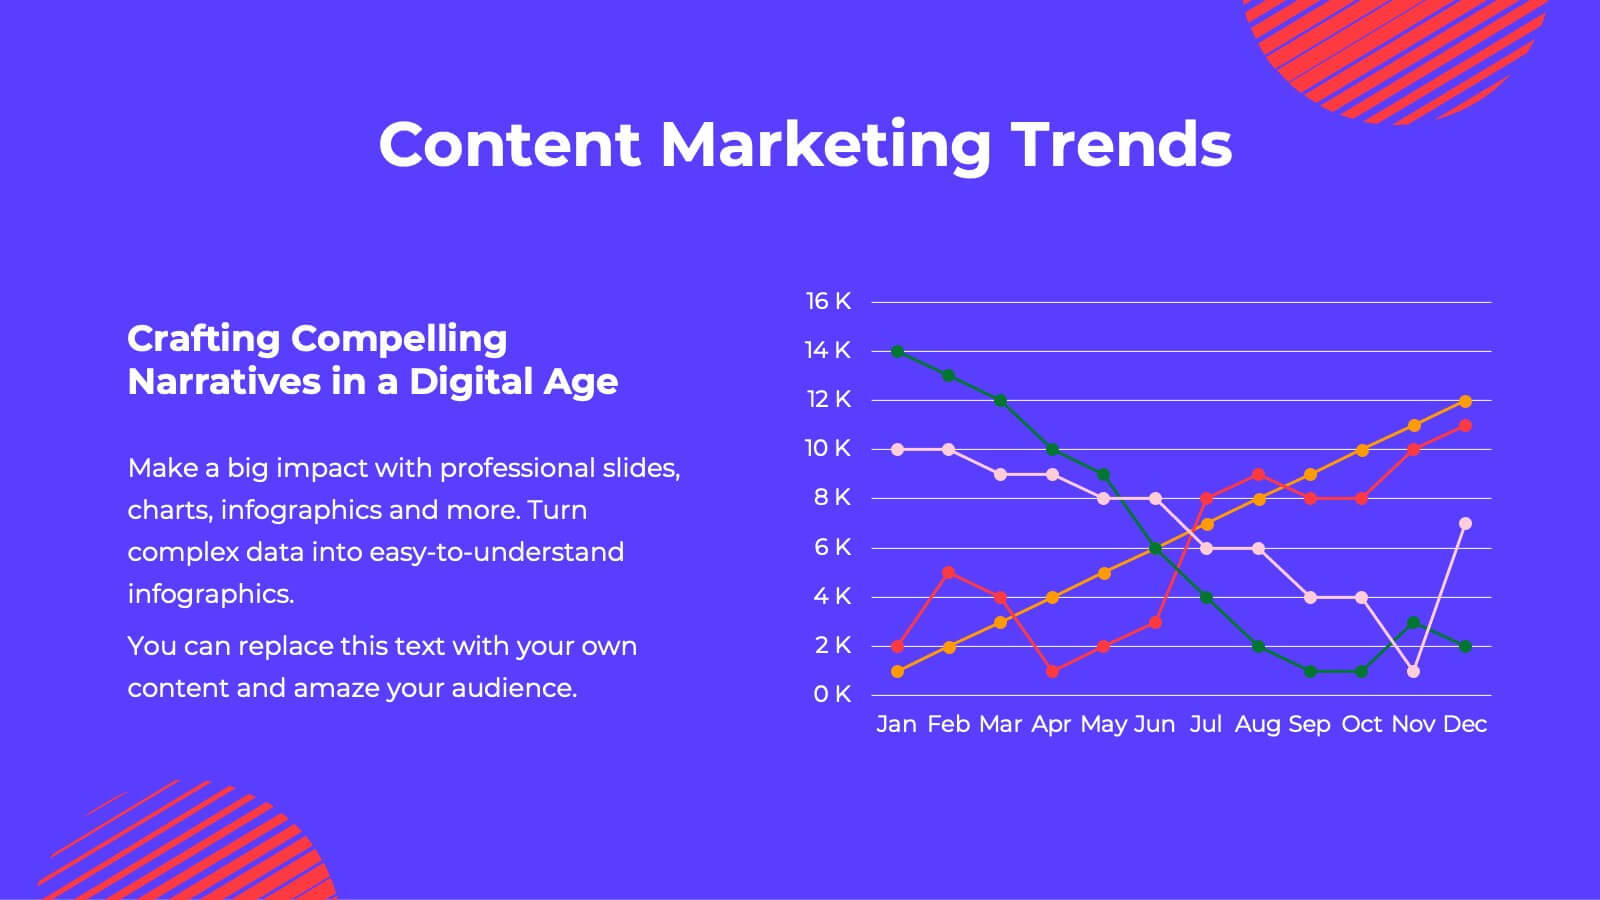
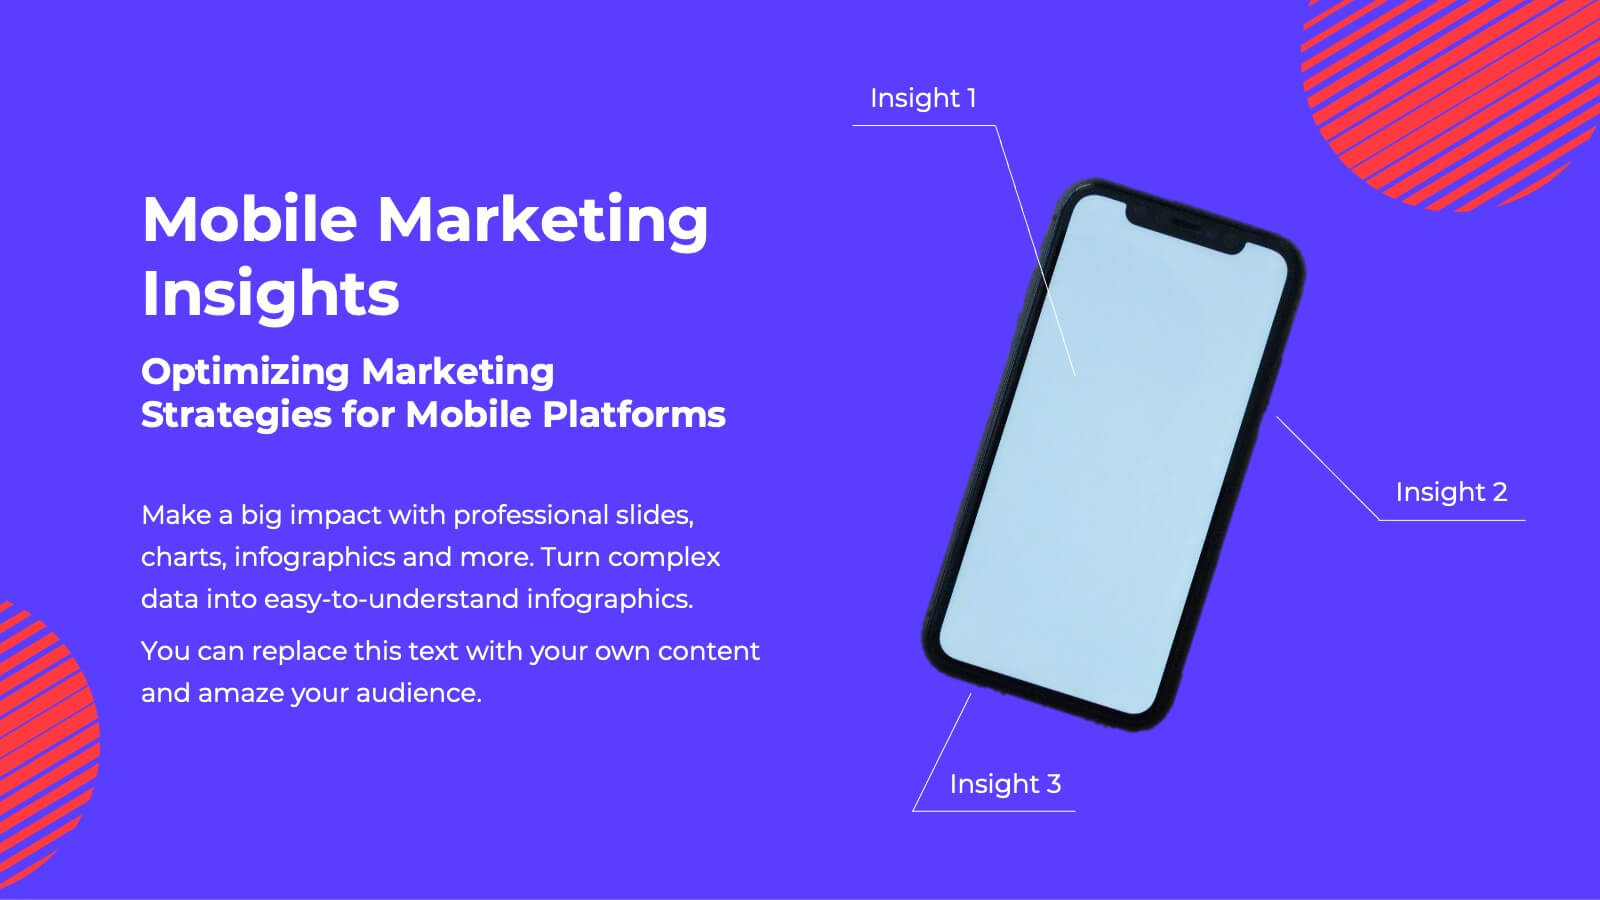
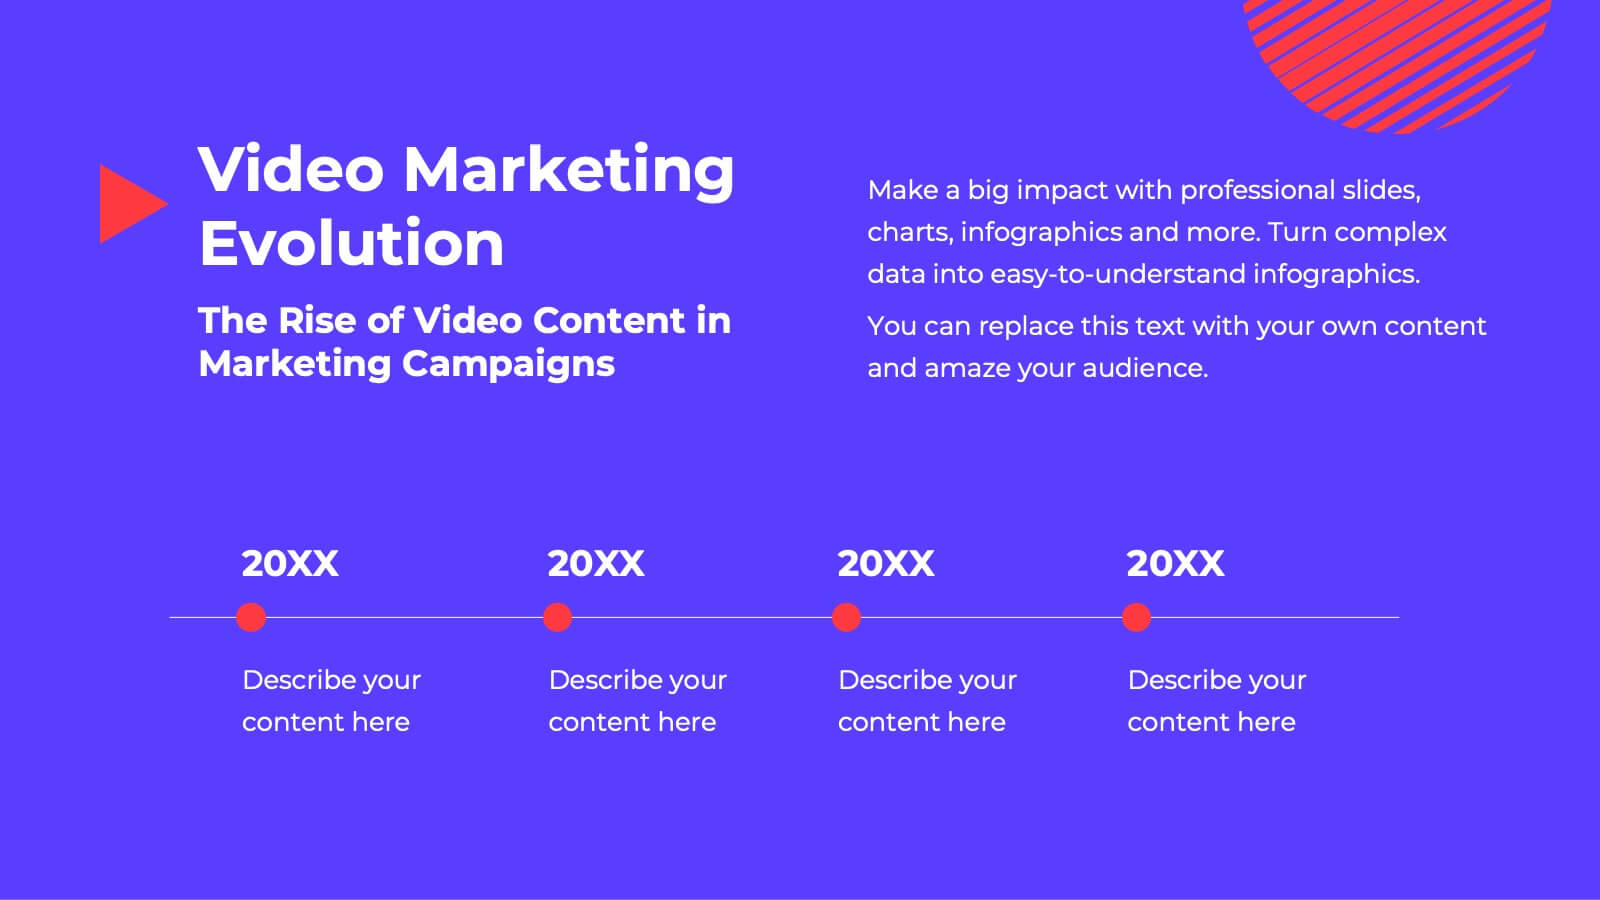
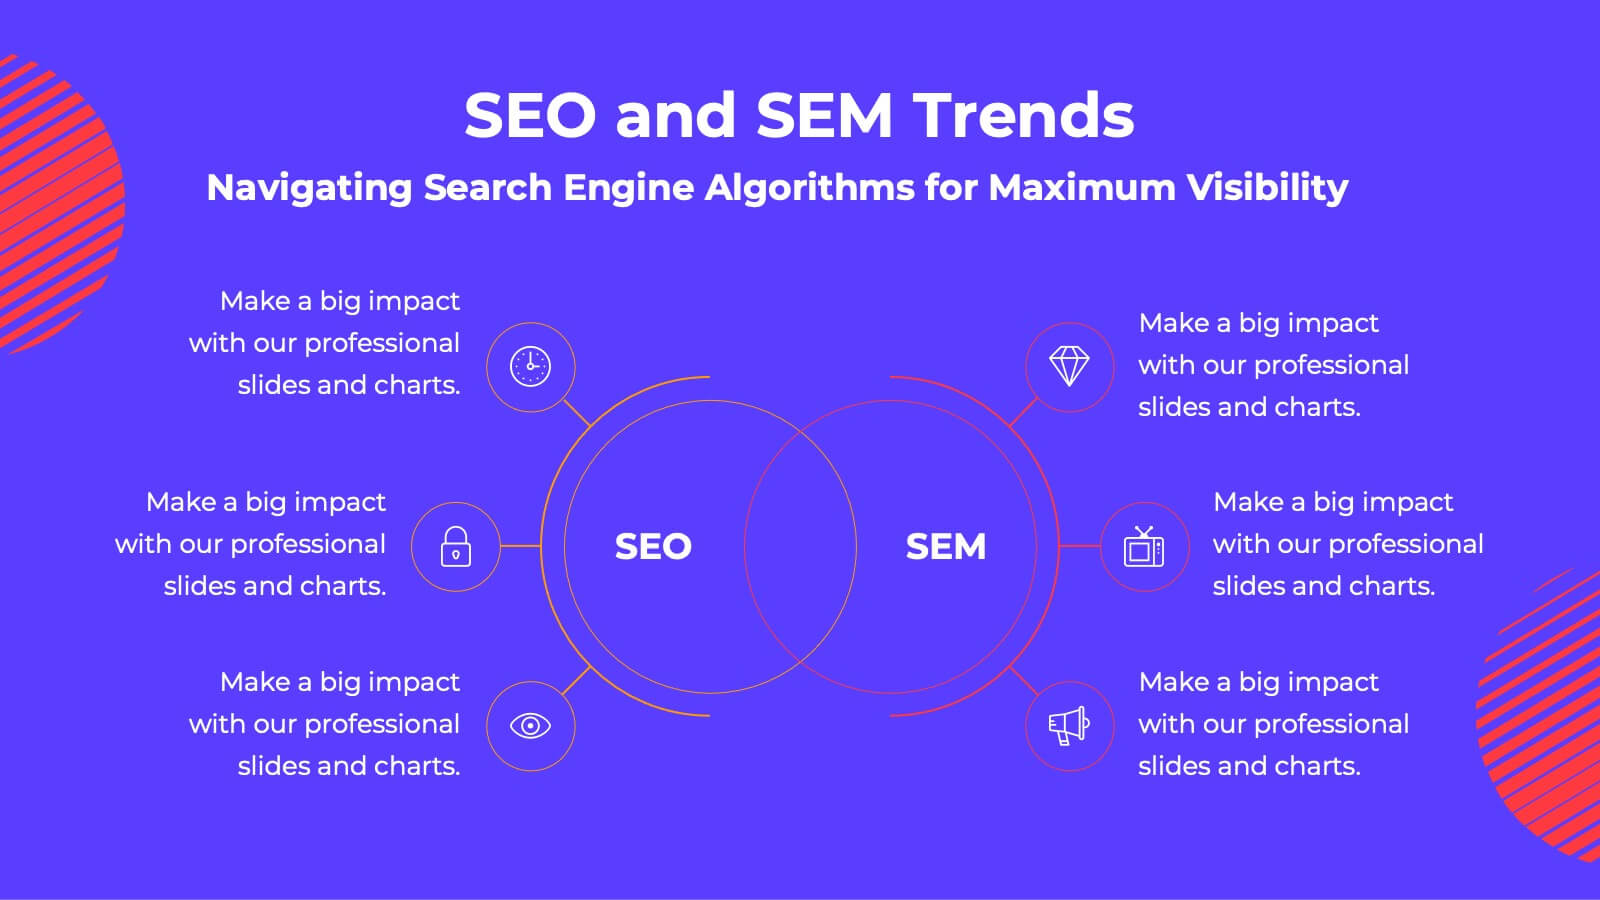
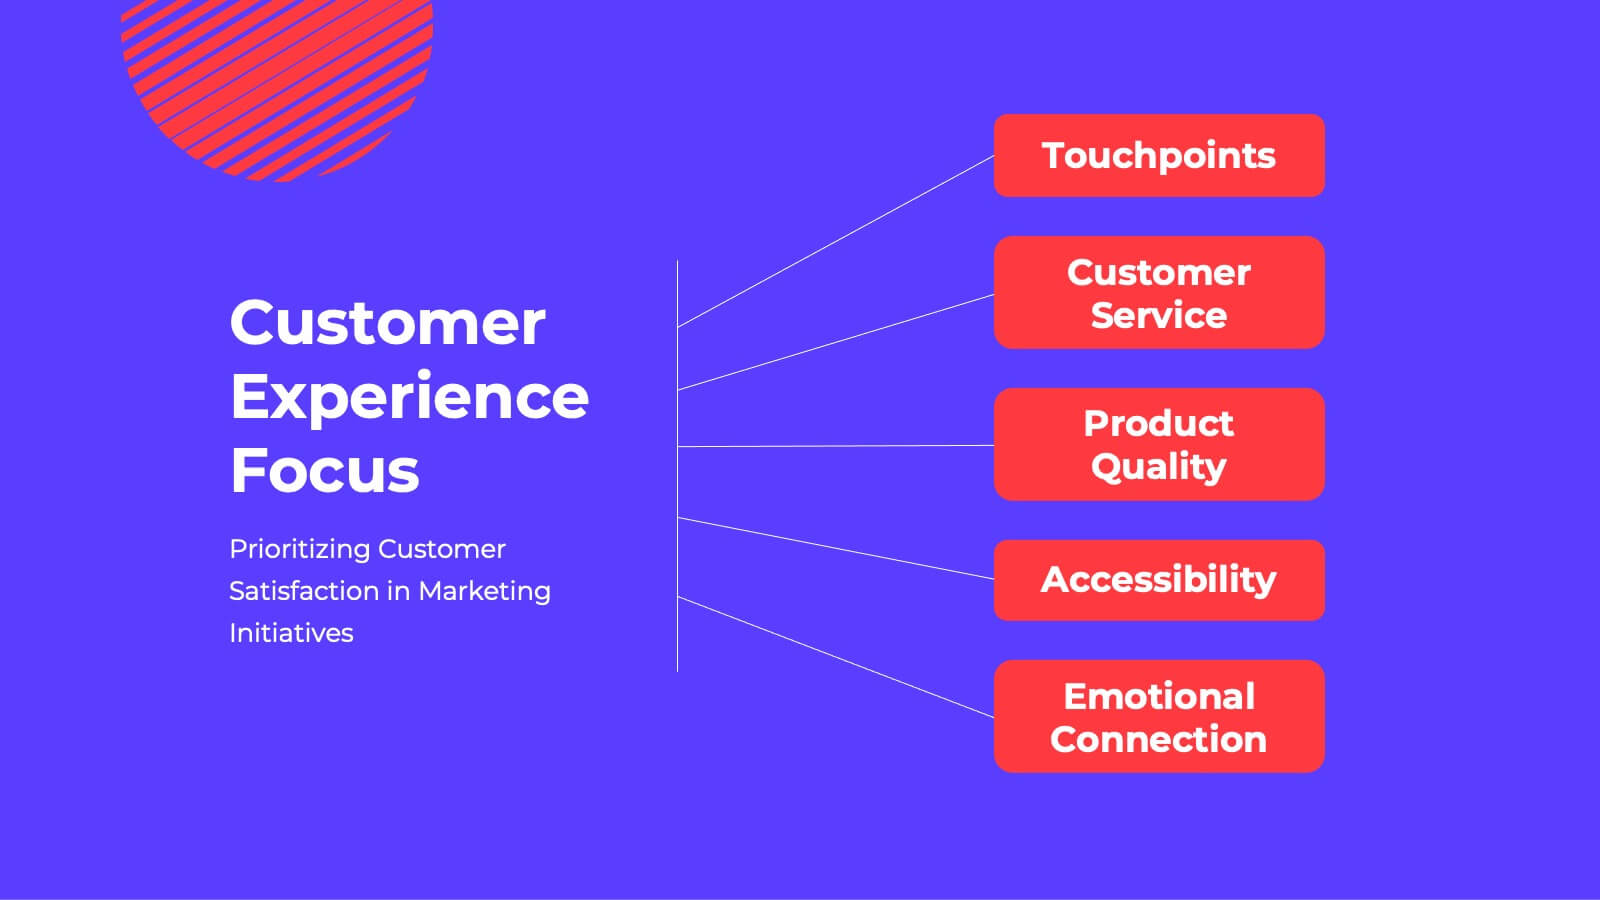
Stellar Content Marketing Pitch Deck Presentation
The Stellar Marketing Pitch Deck template is designed to make your marketing strategies shine like never before! This template is perfect for showcasing your business's potential and engaging your audience with sleek, modern designs that capture attention. Start with a powerful introduction, leading into an in-depth industry overview that highlights key trends and consumer behaviors. With dedicated sections for emerging technologies, content marketing trends, and data-driven marketing, you'll have everything you need to present your innovative approach. The template also includes slides for social media strategies, influencer marketing, and SEO trends, ensuring you're covering all the bases. Personalization trends and video marketing evolution are featured to show your forward-thinking approach, while the customer experience focus slide emphasizes your commitment to quality. Finish strong with insights into e-commerce trends, brand storytelling, and sustainability in marketing. This template is fully compatible with PowerPoint, Keynote, and Google Slides, making it versatile and easy to use for any marketing presentation.


10 diapositivas
Concept Mapping with Bubble Map
Break down complex ideas into visual clusters with this hexagon-style concept mapping template. Designed to organize information into thematic groups, it's ideal for brainstorming, mind mapping, or presenting strategies and workflows. Each section uses color-coded bubble maps for easy navigation. Fully editable in PowerPoint, Keynote, and Google Slides.


4 diapositivas
Financial Report Presentation
Enhance your financial presentations with our "Financial Report Presentation" template. Designed for clarity and visual impact, this infographic features a stylized financial bag icon segmented into color-coded sections, each representing a different financial metric such as revenue, expenses, profits, and investments. This creative visual structure allows for a clear and segmented display of your company's financial health, making complex data easily understandable. Ideal for financial analysts, corporate presentations, and investor meetings, this template ensures key financial insights are communicated effectively and efficiently. Compatible with PowerPoint, Keynote, and Google Slides, it's an essential tool for delivering detailed and precise financial reports.


6 diapositivas
Stages of the Product Life Cycle Presentation
Illustrate the evolution of a product from launch to decline with the Stages of the Product Life Cycle presentation. This vibrant, segmented chart template visualizes key phases—Introduction, Growth, Maturity, and Decline—making it perfect for marketers, product managers, and strategists. Each stage is color-coded and icon-marked to enhance clarity and engagement. Fully customizable in PowerPoint, Keynote, and Google Slides.


6 diapositivas
Matrix Diagram
A matrix diagram, also known as a matrix chart, is a visual tool used to analyze and organize complex information by displaying it in a matrix format. This infographic template provides a visual framework for analyzing complex information, and improving understanding of relationships between different elements or factors. This template allows users to effectively communicate complex relationships and categorize information using a matrix format. This is perfect to use in a wide range of contexts, including project management, problem-solving, decision-making, strategic planning, and data analysis.


7 diapositivas
Website Mockup Infographic
Enhance your digital presence with this curated collection of website mockup templates, meticulously designed to showcase your online projects with clarity and professional flair. Each template features vibrant layouts that display your website designs on various digital devices, providing a comprehensive view of how your site will look across different platforms. These mockups are crafted with precision, emphasizing the responsive nature of web design and ensuring that your visuals translate beautifully from desktops to mobile devices. The use of bright colors and clear, concise text areas within the mockups makes them both attention-grabbing and informative. Perfect for web designers, developers, or digital marketers, these mockups are essential tools for client presentations, portfolio displays, or marketing pitches. They allow you to demonstrate the functionality and aesthetics of your website effectively, ensuring your digital projects resonate with your target audience.


4 diapositivas
Company Long-Term Vision Presentation
Craft your company's roadmap with our "Company Long-Term Vision" presentation template. This design lets you vividly showcase your strategic direction and future goals through a modern, image-centric layout. Ideal for board meetings and stakeholder briefings, it supports PowerPoint, Keynote, and Google Slides, ensuring you can reach your audience on any platform. Utilize this template to clearly communicate your vision and drive your organization forward.


6 diapositivas
TAM SAM SOM Formula Infographics
Understand market potential with our TAM SAM SOM Formula infographic template. This template is fully compatible with popular presentation software like PowerPoint, Keynote, and Google Slides, allowing you to easily customize it to calculate and analyze your Total Addressable Market (TAM), Serviceable Available Market (SAM), and Serviceable Obtainable Market (SOM). The TAM SAM SOM Formula infographic template offers a visually engaging platform to break down these critical market size metrics and understand your business's growth potential. Whether you're an entrepreneur, marketer, or business strategist, this template provides a user-friendly canvas to create informative presentations and develop strategies based on market segmentation. Unleash your business's growth potential with this SEO-optimized TAM SAM SOM Formula infographic template, thoughtfully designed for clarity and ease of use. Customize it to calculate and showcase these market size metrics, helping you make data-driven decisions and target the right market segments effectively. Start crafting your personalized infographic today to unlock your business's full potential.


6 diapositivas
Business Case Studies Analysis Presentation
Turn insights into impact with this clean and professional layout designed to showcase real-world business challenges and results. Perfect for summarizing objectives, methods, and key outcomes, it helps you tell a clear and compelling story. Fully compatible with PowerPoint, Keynote, and Google Slides for easy customization and presentation.


6 diapositivas
Industry Analysis Porter's 5 Forces Presentation
Analyze industry competition with this Porter's Five Forces template! This structured layout visually breaks down key factors like buyer power, supplier influence, competitive rivalry, new market entrants, and substitution threats, making it ideal for strategic planning and market assessments. Fully customizable and compatible with PowerPoint, Keynote, and Google Slides.


6 diapositivas
Six Sigma Process Improvement Presentation
Dive into efficiency with our Six Sigma Process Improvement template! This presentation guide maps out each step from Define to Control, ensuring your project targets are met with precision. Ideal for quality assurance and process optimization, it's compatible with PowerPoint, Keynote, and Google Slides. Perfect for professionals keen on streamlining operations and enhancing productivity.