


Características


¿Tienes alguna pregunta?
Recomendar


6 diapositivas
Effective Leadership Decision-Making Presentation
Enhance decision-making clarity with this Effective Leadership Decision-Making template. Designed for managers, executives, and strategists, this slide visually represents decision paths, prioritization, and leadership impact. Featuring color-coded options and engaging graphics, it helps illustrate the influence of choices on business outcomes. Fully compatible with PowerPoint, Keynote, and Google Slides, making it a seamless addition to your presentations.


4 diapositivas
Strategic Triangle Model Slide
Visualize your core pillars with this Strategic Triangle Model Slide Presentation. Featuring a clean triangular layout with three editable segments, this template is perfect for showcasing frameworks such as mission-vision-values, policy-strategy-impact, or key business objectives. Each point of the triangle is paired with an icon and customizable text, making complex concepts easy to digest. Ideal for strategy planning, leadership discussions, or consulting proposals. Fully editable in PowerPoint, Google Slides, and Keynote.


4 diapositivas
Welcome and About Us Introduction Presentation
Start strong with the Welcome and About Us Introduction Presentation, designed to deliver a polished, professional first impression. This clean layout features bold typography and geometric side visuals, perfect for introducing your company, brand values, or strategic vision. Easily customize the content to suit corporate profiles, startup decks, or team intros. Compatible with Canva, PowerPoint, Google Slides, and Keynote.


7 diapositivas
Target Market Segmentation Infographic Presentation
A Target Market refers to a specific group of customers or consumers that a company or organization aims to sell its products or services too. This template has a design that can compliment your company's or organization's branding elements to make it a professional looking presentation. This template is perfect for the audience with in-depth knowledge of marketing; the template allows you to include important facts and statistics that will make it easily understandable by all types of audiences. The template comes with different chart slides, nice color combinations and graphs!


26 diapositivas
Film Industry Vintage Presentation
The film industry, also known as the cinema or movie industry, refers to the collection of companies, professionals, and organizations involved in the production, distribution, and exhibition of films. This presentation template has a nostalgic design tailored for film enthusiasts, filmmakers, historians, or anyone looking to delve into the rich history of cinema. This presentation offers a visually appealing and well-curated journey through the evolution of the film industry, highlighting key milestones, iconic films, and the pioneers who shaped its development. Utilize the vintage illustrations and diagrams to illustrate film advancements.


22 diapositivas
Muse UX Case Study Presentation
Deliver compelling UX case studies with a sleek presentation template designed to highlight your design journey and results. Ideal for showcasing your user-centered approach, it includes dedicated slides for project overview, user research, personas, journey mapping, wireframes, prototyping, and user testing. Clearly communicate your design principles and decision-making processes with visual design elements and brand guidelines. With specific sections for feedback, accessibility considerations, and project outcomes, this template ensures every aspect of your UX process is captured in a structured and visually engaging manner. Whether you're presenting to clients, stakeholders, or design teams, this template is fully editable and compatible with PowerPoint, Google Slides, and Keynote. Its modern design and professional layout provide an effortless way to convey the value of your UX work, making a lasting impact on your audience. Tailor it to your brand, and elevate your case studies today!


5 diapositivas
Construction Projects Infographics
Construction projects refer to the process of planning, designing, and building structures, infrastructure, or facilities. These vertical infographics are visually appealing and informative resources designed to showcase various aspects of construction projects. It provides a comprehensive overview of the construction industry, highlighting key statistics, trends, and best practices. The template showcases different types of construction projects. It includes visuals and brief descriptions to illustrate the unique characteristics and requirements of each type. Compatible with Powerpoint, Keynote, and Google Slides.


6 diapositivas
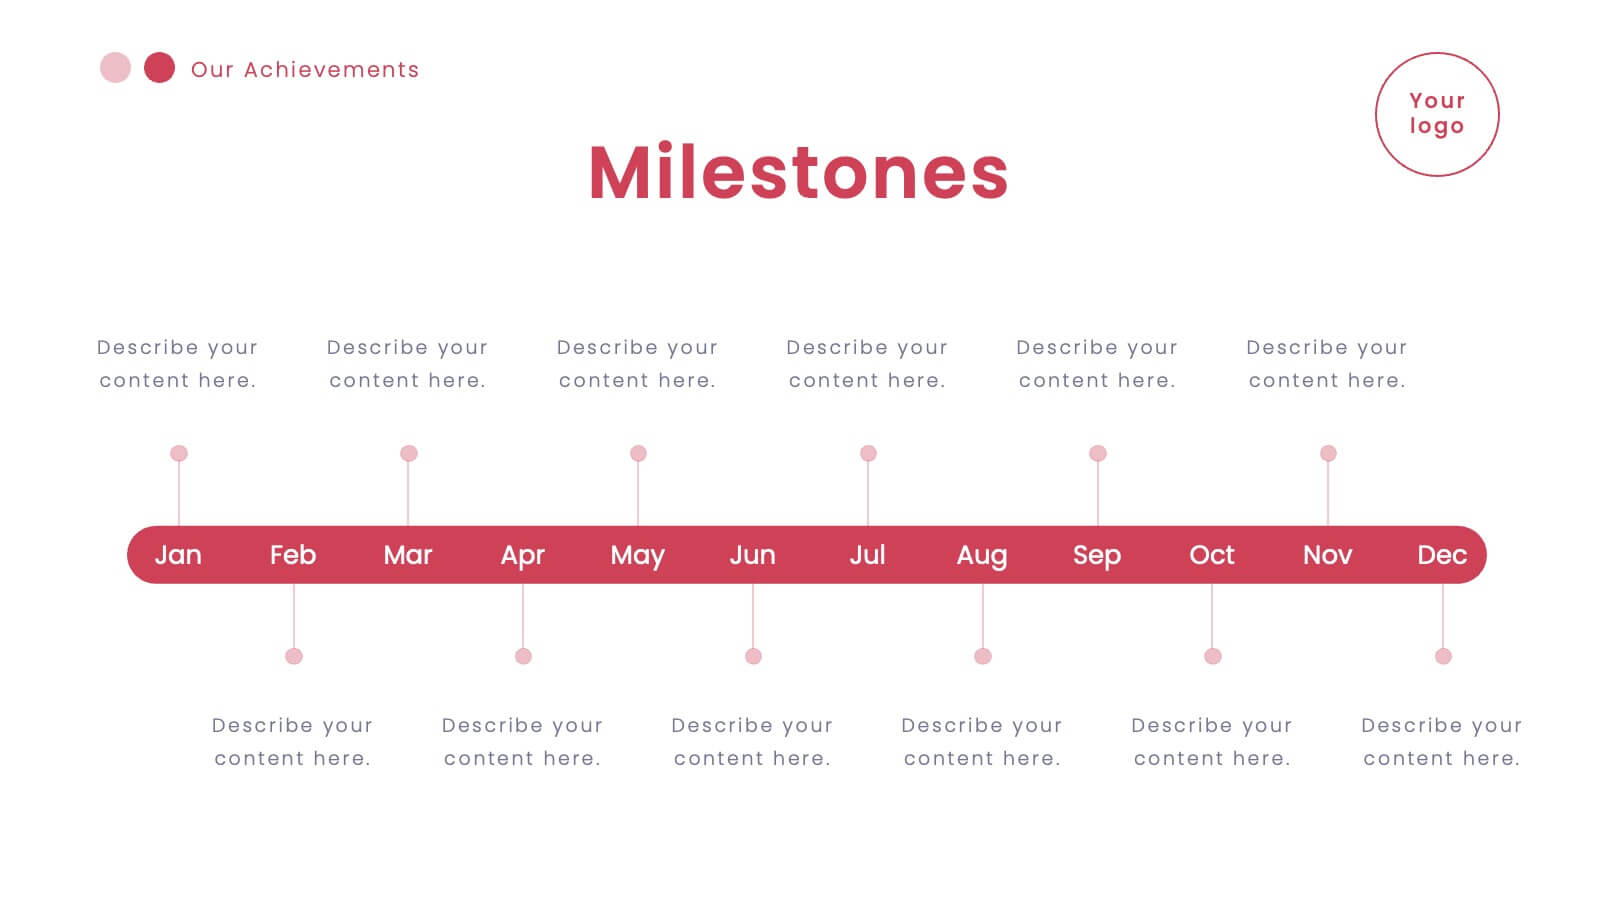
Evolution of an Industry Through Time Presentation
Visualize industry transformation with the Evolution of an Industry Through Time Presentation. This timeline-style layout is perfect for highlighting key milestones, technological shifts, or growth stages across decades. Ideal for consultants, educators, or corporate strategists. Fully editable in Canva, PowerPoint, Keynote, and Google Slides for easy adaptation.


5 diapositivas
Creative Problem Solving with Design Thinking Presentation
Bring your innovation process to life with the Creative Problem Solving with Design Thinking Presentation. This visual layout uses gear and bulb icons to highlight four essential stages in the design thinking approach. Perfect for brainstorming sessions, innovation pitches, and product development workshops. Easily editable in Canva, PowerPoint, Google Slides, and Keynote.


5 diapositivas
Myths & Facts About Cases Of Mass Hysteria Infographics
Delve into the intriguing world of collective human psychology with myths & facts about cases of mass hysteria infographics. Set against an engaging purple backdrop, these infographics are designed to captivate, educate, and debunk misconceptions surrounding mass hysteria events. Ideal for historians, educators, psychologists, and students. The creative use of vibrant colors and compelling icons help in breaking down complex psychological phenomena into understandable content, making it easier to spark discussion on this fascinating subject. Whether it's for academic purposes, or informational content, this template stands out by blending education with intriguing storytelling.

22 diapositivas
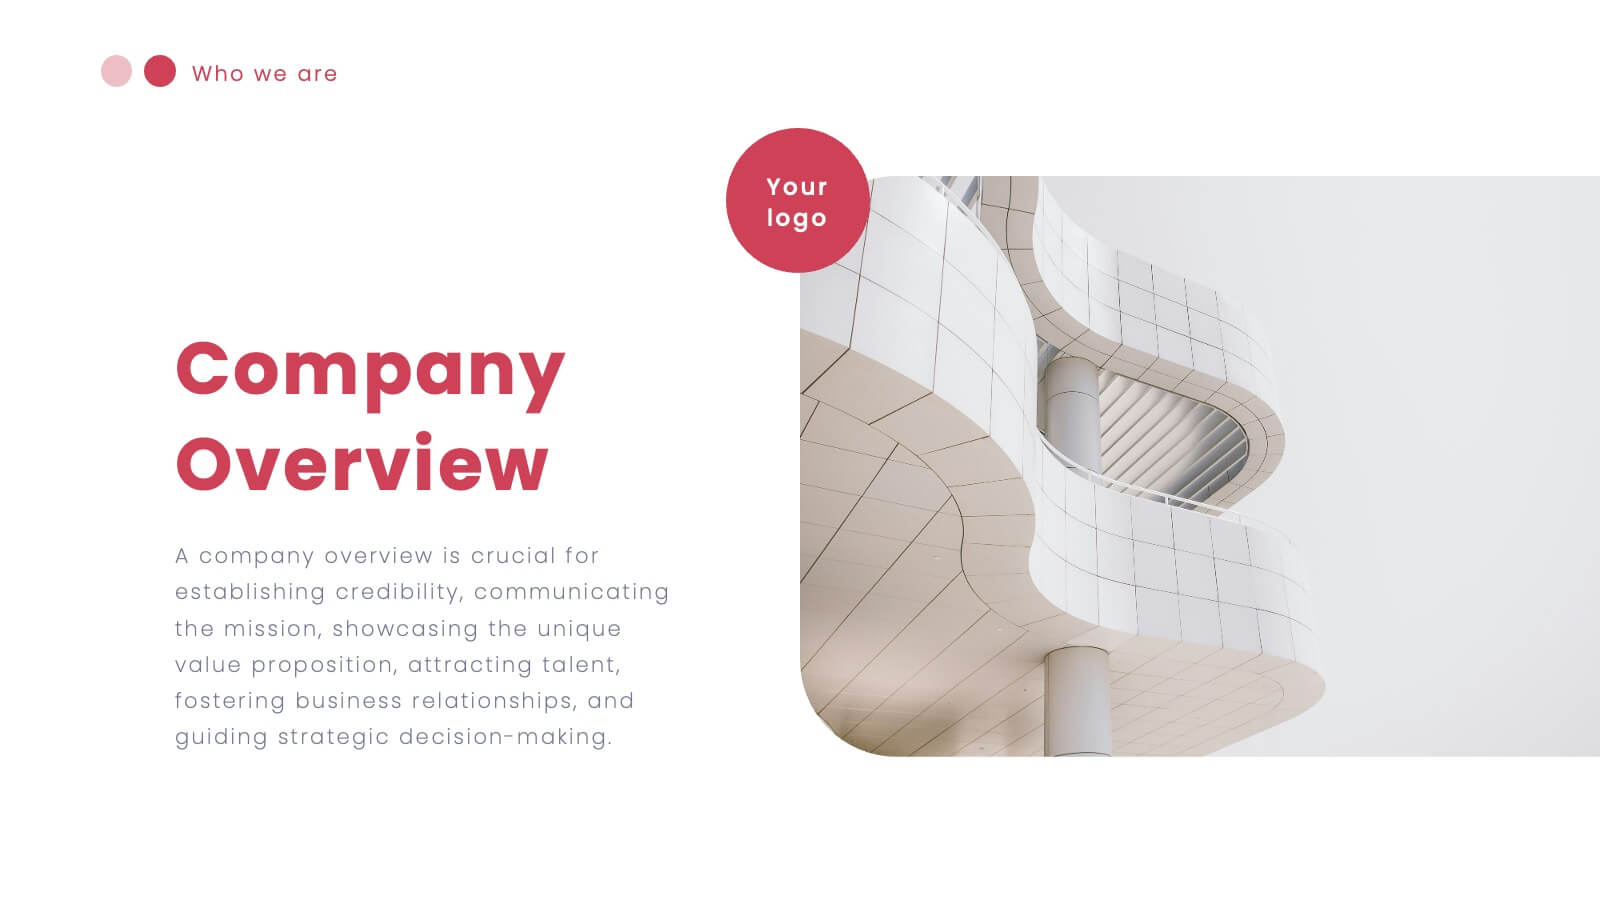
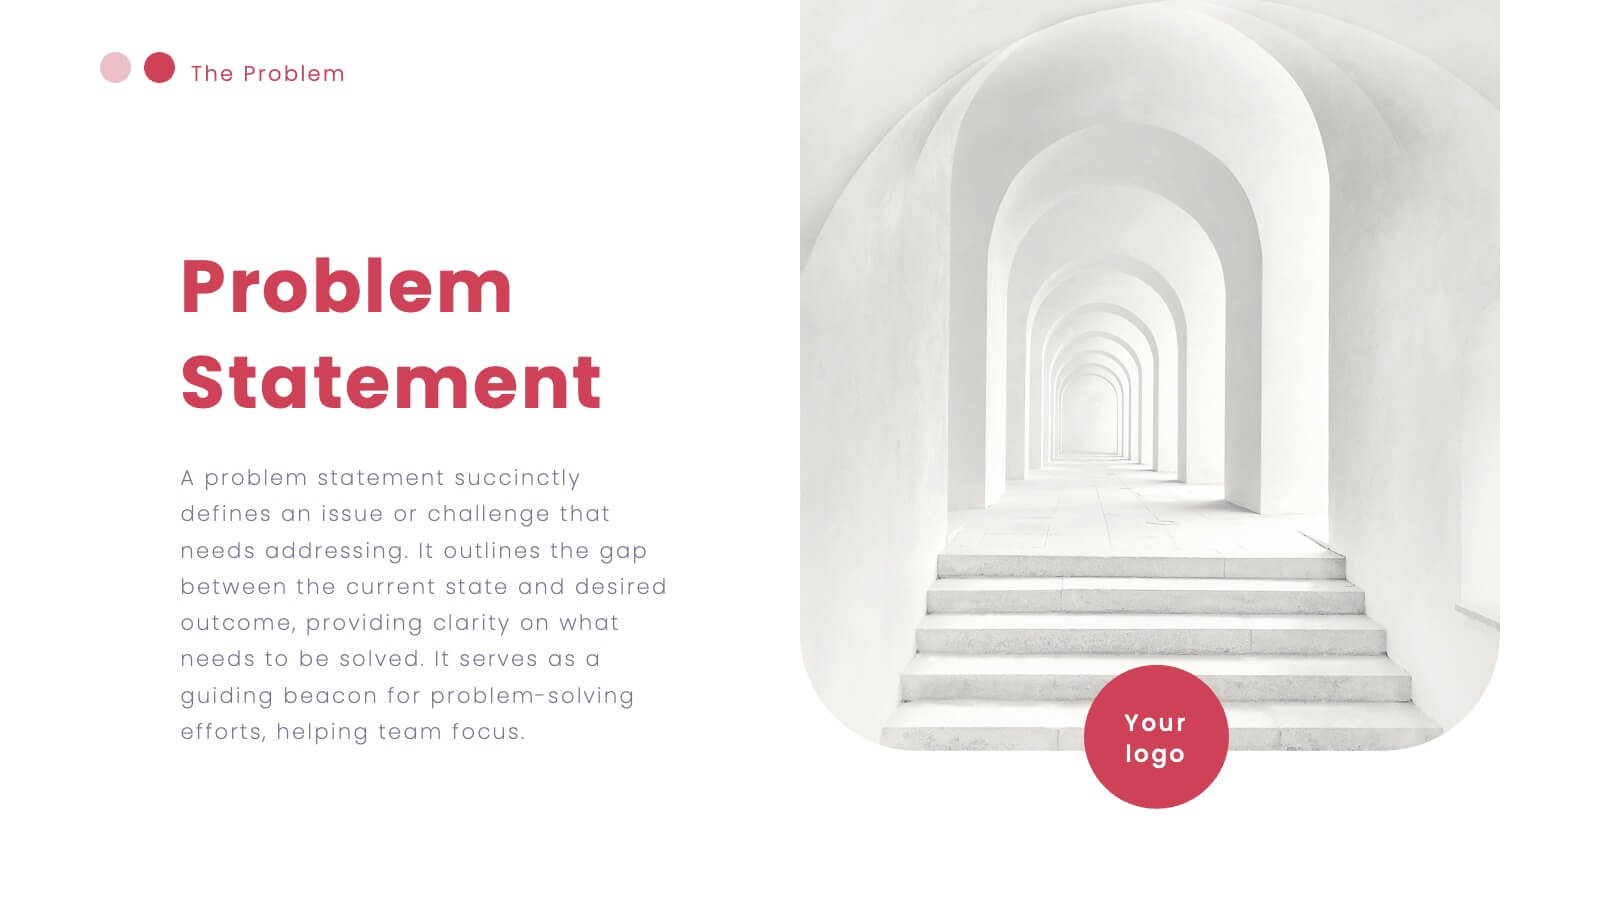
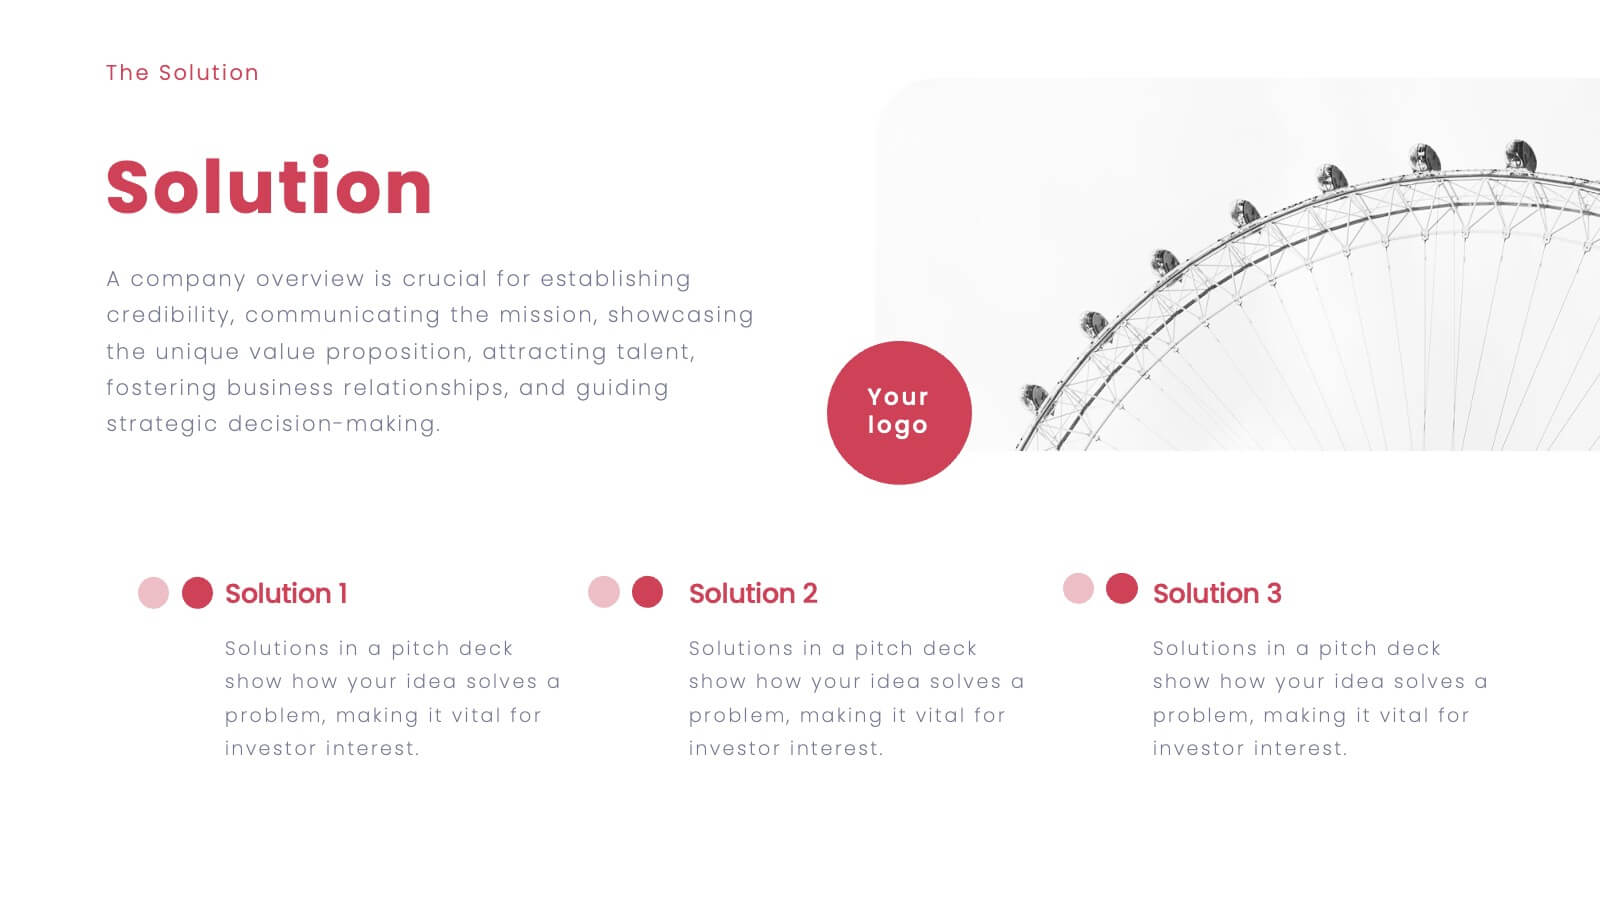
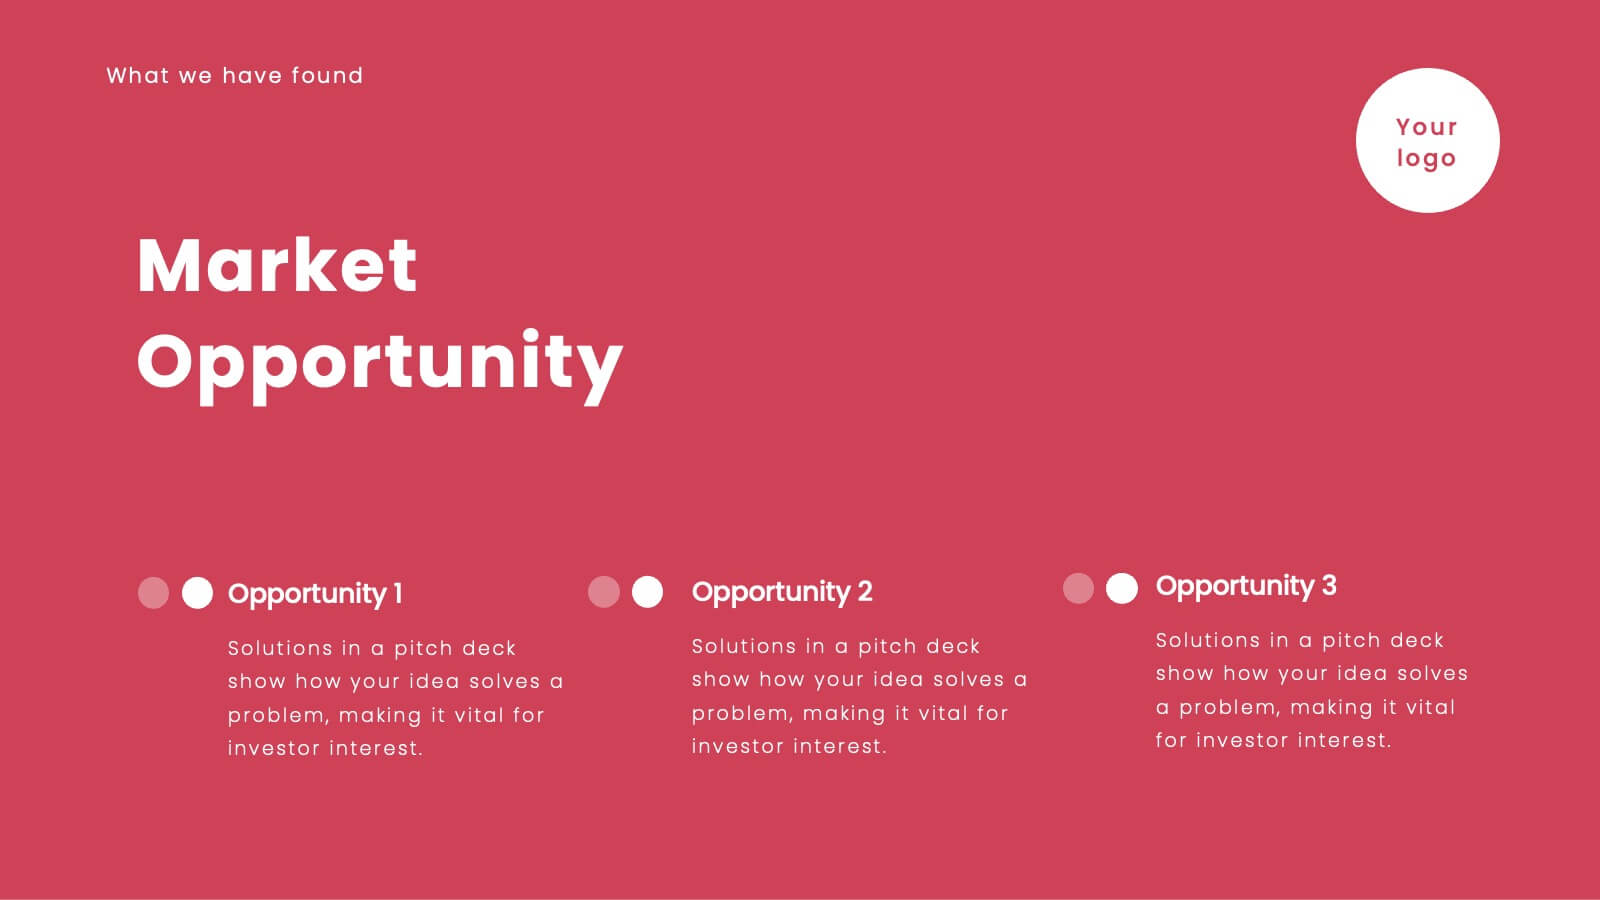
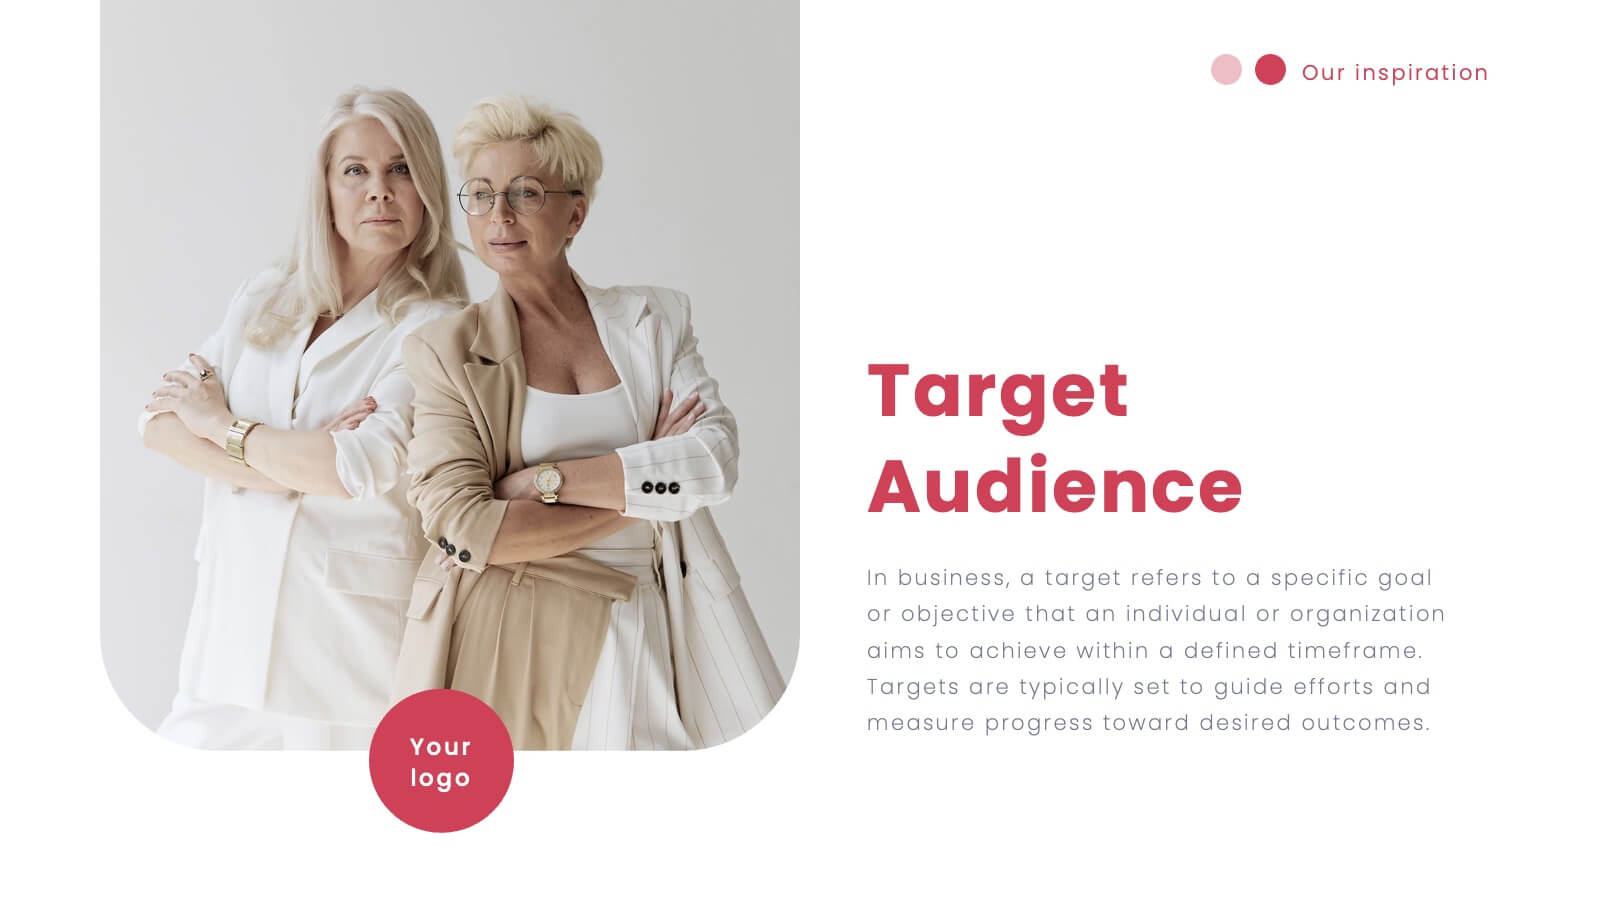
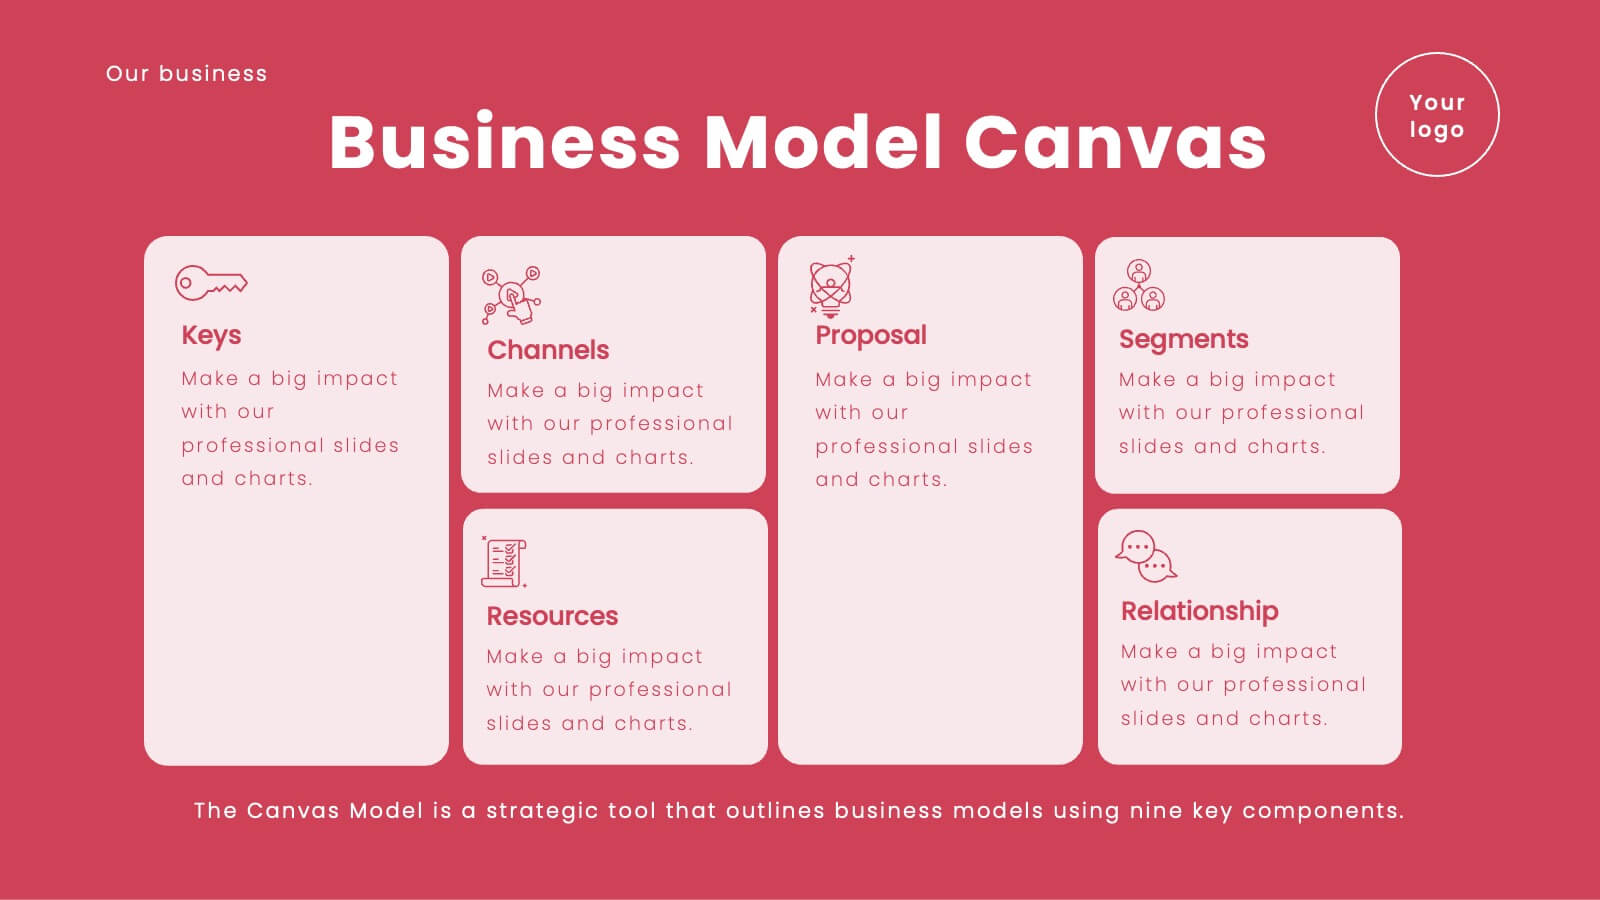
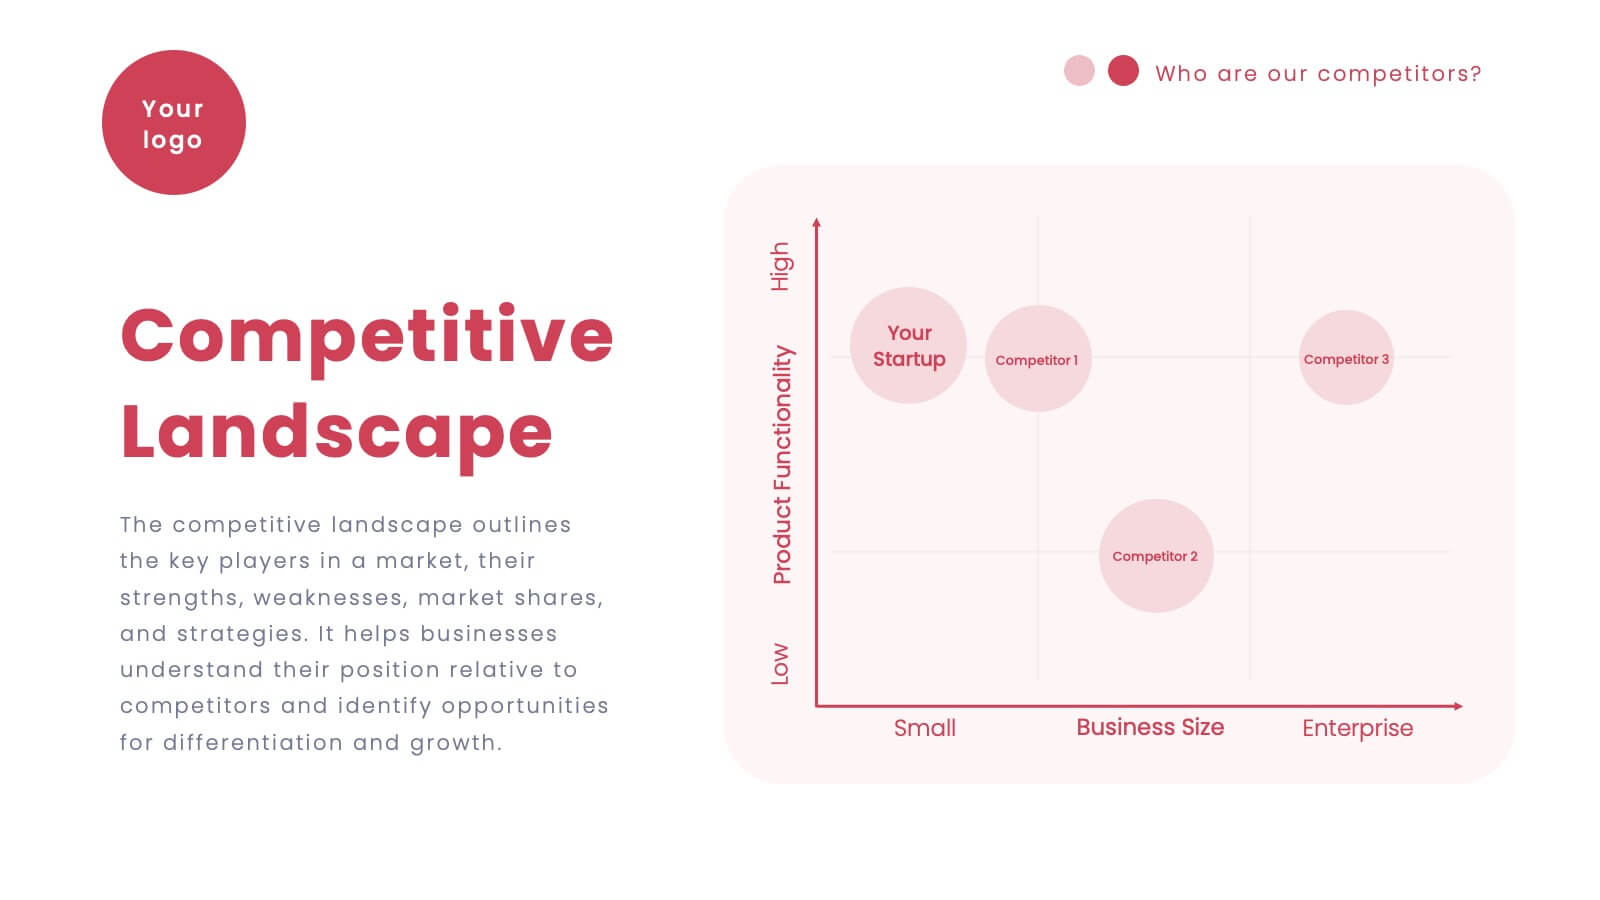
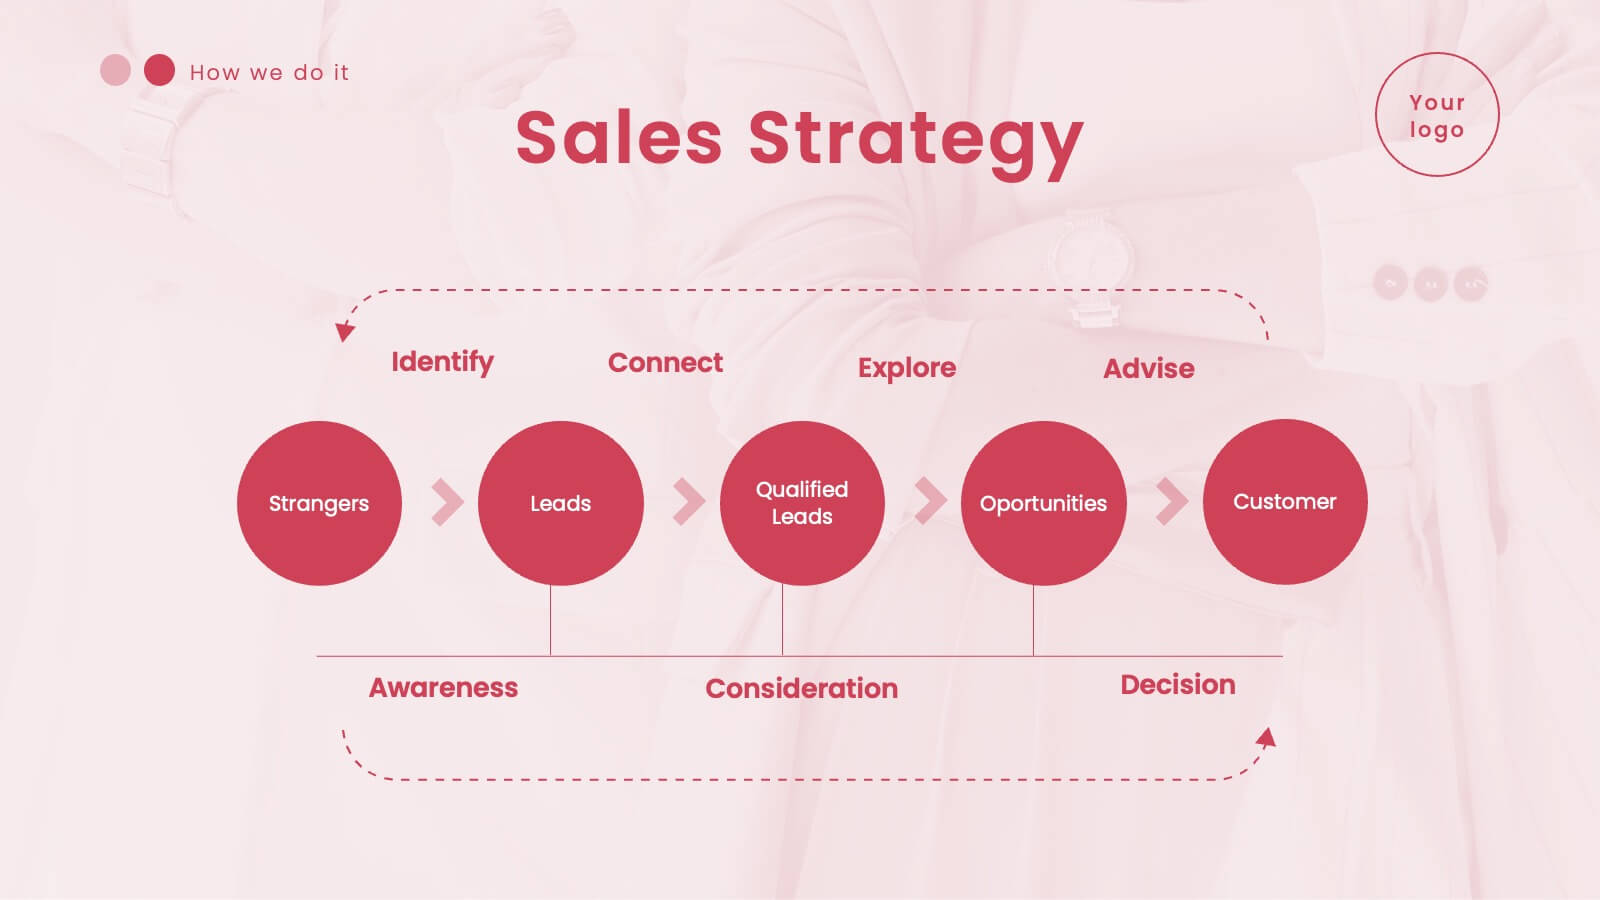
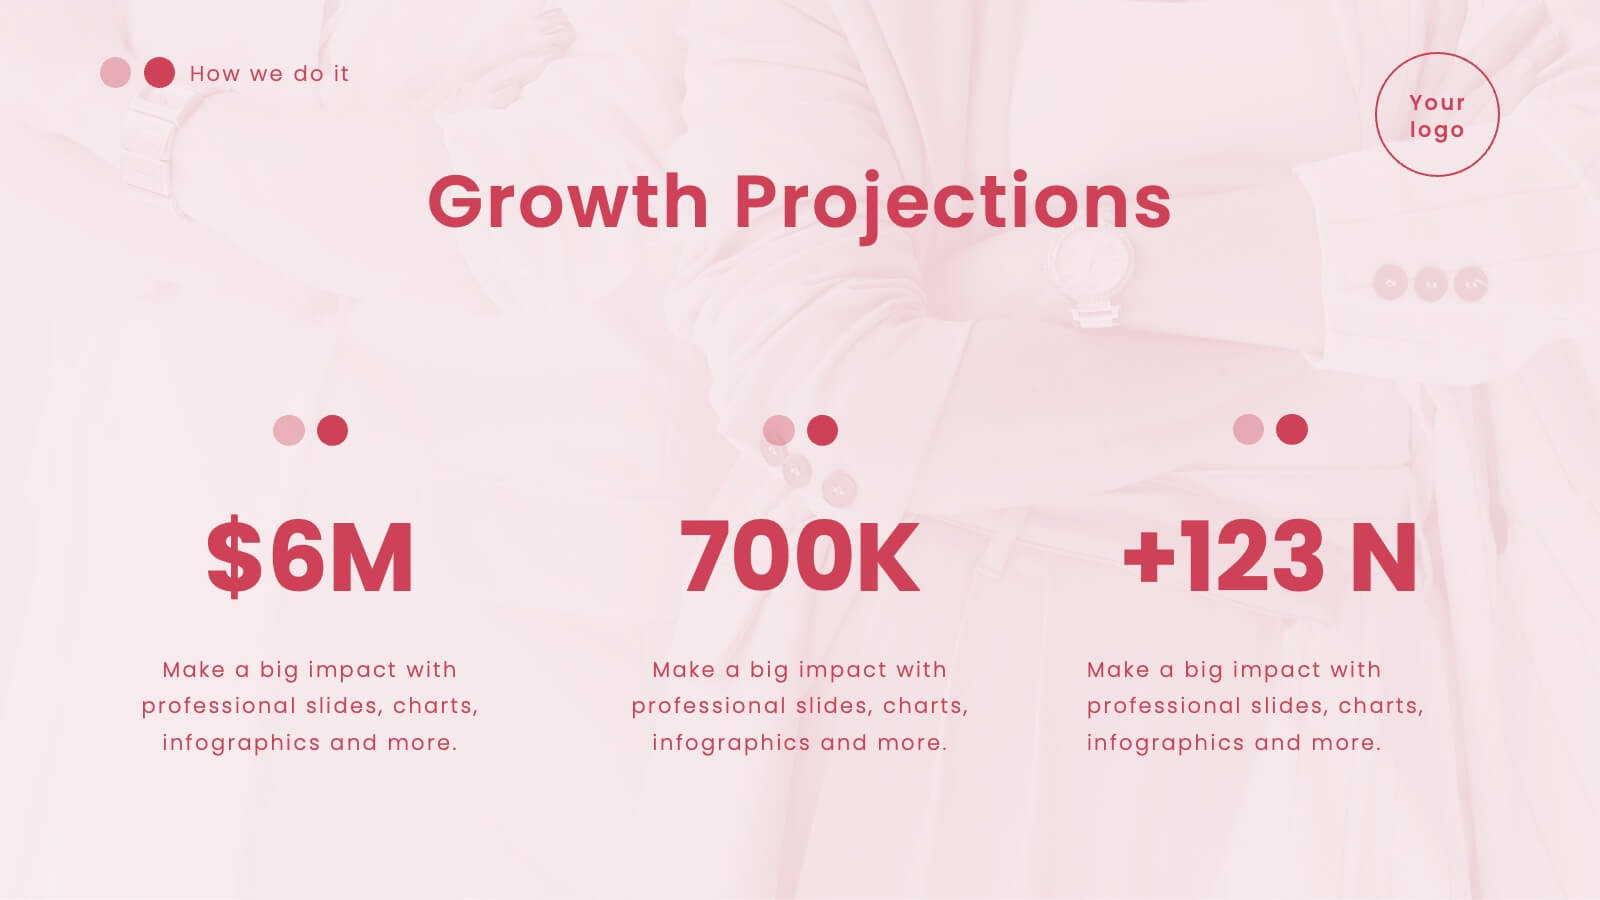
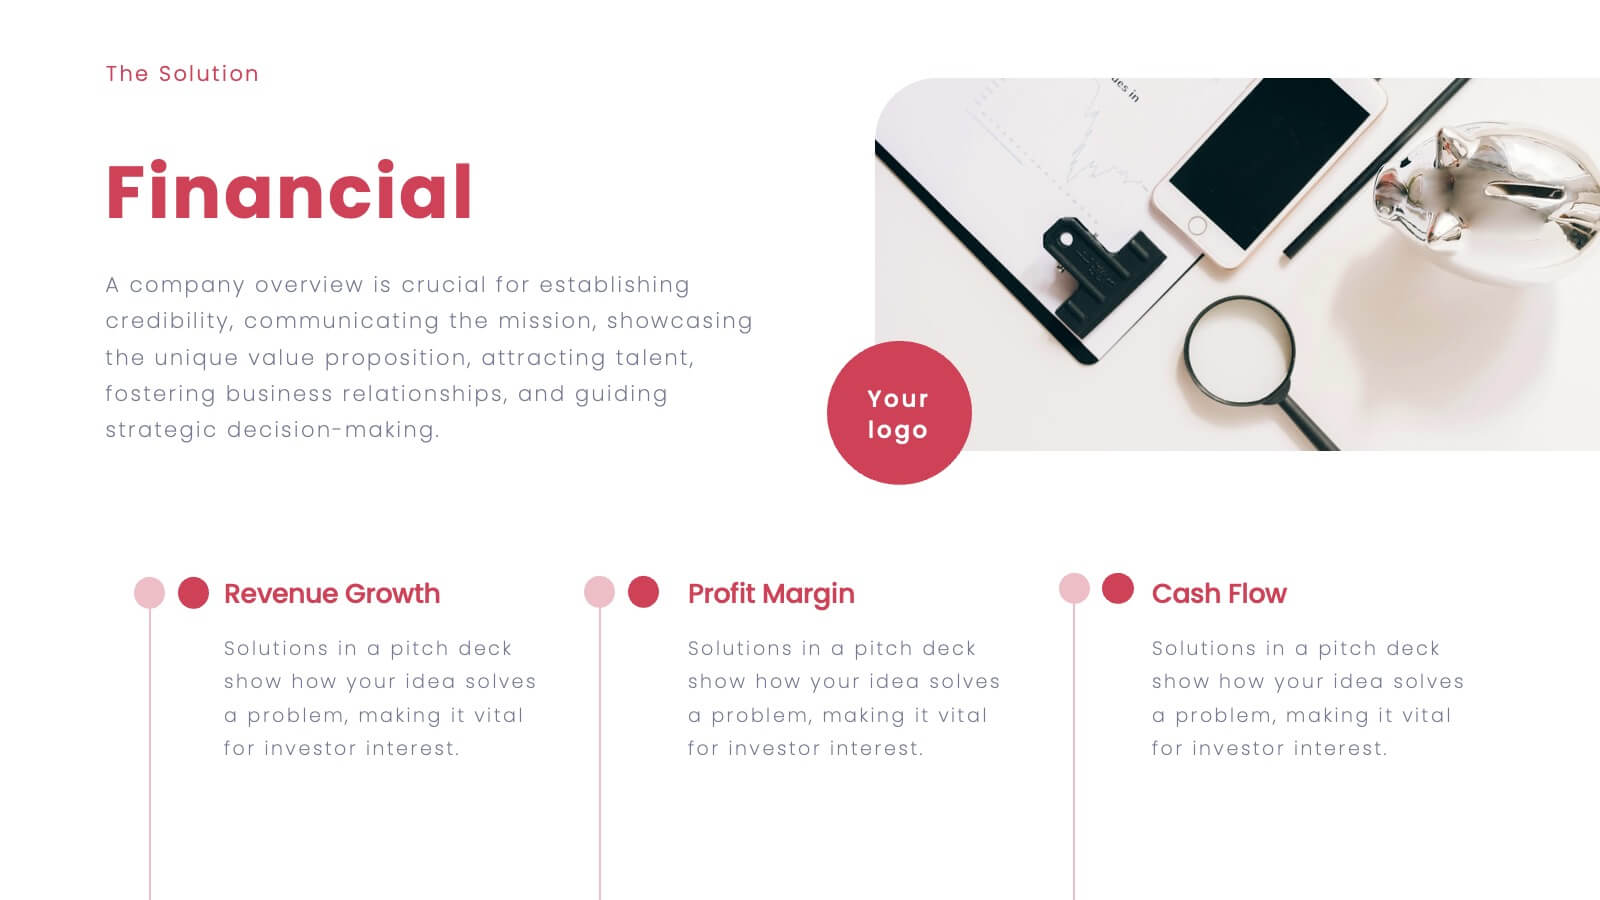
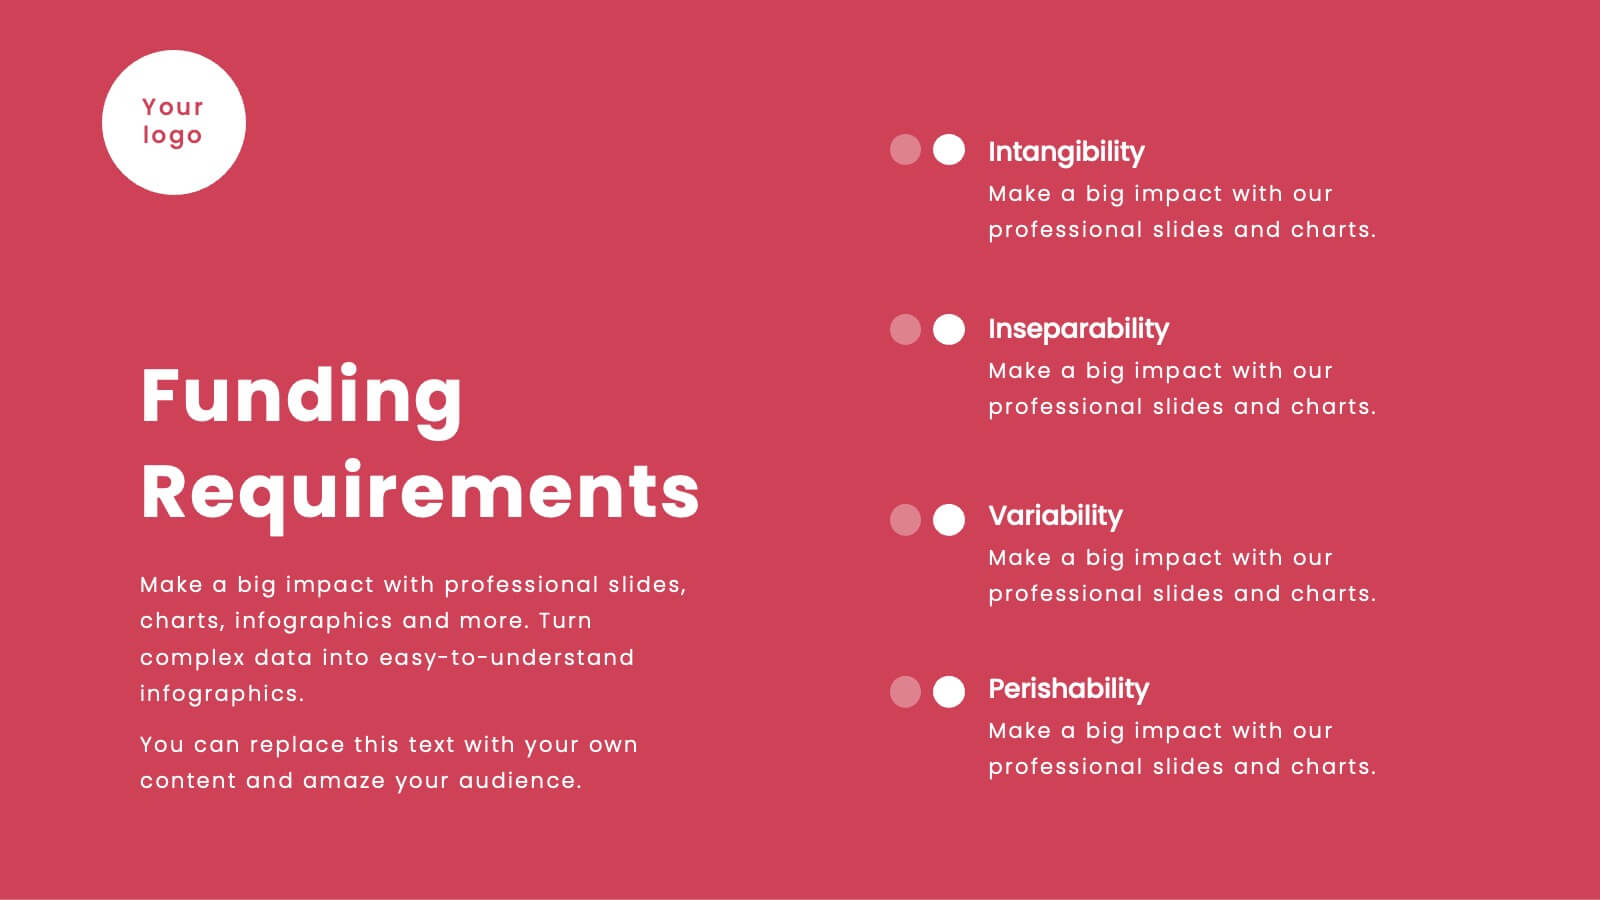
Vortex Startup Pitch Deck Presentation
Launch your ideas into action with this vibrant red pitch deck template, designed to captivate and inform potential investors. It covers everything from company overview to financials and market strategy, ensuring your vision is communicated effectively. Compatible with PowerPoint, Google Slides, and Keynote, this template is perfect for startups seeking to impress and engage.


5 diapositivas
Feedback Assessment with Smile Ratings Presentation
Visually capture user sentiment with this Feedback Assessment with Smile Ratings slide. Featuring a curved layout with emoticons ranging from happy to unhappy, it’s ideal for showcasing satisfaction levels, survey results, or evaluation stages. Fully customizable in Canva, PowerPoint, or Google Slides—perfect for reports, workshops, or performance reviews.


7 diapositivas
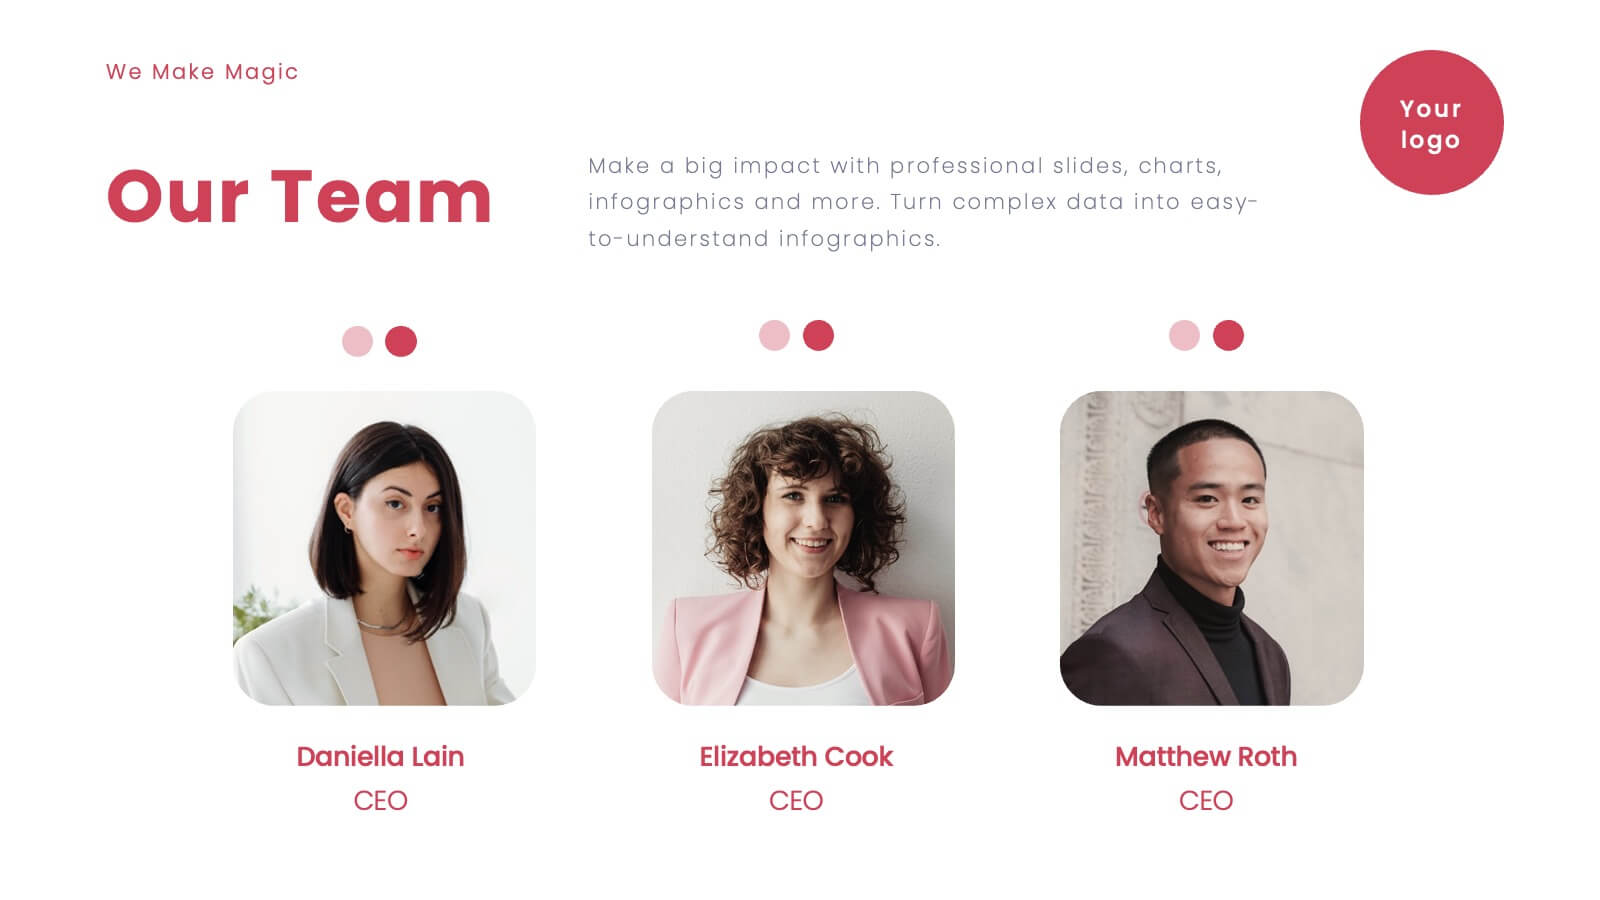
Team Member Overview Slide Presentation
Bring your team’s story to life with a clean, engaging layout that makes every role instantly clear. This presentation helps you introduce key members, outline responsibilities, and highlight individual strengths in a simple, structured way that’s easy for any audience to follow. Fully compatible with PowerPoint, Keynote, and Google Slides.


21 diapositivas
Sable Design Portfolio Presentation
Elevate your creative portfolio with the Sable Design Portfolio Presentation template! This stylish and professional template is perfect for showcasing your design projects, whether you’re a graphic designer, UI/UX expert, or creative professional. Start with a captivating introduction, and lead your audience through a journey of your design process, from concept development to final execution. Highlight your unique approach with dedicated slides for your color palette, typography choices, and moodboards. The template also includes sections for prototyping, feedback, and iterations, ensuring your design evolution is clearly communicated. The clean and modern layout not only keeps your presentation visually appealing but also makes your work the star of the show. Customizable and easy to use, this template is compatible with PowerPoint, Keynote, and Google Slides, allowing you to impress your clients, employers, or peers with a polished and cohesive presentation of your best work.


21 diapositivas
Astromeda Product Launch Presentation
This Product Launch Presentation template offers a clean and modern design to showcase your product effectively. It covers key areas such as market analysis, competitive landscape, pricing strategy, and sales approach. Fully customizable and compatible with PowerPoint, Keynote, and Google Slides, it's perfect for startups and businesses launching new products.


5 diapositivas
Customer Relationship Strategy Presentation
Refine your approach to customer interactions with the "Customer Relationship Strategy" presentation templates. Perfect for delineating clear, actionable strategies to enhance client engagement and satisfaction, these templates are a must-have for businesses focused on building lasting customer relationships. Compatible with PowerPoint, Keynote, and Google Slides, they provide the tools to effectively communicate your customer relationship policies and goals.


3 diapositivas
Workflow Improvement and Progress Chart Presentation
Folders aren't just for files—they’re perfect for ideas too. This visual chart maps out streamlined processes, making it easier to track progress and improve internal workflow. Great for managers and teams, this infographic presentation template is fully compatible with PowerPoint, Keynote, and Google Slides for effortless editing and sharing.