


Características


¿Tienes alguna pregunta?
Recomendar


22 diapositivas
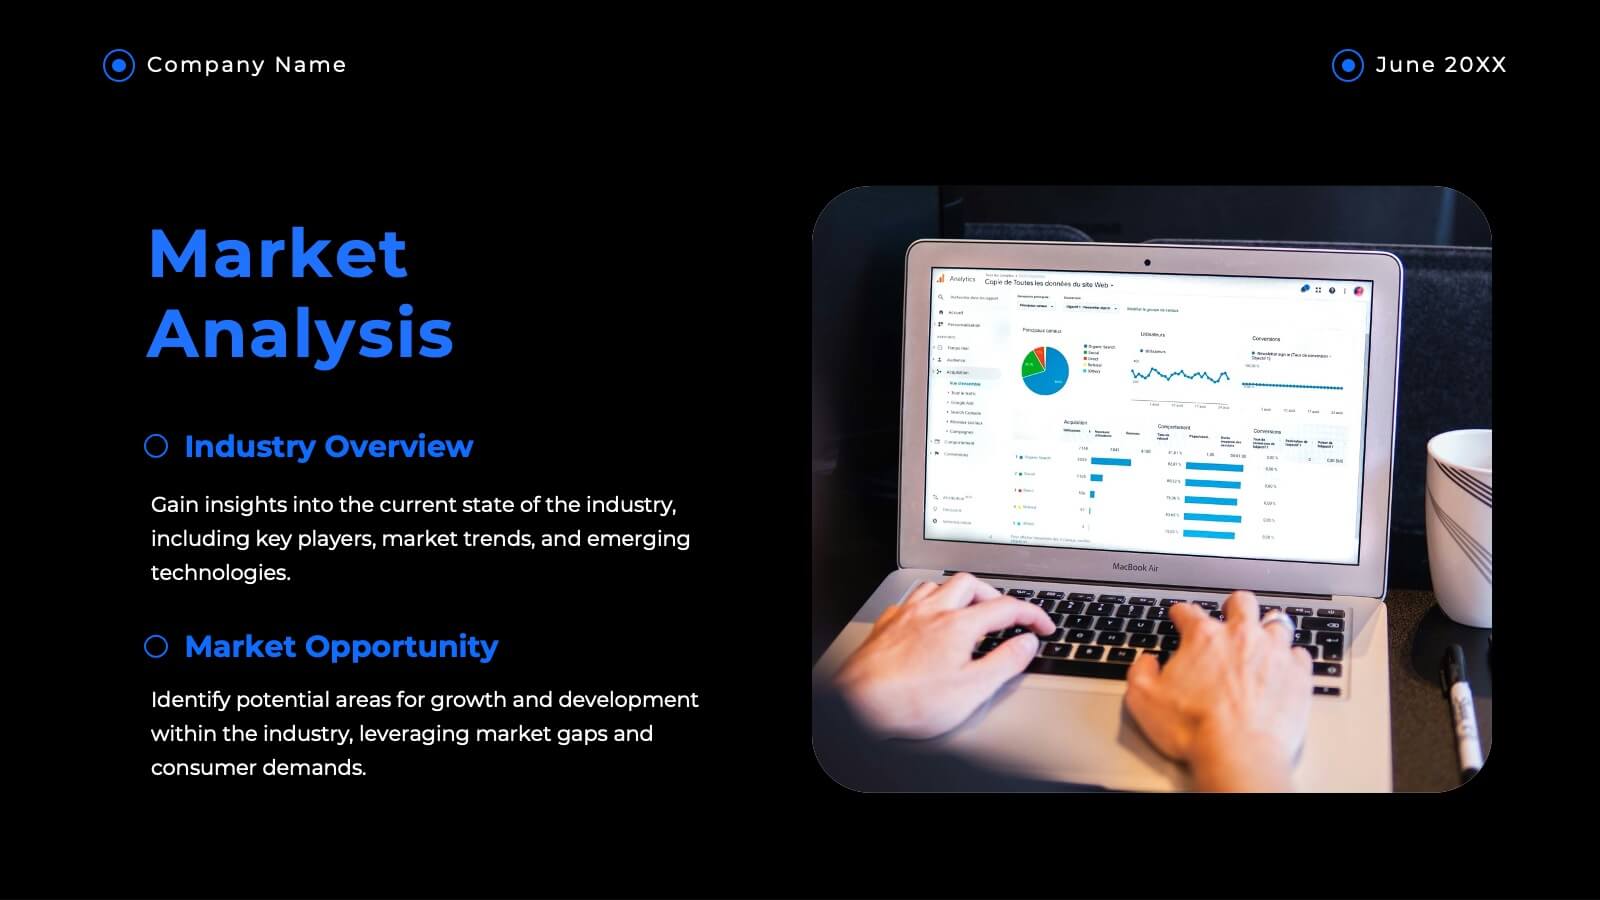
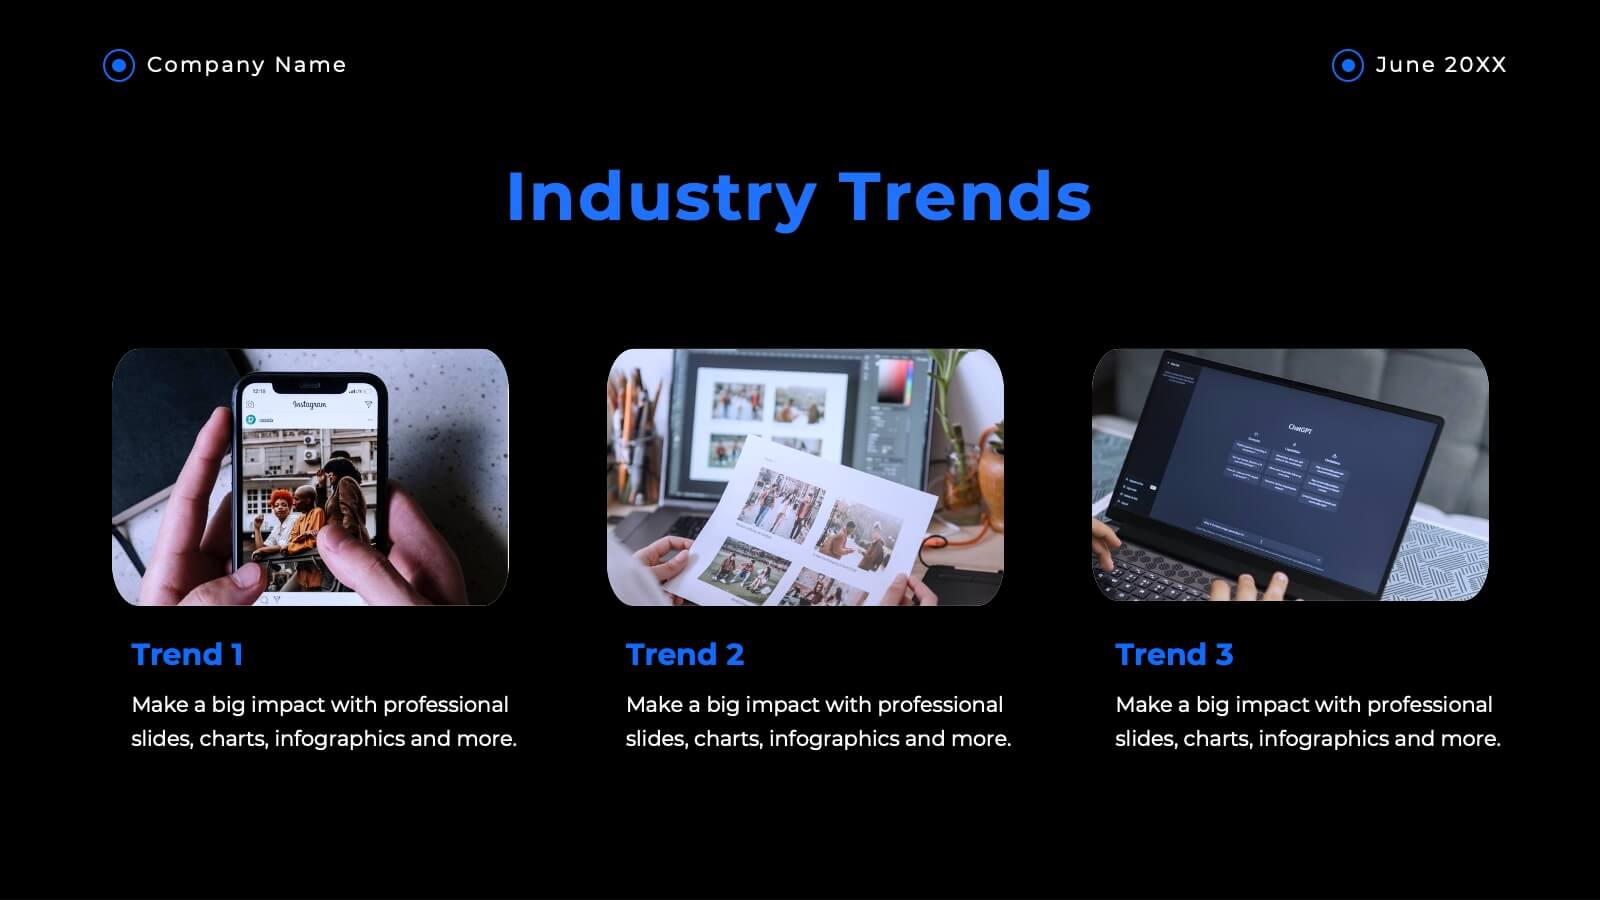
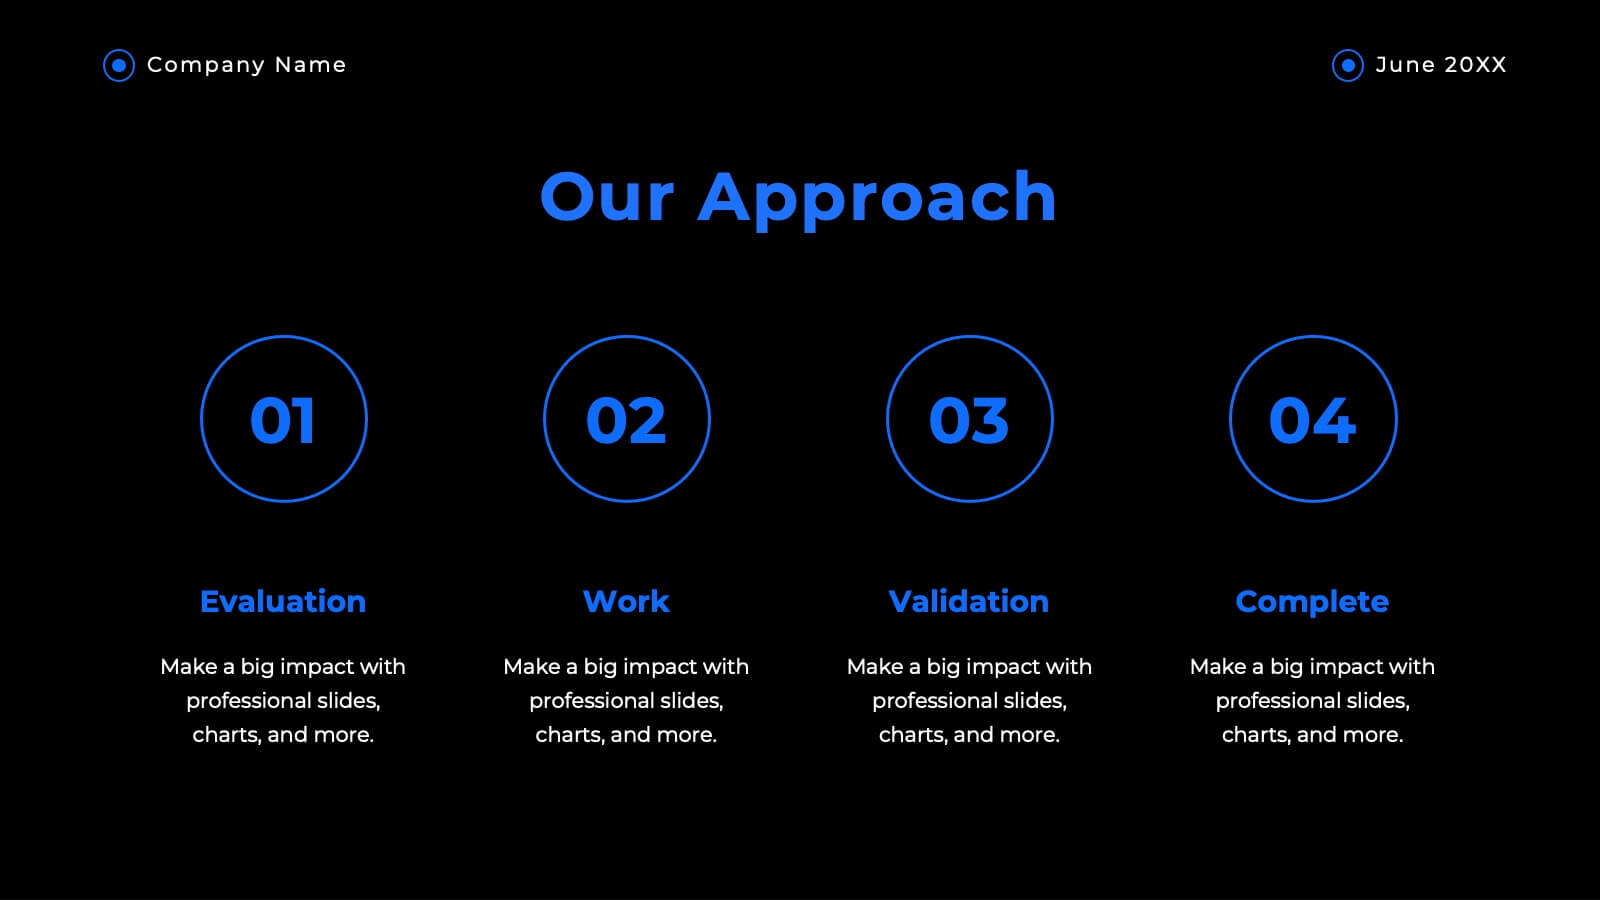
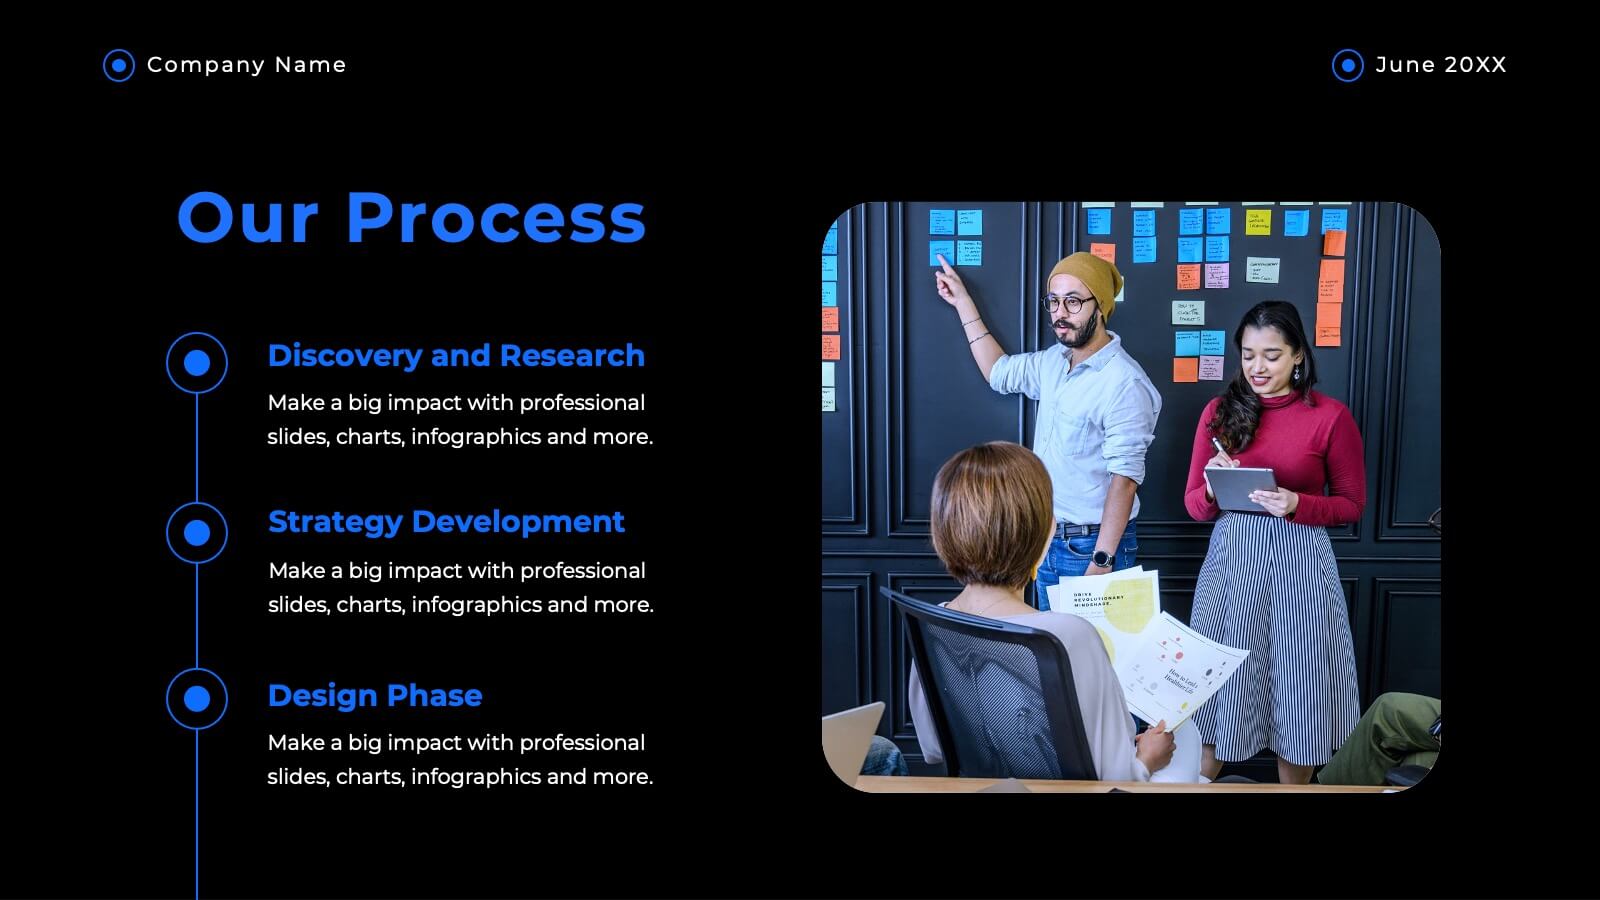
Lucidia Market Research Presentation
Deliver insightful market research findings with this modern and structured template. It covers key areas such as data analysis, consumer insights, research methodologies, and future directions. Ideal for presenting to stakeholders or clients. Fully customizable for PowerPoint, Keynote, and Google Slides.


27 diapositivas
Drift Rebranding Project Plan Presentation
Transform your brand with this comprehensive rebranding project template! Perfect for presenting brand identity, market analysis, and strategic positioning, it includes slides for logos, color palettes, and brand guidelines. Engage your audience with visually striking designs and detailed content. Compatible with PowerPoint, Keynote, and Google Slides for easy, professional presentations on any platform.


20 diapositivas
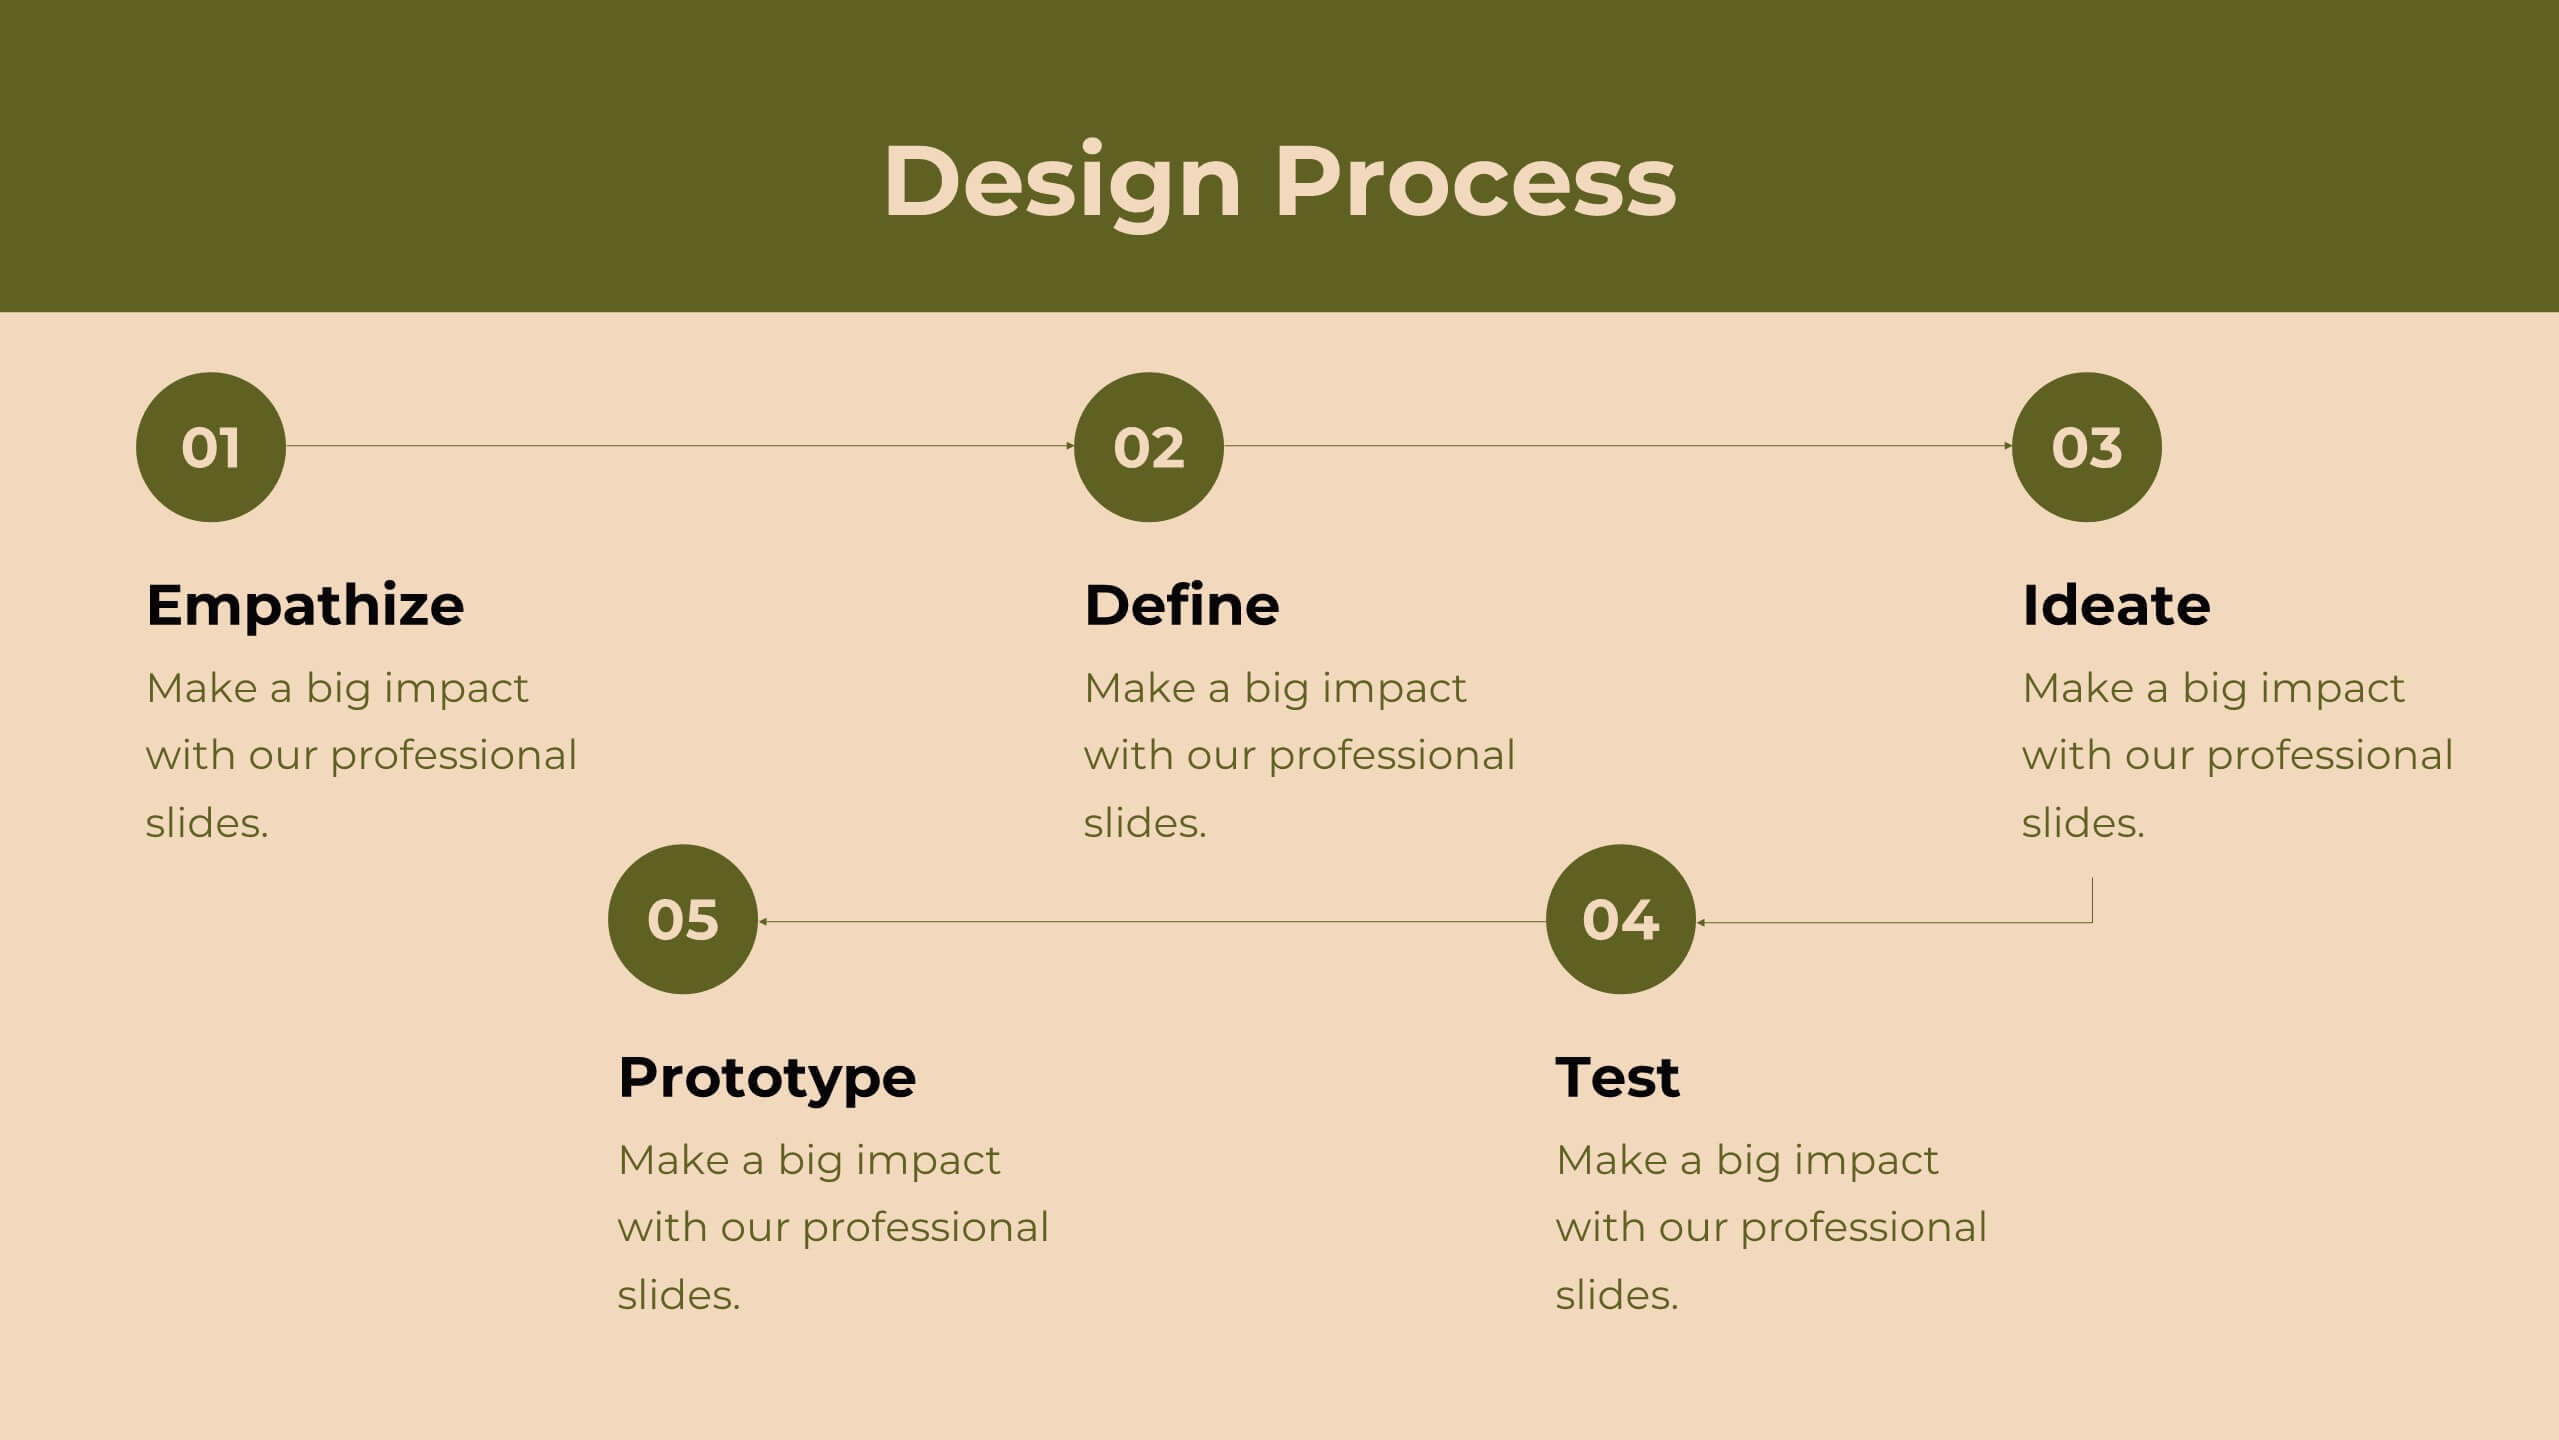
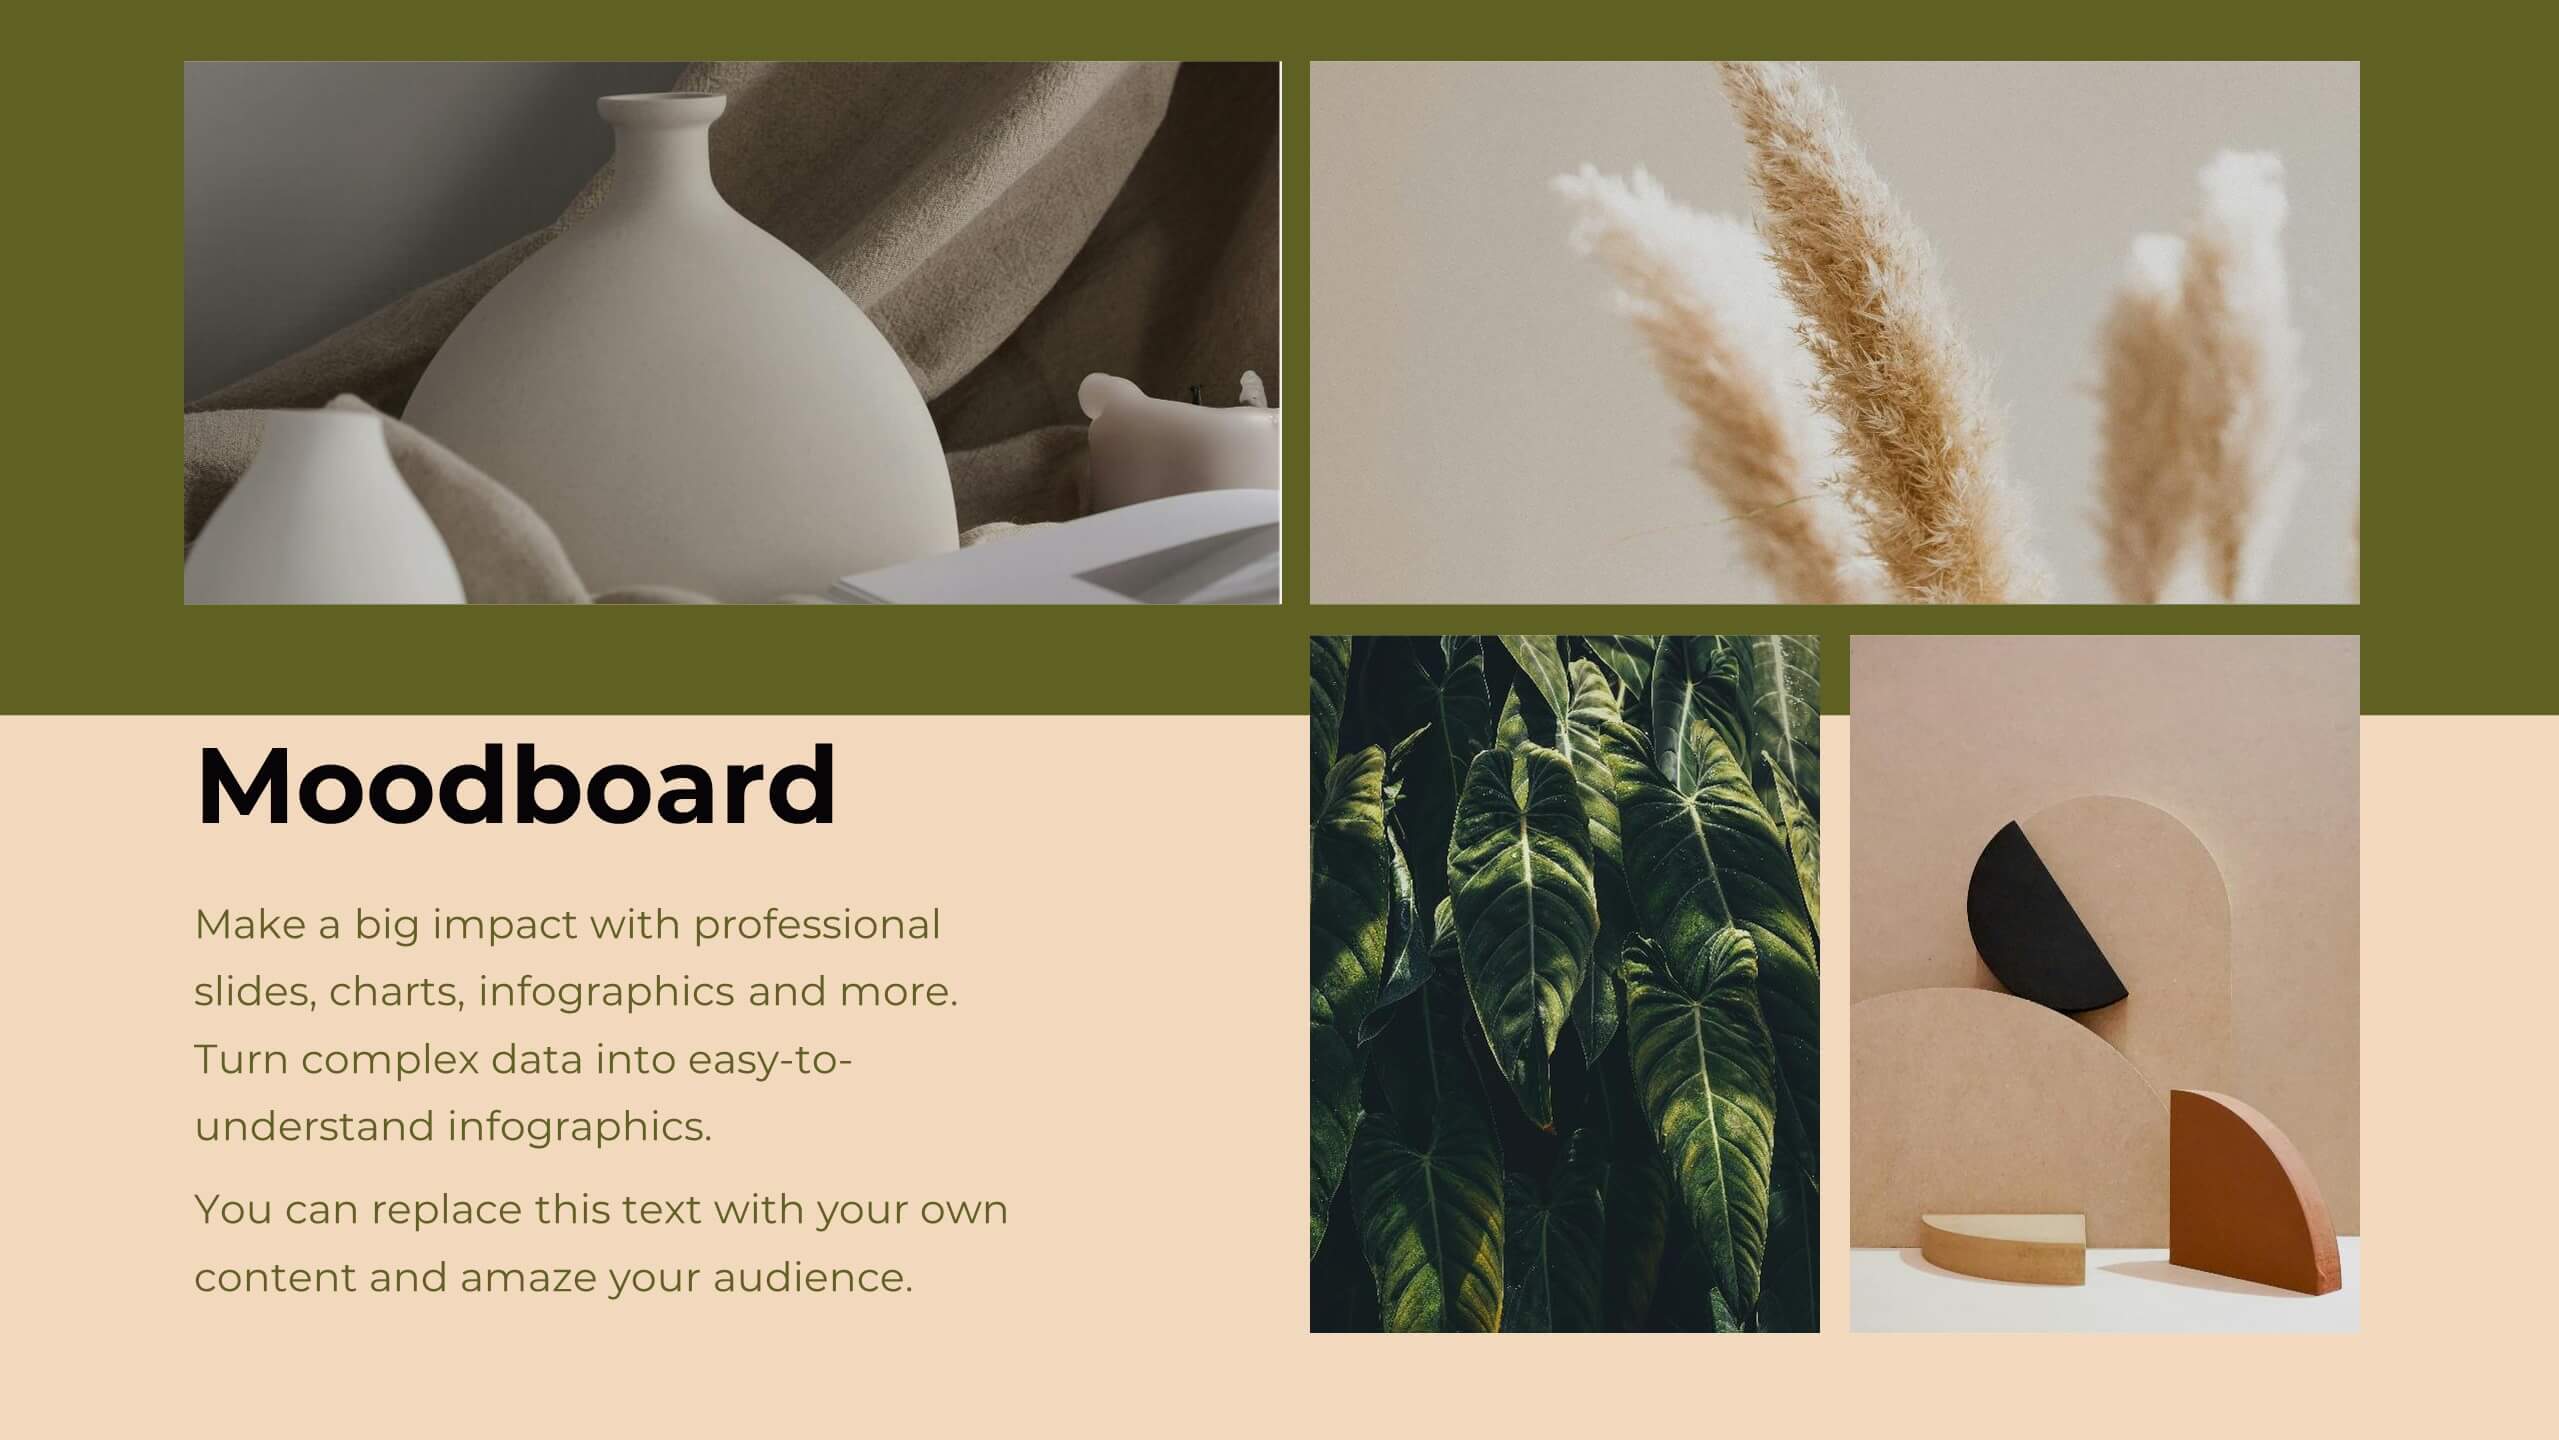
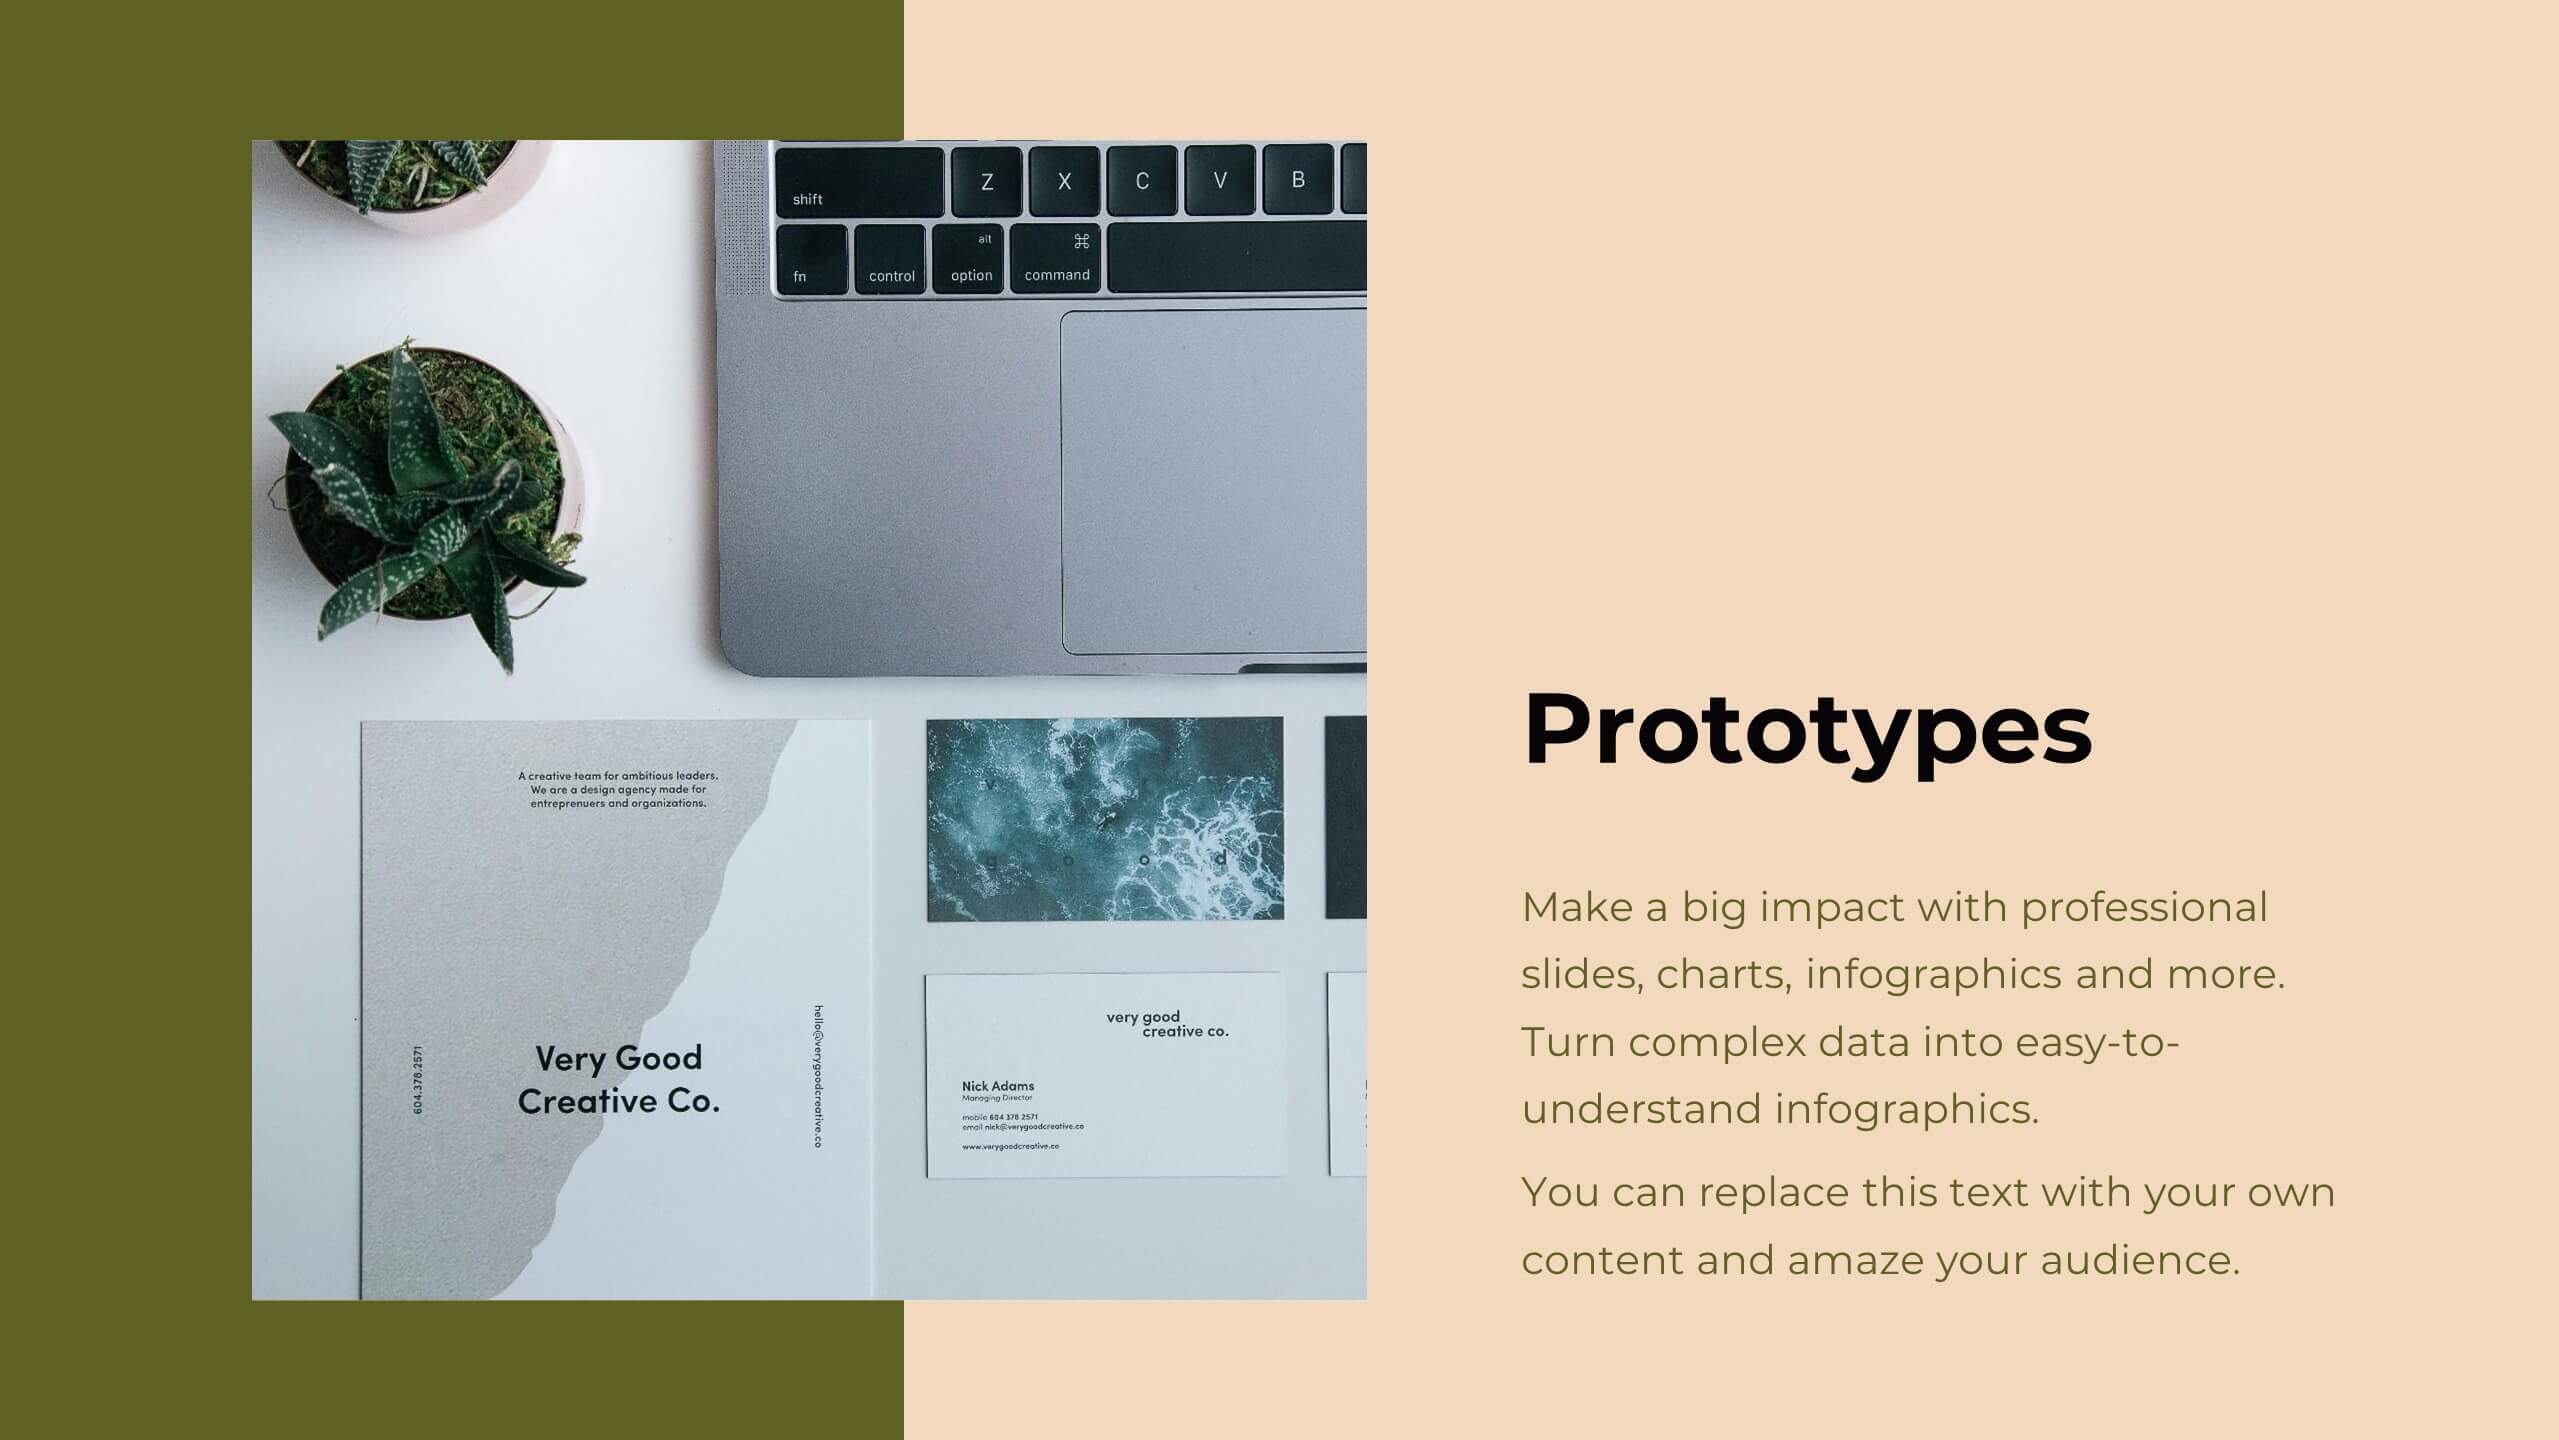
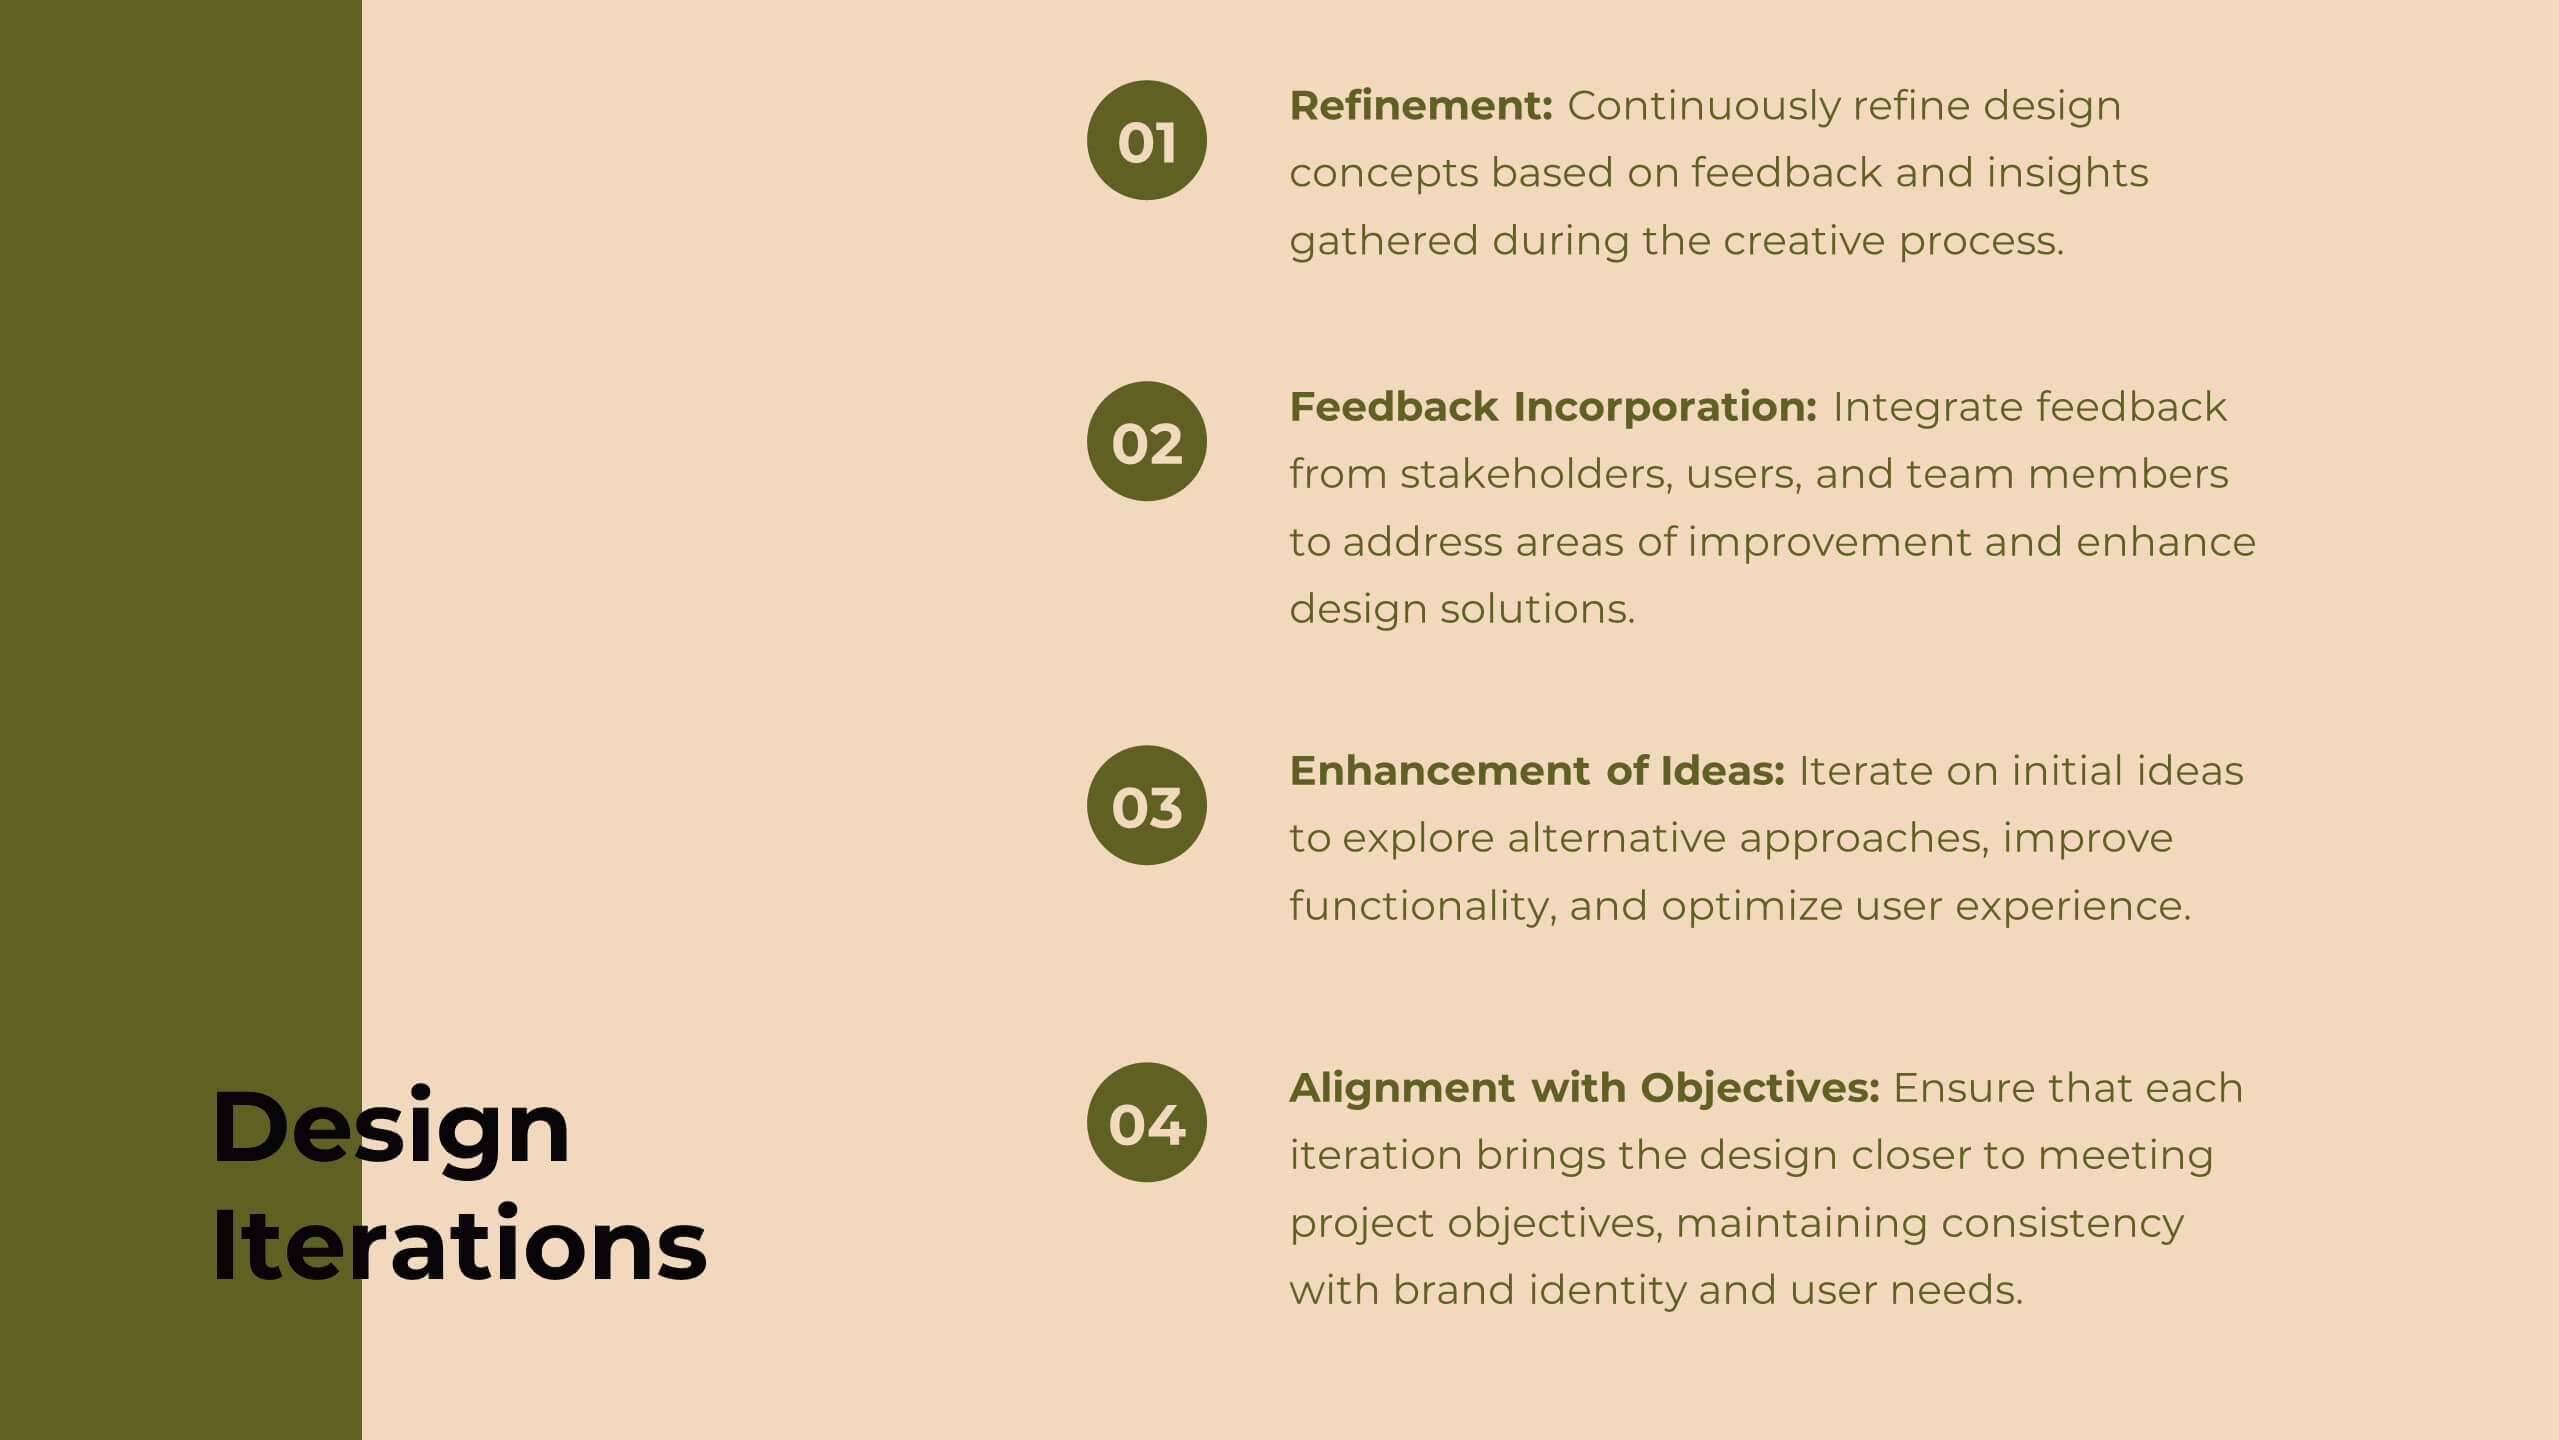
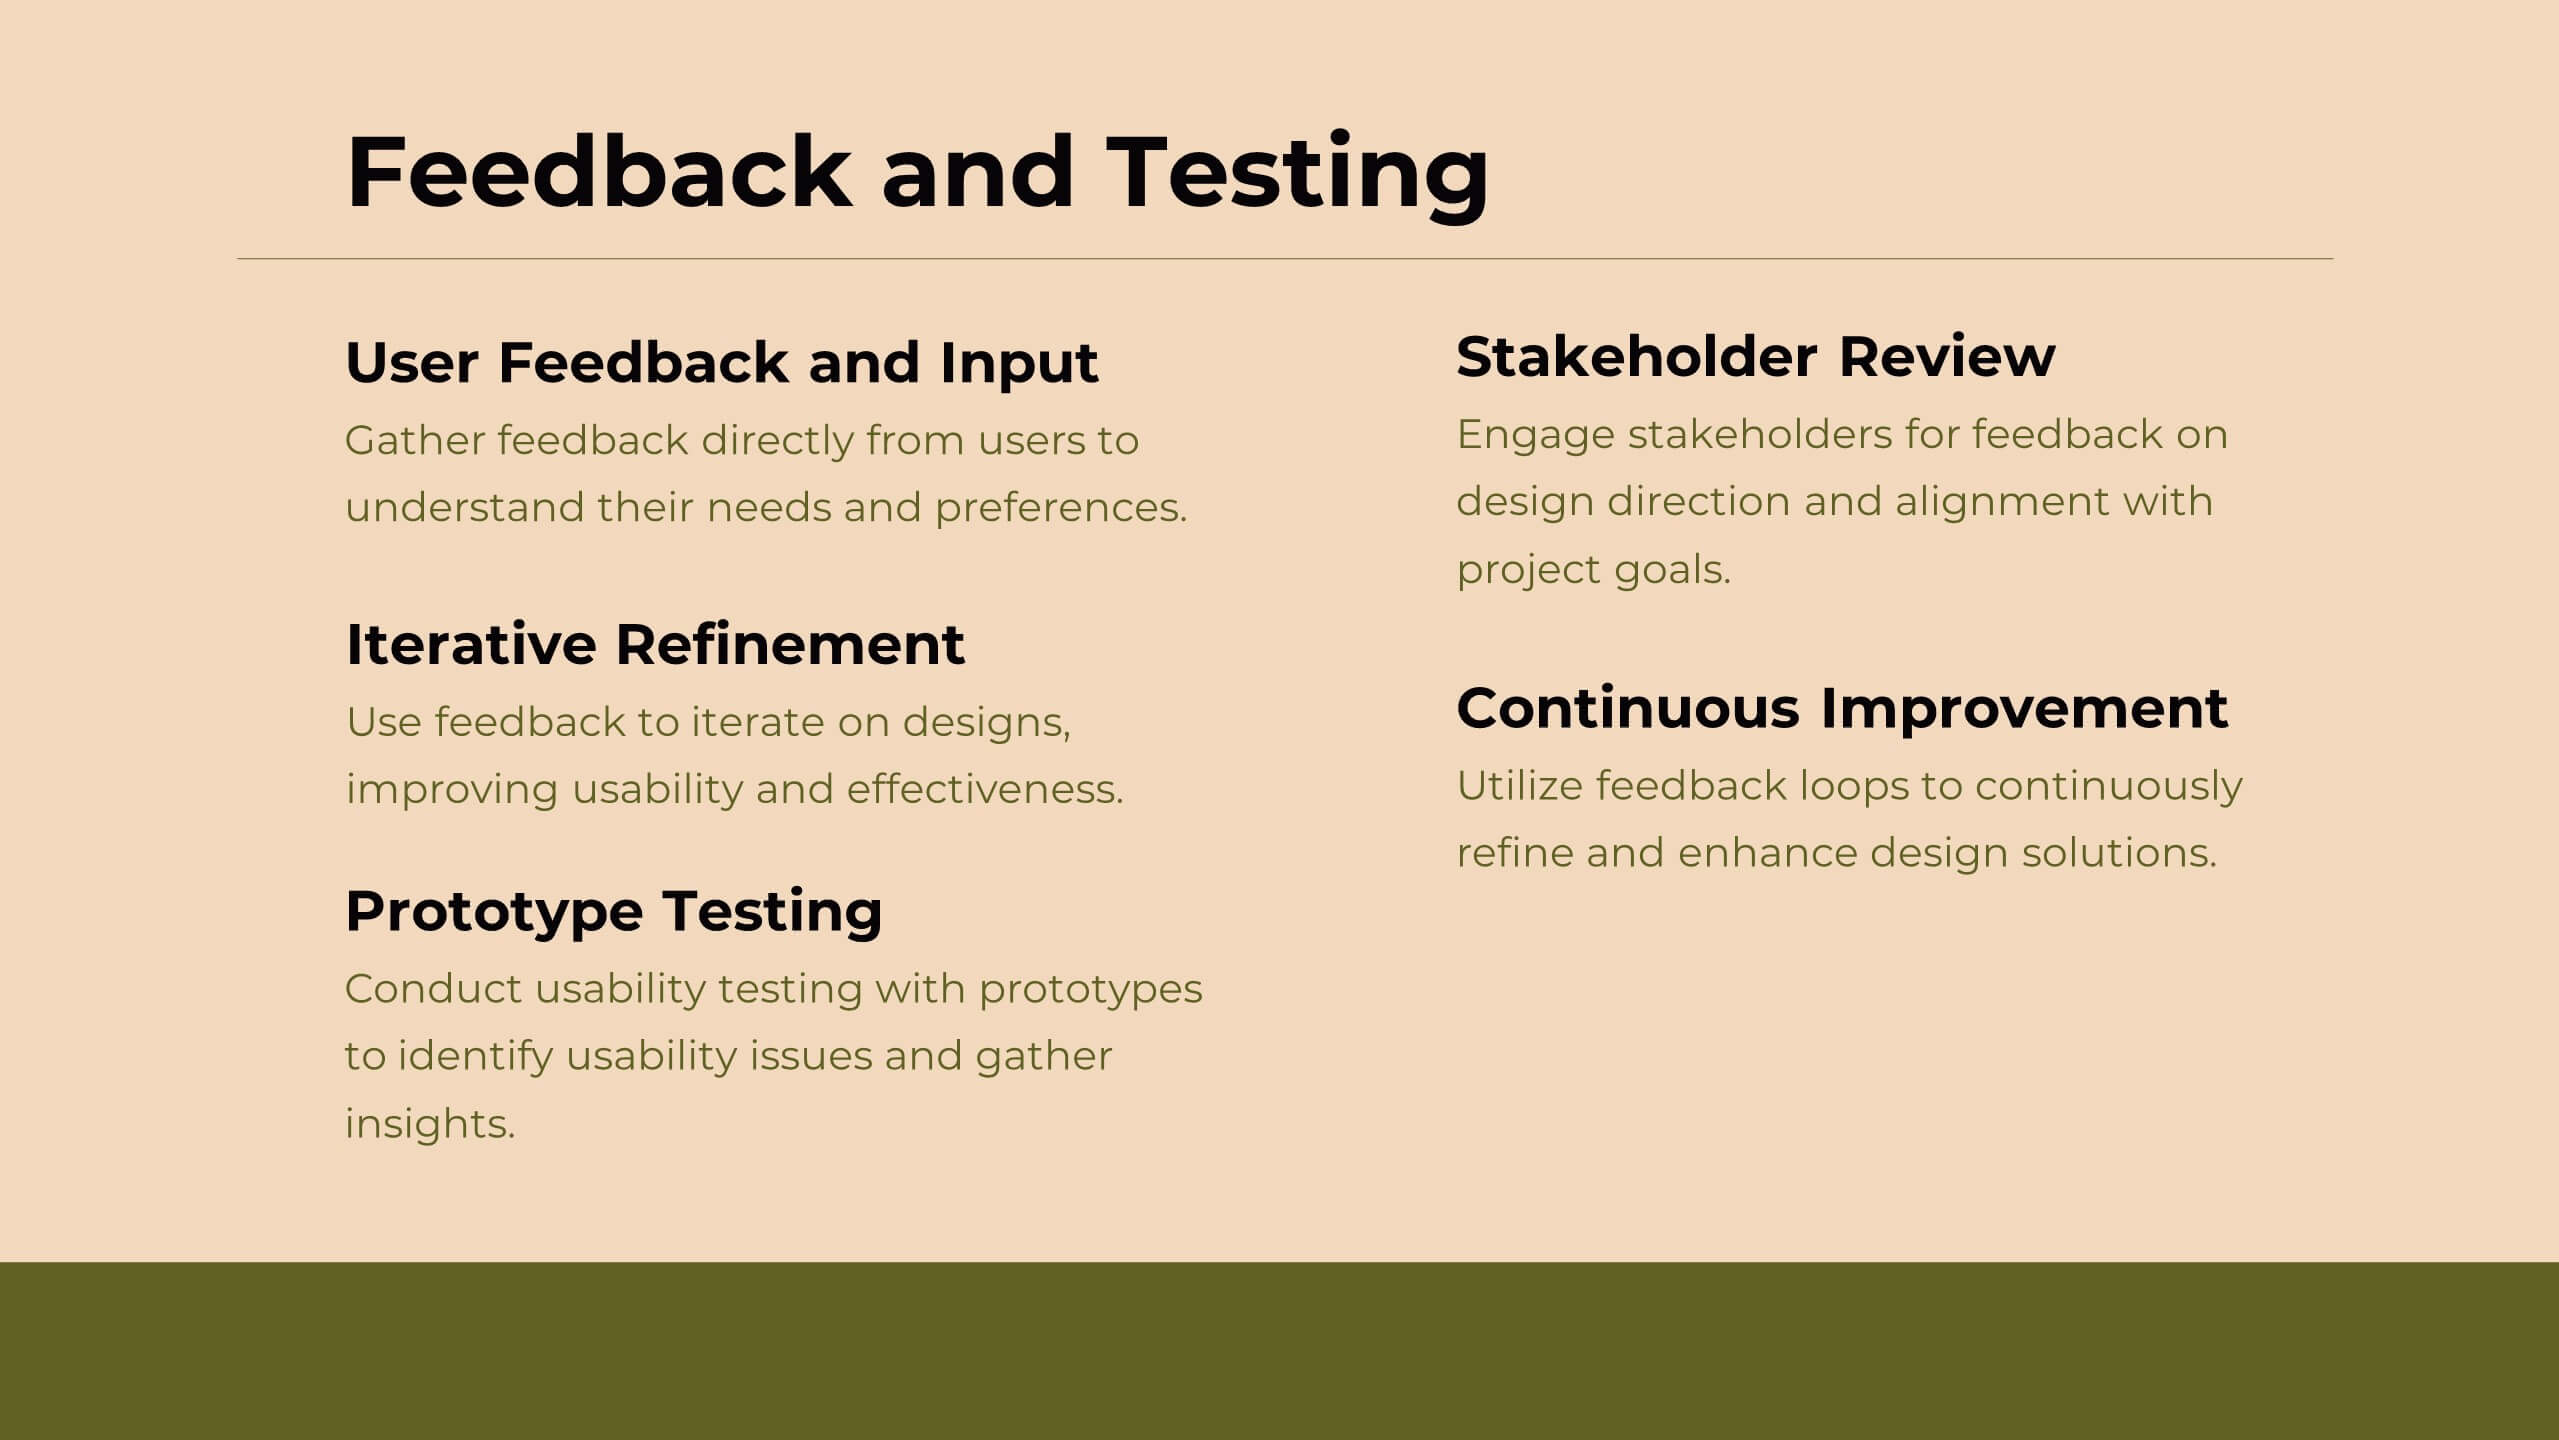
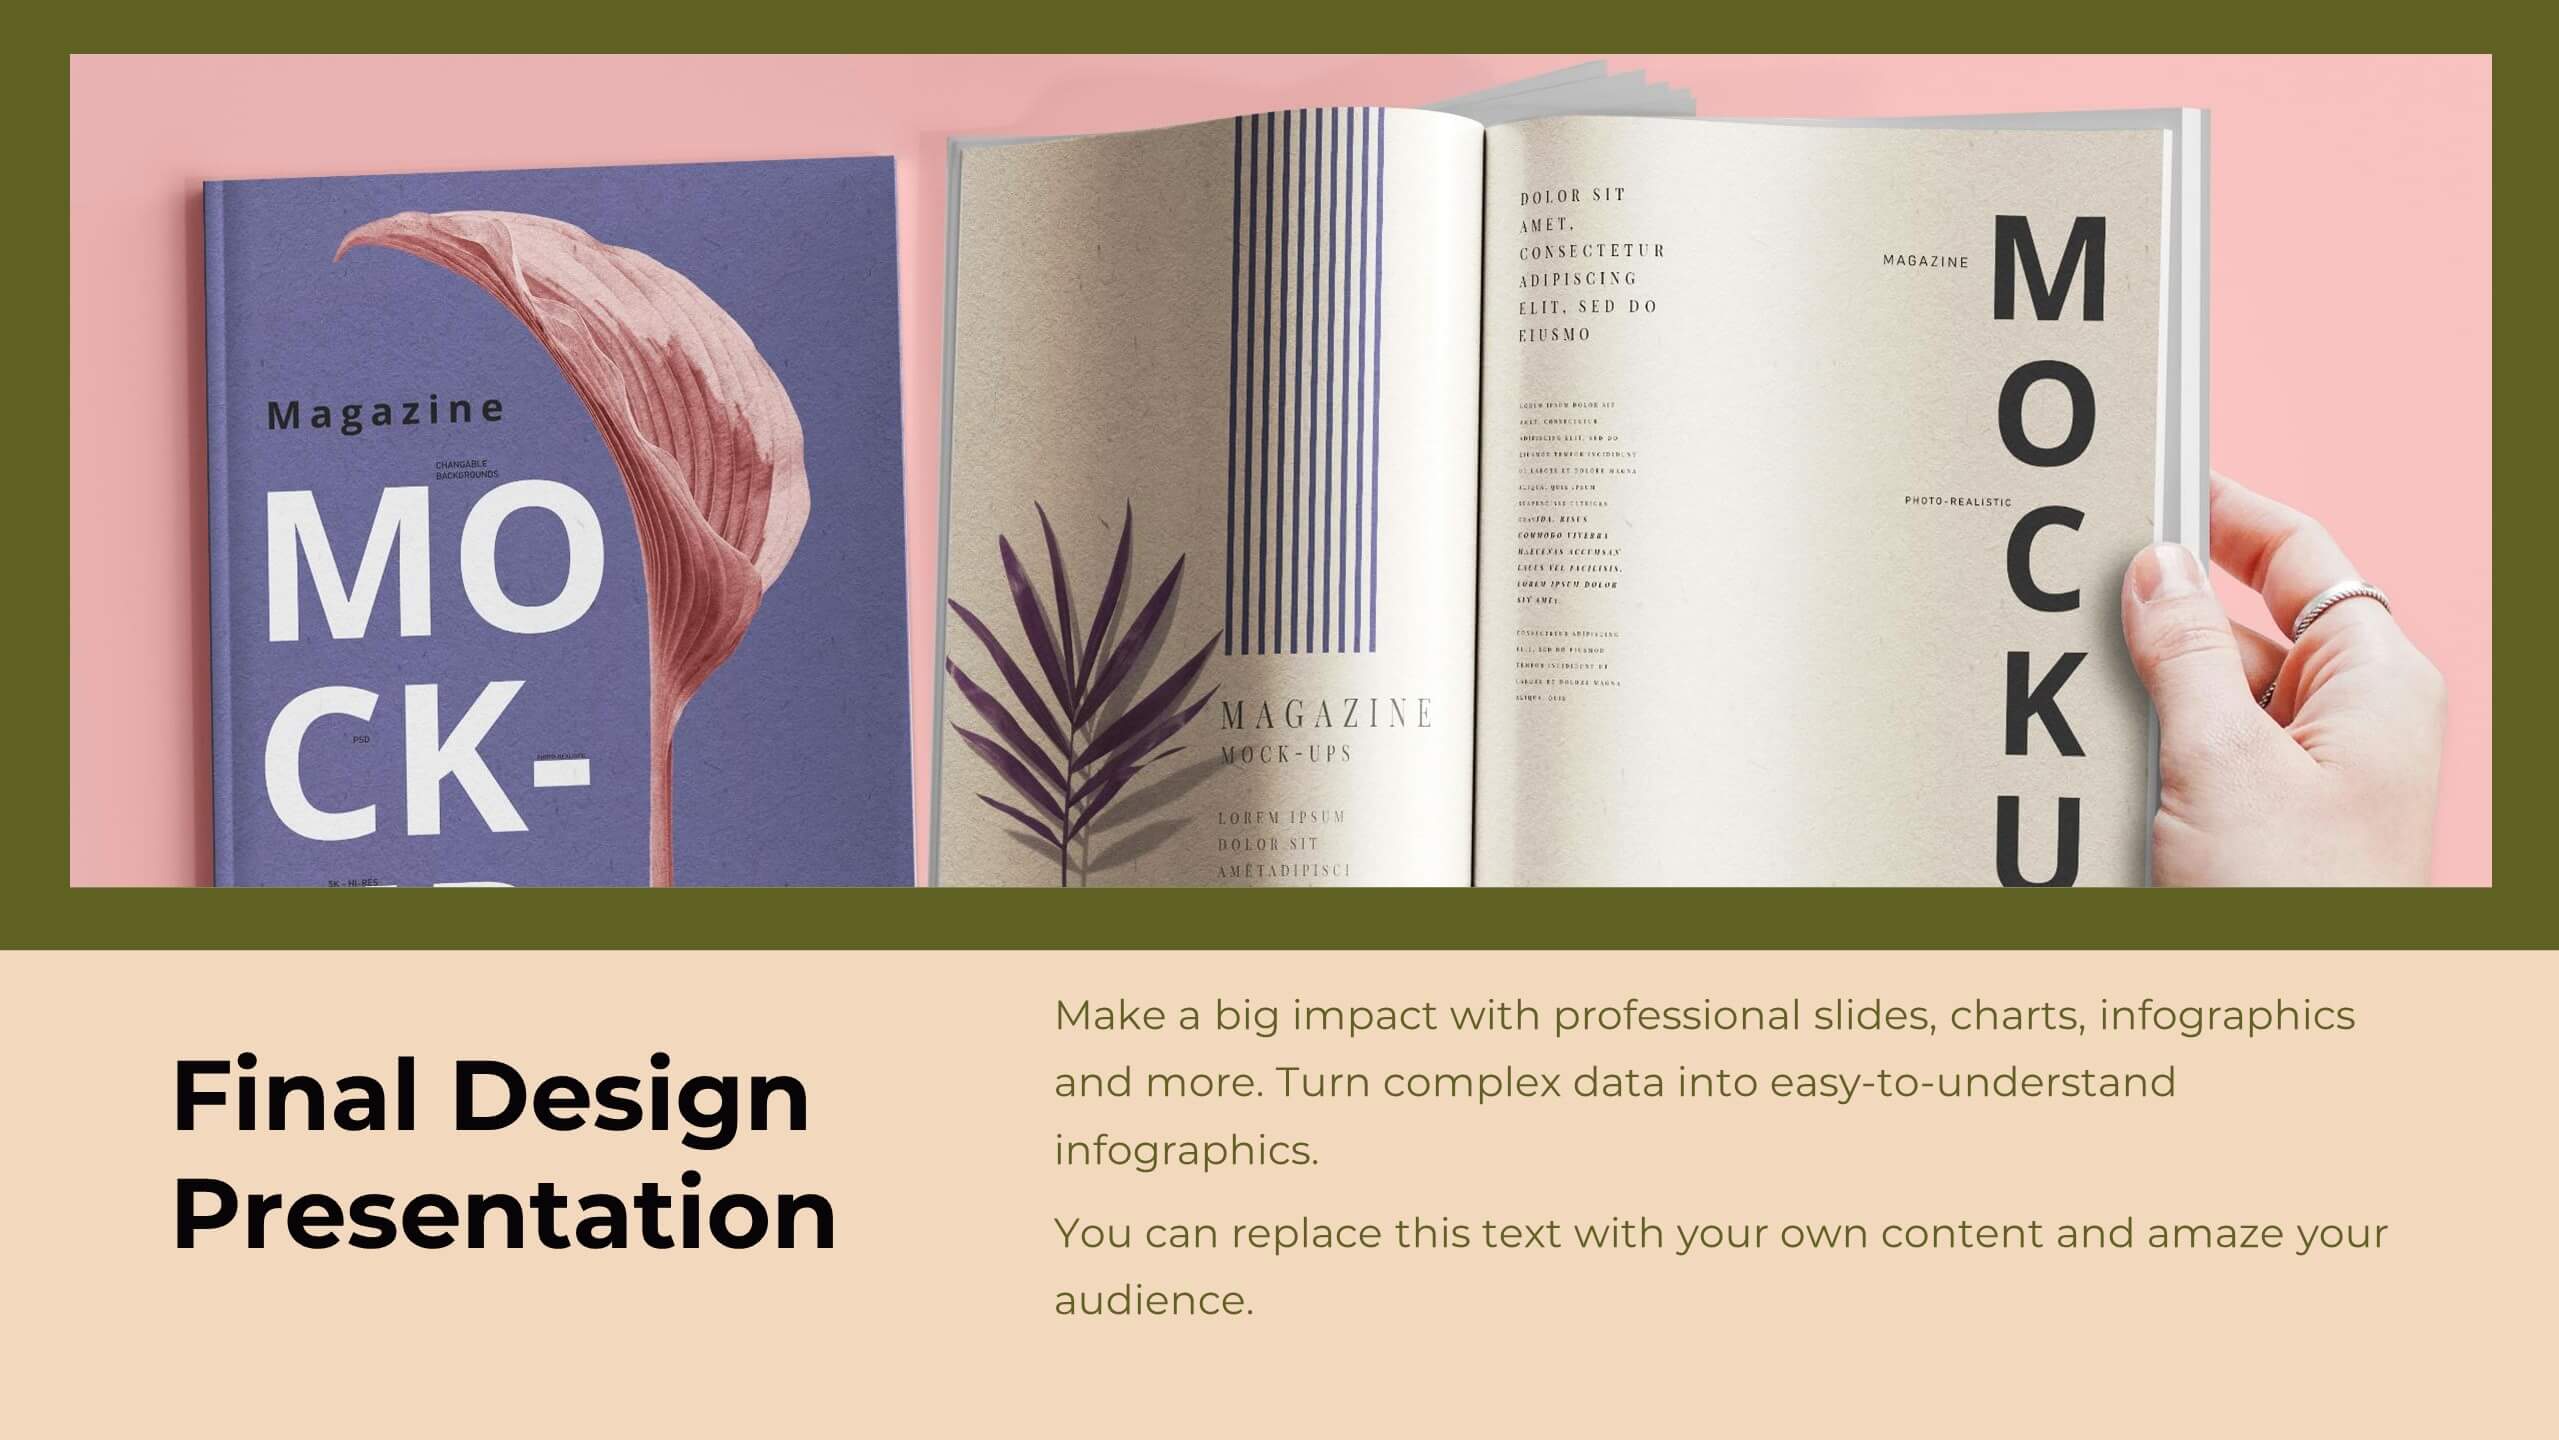
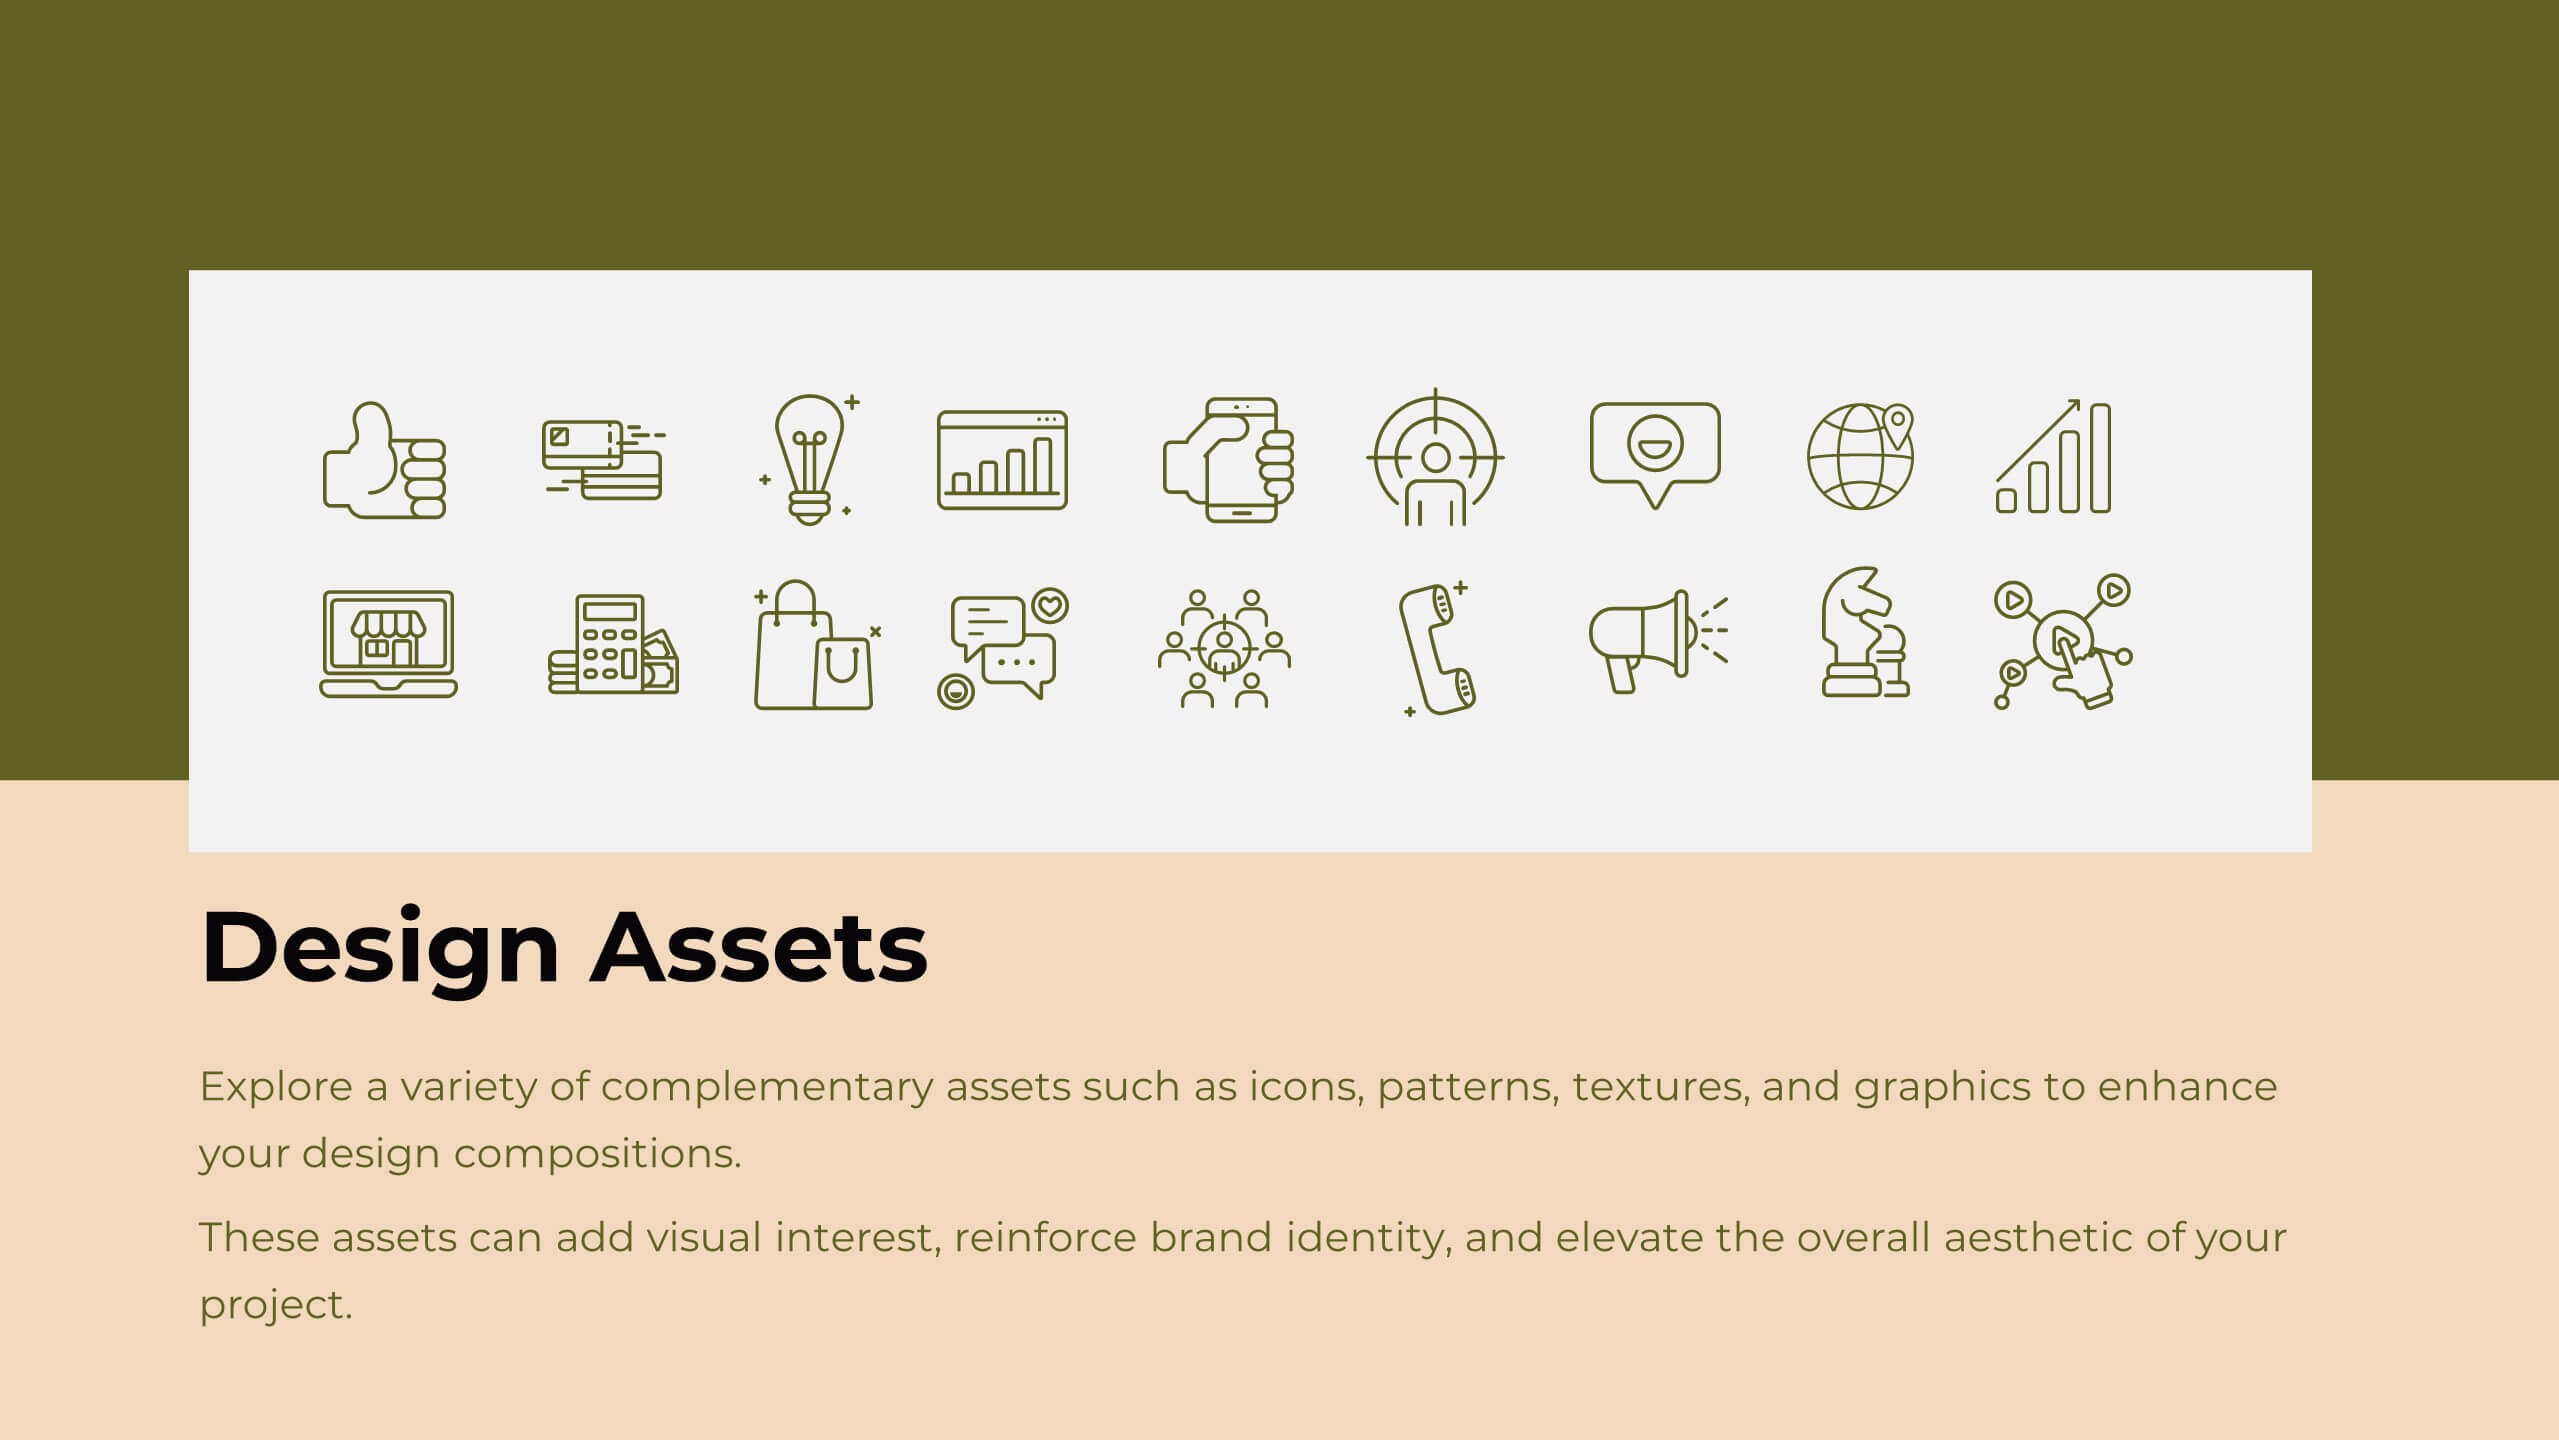
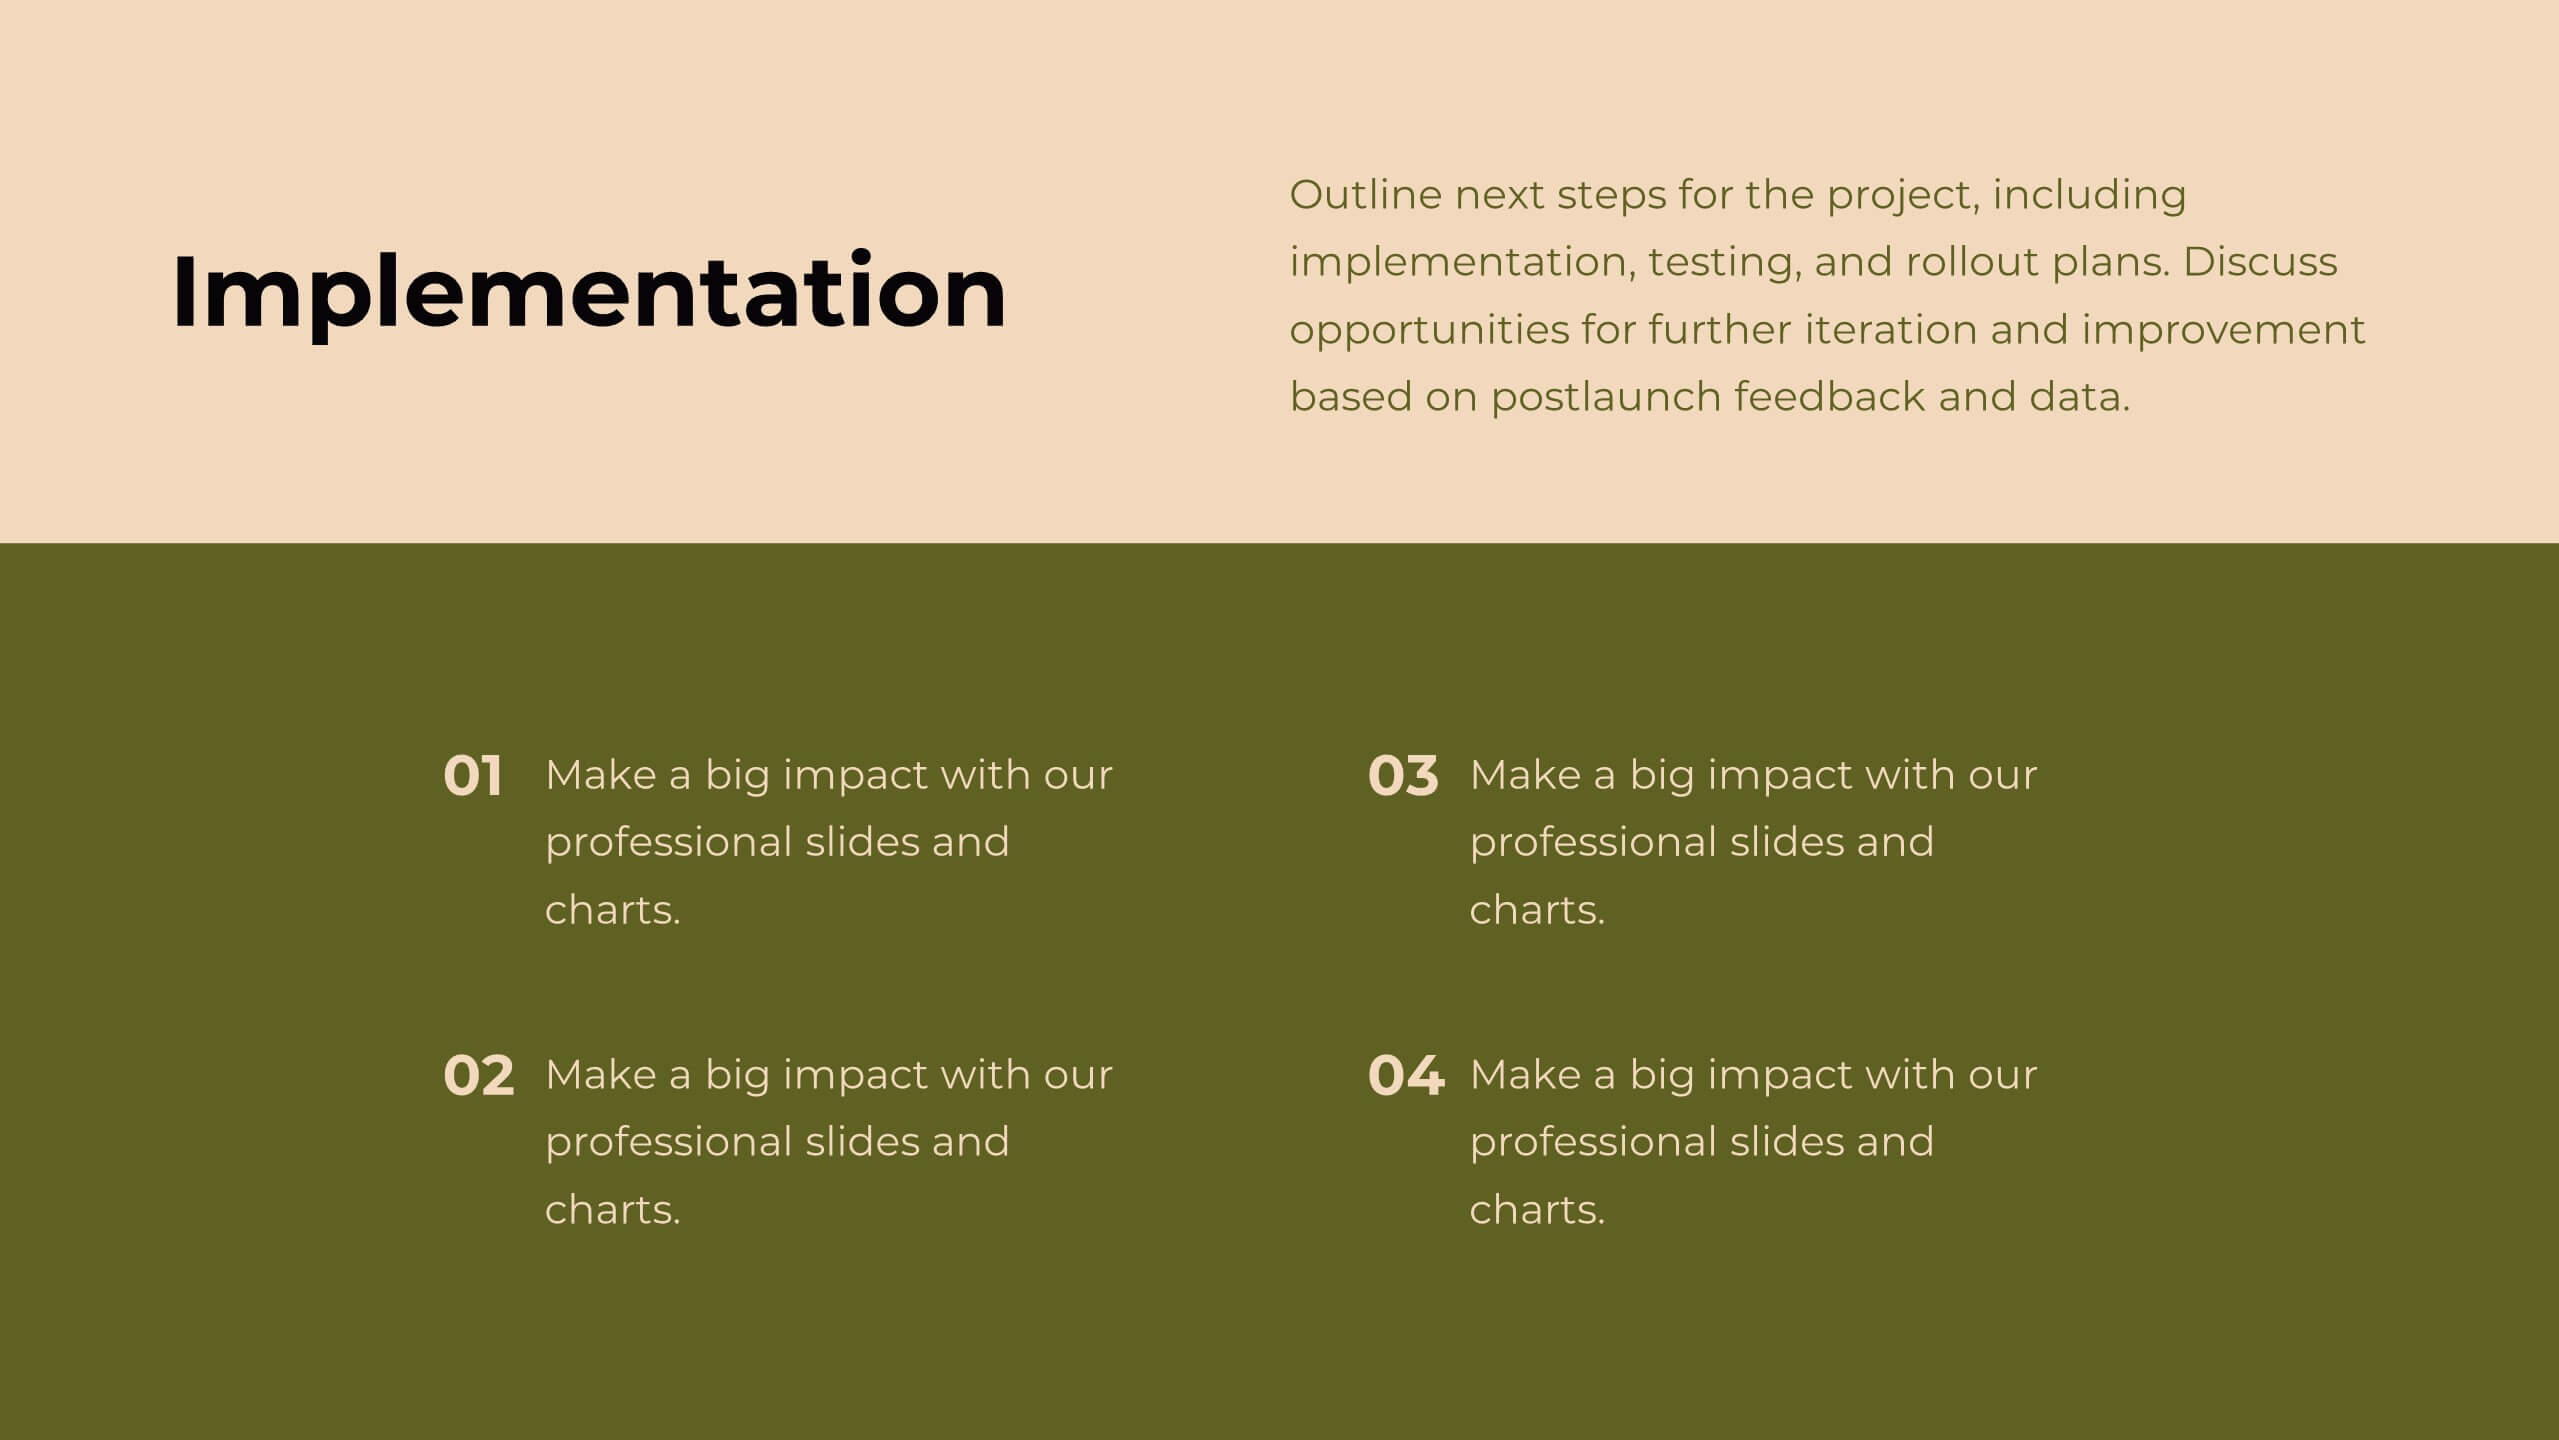
Syntax Creative Design Report Presentation
The Design Presentation Template empowers you to deliver visually stunning and organized presentations. With 20 fully editable slides, it includes sections like design briefs, elements, processes, mood boards, prototypes, and timelines. Tailored for designers and creative teams, it's compatible with PowerPoint, Keynote, and Google Slides for seamless customization and impact.


26 diapositivas
Managing Work-Life Balance Presentation
Find harmony between career and personal life with this insightful presentation on managing work-life balance. Covering key strategies like time management, stress reduction, remote work efficiency, and self-care practices, this template helps promote productivity and well-being. Fully customizable and compatible with PowerPoint, Keynote, and Google Slides for a seamless and engaging presentation experience.

21 diapositivas
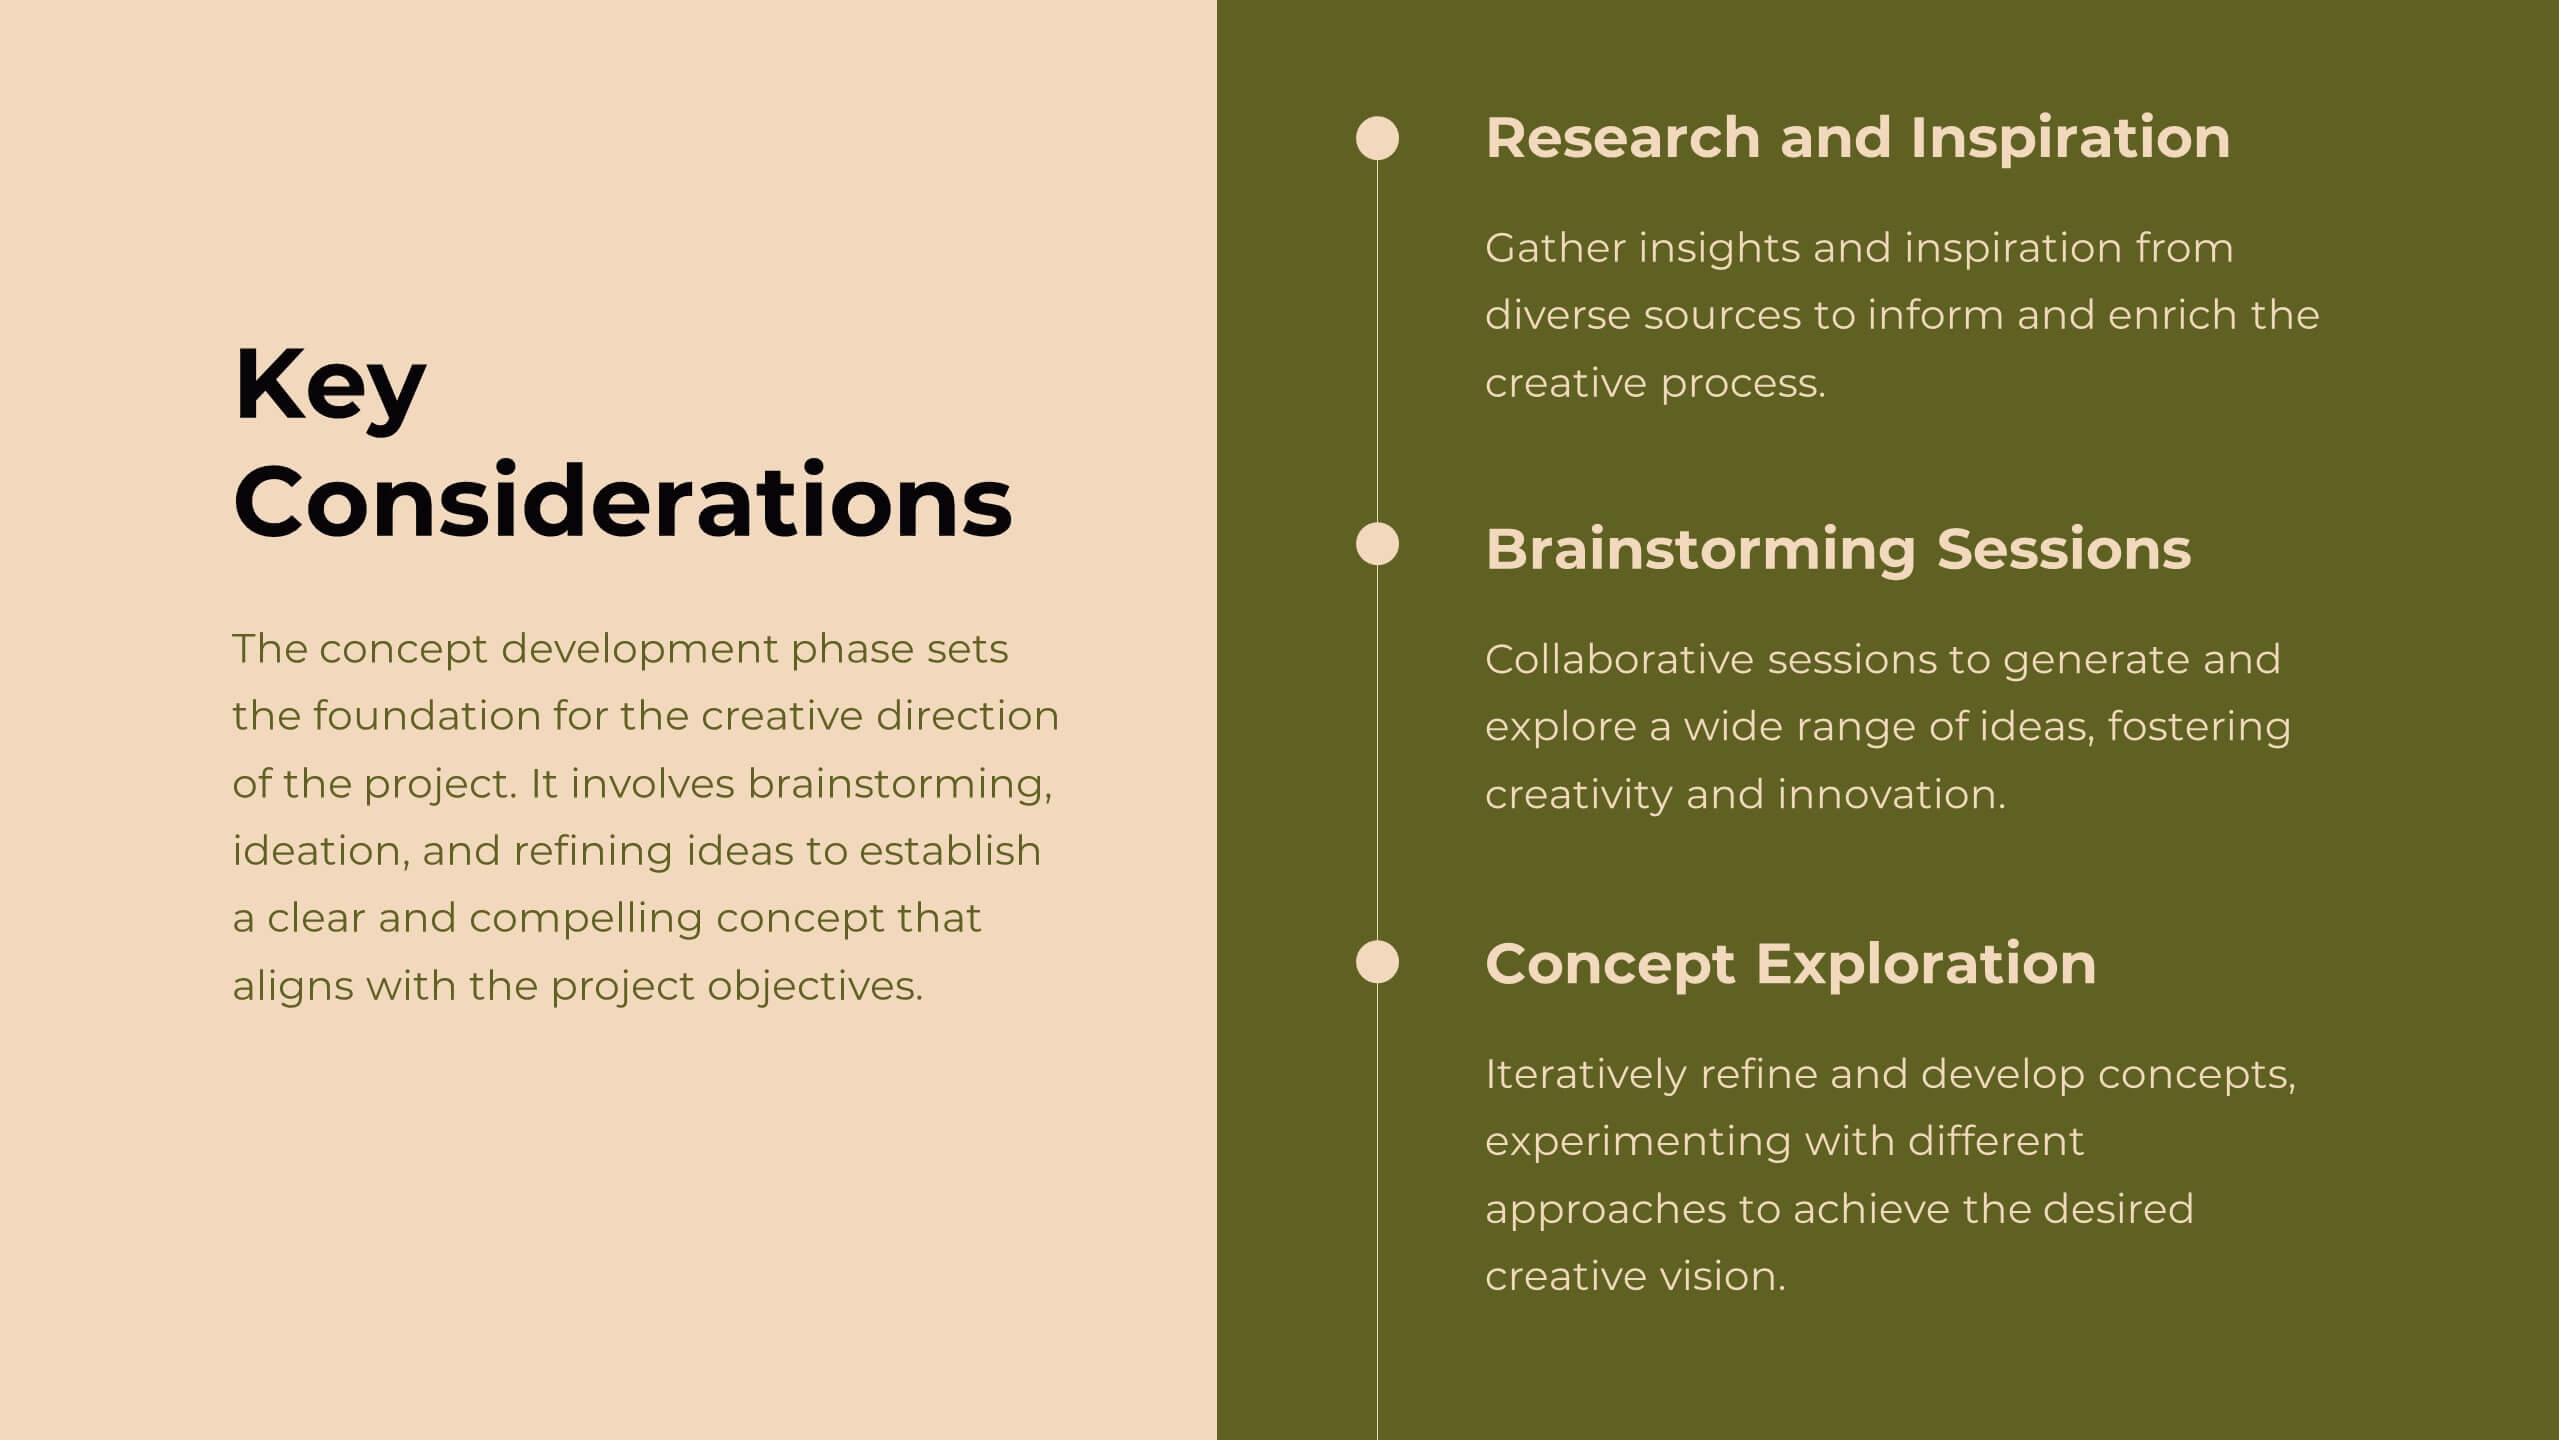
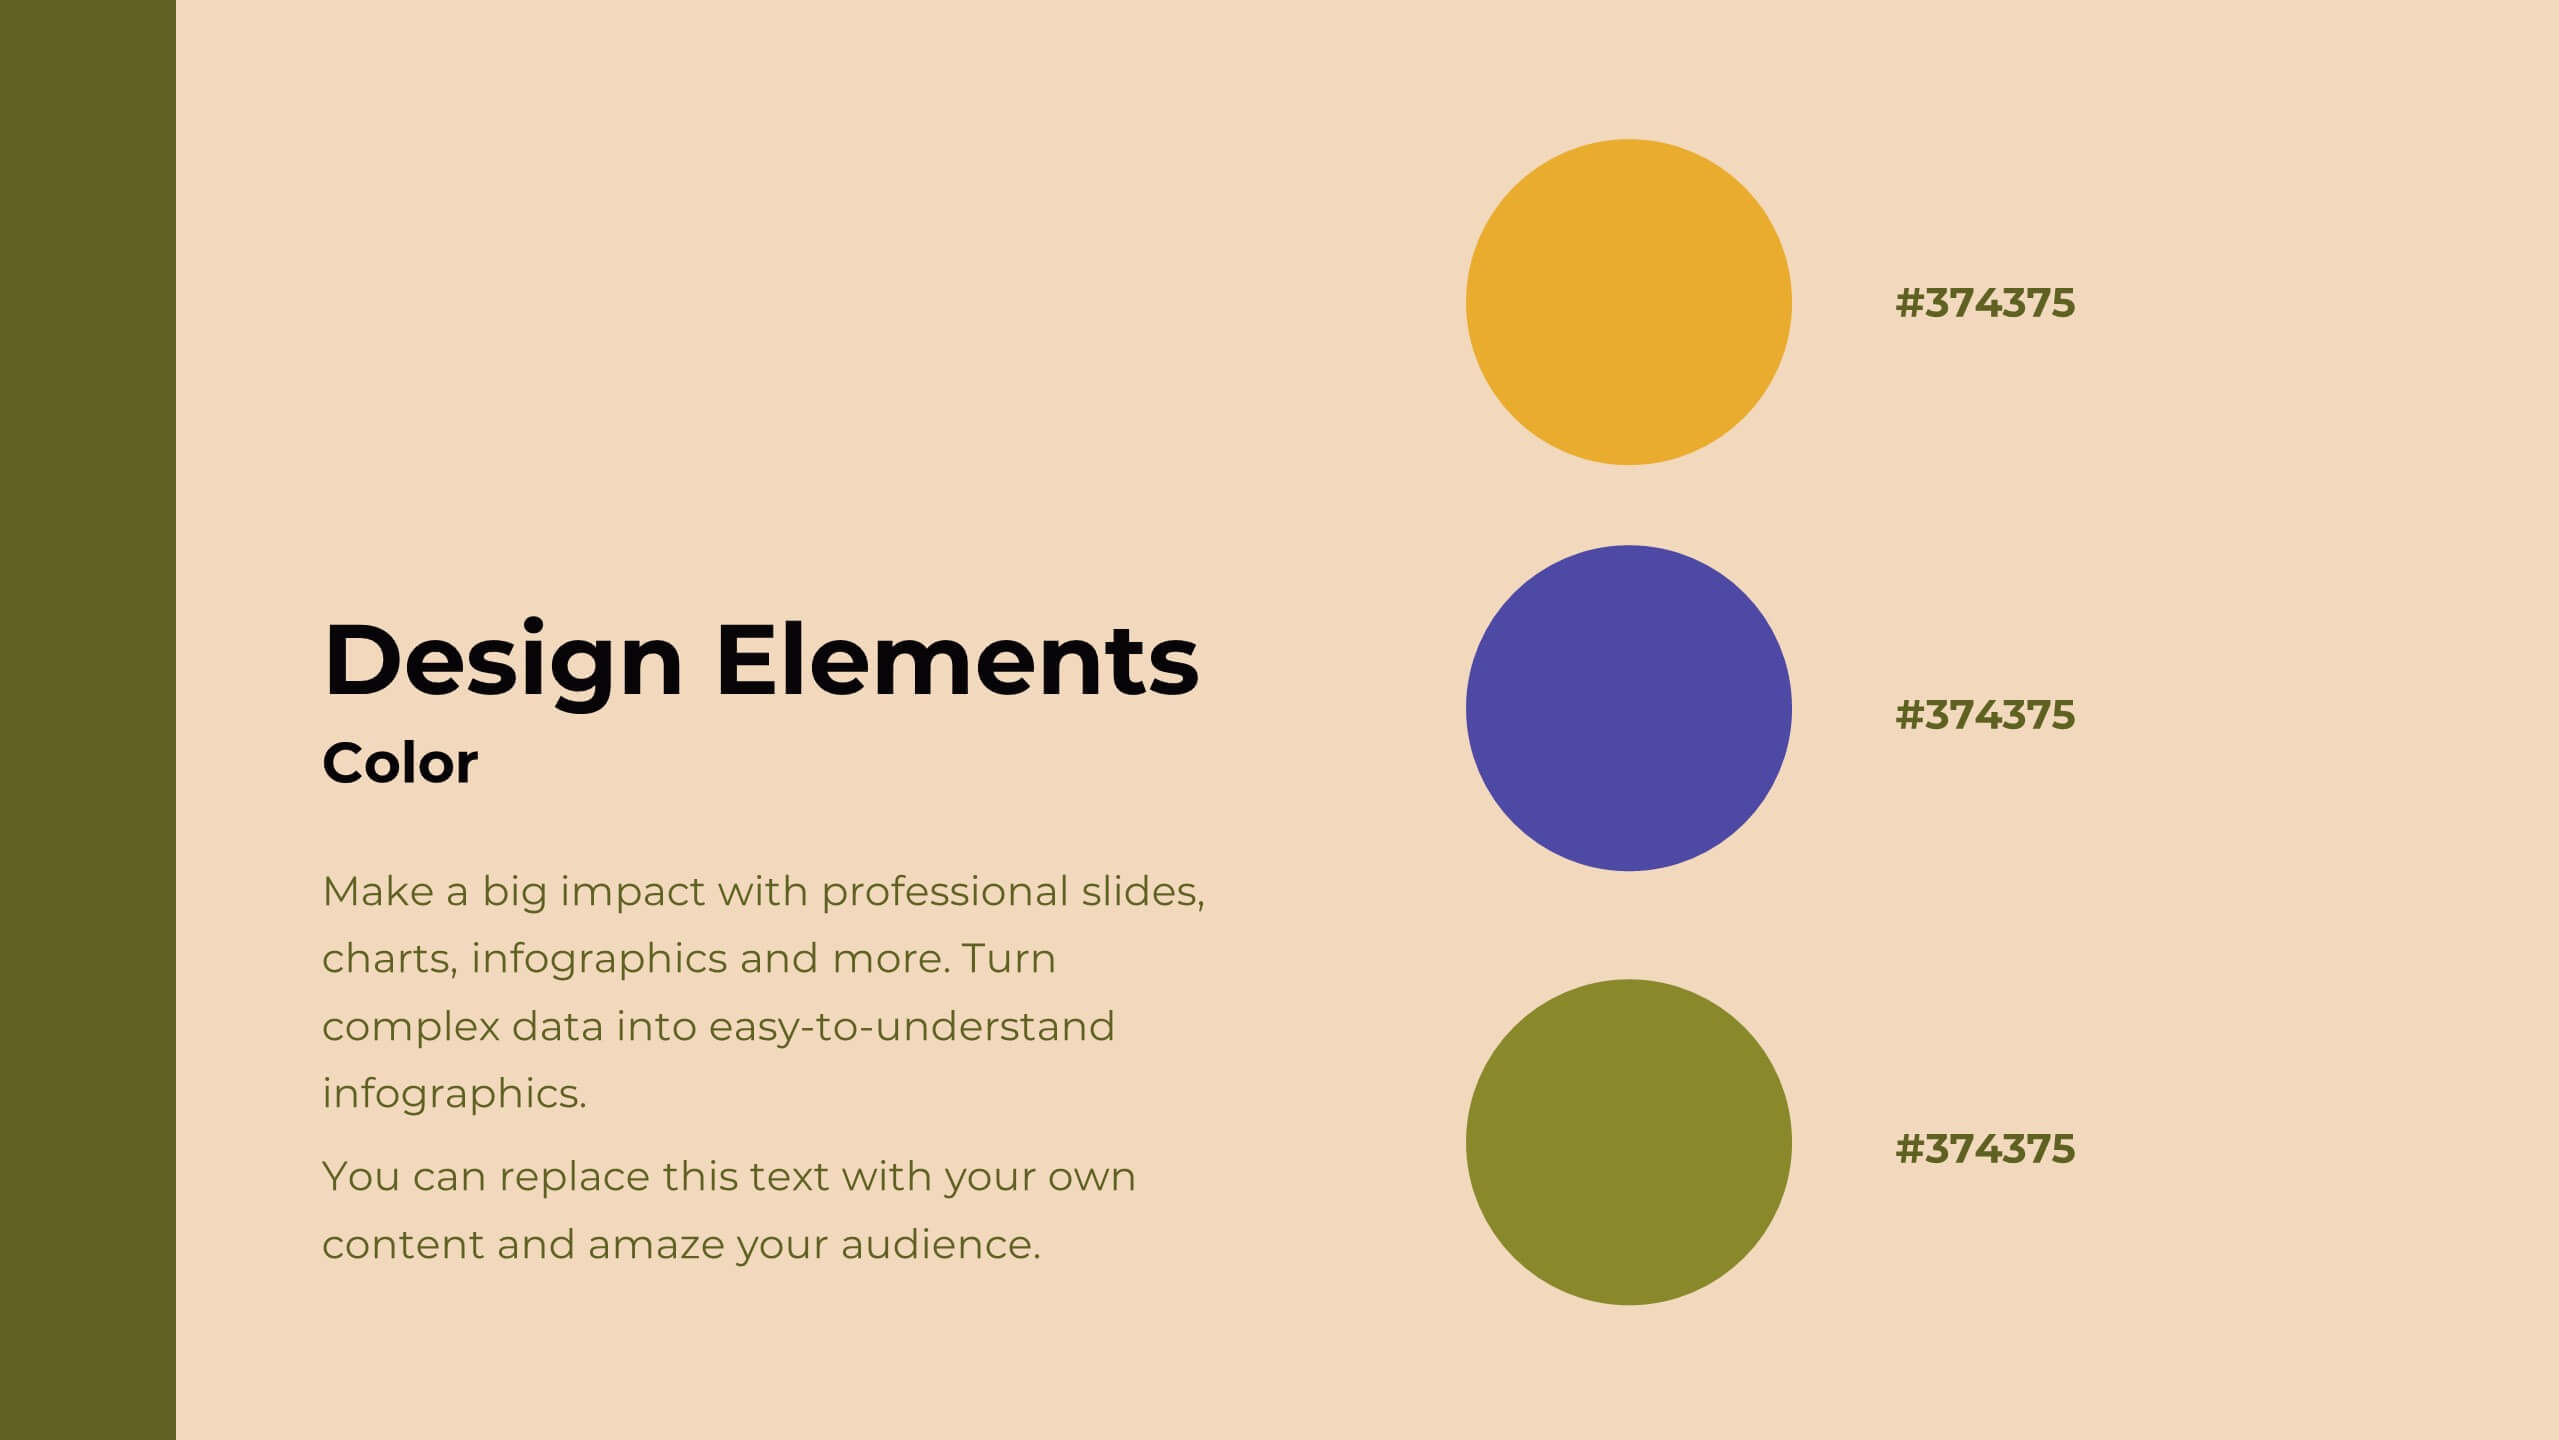
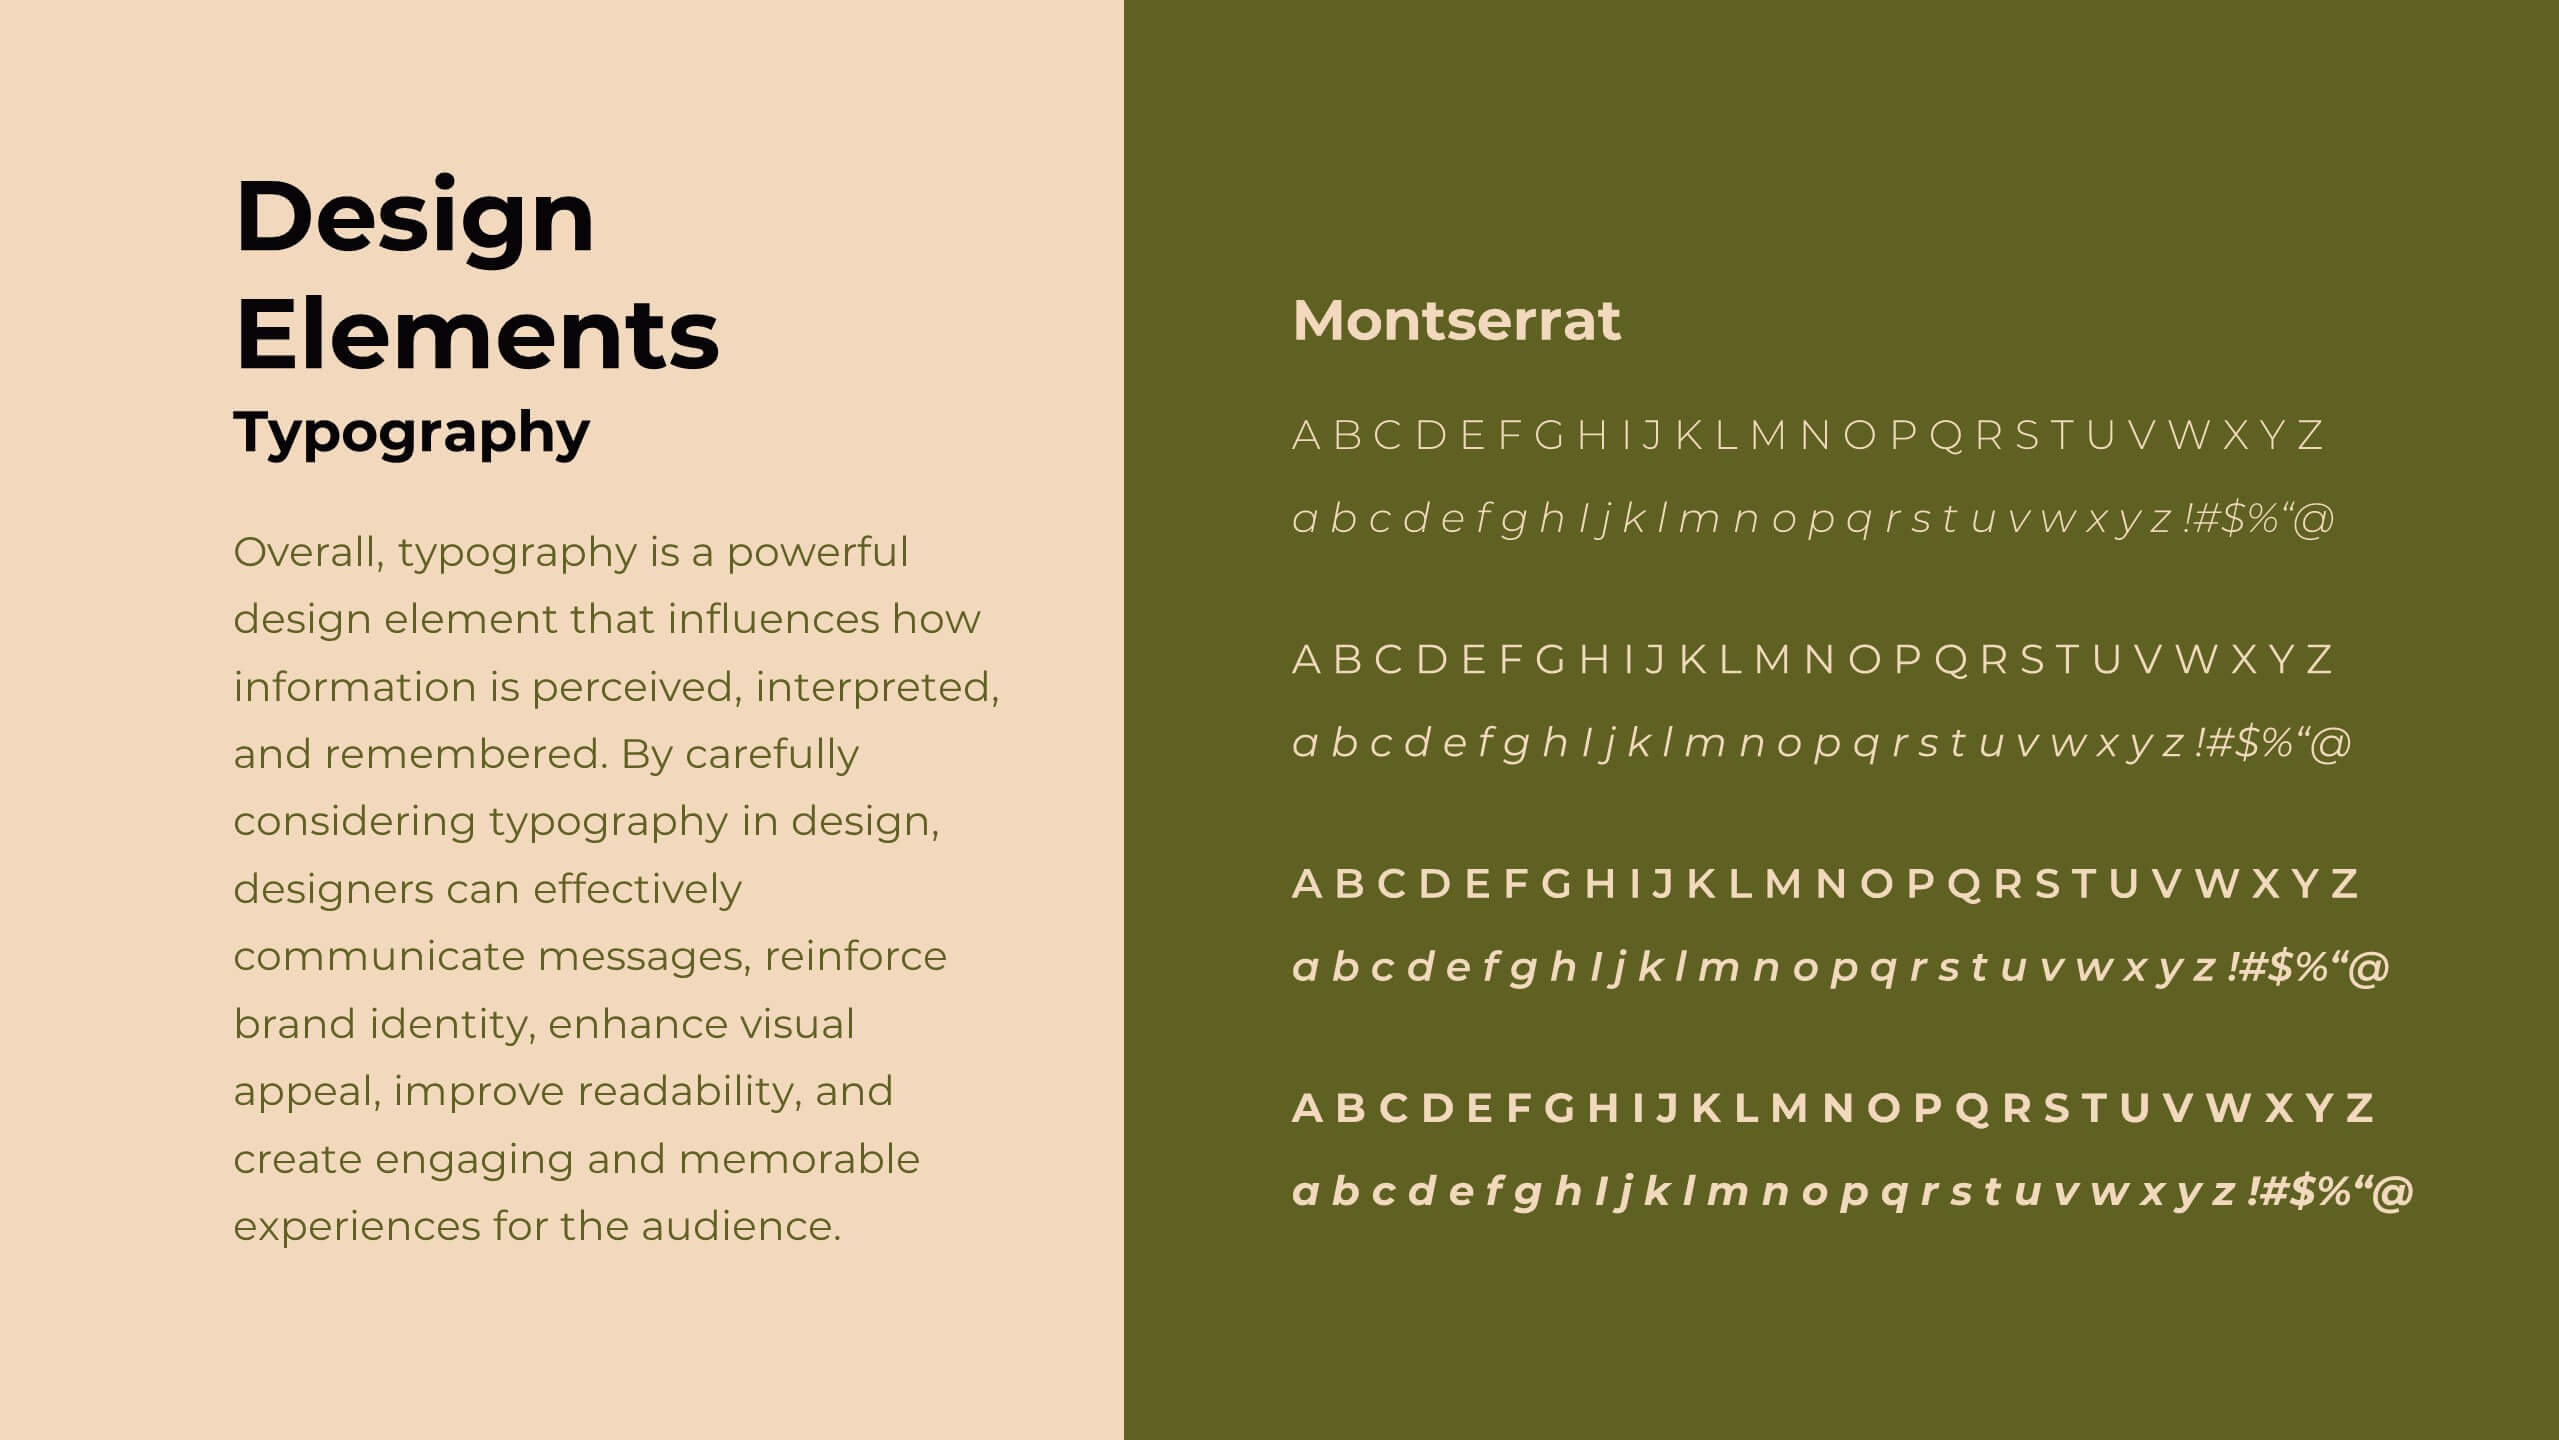
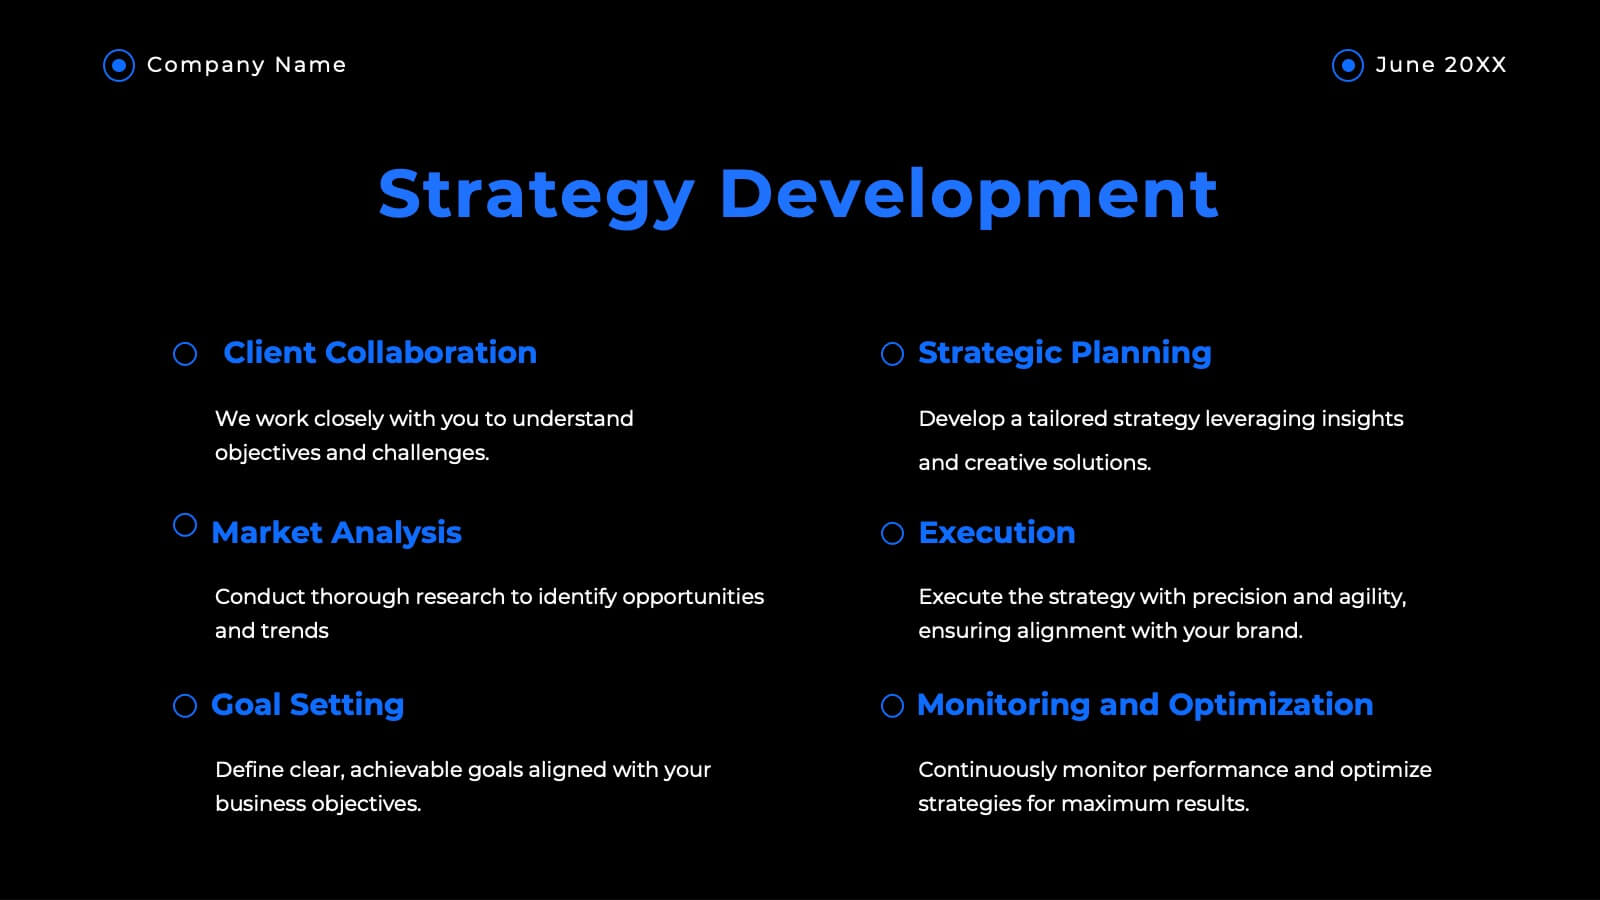
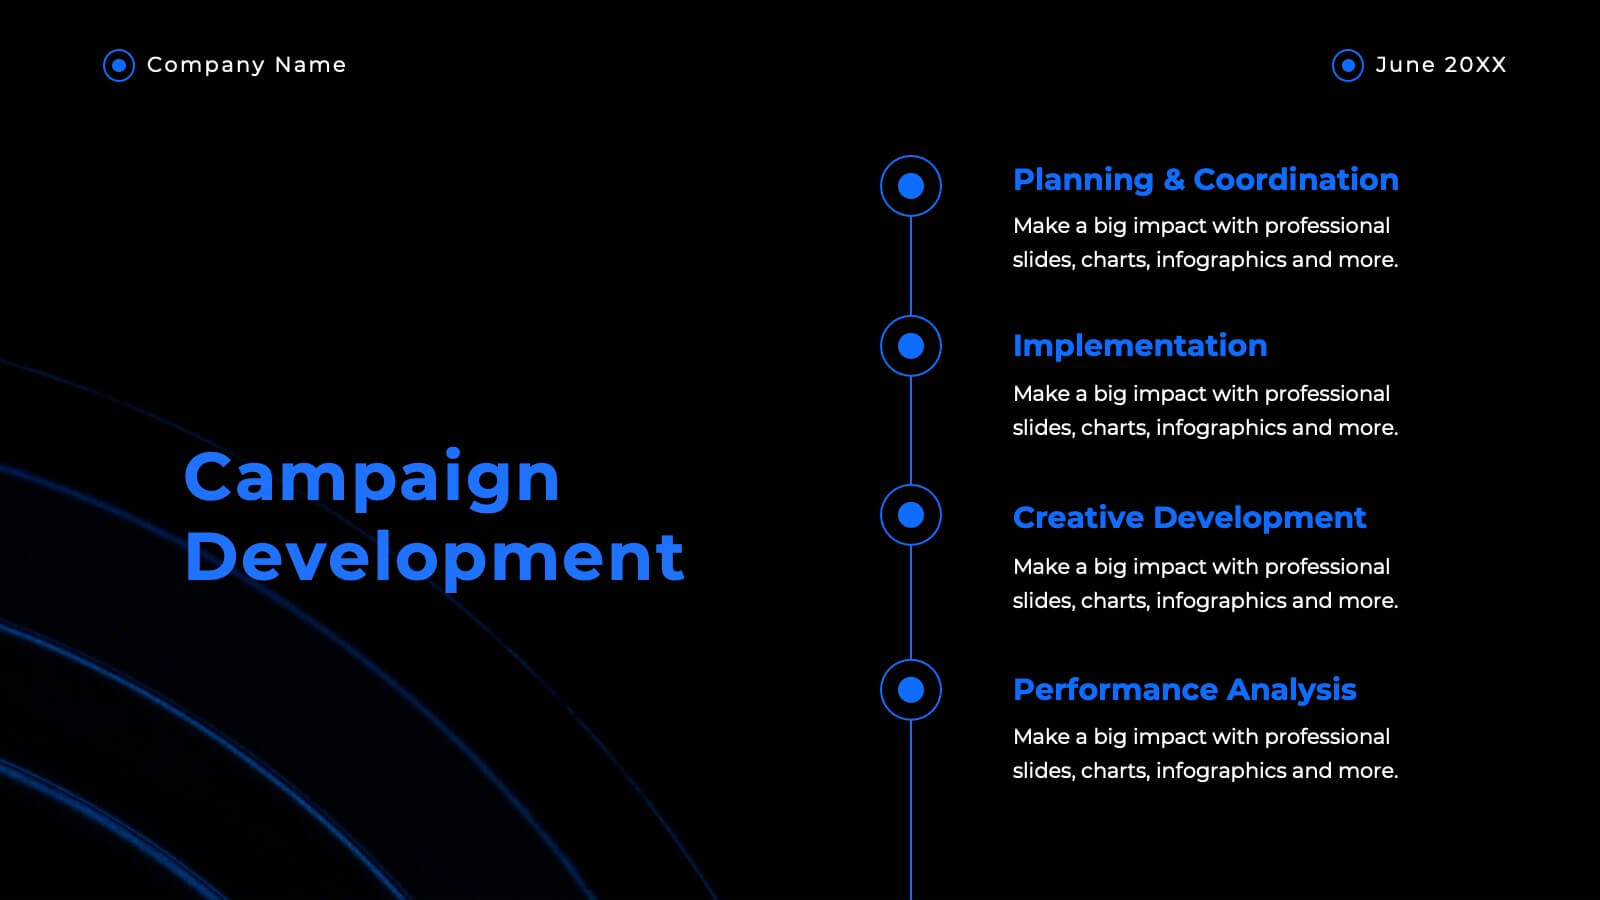
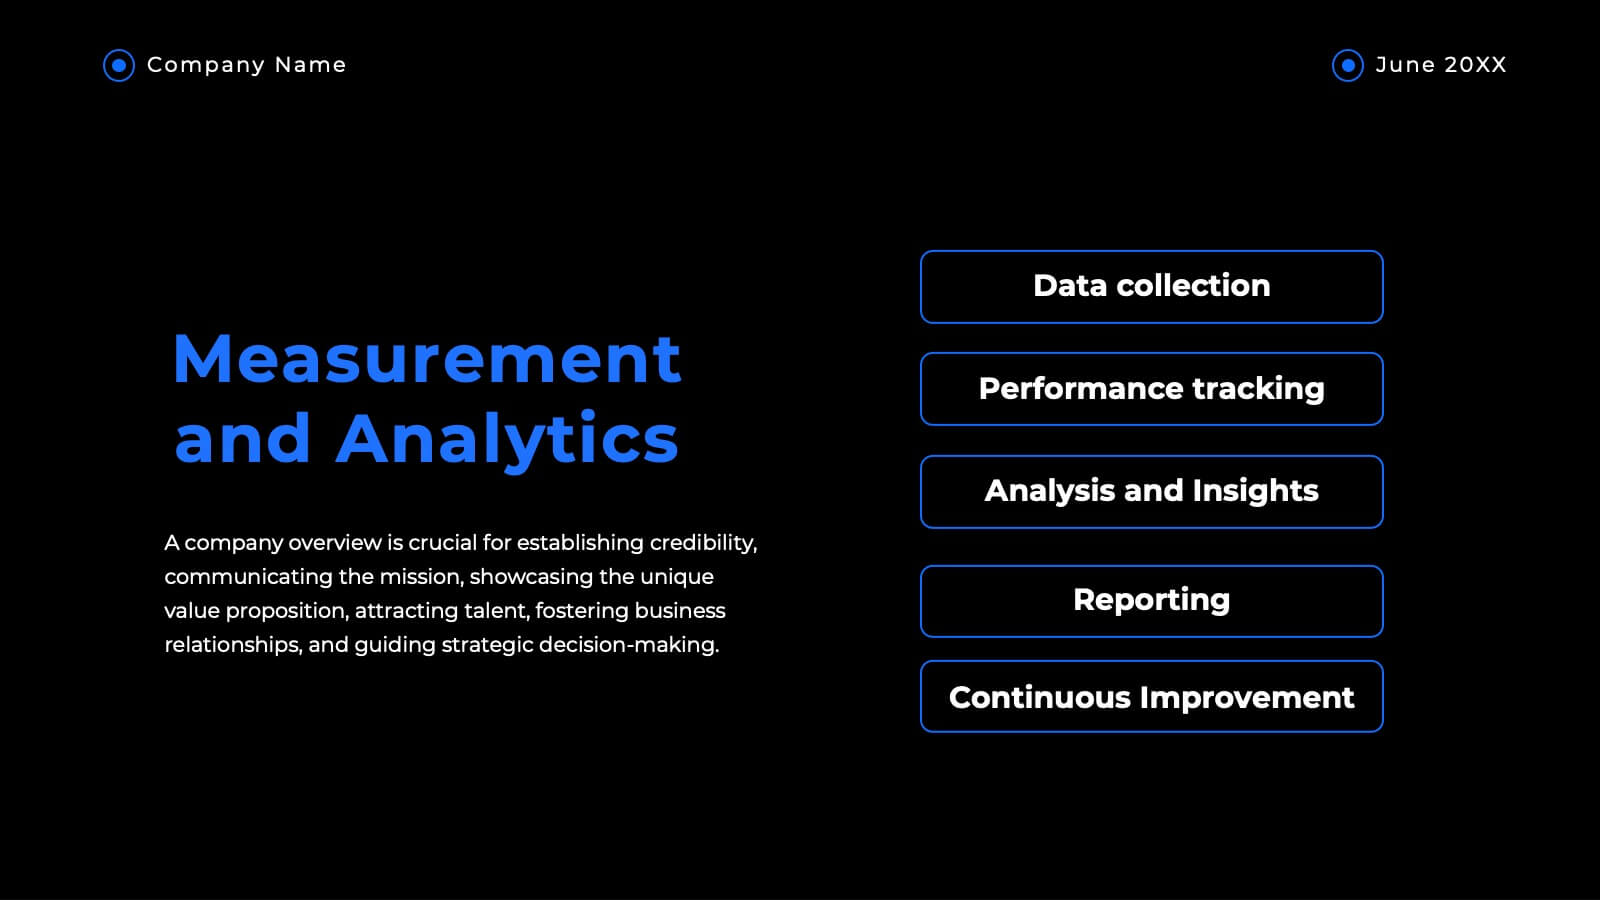
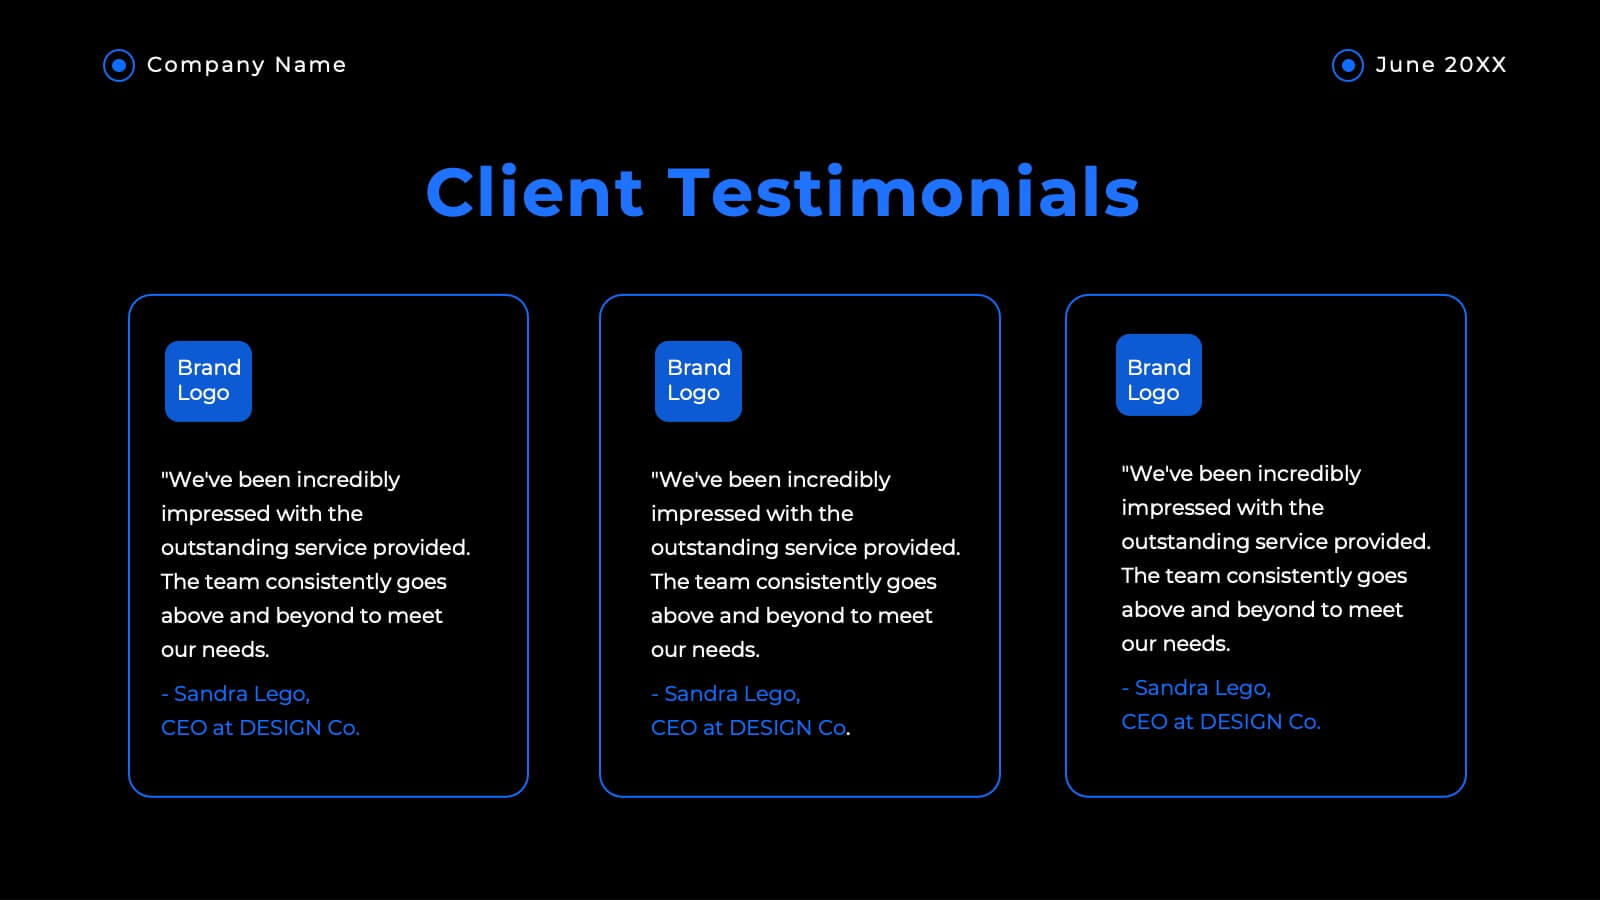
Delta Design Strategy Proposal Presentation
Transform your design strategy with this elegant proposal template! Perfect for presenting design briefs, target audience insights, and concept development. Ideal for designers and creative teams aiming to align vision and execution. Compatible with PowerPoint, Keynote, and Google Slides, this template ensures your design strategy is clear, professional, and compelling. Elevate your projects today!


6 diapositivas
6-Step Business Process Presentation
Clearly map out workflows with this 6-step business process presentation. Ideal for project managers and strategists, this horizontal timeline helps break complex tasks into digestible phases. With editable icons, color highlights, and step-by-step layout, it's easy to customize in PowerPoint, Keynote, or Google Slides for any professional setting.


4 diapositivas
90-Day Success Plan for New Hires Presentation
Set your team up for success with this 90-Day Success Plan for New Hires Presentation. This template is perfect for onboarding workflows, outlining key milestones at 30, 60, and 90 days. Help managers and HR professionals communicate expectations clearly and track new employee progress. Fully editable in PowerPoint, Keynote, and Google Slides.


6 diapositivas
Business Value Proposition Presentation
Ignite your strategy with this captivating template that highlights your unique business value. This tool breaks down key value propositions, market differentiators, and customer benefits in an engaging format. Perfect for pitching ideas, it clarifies competitive advantages and growth opportunities. Compatible with PowerPoint, Keynote, and Google Slides for seamless presentations.
22 diapositivas
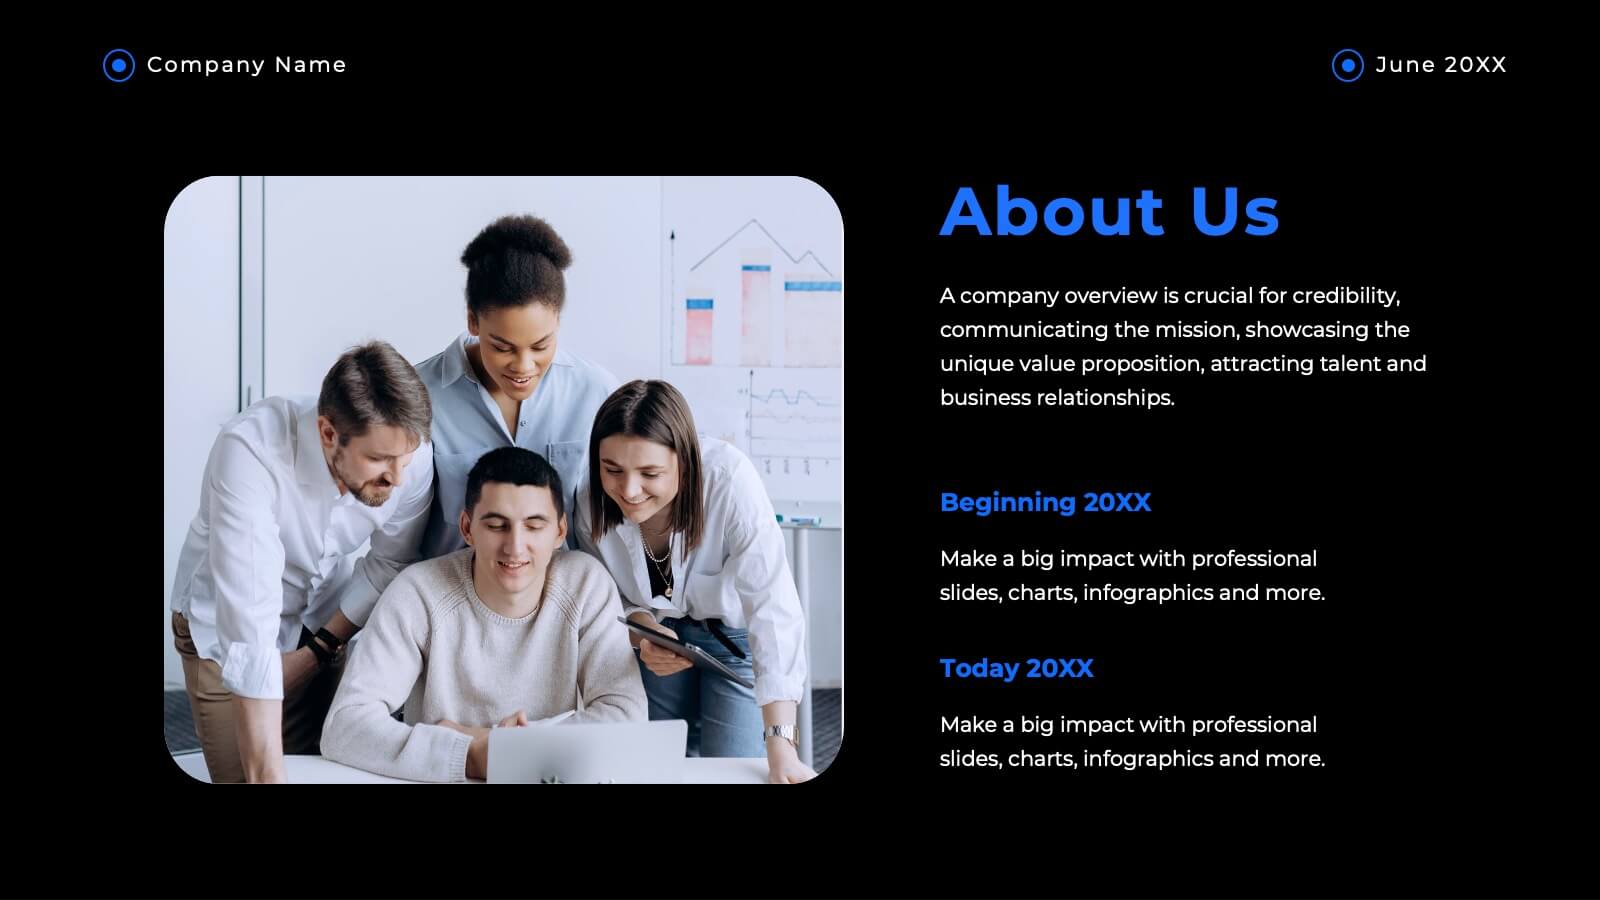
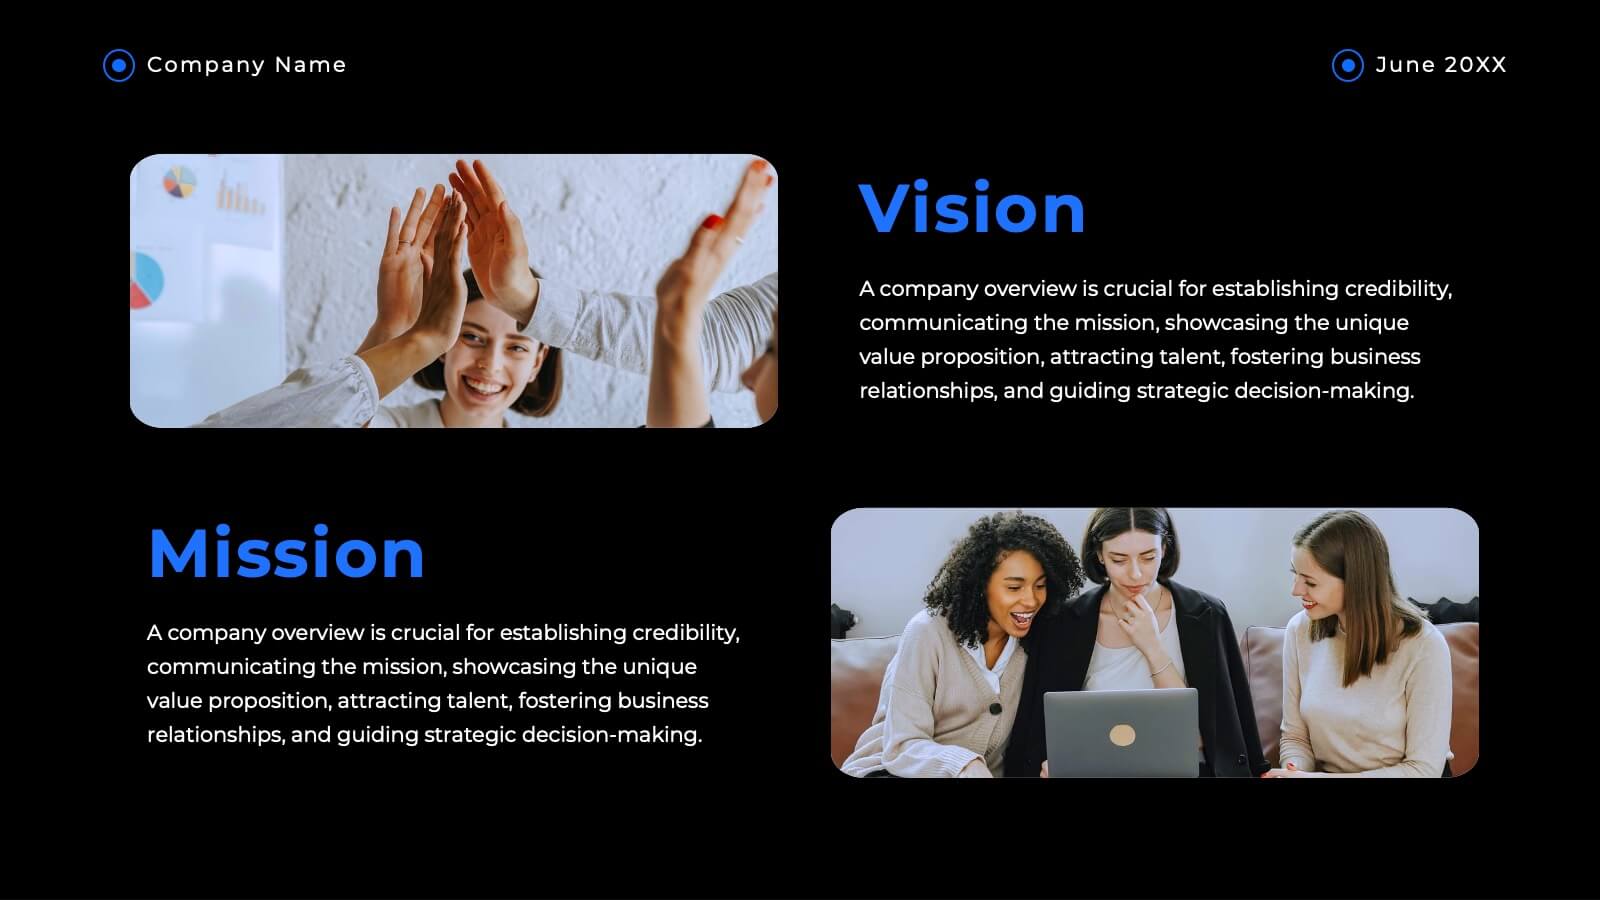
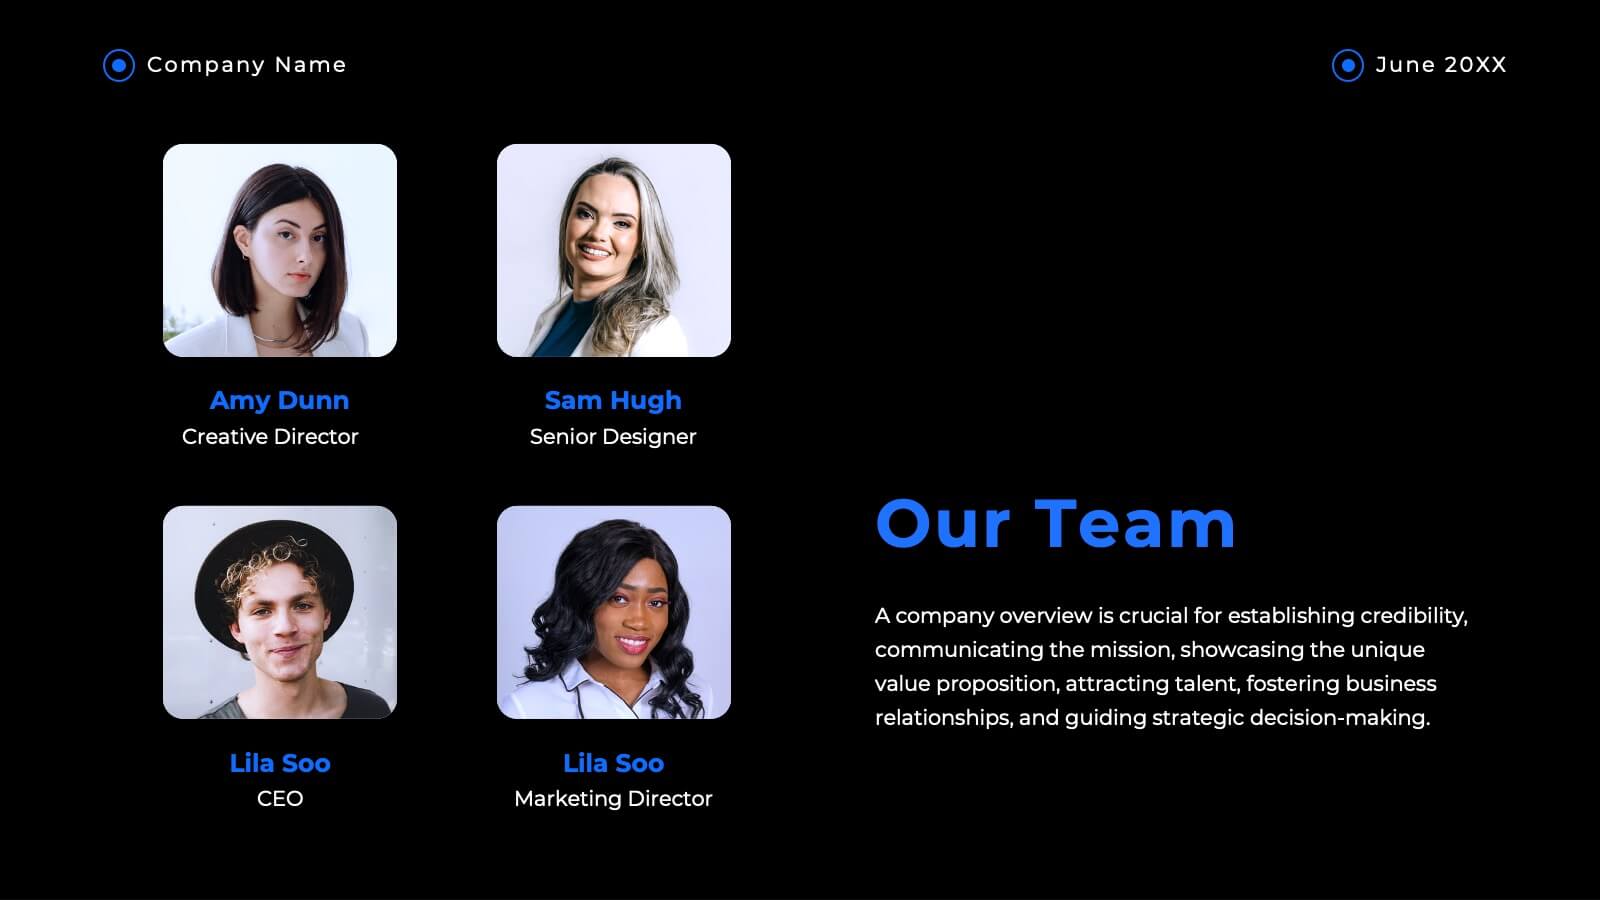
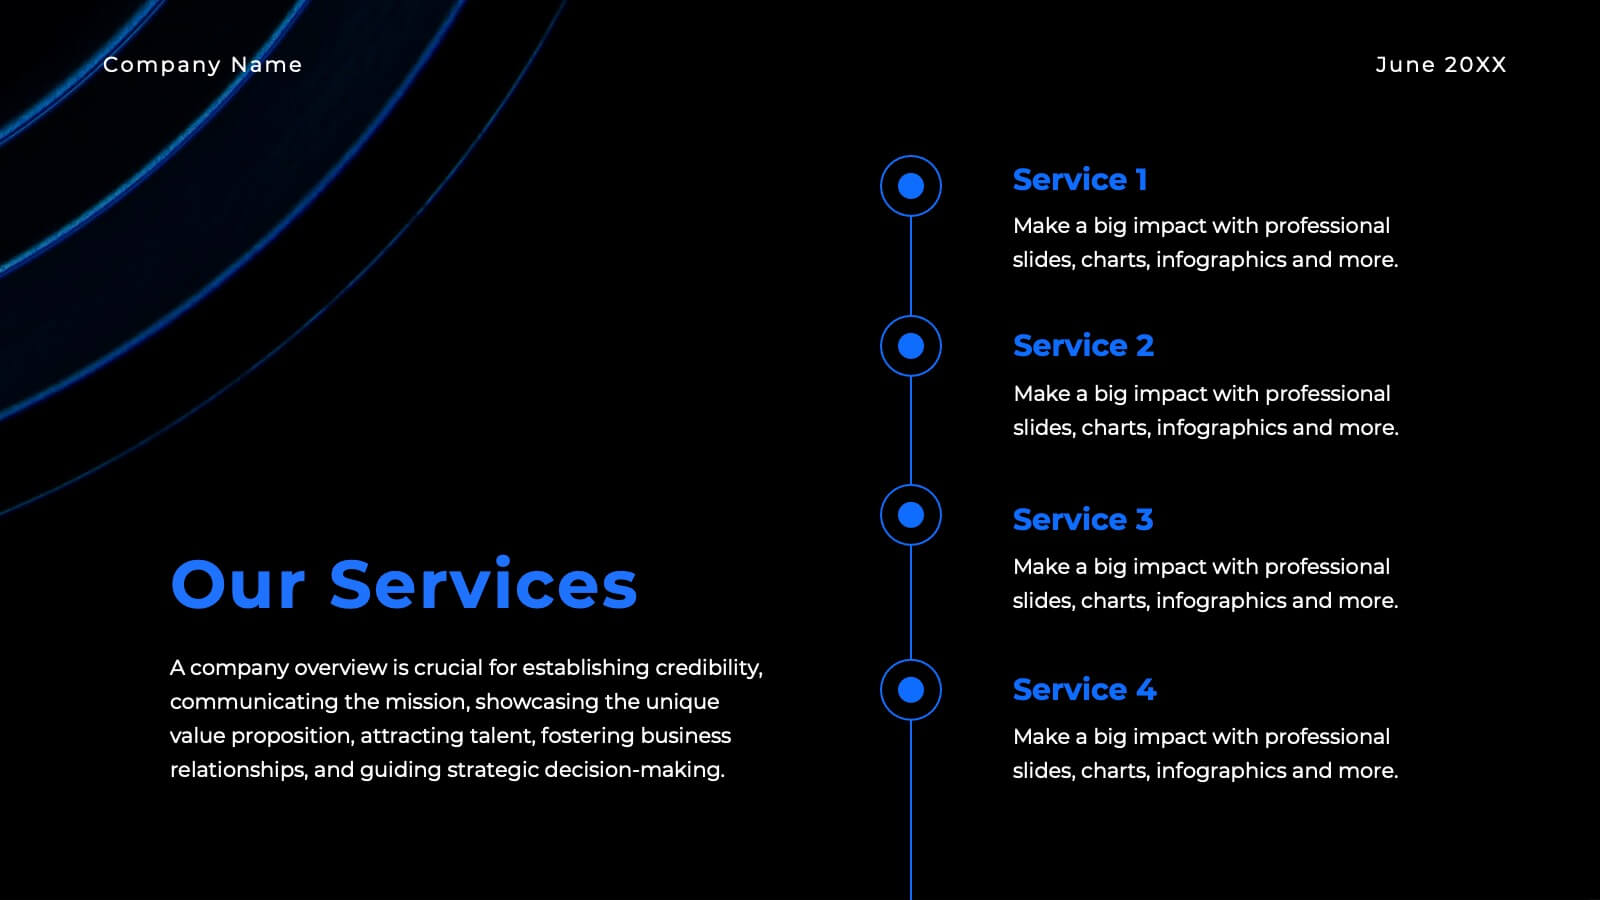
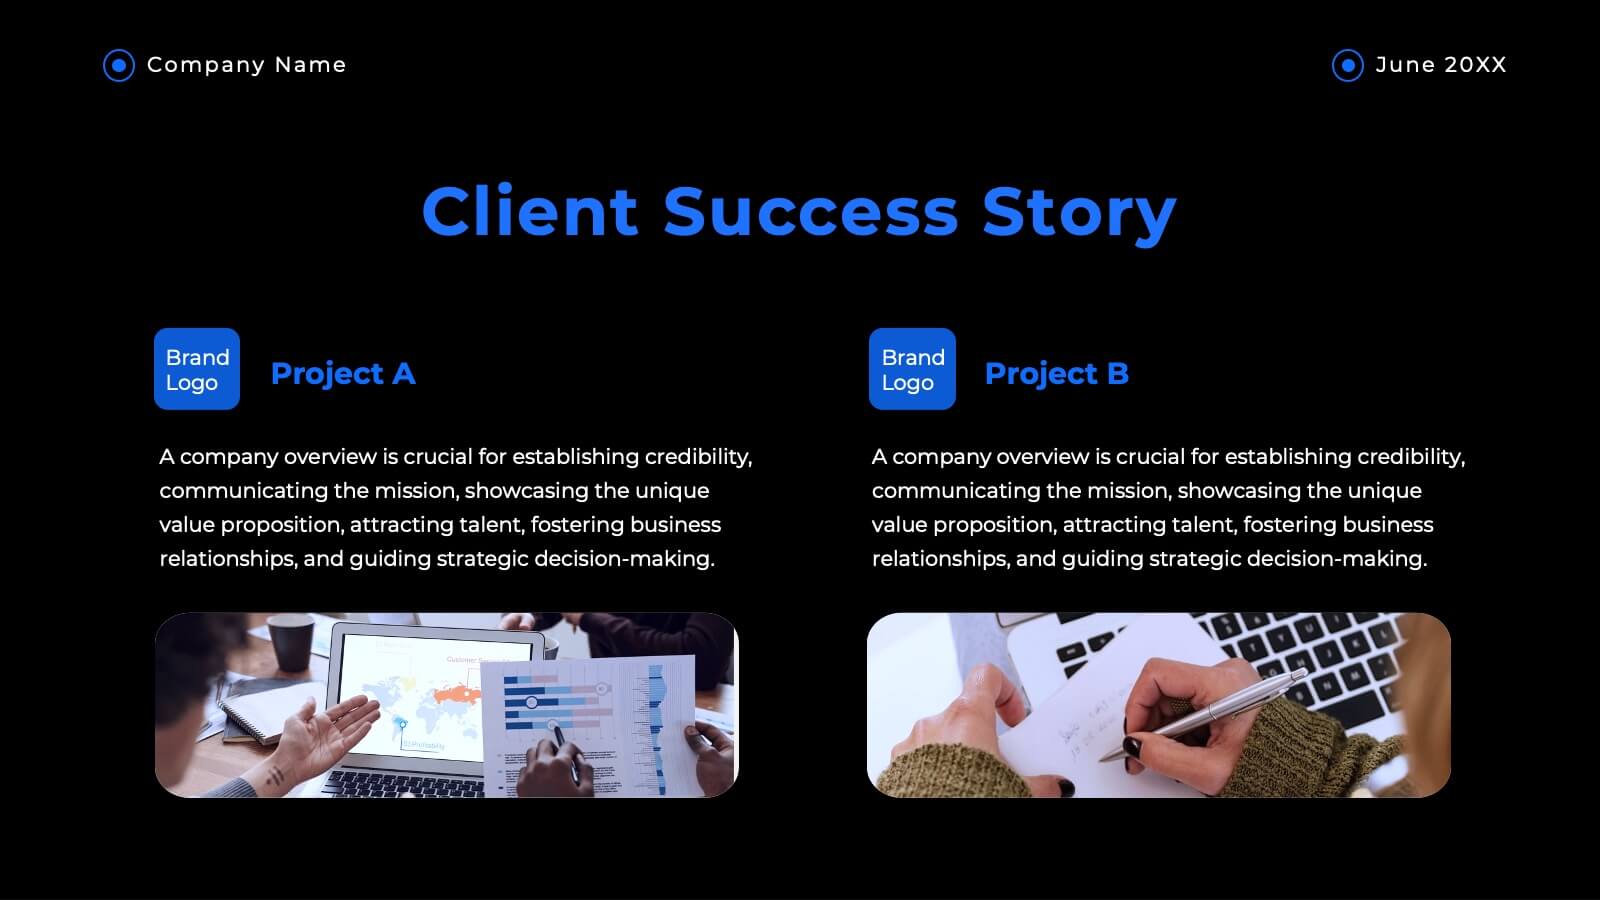
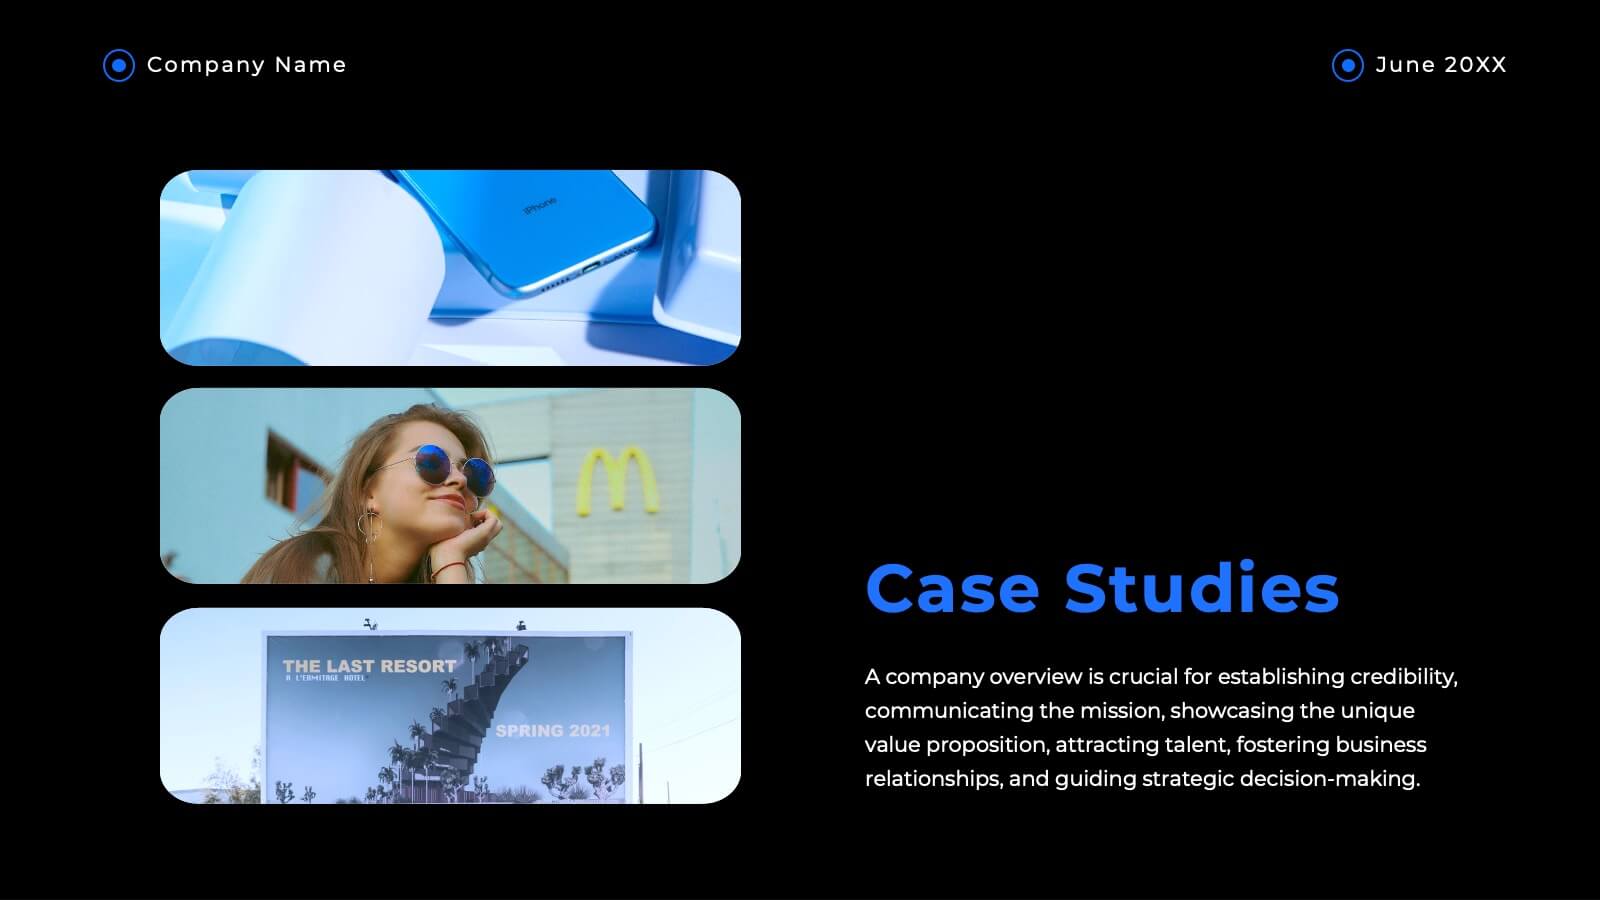
Haven Advertising Agency Proposal Presentation
Wow your clients with this sophisticated agency presentation template! Perfect for showcasing your services, client success stories, and market analysis. Ideal for agencies looking to impress and secure new business. Compatible with PowerPoint, Keynote, and Google Slides, this template ensures your proposals stand out with professional elegance. Perfect for any pitch or proposal.


7 diapositivas
Change Management Principles Infographic
Change is the only constant in the business realm, and mastering its management can be the linchpin to success. The change management principles infographic, in its harmonious palette of gray, blue, and red, provides a visually compelling overview of the key tenets governing successful change. Tailored for business leaders, project managers, HR professionals, and organizational consultants, this infographic streamlines complex ideas into easily digestible insights. Crafted to be fully compatible with PowerPoint, Keynote, and Google Slides, it serves as an invaluable tool to illuminate and drive conversations around change in any corporate presentation.


26 diapositivas
Forge Brand Strategy Report Presentation
The Brand Strategy Presentation Template is a sleek solution for showcasing brand identity. Highlight mission, values, audience personas, and future growth plans across 26 structured slides. Fully customizable for PowerPoint, Keynote, and Google Slides, it’s ideal for presenting brand insights to clients or stakeholders with professionalism and clarity.


21 diapositivas
Creative Sales Pitch Presentation
Boost your sales presentations with this sleek, professional template designed to captivate and inform. With its modern design, clear layout, and strategic use of visuals, this template is perfect for showcasing sales strategies, performance metrics, and future opportunities. Compatible with PowerPoint, Keynote, and Google Slides, it's ideal for seamless use across all devices.


20 diapositivas
Whisper Creative Portfolio Presentation
The Creative Portfolio Presentation Template is a visually striking 20-slide design, ideal for showcasing your professional work or services. It features slides for introductions, about us, portfolio overviews, and individual project highlights. Key sections include philosophy, style, creative process, client testimonials, awards, and pricing structures. The vibrant yellow and pink gradient elements provide a modern, creative flair that grabs attention. Fully customizable and compatible with PowerPoint, Keynote, and Google Slides, this template is perfect for designers, agencies, and freelancers aiming to present their work professionally and uniquely.


5 diapositivas
Professional Business Proposal Presentation
Make your pitch stand out with a polished, minimal design that highlights every key stage of your business strategy. This clean visual layout is perfect for outlining project phases, services, or data-driven insights with clarity and impact. Fully compatible with PowerPoint, Keynote, and Google Slides for easy customization.


12 diapositivas
Quarterly Status Report Presentation
Crafted for clarity and impact, the Quarterly Status Report presentation template efficiently summarizes a period's achievements and insights. The opening slide immediately captivates the audience, clearly setting the stage for a comprehensive review. Subsequent slides meticulously organize critical data points, from financial forecasts to project milestones, allowing for a granular examination of past performance. The report not only reflects on the quarter's outcomes but also offers a well-defined path forward, with strategic recommendations and a thoughtful action plan. Concluding on a note of gratitude, the template acknowledges the audience's time and consideration, while the final credits slide ensures due recognition of all informational sources used throughout the presentation.


4 diapositivas
Idea Validation and Business Feasibility Presentation
Clarify your strategy with the Idea Validation and Business Feasibility Presentation. This layout uses a sleek, linear flow anchored by a central lightbulb icon to guide your audience through three key checkpoints—validation, feasibility, and readiness. Each step is color-coded and icon-marked to enhance clarity. Fully editable in PowerPoint, Canva, Google Slides, and Keynote.


5 diapositivas
Venn Diagram Comparison Slide Presentation
Bring clarity to your ideas with a layered visual that makes comparing multiple concepts feel effortless and engaging. This presentation helps you highlight differences, similarities, and key insights using clean shapes and simple labels. Fully customizable and compatible with PowerPoint, Keynote, and Google Slides.