


Características


¿Tienes alguna pregunta?
Recomendar


6 diapositivas
Business Journey Roadmap Planning Presentation
Map out strategic progress with this Business Journey Roadmap Planning presentation. Ideal for outlining key steps, milestones, and achievements, this staircase-style layout visually guides your audience through your business journey. Fully editable in Canva, PowerPoint, and Google Slides—perfect for project planning, goal setting, and executive updates.


4 diapositivas
Business Development Roadmap Presentation
Visualize your growth journey with this Business Development Roadmap Presentation. Featuring a winding road design with four milestones, it’s perfect for showcasing project phases, strategic goals, or quarterly plans. Each checkpoint is color-coded and icon-based for easy comprehension. Fully editable in PowerPoint, Keynote, and Google Slides.


6 diapositivas
Market Segmentation by Demographics
Visually break down consumer behavior by gender with this clean, gender-split demographic chart. Ideal for marketing analysts and business strategists, this slide highlights key audience insights, purchasing trends, or engagement metrics. Fully editable in PowerPoint, Keynote, and Google Slides.


7 diapositivas
RAPID Traceability Matrix Infographic
The RAPID Traceability Matrix infographic template provides a visual tool for mapping out decision-making roles within project management. Compatible with PowerPoint, Google Slides, and Keynote, this template array features various layouts to assign and display the roles of Recommend, Agree, Perform, Input, and Decide across multiple team members and project tasks. Utilizing a clean and organized design, each slide incorporates colored icons and matrix tables to clearly delineate responsibilities. This approach helps in clarifying the decision-making process and ensuring accountability within project teams.


5 diapositivas
RACI Responsibility Assignment Matrix Presentation
Streamline project management with our RACI Responsibility Assignment Matrix presentation template. This tool is designed to clarify team roles and responsibilities, ensuring everyone knows their tasks and duties. The template uses a color-coded system for quick reference, perfect for project managers and team leads. It's compatible with PowerPoint, Keynote, and Google Slides, making it a versatile choice for any professional setting.


7 diapositivas
World Map Population Infographic Presentation
A World Map is a representation of the Earth's surface, showing the outlines and its continents, countries, oceans, and other features. This template is designed to show the distribution of the world's population in a visually stunning way. Quickly and easily customize with your own data and you'll have an infographic that will engage your audience and convey your message. It comes in three different colors, so you can divide it how you need and change the color of certain sections. This template also includes several labels with colors, and charts showing distribution across countries.


5 diapositivas
Wellness Program and Public Health Overview Presentation
Give your health data a clean, visual voice with this engaging infographic layout. Designed to showcase wellness programs, public health statistics, or fitness data, this slide maps key points alongside a human body silhouette to enhance clarity. Easy to edit and compatible with PowerPoint, Keynote, and Google Slides for seamless customization.

1 diapositiva
Geometric Shapes for Visual Clarity Presentation
Present your ideas with precision using this geometric-themed slide layout. Featuring four diamond icons in vibrant outline styles, this template is perfect for breaking down key business concepts. Ideal for professional briefings, marketing plans, or strategy decks. Fully customizable in Canva, PowerPoint, Keynote, and Google Slides.


5 diapositivas
Corporate Risk Assessment Slide Presentation
Streamline complex evaluations with a clean, step-by-step visual that guides your audience through key business risks and mitigation strategies. Ideal for planning sessions or executive reports, this modern design helps simplify communication and enhance decision-making. Fully compatible with PowerPoint, Keynote, and Google Slides for seamless editing and presentation.


4 diapositivas
4-Level Funnel Analysis Diagram Presentation
Give your insights a clear path to follow with this clean, modern diagram built to simplify layered decision-making. This presentation breaks complex stages into four easy-to-read levels, helping you explain flow, priorities, and performance with confidence. Fully compatible with PowerPoint, Keynote, and Google Slides.


2 diapositivas
Website UI Mockup Device Display Presentation
Showcase your website's interface with the Website UI Mockup Device Display slide. This professional and modern layout features a desktop screen to elegantly present your web design, user interface, or digital product. Perfect for designers, developers, and marketing presentations. Fully editable and compatible with PowerPoint, Keynote, and Google Slides.


12 diapositivas
Banking Offers and Card Perks Overview Presentation
Showcase financial benefits clearly with this Banking Offers and Card Perks Overview Presentation. Designed with a bold payment terminal and card visual, this layout helps you highlight key rewards, cashback deals, and special cardholder perks. Ideal for banks, fintechs, and retail loyalty programs. Fully editable in PowerPoint, Keynote, and Google Slides.


7 diapositivas
Sales Funnel Infographic Presentation Template
The Sales Funnel is a marketing concept that is a useful tool for marketers to understand how people evaluate and decide their product or service. A sales funnel is a consumer-focused marketing model with the aim of making a sale. There are several steps to a sales funnel, usually known as top, middle, and bottom of the funnel, these vary from one model to another. With this template, you'll learn how to build a sales funnel that works best for your business and generates more leads and sales. This sales funnel template is designed to plan out your marketing strategy and is easy to use.


5 diapositivas
Yearly Employee Performance Review Presentation
Celebrate your team’s progress with a modern, data-rich design that’s clear, visual, and professional. This template makes it easy to present yearly performance metrics, individual achievements, and growth comparisons through engaging charts and infographics. Perfect for annual reports and reviews. Compatible with PowerPoint, Keynote, and Google Slides for effortless editing.


4 diapositivas
Product & Pricing Plan Matrix Presentation
Simplify complex pricing and product details with the Product & Pricing Plan Matrix Presentation. This structured grid layout is ideal for comparing multiple service tiers, packages, or feature sets side-by-side. Easily customizable, each block allows you to highlight key offerings, benefits, and pricing strategies. Compatible with Canva, PowerPoint, Keynote, and Google Slides.


20 diapositivas
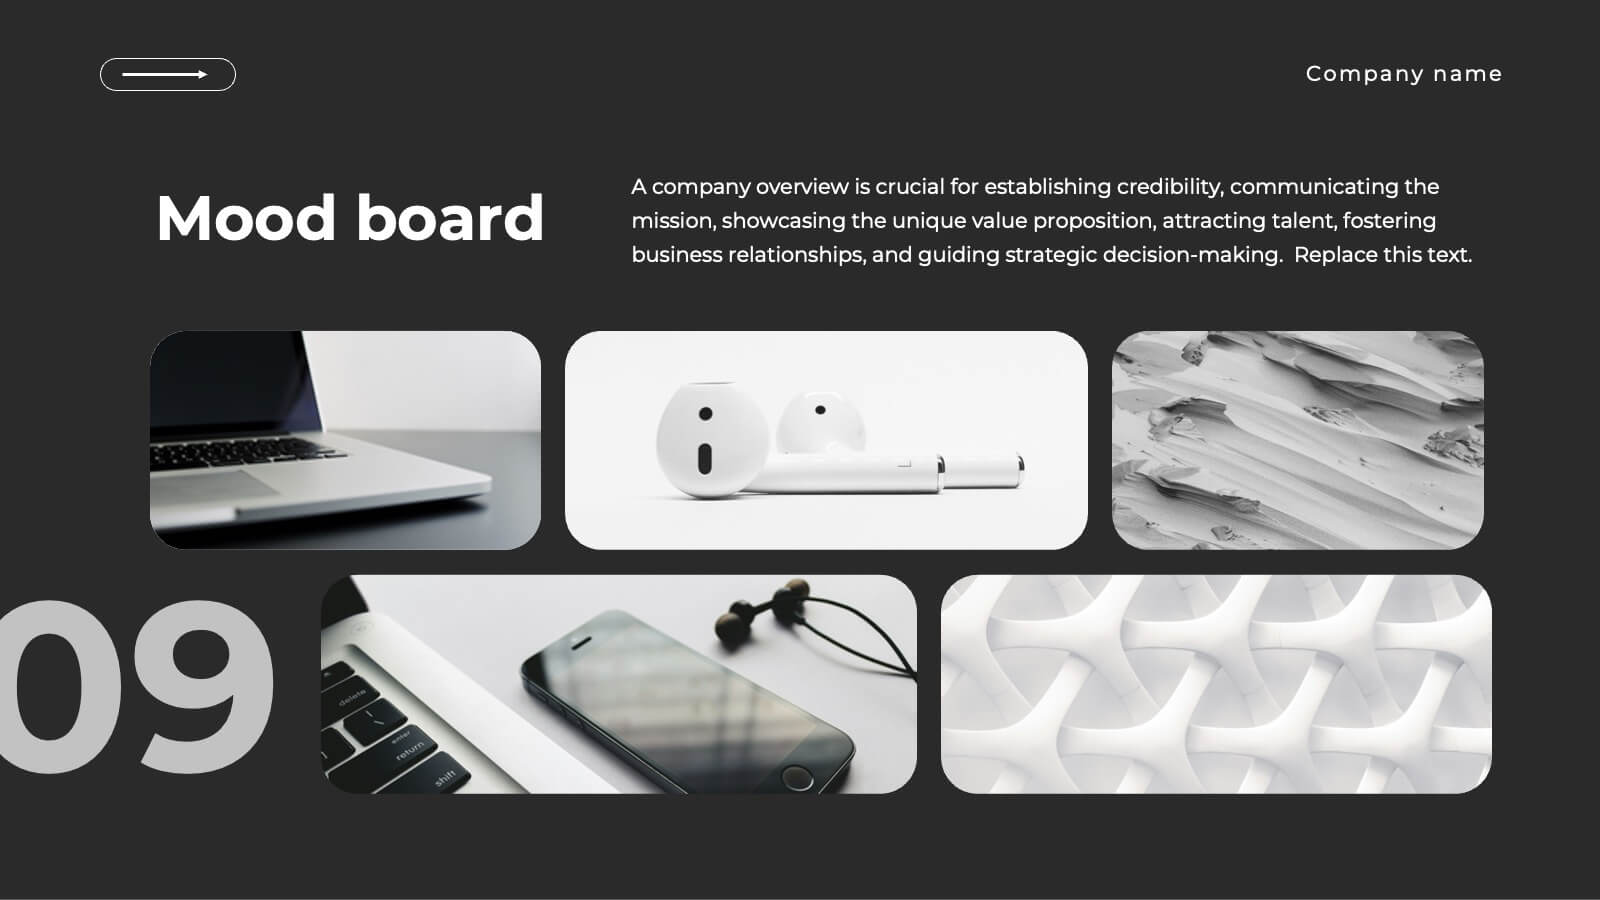
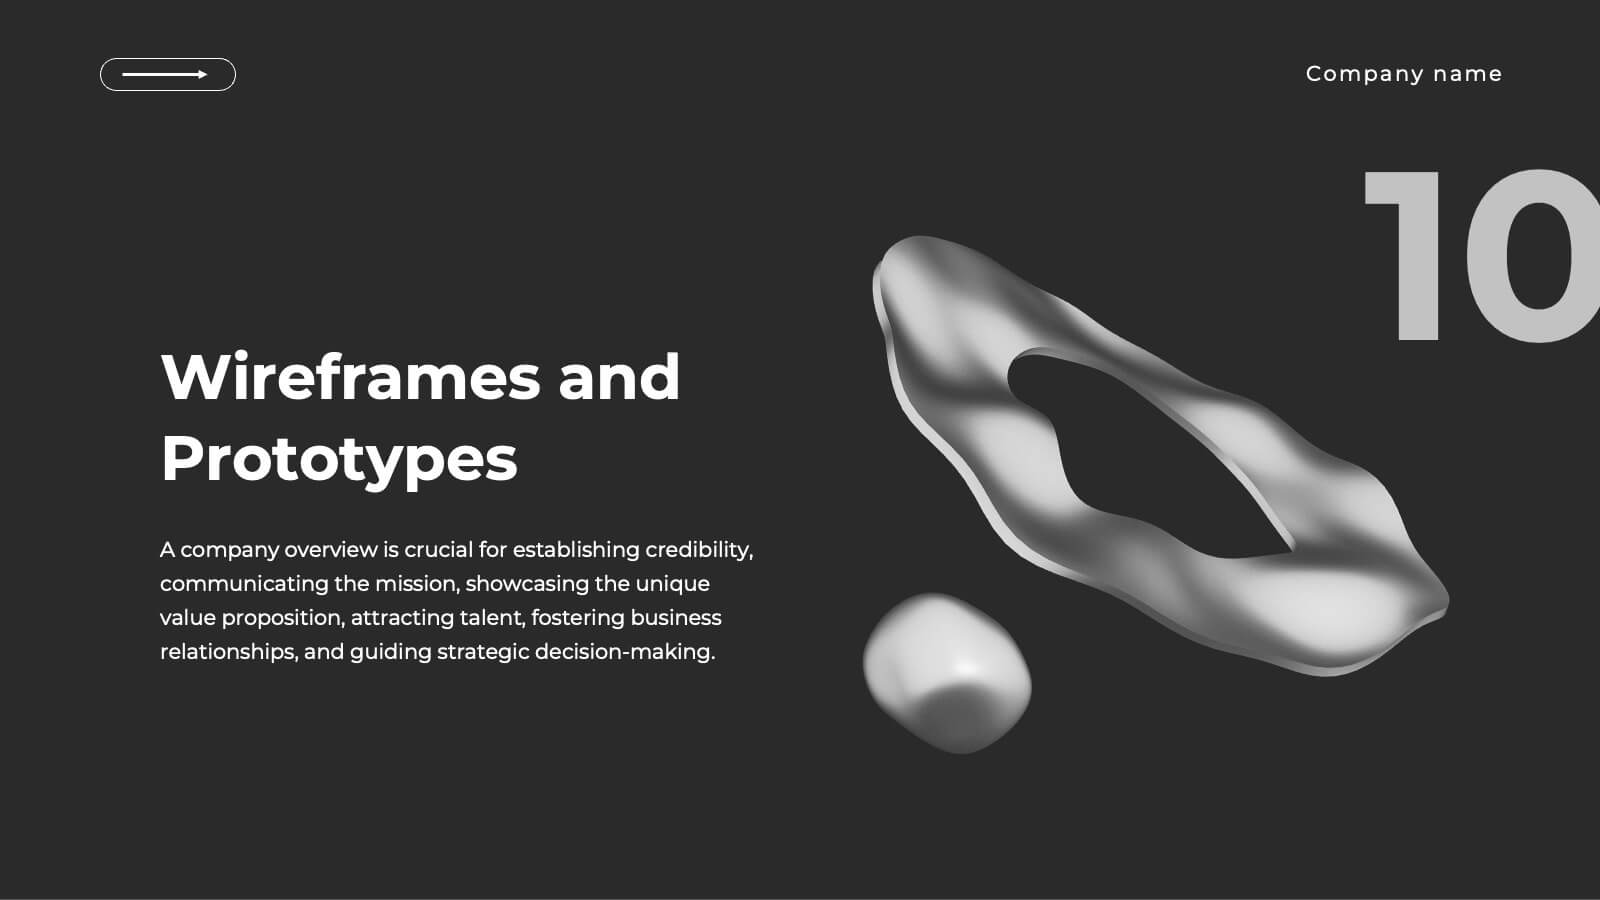
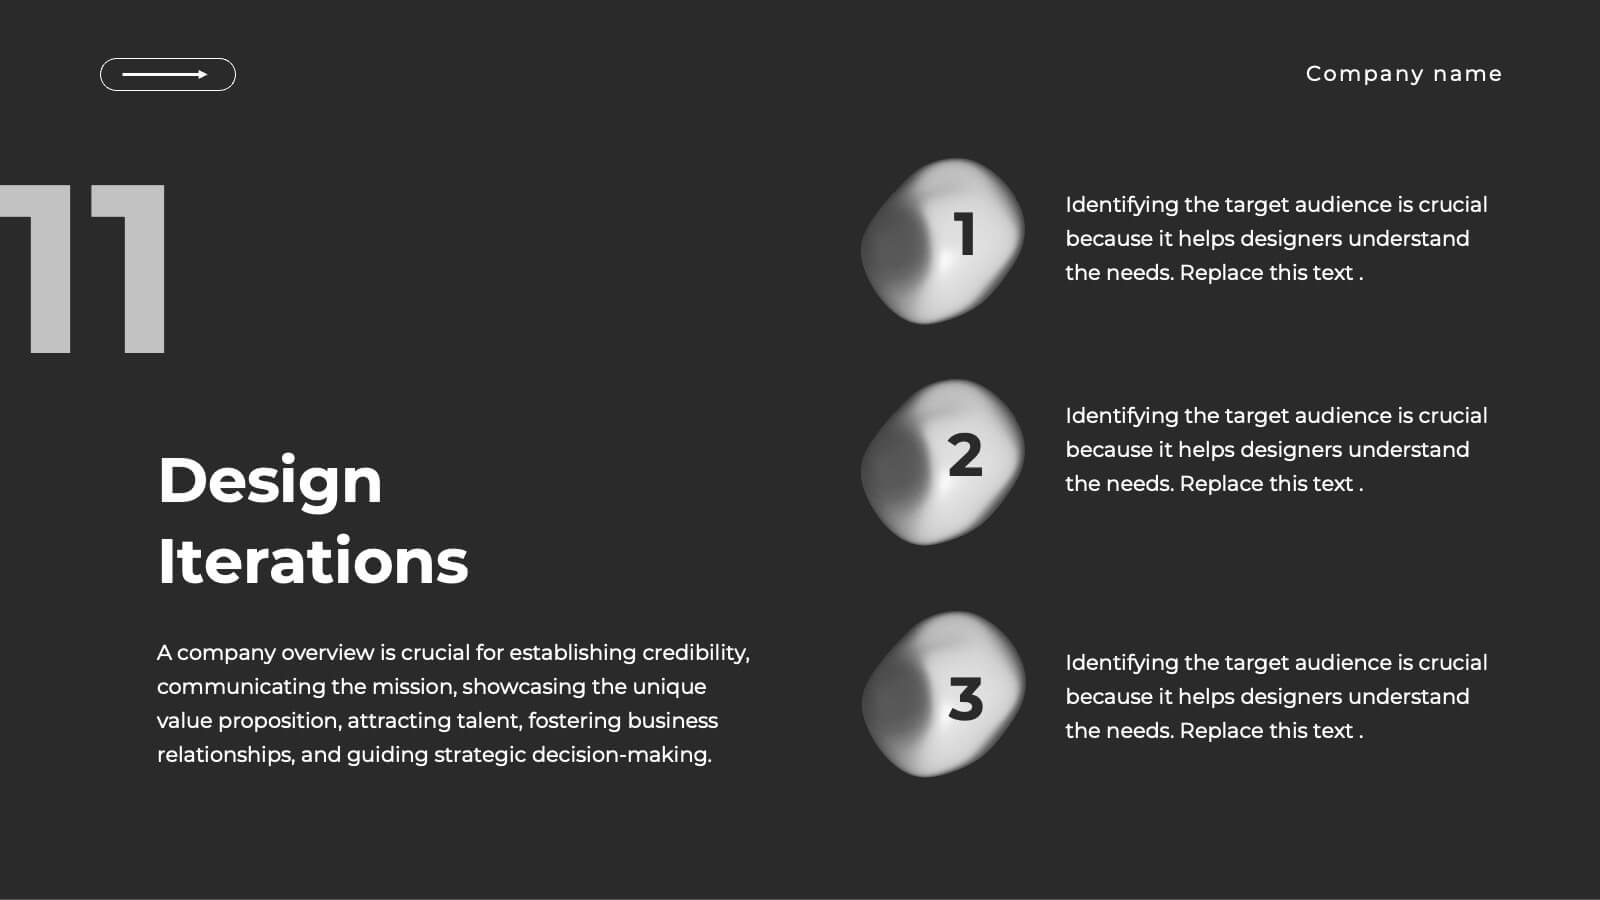
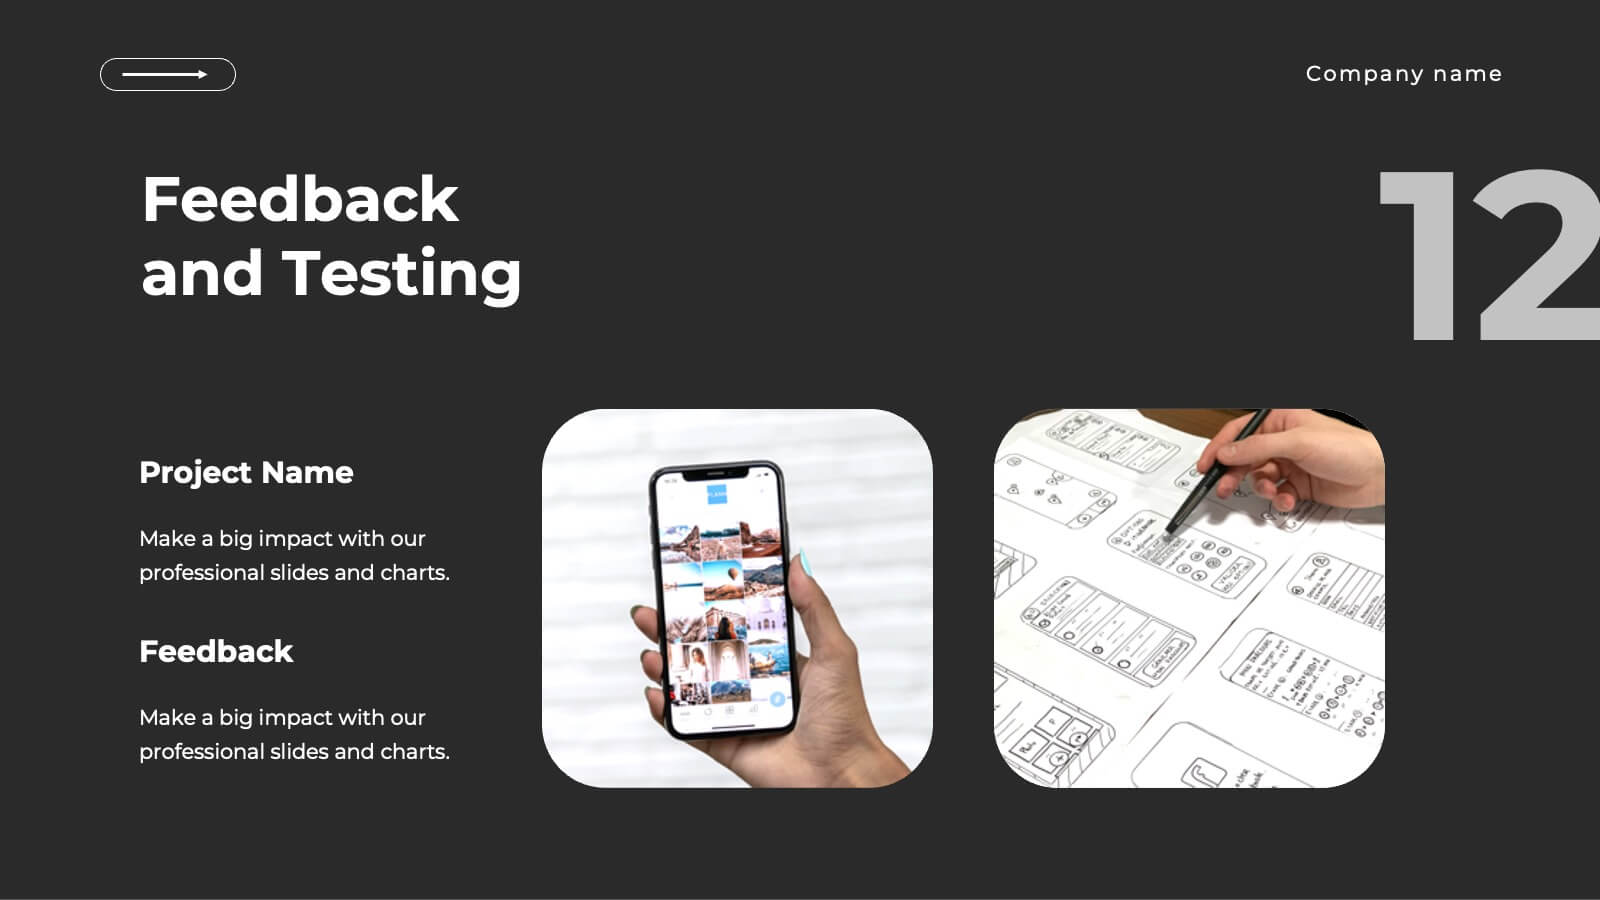
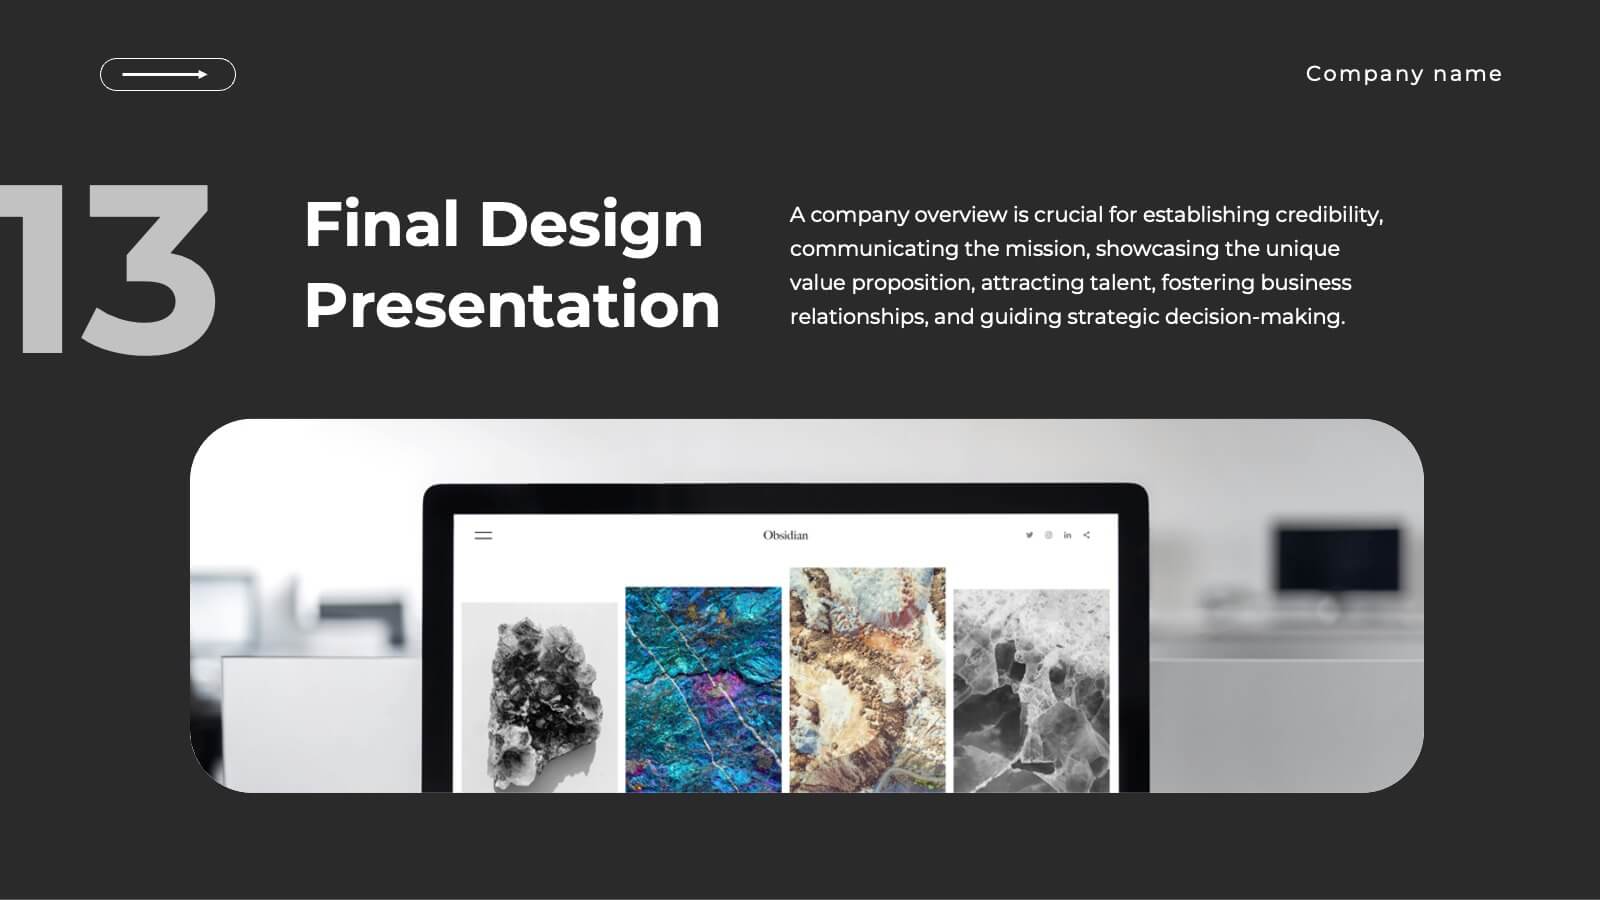
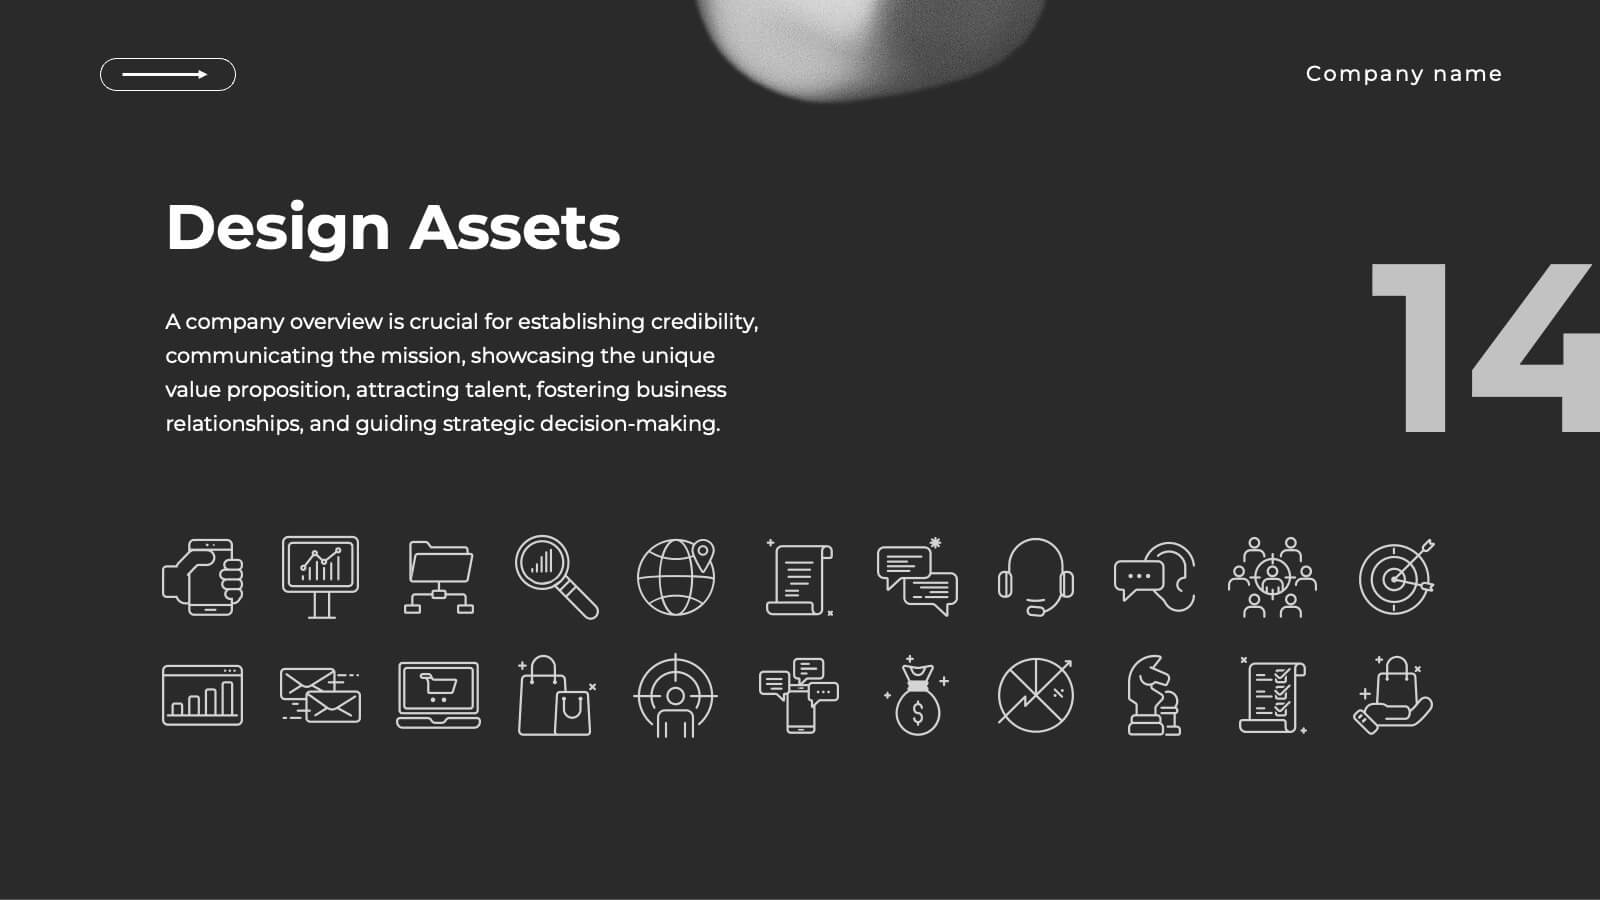
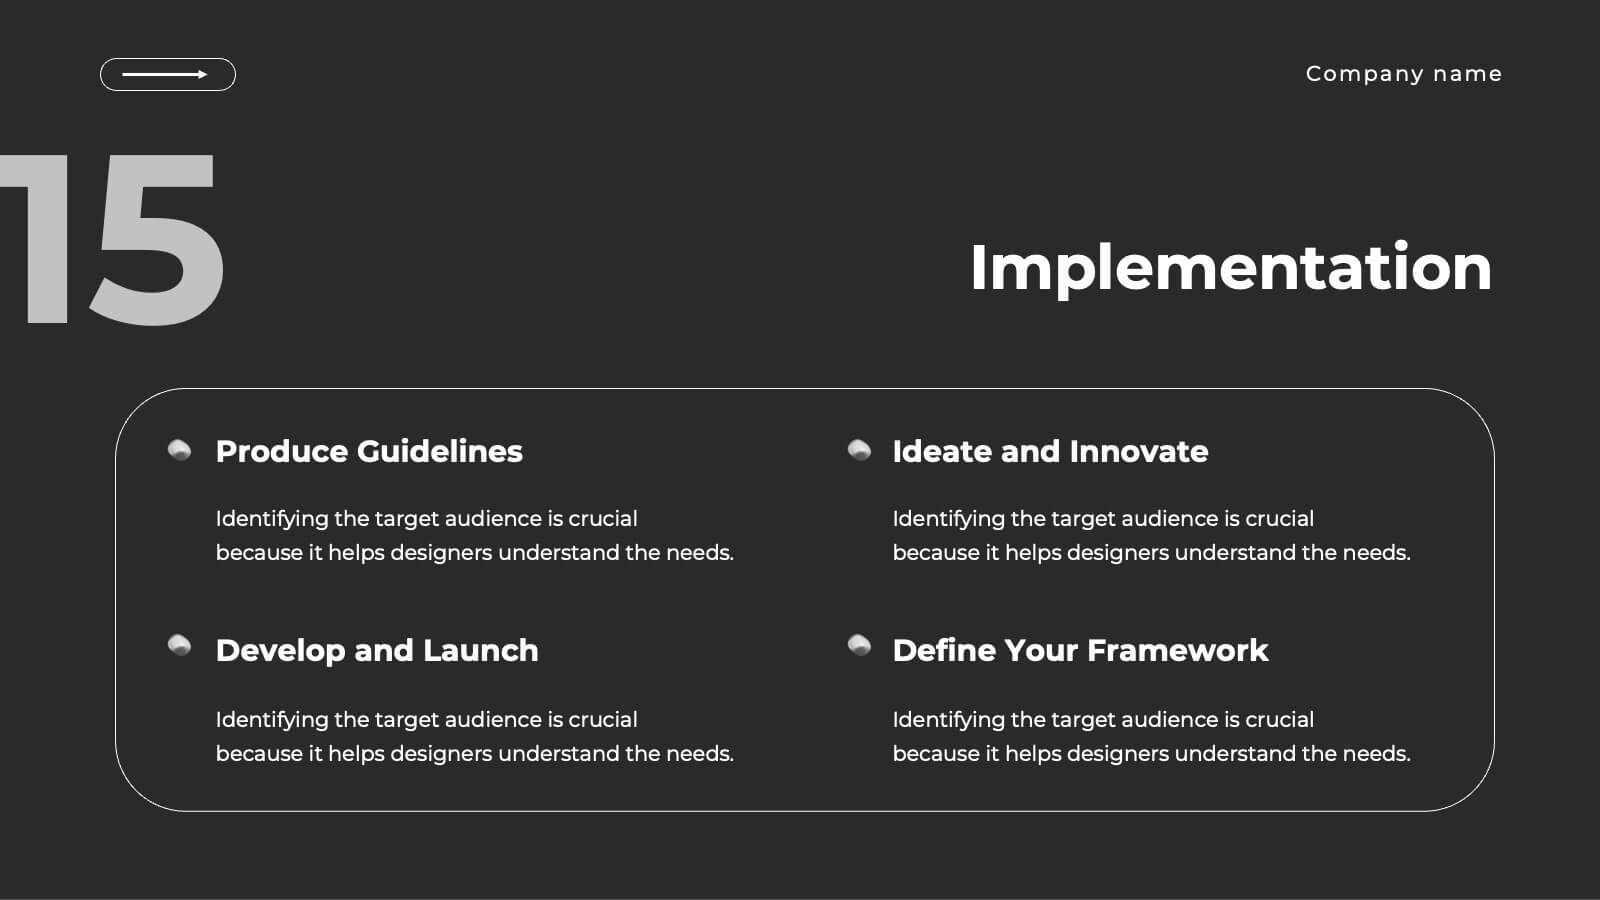
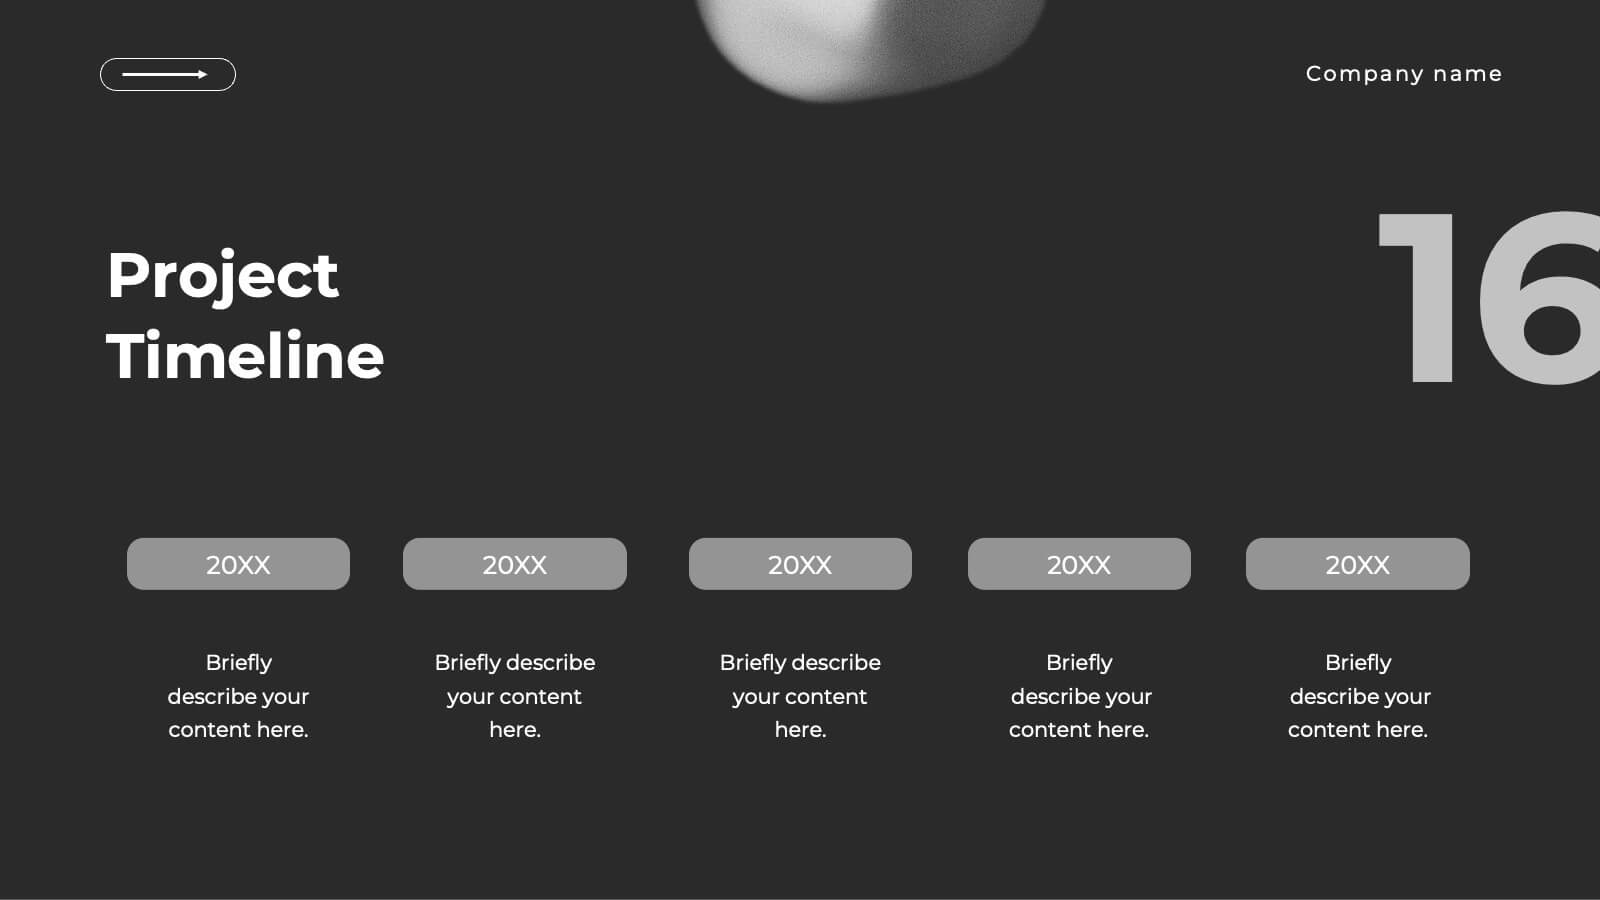
Realm UX UI Design Pitch Deck Presentation
Present your UX/UI design process with this sleek and modern design template! It covers everything from concept development to wireframes, prototypes, design iterations, and final design presentation. Fully customizable and compatible with PowerPoint, Keynote, and Google Slides, it’s perfect for design teams and professionals looking to showcase their creative process effectively.


8 diapositivas
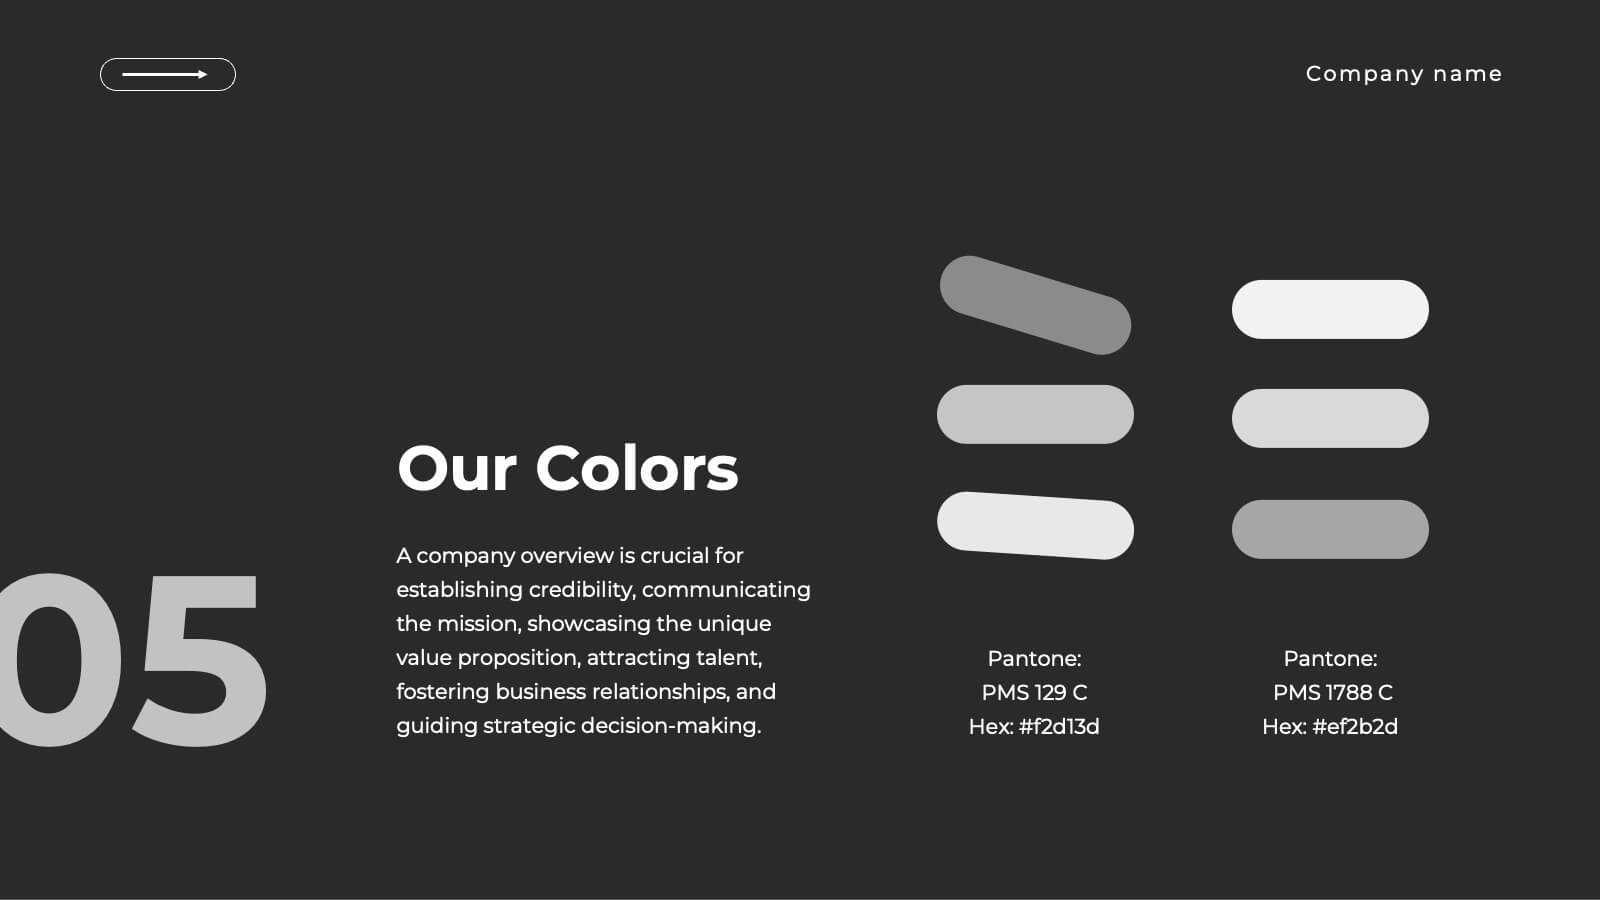
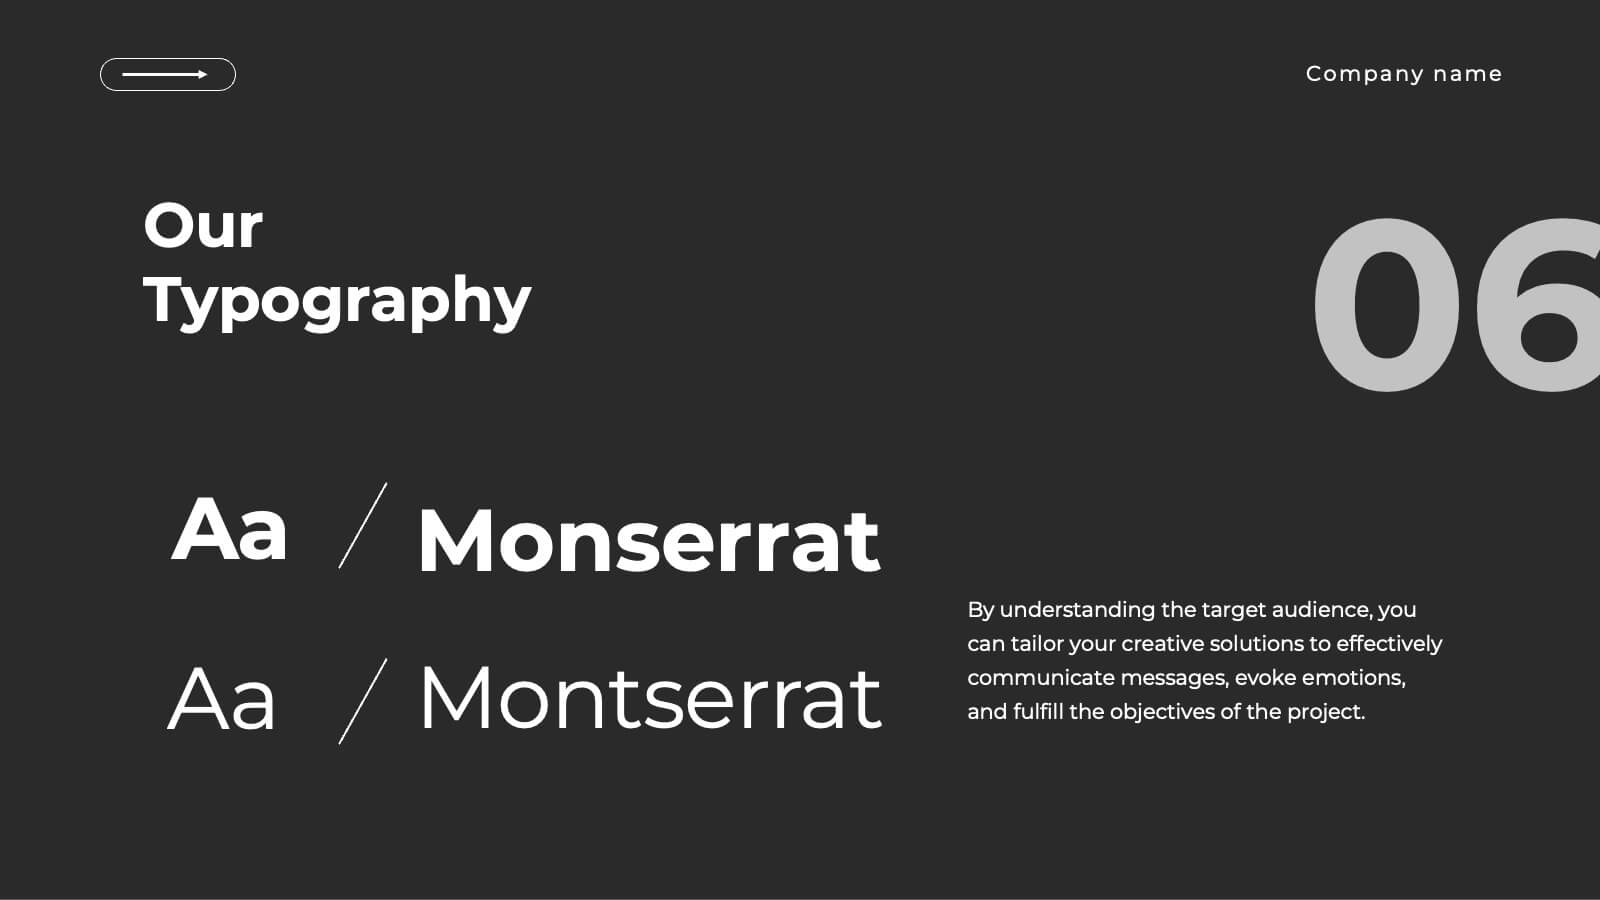
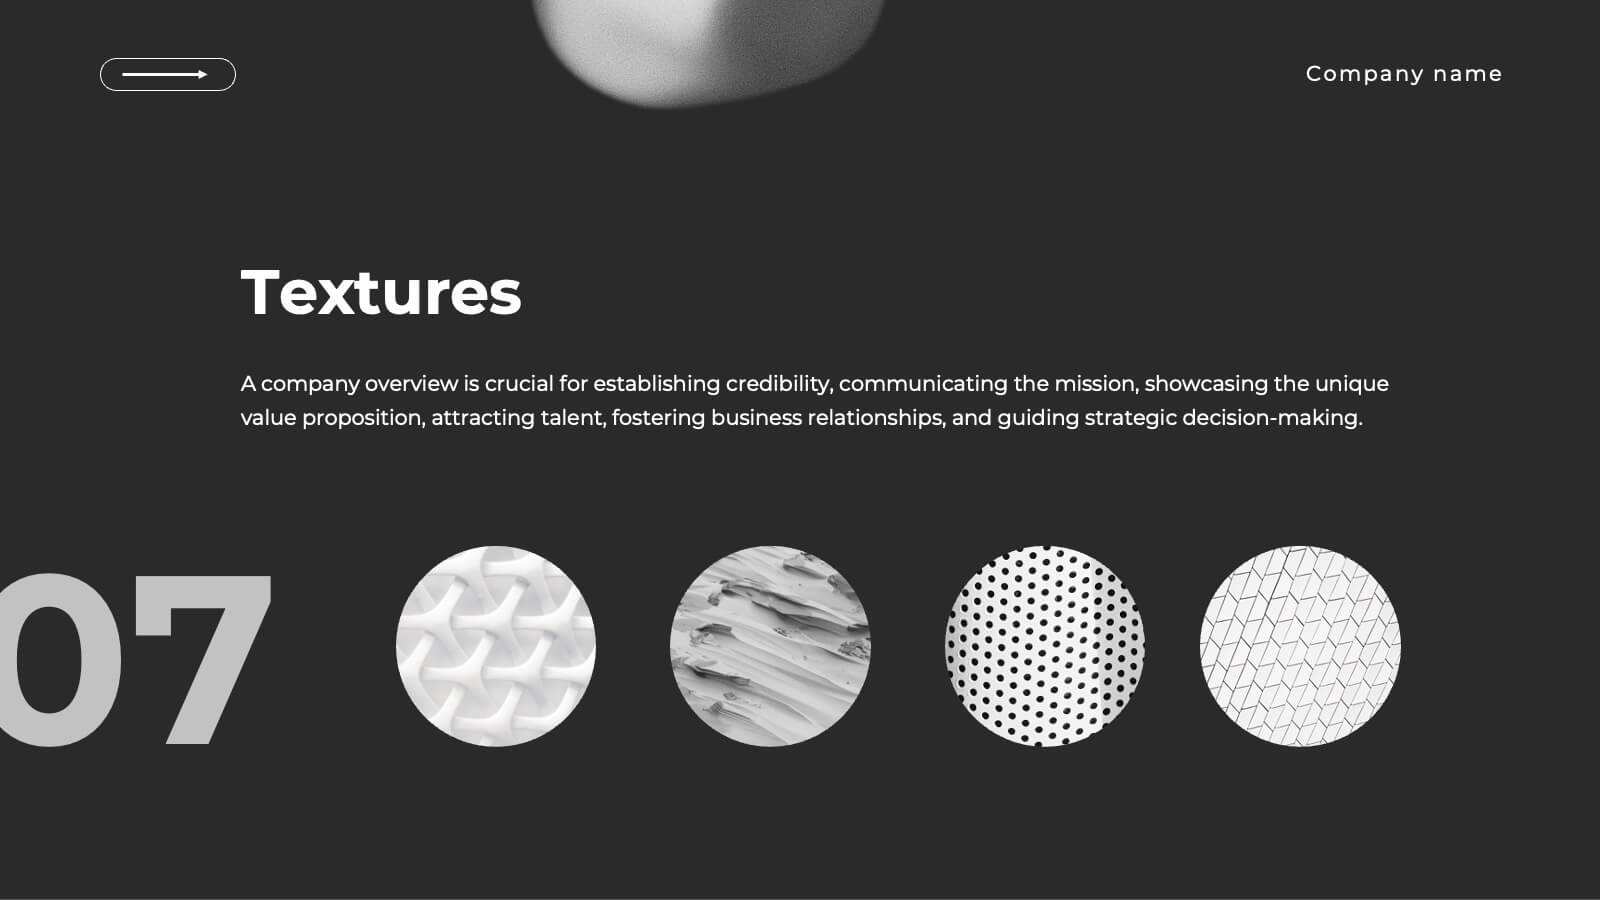
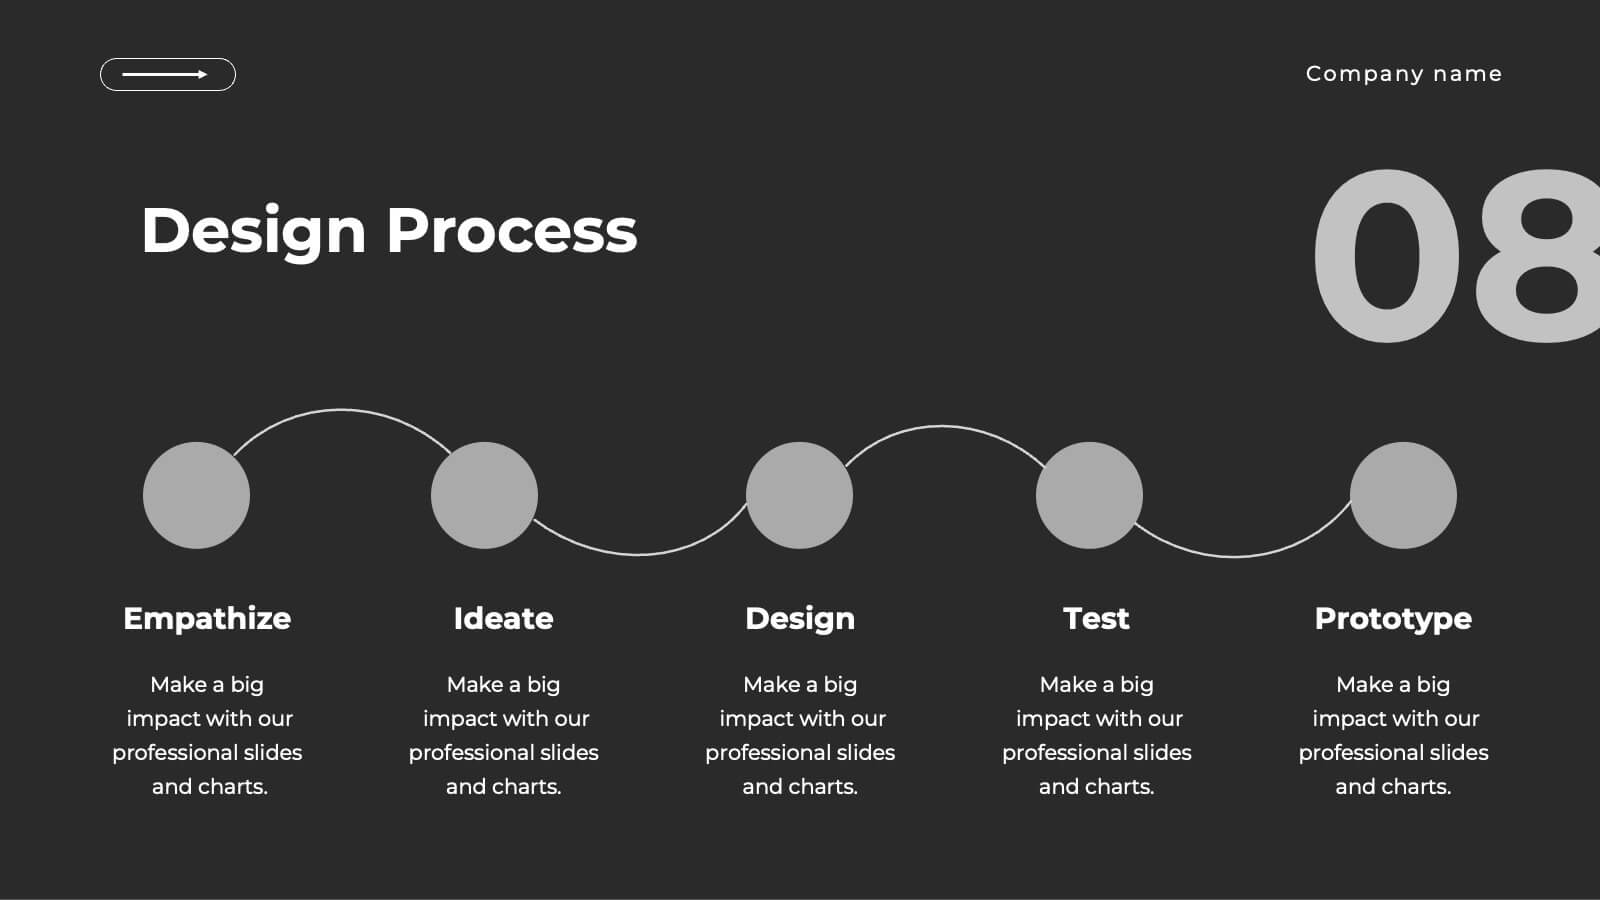
Geometric Design Elements Presentation
The "Geometric Design Elements" presentation template features a modern layout utilizing geometric shapes to organize and present data effectively. Each slide provides a unique configuration of circles or connected shapes, facilitating clear visualization of interconnected topics or categories. These design elements are ideal for displaying business insights, relationships between concepts, or summarizing key points in a visually appealing and easily digestible format. The use of varied colors helps to distinguish between different sections or ideas, enhancing the viewer's ability to follow and absorb the presented information efficiently. This template is suitable for business presentations that require a balance of aesthetic appeal and functional design to communicate complex information clearly.