


Características


¿Tienes alguna pregunta?
Recomendar


7 diapositivas
Root Cause Analysis for Problem Solving Presentation
Identify and Resolve Issues Effectively with this Root Cause Analysis for Problem Solving presentation template. Designed to streamline complex problem-solving, this layout features clear visual markers, structured iconography, and step-by-step segmentation to help teams analyze causes, pinpoint bottlenecks, and implement solutions efficiently. Ideal for project managers, business analysts, and operational teams, this template is fully customizable and works seamlessly in PowerPoint, Keynote, and Google Slides, ensuring a professional and engaging presentation experience.


7 diapositivas
Cloud Services Infographic Presentation
A Cloud Infographic is a type of visual representation that uses graphic design elements and data to explain and illustrate the concept of cloud computing. This cloud infographic template uses diagrams, charts, and other graphical elements to showcase the benefits and features of cloud computing. This can be used for businesses, education, and individuals to understand and promote the concept of cloud computing. This Cloud template has been designed in a simple but effective style that allows you to focus on your content. This template is designed for powerpoint, keynote and google slides.


5 diapositivas
North America Business Landscape Map Presentation
Explore the business terrain with the "North America Business Landscape Map" template, which delivers a comprehensive visualization of business data across various regions. Designed for strategic presentations, it enables clear communication of market insights and data points, crucial for decision-making. This template is compatible with PowerPoint, Keynote, and Google Slides, enhancing its utility for professionals in diverse fields.


3 diapositivas
Corporate Sustainabilitiy Management Strategy Presentation
Drive your company’s future with a presentation that blends strategy, innovation, and sustainability. Designed to communicate eco-friendly initiatives and long-term business goals, it helps visualize performance, impact, and growth clearly. Fully customizable and compatible with PowerPoint, Keynote, and Google Slides for seamless, professional, and engaging sustainability presentations.


3 diapositivas
Financial Cost Management Strategies
Break down your financial action plan with the Financial Cost Management Strategies Presentation. Featuring a dynamic 3-step arc design, this template is ideal for illustrating cost-saving initiatives, expense control methods, or phased budget implementation strategies. Each curved step includes space for icons, step numbers, titles, and concise descriptions, making it easy to communicate each stage clearly. Fully editable in PowerPoint, Keynote, and Google Slides, it’s perfect for finance teams, consultants, or operations leaders.


8 diapositivas
Inbound and Outbound Value Chain Strategy Presentation
Streamline your supply chain insights with the Inbound and Outbound Value Chain Strategy Presentation. This structured layout highlights the key components of internal and external logistics—from sourcing and procurement to product delivery. Use this template to showcase strategic operations, process optimization, and value-adding activities. Fully editable in PowerPoint, Keynote, Canva, and Google Slides.


12 diapositivas
Corporate Sustainability Strategy Presentation
Achieve your sustainability goals with the Corporate Sustainability Strategy Presentation template. This modern, visually engaging layout helps businesses showcase their environmental, social, and governance (ESG) initiatives, sustainability roadmaps, and corporate responsibility plans. Featuring clear, structured sections, this fully customizable design is perfect for corporate leaders, consultants, and eco-conscious organizations. Compatible with PowerPoint, Keynote, and Google Slides for effortless editing and presentation.


20 diapositivas
Aurorium Sales Proposal Presentation
Win over clients with confidence using this sleek and modern sales proposal presentation. Designed to highlight key business strategies, pricing plans, competitive analysis, and future opportunities, this template helps you communicate your value with clarity and impact. Fully customizable and compatible with PowerPoint, Keynote, and Google Slides for seamless presentations.


5 diapositivas
Business Annual Report Summary Presentation
Clear, Concise, and Impactful! The Business Annual Report Summary Presentation template helps you present key performance indicators, financial metrics, and company growth in a professional and visually engaging way. Fully customizable and compatible with PowerPoint, Keynote, and Google Slides, it’s ideal for executives and analysts aiming for a compelling data-driven presentation.


6 diapositivas
Breast Cancer Effects Infographic
Breast Cancer Awareness Month, is an annual international health campaign organized by various organizations to raise awareness about breast cancer, highlight the importance of early detection and treatment, and provide support for those affected by the disease. This infographic template is a visual representation that provides information about the various effects and impacts of breast cancer on individuals' health, well-being, and daily lives. This infographic can be used to raise awareness, educate, and support individuals who are affected by breast cancer, as well as their families and communities.


12 diapositivas
Personal Portfolio Presentation
Our Personal Portfolio Presentation template is designed for professionals looking to make a strong impression with a sleek and engaging portfolio. This comprehensive template provides an excellent framework to showcase your personal brand, professional journey, and achievements. The opening slide, with your name boldly presented, acts as your introduction. It's followed by a 'Get to know me' section that offers a glimpse into your personality and work ethic. The 'Skills' slide is a visually impactful way to present your competencies, while the 'Experience' slide chronologically outlines your professional milestones. Featuring sections for detailed case studies, showcased projects, and educational background, this template helps you tell your story in a cohesive and captivating manner. The 'Recognitions' slide allows you to highlight awards and honors, adding credibility to your profile. Ending with a compelling 'Let's work together!' call-to-action, this template is adaptable to PowerPoint, Keynote, and Google Slides, perfect for anyone looking to stand out in their field.


20 diapositivas
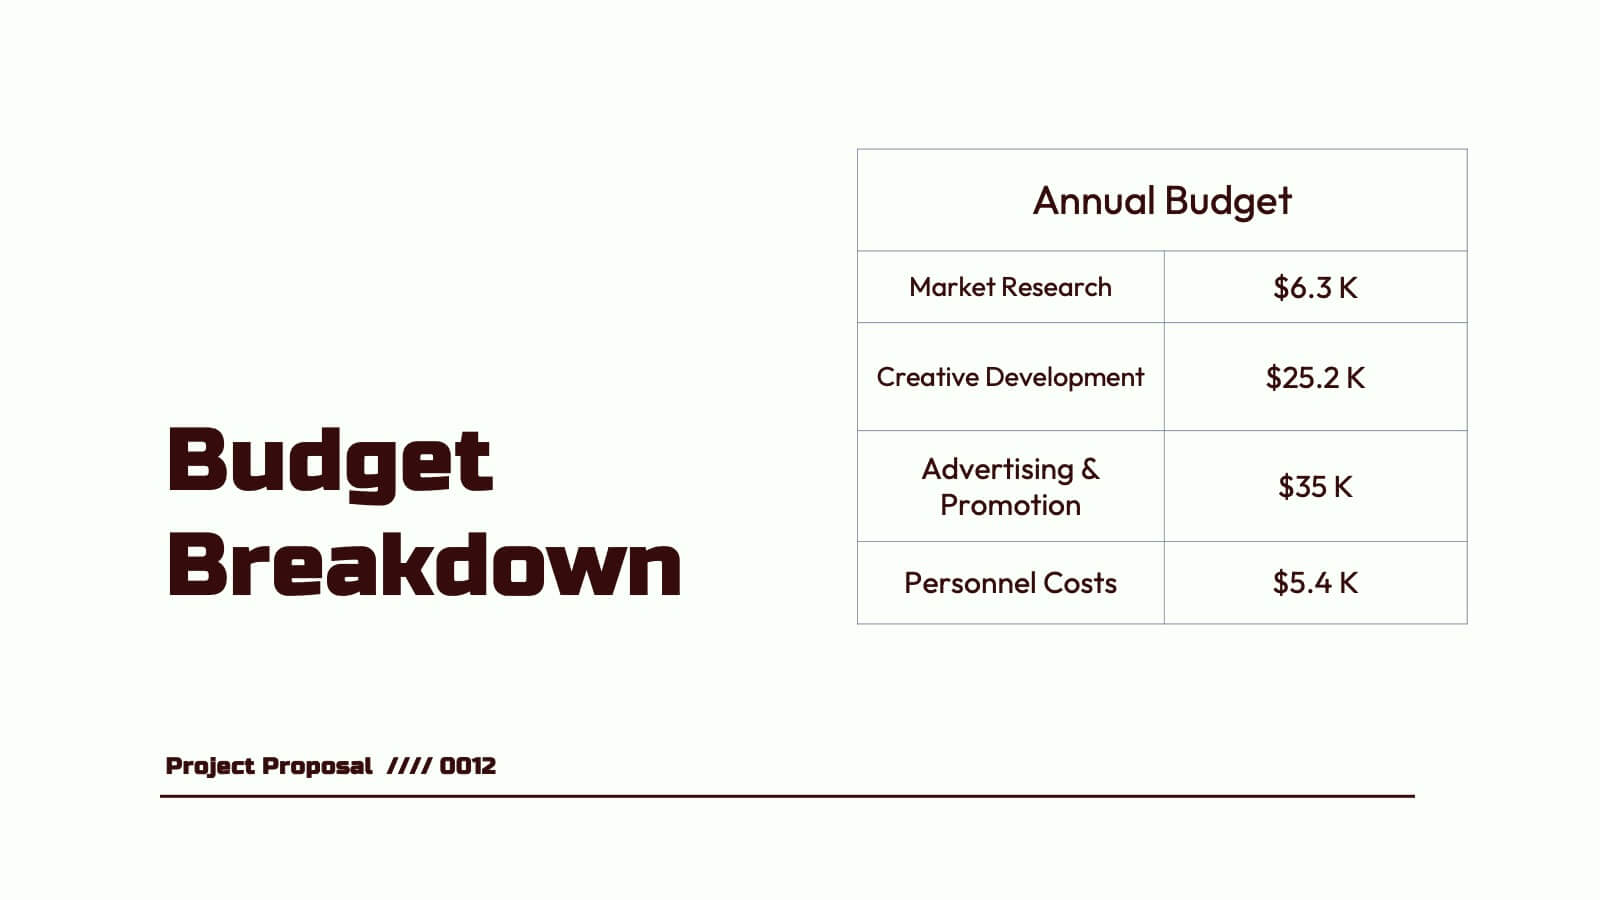
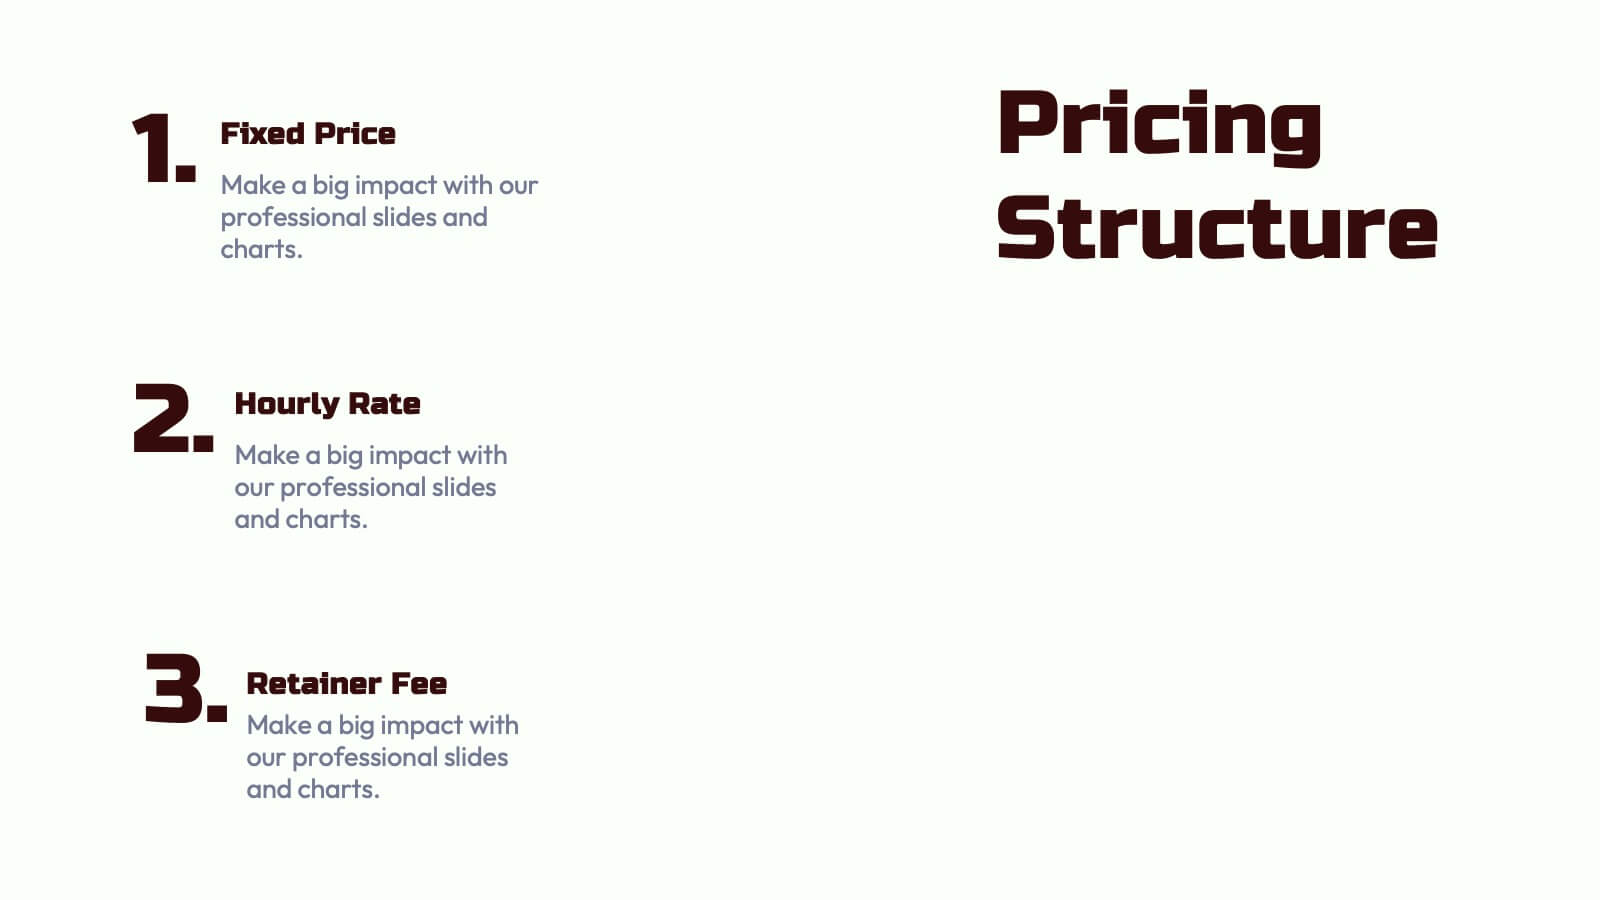
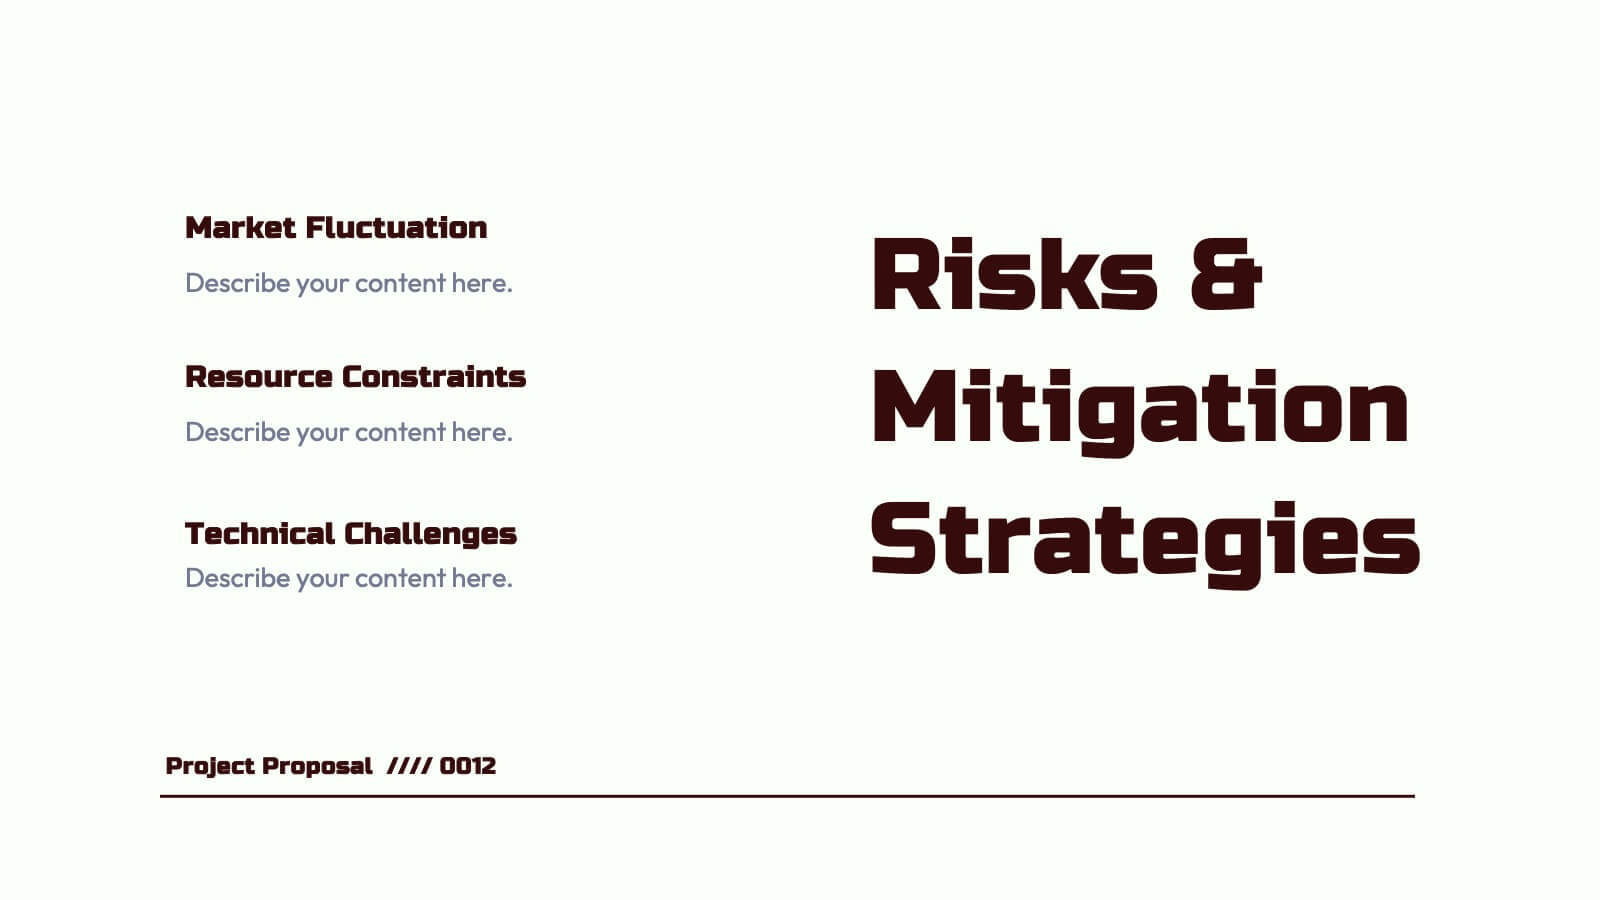
Nebula Project Proposal Presentation
Create a compelling project proposal with this structured, professional template! It includes sections for problem statements, proposed solutions, goals, timelines, and pricing. Perfect for organizing your ideas clearly and professionally, it's fully customizable and compatible with PowerPoint, Keynote, and Google Slides. This template makes it easy to present your proposals effectively and win clients.


8 diapositivas
Statistical Data Visualization Presentation
Bring Your Data to Life! The Statistical Data Visualization Presentation transforms complex information into clear, engaging visuals. Designed for professionals who need to showcase trends and insights, this template uses dynamic graphs and color-coded sections for clarity. Fully editable and compatible with PowerPoint, Keynote, and Google Slides for effortless customization.


7 diapositivas
Success Business People Infographic Presentation
A Business People Infographic is a visual representation of data and information related to various aspects of business and the people involved in it. This infographic is a great way to illustrate your topic, point by point. This is an ideal template for making professional business presentations. This template is fully editable, perfect for business presentations and meetings. It includes all of the graphics you need to shows your audience interesting statistics and data. Compatible with Powerpoint, Keynote and Google Slides, your audience will be impressed by the dynamic slides!


4 diapositivas
Business Partnership Development Presentation
Showcase key elements of collaboration with the Business Partnership Development Presentation. This quadrant-style layout is perfect for outlining strategies, stakeholders, or phases of a partnership. Ideal for business proposals, joint ventures, and strategic planning decks. Fully editable in PowerPoint, Keynote, and Google Slides.


2 diapositivas
Breast Cancer Awareness Infographics Presentation
Empower your message with a bold, meaningful design that spreads awareness and inspires action. This impactful layout uses visual balance and clear data points to highlight key statistics, health information, or campaign goals. Fully editable and compatible with PowerPoint, Keynote, and Google Slides for effortless customization and professional presentations.


5 diapositivas
Aviation Industry Market Analysis
Break down key metrics in the aviation sector with this sleek, aircraft-themed layout. Ideal for highlighting five data points or insights, each icon aligns with a section of the airplane to reinforce structure and clarity. Perfect for presentations on industry trends, airline strategies, or market performance. Fully editable in PowerPoint, Keynote, and Google Slides.