


Características


¿Tienes alguna pregunta?
Recomendar


5 diapositivas
Student Progress Report Presentation
Track academic milestones with this Student Progress Report Presentation. Featuring a stair-step puzzle layout topped with a graduation cap, it visually represents growth across four key areas. Ideal for educators, counselors, or school administrators. Fully editable in PowerPoint, Keynote, and Google Slides.


6 diapositivas
Personal Goals Infographics
The "Personal Goals" infographic template is a highly motivational and visually engaging resource, crafted specifically for PowerPoint, Keynote, and Google Slides. This template is perfect for life coaches, educators, and individuals looking to visually articulate their personal objectives and action plans. This template adeptly encapsulates key facets of personal goal setting, including short-term and long-term objectives, milestones, and strategies for achievement. The design promotes a clear depiction of each goal, along with the steps and timelines necessary for success. This makes it an invaluable tool for personal development workshops, coaching sessions, or even individual self-reflection and planning. The aesthetic of the template is uplifting and focused, with a color scheme that inspires positivity and determination. This not only makes the presentation visually appealing but also resonates with the theme of personal growth and ambition. Whether used for motivational seminars, educational purposes, or personal planning, this template ensures that the journey towards personal goals is laid out in a visually stimulating, organized, and inspiring manner.


5 diapositivas
Business Statistics Infographic Report Presentation
Present data with clarity using the Business Statistics Infographic Report presentation. This layout combines clean bar graphs, donut charts, and legends to showcase KPIs, progress benchmarks, and segmented insights. Ideal for quarterly reviews, executive updates, or client reporting. Fully editable in PowerPoint, Keynote, or Google Slides.


4 diapositivas
Core Company Value Mapping Presentation
Spotlight your business strengths with the Core Company Value Mapping Presentation. This slide design helps you break down and compare key value drivers using a structured visual format—ideal for internal strategy discussions, executive briefings, or stakeholder updates. Highlight metrics, priorities, or departments with side-by-side percentage comparisons and icon indicators. Fully editable in PowerPoint, Keynote, and Google Slides. A must-have for operations teams, consultants, and leadership presentations.


6 diapositivas
Prevention and Support Breast Cancer Strategy Presentation
Deliver powerful insights with the Prevention and Support Breast Cancer Strategy Presentation. Designed for impact, this layout uses gender icons, ribbons, and clear percentage visuals to present awareness, research data, and healthcare strategies. Ideal for advocacy groups, nonprofit campaigns, or medical briefings. Fully editable in PowerPoint, Keynote, Google Slides, and Canva.


6 diapositivas
Editable Weekly Calendar Slide Presentation
Bring your week into focus with a vibrant layout that turns daily planning into something you actually look forward to. This presentation helps you outline tasks, deadlines, and priorities in a clear, color-coded structure perfect for productivity. Fully editable and compatible with PowerPoint, Keynote, and Google Slides.


5 diapositivas
Business Insights Through Dashboard Visualization Presentation
Visualize key metrics with this Business Insights Through Dashboard Visualization presentation. The funnel chart layout is ideal for showcasing conversion rates, customer journeys, or sales processes. Each section includes clear labels and percentage indicators. Fully editable in Canva, PowerPoint, and Google Slides to suit your business reporting needs.
6 diapositivas
Sales Activity Tracking Presentation
Stay on top of performance metrics with the Sales Activity Tracking Presentation. This structured table layout helps you display key figures like sales numbers, targets, percentages, and totals with ease. Perfect for performance reviews, sales updates, and executive reports. Fully editable in Canva, PowerPoint, Google Slides, and Keynote.


26 diapositivas
Fundraising Event Presentation
Inspire generosity and support for your cause with our Fundraising Event presentation template, ideal for PowerPoint, Keynote, and Google Slides. This template is crafted with non-profit organizations, charity foundations, and event coordinators in mind, featuring a heartwarming design that encourages giving and communal effort. The slides are tailored to highlight the importance of philanthropy, with 'big image slides' to tell the stories of those you're helping, 'process infographics' to explain how donations are used, and 'chart slides' to show the impact of collected funds. The soothing color palette and thoughtful graphics create an atmosphere of hope and solidarity. Our Fundraising Event template is more than just a collection of slides; it's a powerful storytelling tool that can galvanize audiences into action. Download it now to create a moving presentation that not only shares the vision of your event but also rallies the community around your noble cause.


8 diapositivas
Professional Business Executive Summary Presentation
Make your insights stand tall with a bold, clean layout that feels like a data-driven story in motion. This executive summary slide is perfect for breaking down complex ideas into three clear steps, using sleek vertical bars to add visual rhythm. Compatible with PowerPoint, Keynote, and Google Slides for easy editing.


5 diapositivas
Decision Matrix Presentation
Make tough choices feel simple with this clear, color-coded layout designed to compare options side-by-side. This presentation helps you evaluate criteria, score alternatives, and present well-structured reasoning with confidence. Clean, intuitive, and fully editable. Compatible with PowerPoint, Keynote, and Google Slides.


7 diapositivas
PESTEL Analysis Infographic Presentation Template
A PESTEL Analysis Infographic is a great tool to highlight the risks and opportunities of a market. Based on the needs of your customers, this Infographic can help you communicate key information about competition, regulatory environment and economic outlook. This template can also be used for stocks of any company from any industry. This is a comprehensive pestel analysis infographic that will show you the factors that are driving and restraining the growth of your industry. This template can help companies to identify their weaknesses and drive their strengths with the pestel analysis.


6 diapositivas
Corporate Foundation and Pillars Presentation
Highlight your company's core principles with this visually impactful pillar-style slide. Designed to illustrate business frameworks, strategies, or guiding values, this layout helps communicate stability and growth. Fully customizable in PowerPoint, Keynote, and Google Slides for seamless brand alignment.


7 diapositivas
Environmental Infographic Presentation Template
An Environmental infographic is a great tool for educating your audience about the state of the environment. This template includes a large format and bold colors that create an impactful visual appeal. The design provides space for facts, stats, and descriptions of the project in question. Use this template to show how much the world has changed and what measures are being taken to mitigate effects on the environment. This infographic has a green hue and illustrations that allow you to add information on the world's natural resources. This is a unique and fun way to display your information.
3 diapositivas
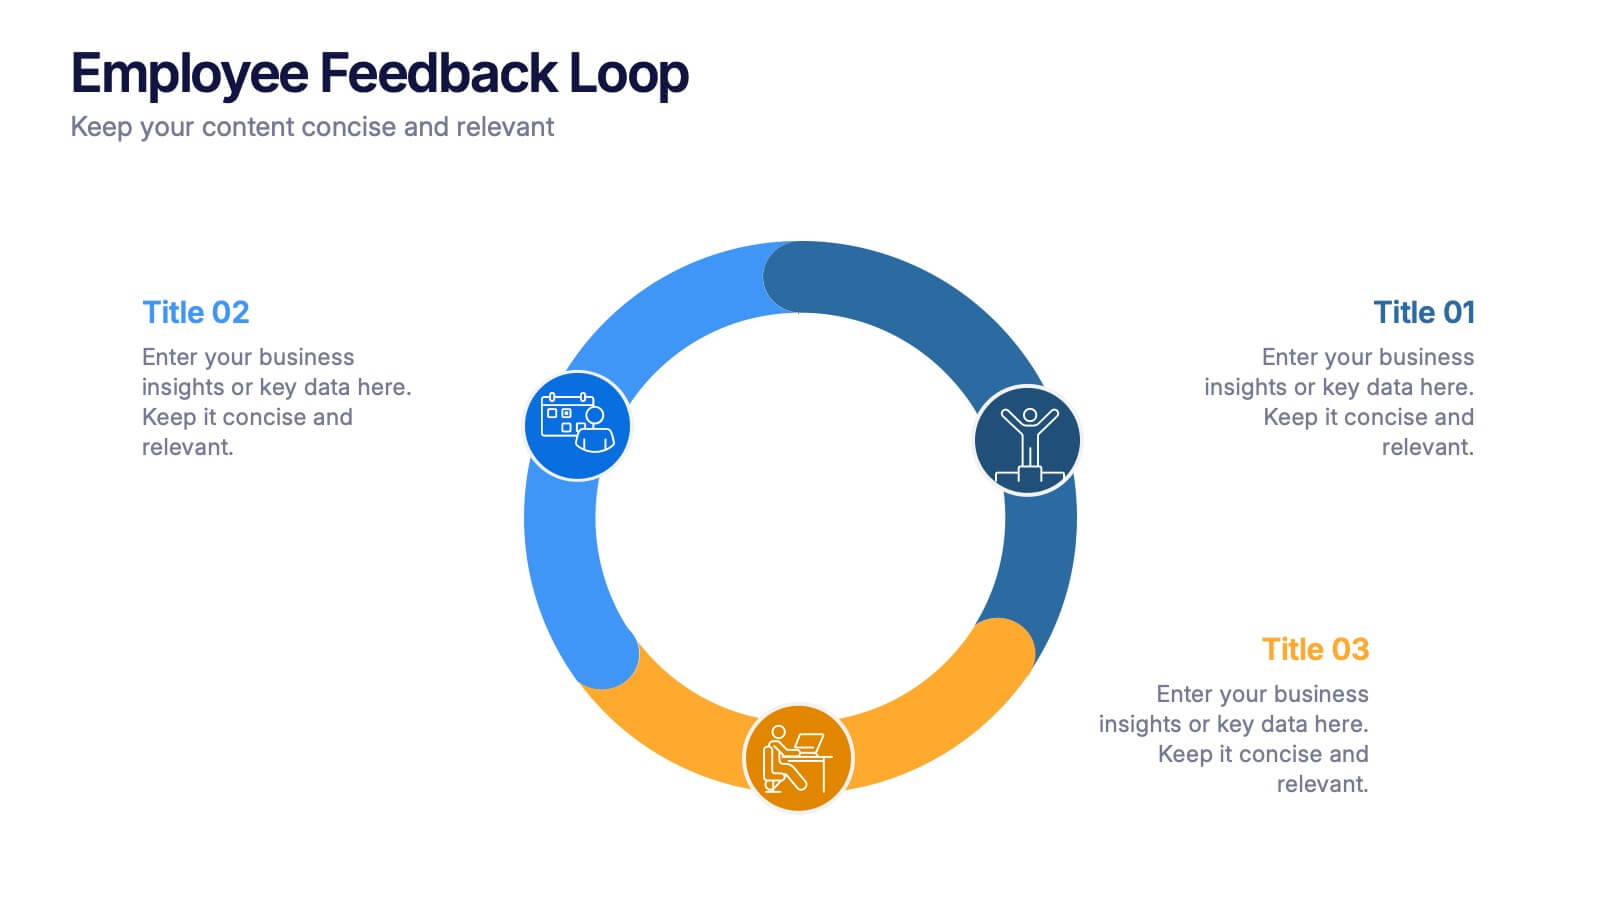
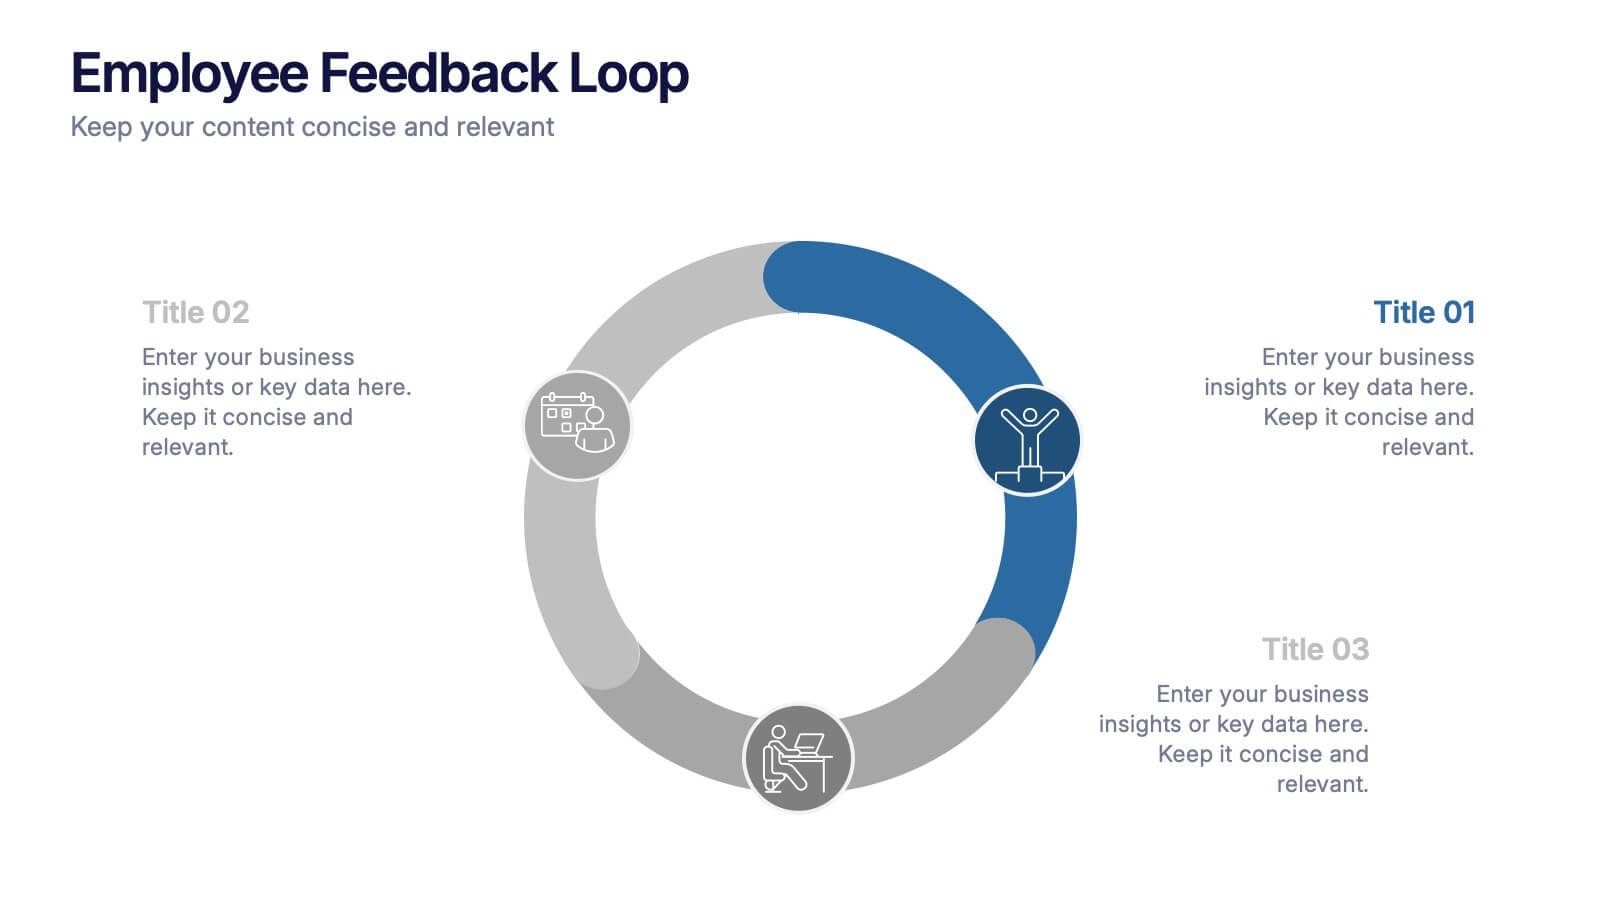
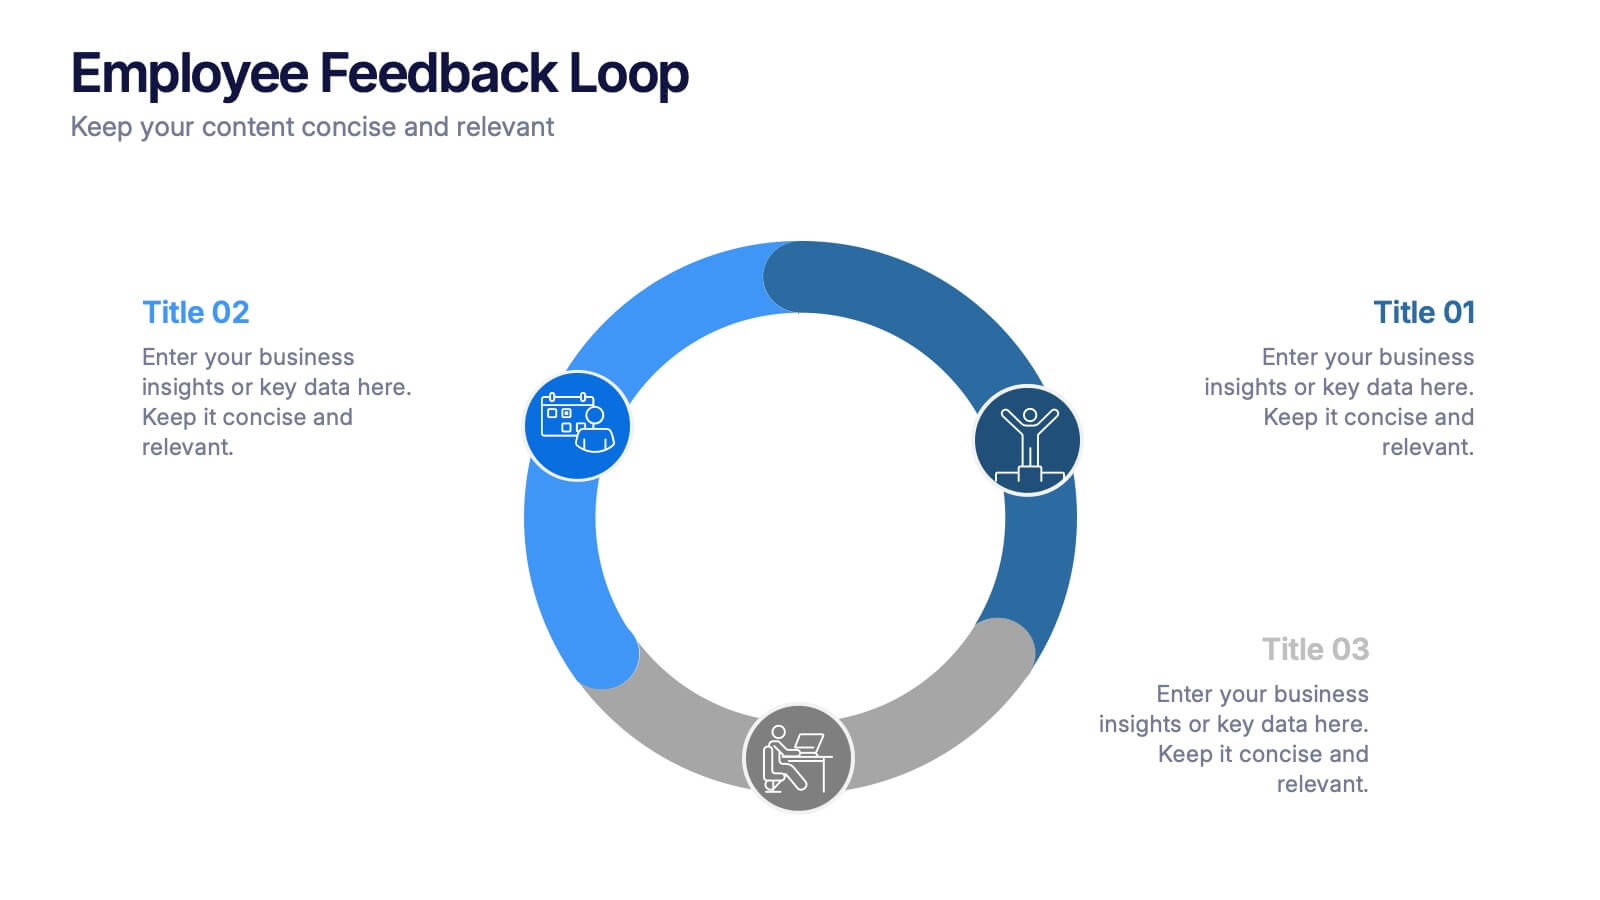
Employee Feedback Loop Presentation
Keep your team connected and continuously improving with this engaging presentation design. Ideal for showcasing communication strategies, feedback cycles, and performance insights, it helps visualize the process of collecting and acting on employee input. Fully customizable and compatible with PowerPoint, Keynote, and Google Slides for effortless, professional presentations.


2 diapositivas
Blue Ocean Strategy Map Presentation
Make your message stand out with a clean, visual map that instantly clarifies where opportunities lie. This presentation helps you compare value factors side-by-side, reveal market gaps, and highlight strategic advantages in a simple, structured format. Fully customizable and compatible with PowerPoint, Keynote, and Google Slides.


8 diapositivas
Quarterly Sales Report Presentation
Streamline your quarterly sales review with our "Quarterly Sales Report Presentation" template. This infographic is expertly designed to display sales data across various categories, using a series of shopping cart icons that represent different products or services. Each cart is labeled with a title and associated with a percentage, clearly illustrating sales performance metrics. The color-coded elements help distinguish between different data points, making complex information easily digestible. Ideal for sales managers and teams, this template aids in analyzing trends, identifying growth opportunities, and planning future sales strategies. Compatible with PowerPoint, Keynote, and Google Slides, it's a vital tool for effective sales presentations.