


Características


¿Tienes alguna pregunta?
Recomendar


4 diapositivas
Stakeholder Analysis Template for Projects Presentation
Turn complex stakeholder relationships into clear, actionable insights with this dynamic and modern quadrant design. Ideal for visualizing influence, communication strategies, and engagement priorities, it helps teams build stronger collaboration frameworks. Fully editable and compatible with PowerPoint, Keynote, and Google Slides for effortless professional use.


5 diapositivas
4-Stage Gap Identification Presentation
A clear, engaging way to map progression, this presentation helps you illustrate each stage of identifying business gaps with structure and clarity. It guides audiences through challenges, priorities, and opportunities in a simple step-by-step flow that’s easy to follow and present. Fully compatible with PowerPoint, Keynote, and Google Slides.


4 diapositivas
Execution-Based Strategic Action Plan Presentation
Highlight your execution strategy with this visually striking pinwheel diagram. Each blade represents a focused action step, ideal for showcasing implementation plans or performance initiatives. Fully customizable in PowerPoint, Keynote, and Google Slides—perfect for strategic reviews, team briefings, or progress tracking across four critical areas.


5 diapositivas
Insurance Policy Infographics
Dive into the intricacies of insurance with our insurance policy infographics. Rendered in a professional palette of blue and an array of engaging colors, this creative, vertical template simplifies the often complex world of insurance policies. Ideal for insurance agents, companies, and educators, it provides a visual aid to explain coverage specifics, terms, and conditions or to compare policy offerings clearly and effectively. The infographic includes aesthetically pleasing graphics, symbolic icons, and designated spaces for factual data, making it a quintessential tool for enhancing audience understanding and promoting informed decision-making.


2 diapositivas
Professional Thank You Closing Slide Presentation
Make your last impression count with a clean, modern closing slide that wraps up your presentation in style. This template is designed to help you leave a professional mark while displaying contact info, brand visuals, or a thank-you note. Fully compatible with PowerPoint, Keynote, and Google Slides for flexible use.


4 diapositivas
Content Calendar and Engagement Plan Presentation
Plan and track content effectively with this calendar-style engagement layout. Visualize posting frequency, engagement goals, and campaign performance in a single view. Ideal for content strategists and marketers managing social or editorial schedules. Fully editable in PowerPoint, Keynote, or Google Slides to suit your unique workflow and branding needs.


26 diapositivas
Summer Sale Presentation
Soak up the bright, sunny vibes of a presentation template that’s perfectly tailor-made for the lively summer season. Its radiant design, infused with the essence of summer sales and tropical aesthetics, is a perfect match for retail campaigns, travel promotions, or any topic that aims to bring the sizzle of summer into a room. Bright colors, playful graphics, and beach-inspired backgrounds set the stage for vibrant storytelling, whether you're introducing a seasonal team, showcasing hot vacation spots, or highlighting the latest summer fashion. The template not only captures the casual, cheerful spirit of the season but also ensures that your content makes a splash with clear, concise data displays and infographics. It’s a breeze to use across various platforms like PowerPoint, Keynote, and Google Slides, ensuring your summer message is as refreshing as a cool ocean wave.


4 diapositivas
Corporate Governance Structure Presentation
Build transparency and leadership clarity with this clean, layered presentation layout that visualizes company hierarchies and decision-making systems. Ideal for explaining organizational roles, responsibilities, and reporting flows, it simplifies complex structures into easy visuals. Fully editable and compatible with PowerPoint, Keynote, and Google Slides for professional, flexible use.


5 diapositivas
Harvey Ball Rating System Overview Presentation
Visualize performance ratings or feature comparisons with the Harvey Ball Rating System Overview Presentation. This template uses vertical bar visuals combined with Harvey ball icons to communicate progress, satisfaction, or status across four key areas. Clean, intuitive, and ideal for executive summaries or status dashboards. Fully editable and compatible with PowerPoint, Keynote, and Google Slides.
8 diapositivas
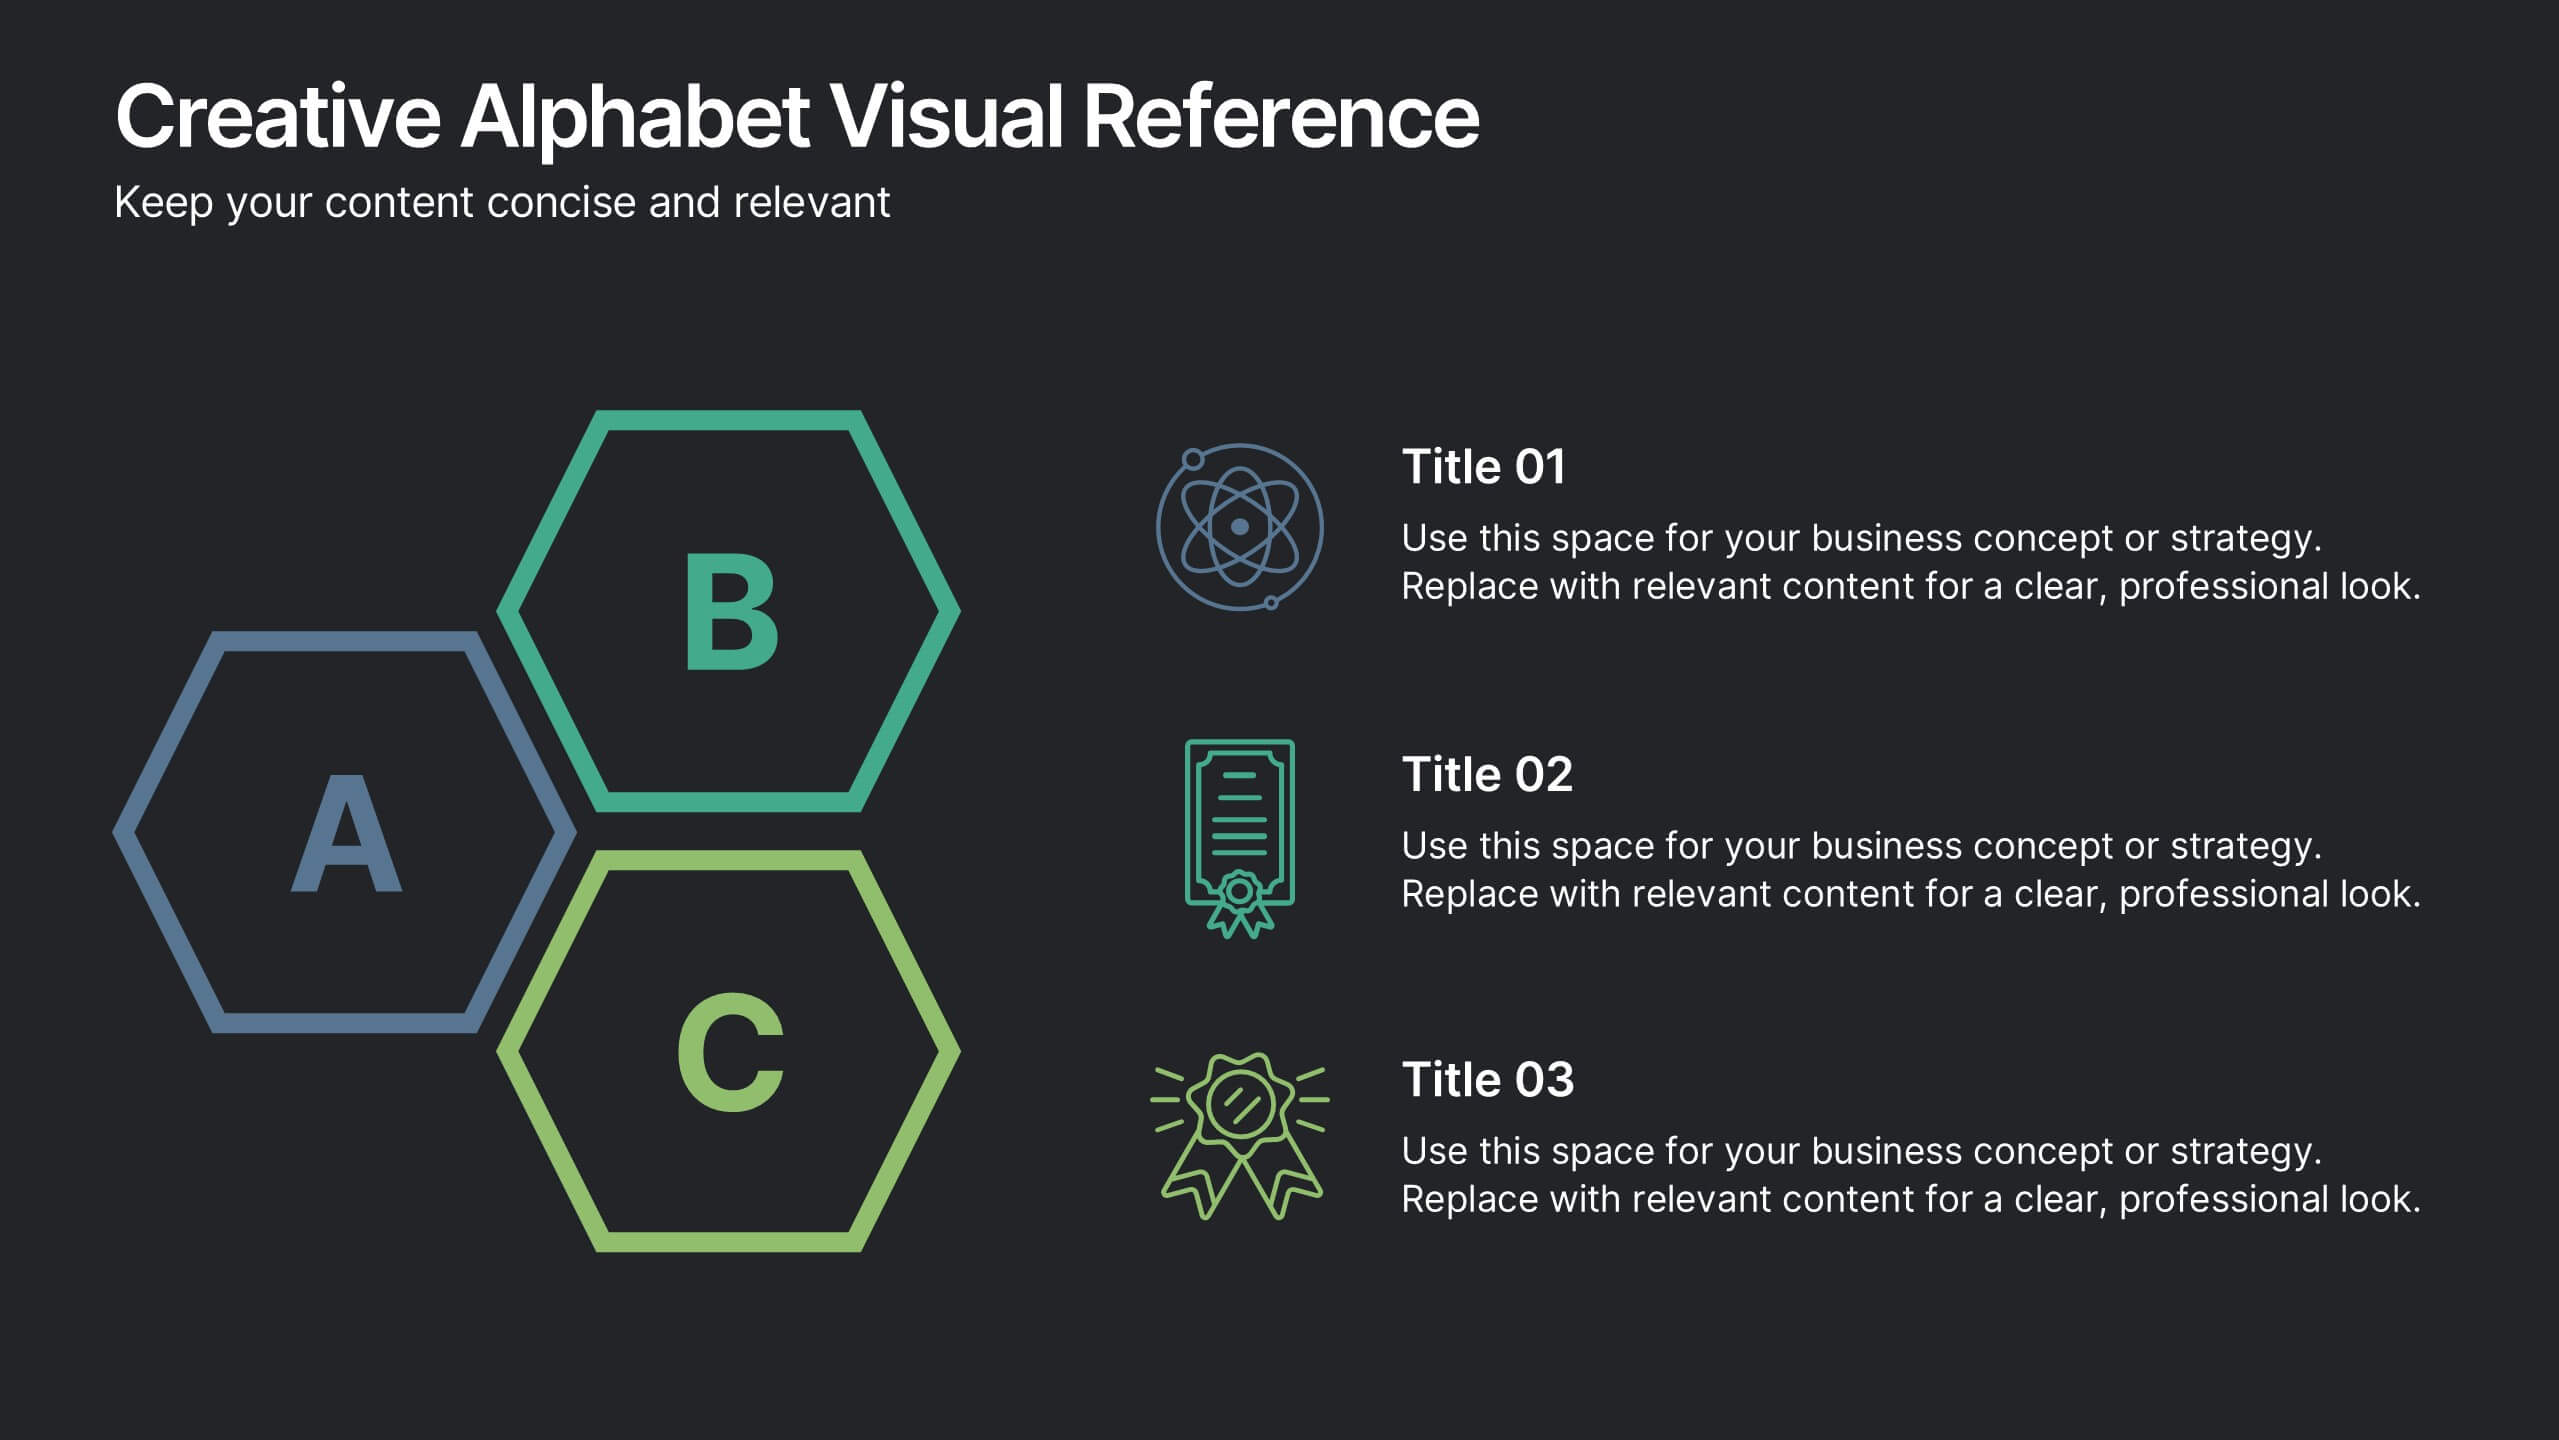
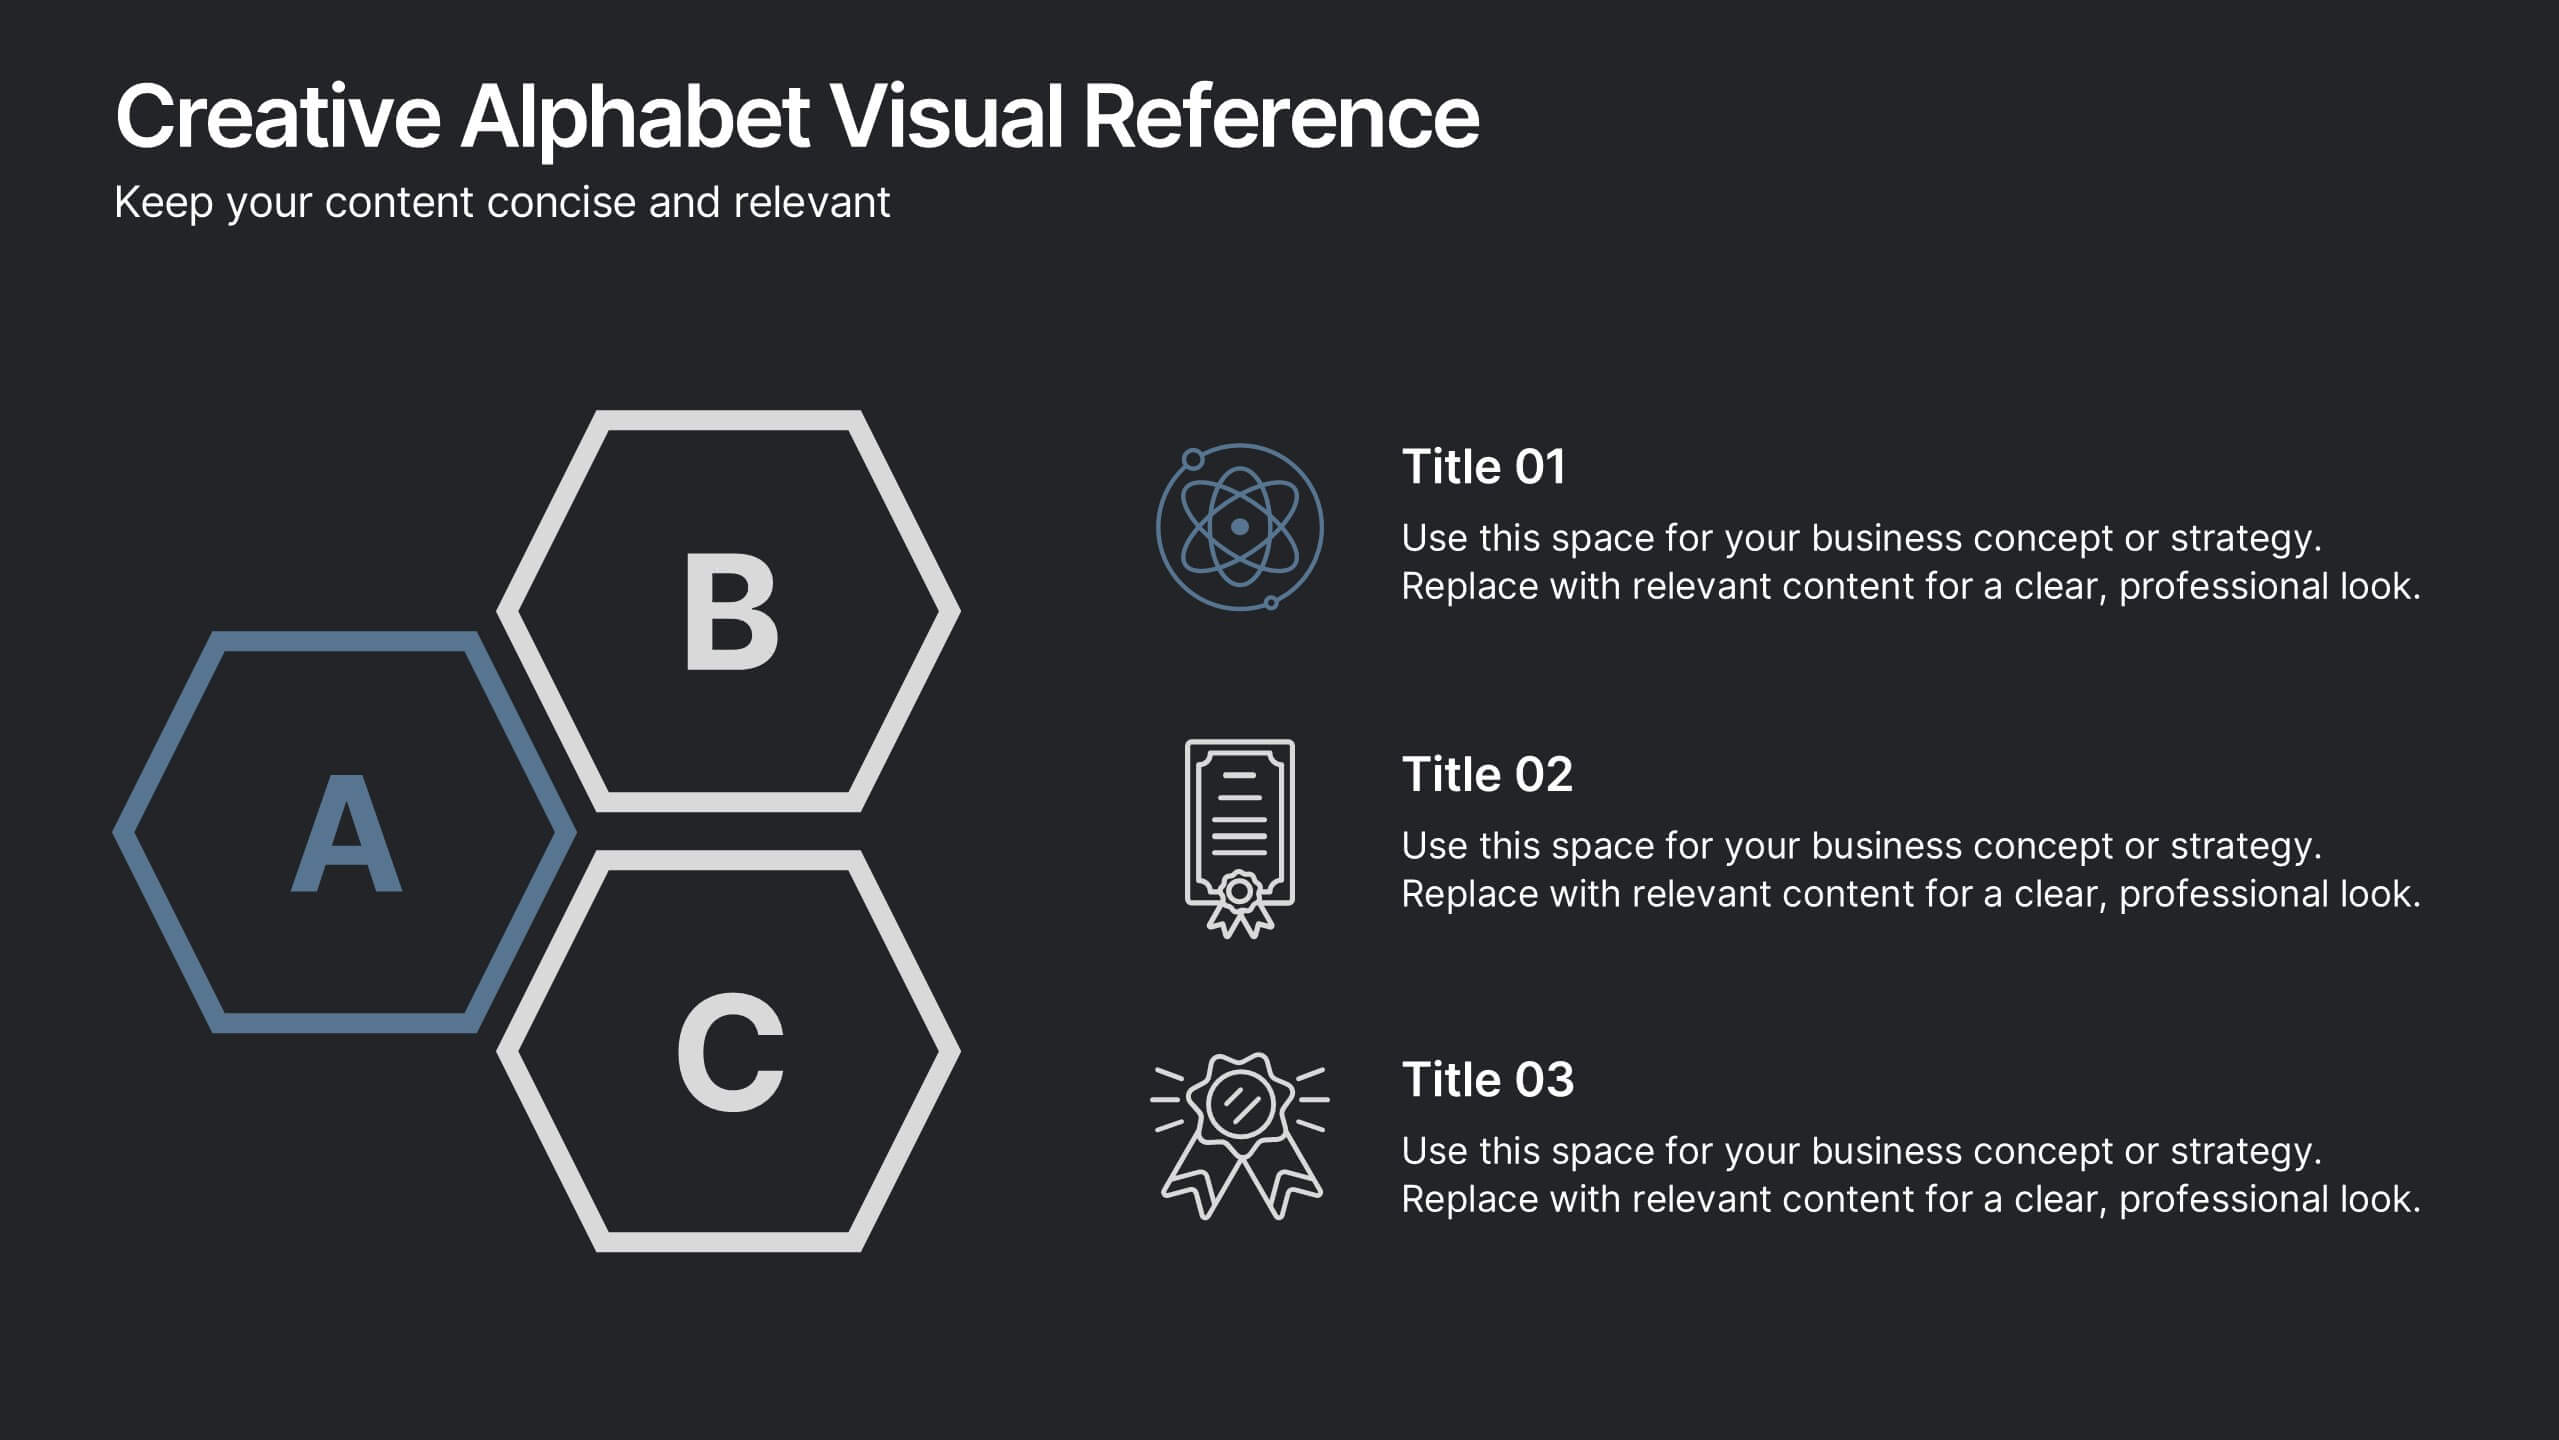
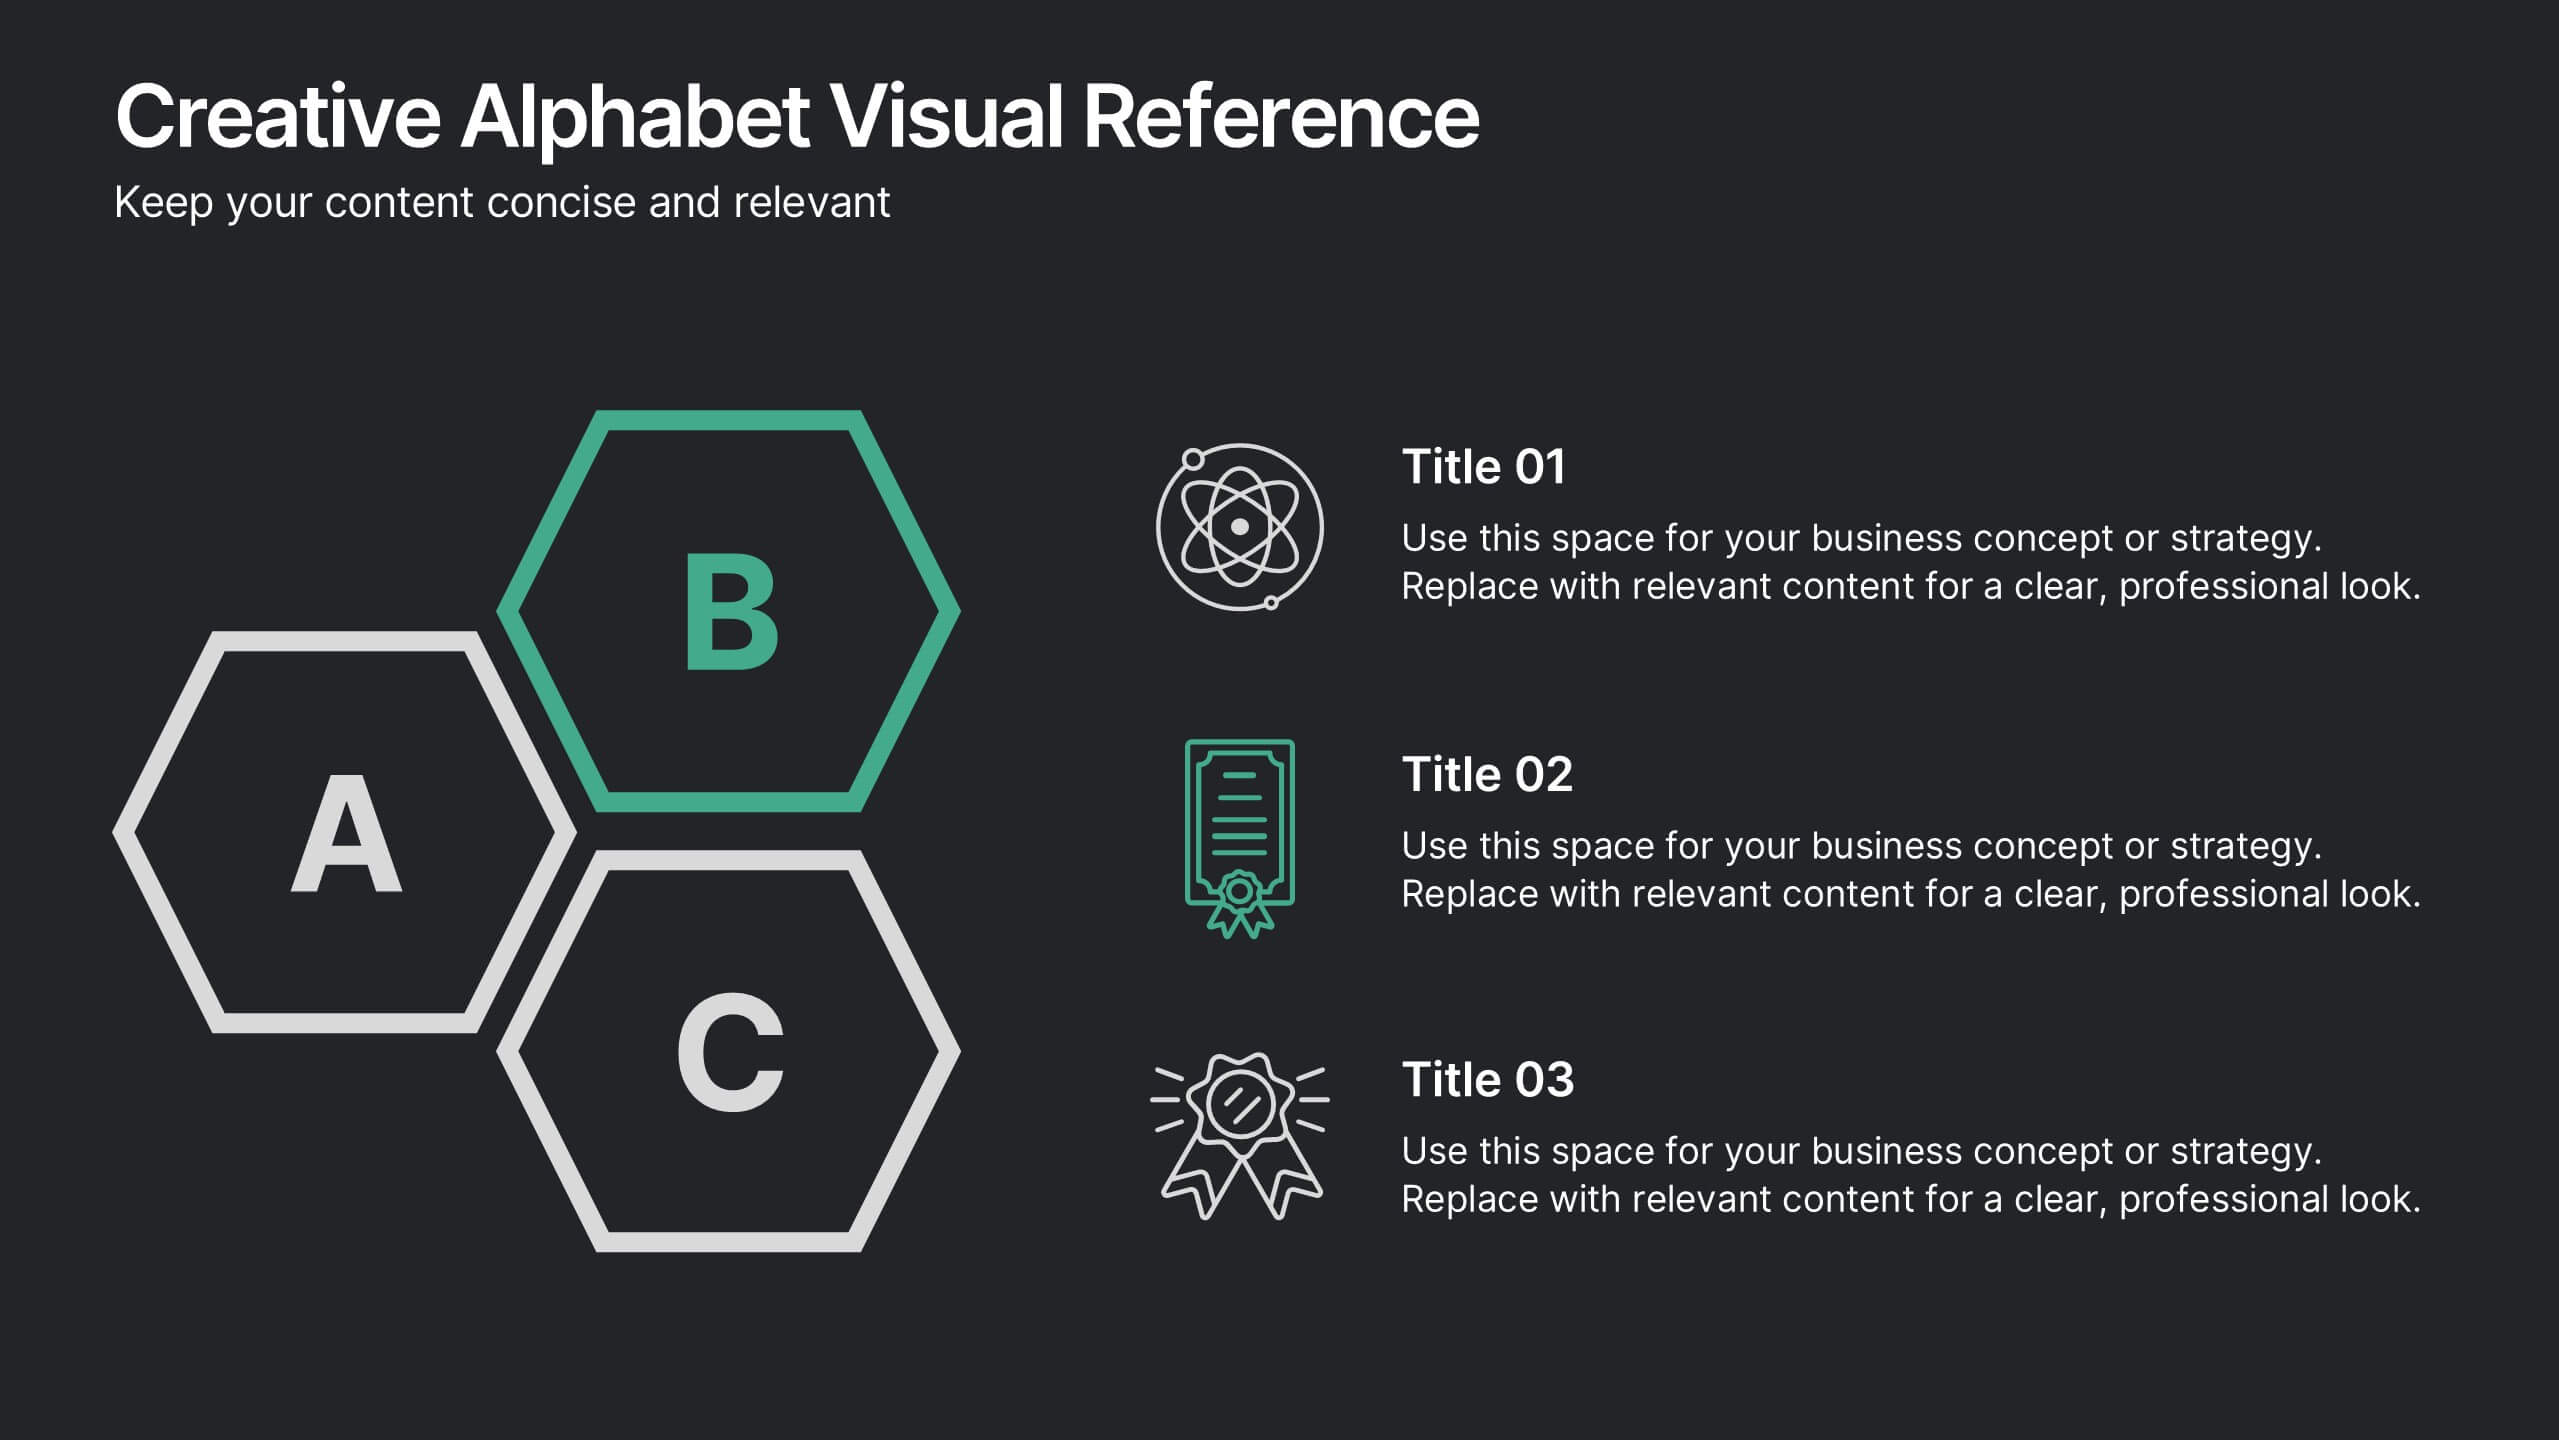
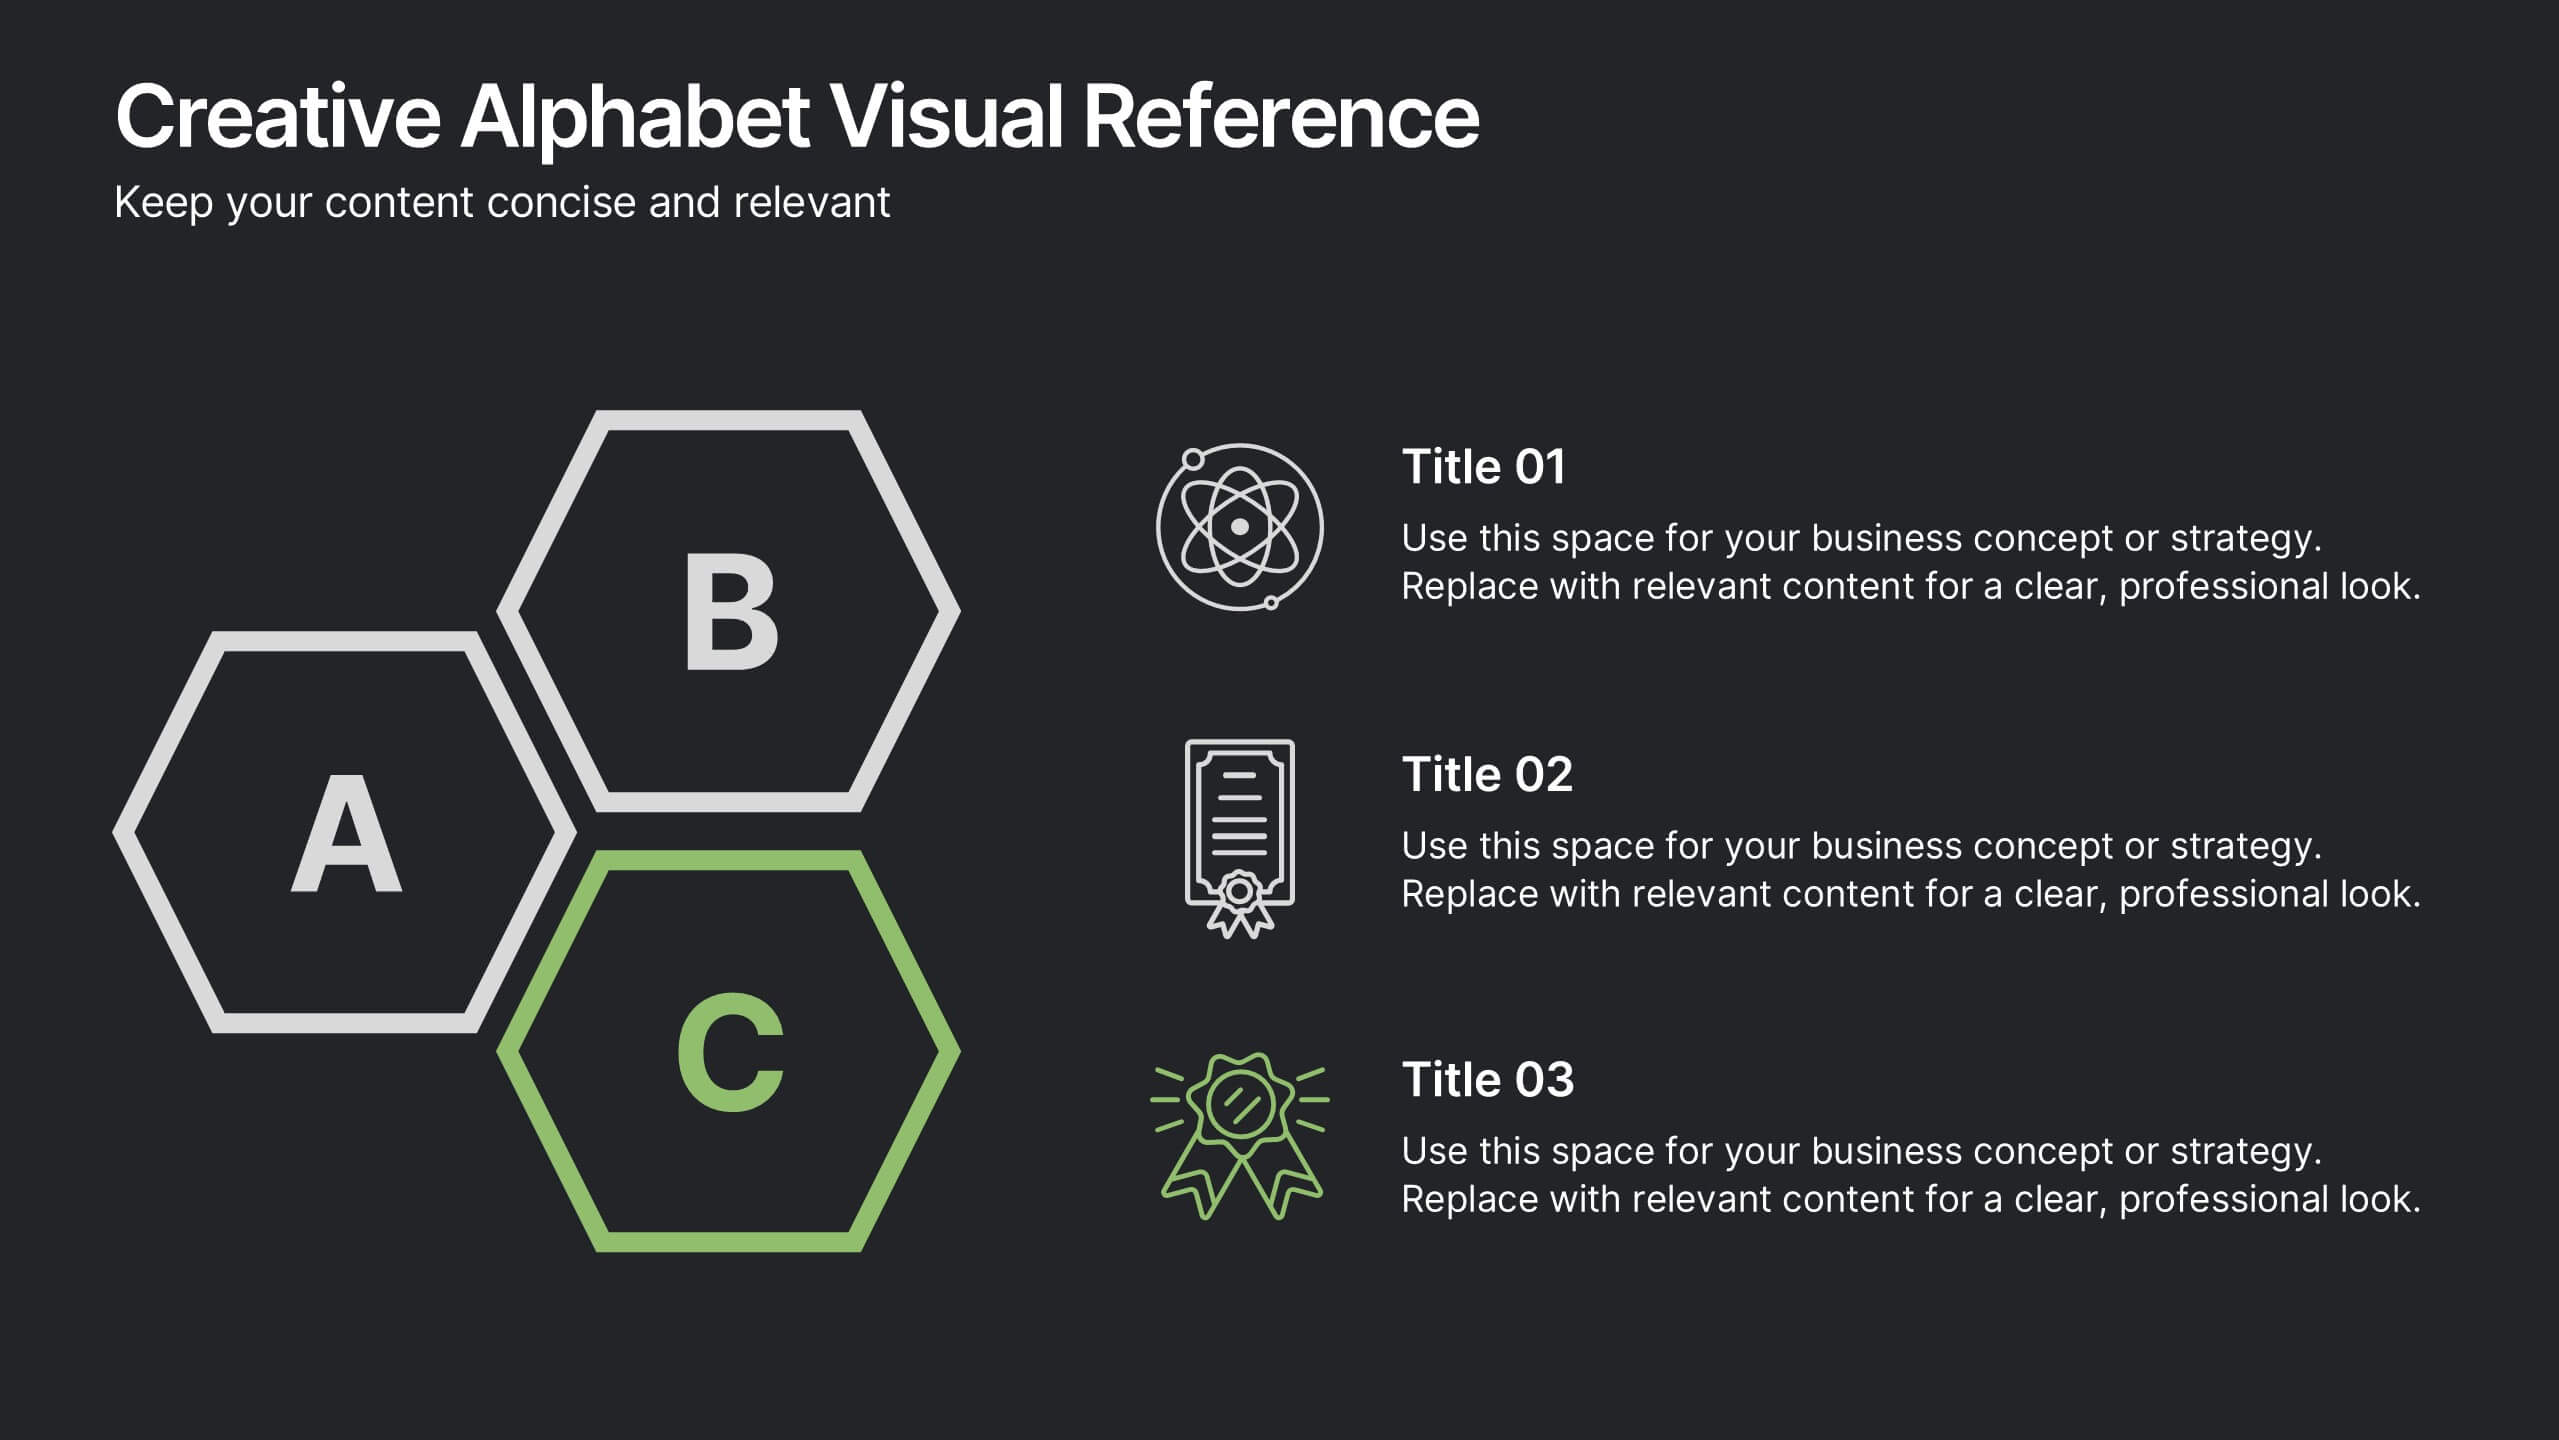
Creative Alphabet Visual Reference Presentation
This creative presentation uses a bold A–B–C visual structure to highlight key points in a clean, modern layout. Ideal for overviews, comparisons, or step-by-step frameworks. Fully customizable in Canva, it balances design and clarity—perfect for business strategies, education, or visual storytelling with strong alphabetical cues and icon integration.


5 diapositivas
Corporate Risk Assessment Framework Presentation
Streamline corporate risk evaluations with a structured framework. This Corporate Risk Assessment Framework provides a clear, organized approach to identifying, analyzing, and managing risks. Ideal for business strategists, project managers, and compliance teams. Fully customizable and compatible with PowerPoint, Keynote, and Google Slides for seamless integration into your workflow.


8 diapositivas
Meeting Agenda Presentation
Streamline your meeting agendas with our "Meeting Agenda Presentation" template. This design features a central node linked to four key points, each representing a separate agenda item, ensuring a clear and organized discussion flow. Color-coded segments aid in visually distinguishing between topics, making it easy for participants to follow and engage. Ideal for team meetings, project updates, and strategic discussions, this template enhances communication and efficiency. Its intuitive layout keeps your sessions on track and productive. Compatible with PowerPoint, Keynote, and Google Slides, it's an essential tool for any professional aiming to optimize their meeting presentations.


5 diapositivas
Visible vs Hidden Factors Iceberg Chart Presentation
Bring your ideas to life with a visual that instantly reveals the difference between what’s seen and what’s truly shaping the outcome. This presentation helps you break down visible elements and deeper hidden factors using a modern iceberg graphic. Perfect for strategy, analysis, and insights. Compatible with PowerPoint, Keynote, and Google Slides.


10 diapositivas
Market Trends and Expansion in Oceania Map Presentation
Unlock new opportunities with the Market Trends and Expansion in Oceania Map template, which visualizes economic growth across the region while highlighting key market trends and expansion potentials.This essential business tool is designed for clarity and impact, compatible with PowerPoint, Keynote, and Google Slides, making it versatile for diverse presentation needs.


5 diapositivas
Signs of Diabetes Infographics
There are several common signs and symptoms of diabetes that may indicate the presence of the condition. It's important to note that the symptoms can vary depending on the type of diabetes (Type 1 or Type 2) and individual differences. These infographic templates are informative tools made to help educate individuals about the signs and symptoms of diabetes. These are designed to raise awareness about diabetes, its early warning signs, and the importance of early detection and management. These infographic templates can be effective tools for health professionals, educators, and individuals seeking to understand the signs and symptoms of diabetes.


6 diapositivas
ABC Alphabet Infographic
An "Alphabet Infographic" is a visually engaging way to present the letters of the alphabet along with corresponding words or images that start with each letter. This type of infographic is often used in educational settings to teach young children the alphabet and basic vocabulary. Display the letters of the alphabet in a clear and appealing layout. You can arrange them in rows or columns, using a bold and easily readable font. Use colorful and child-friendly illustrations for the images associated with each letter. This will make the infographic more captivating and engaging for young learners.

22 diapositivas
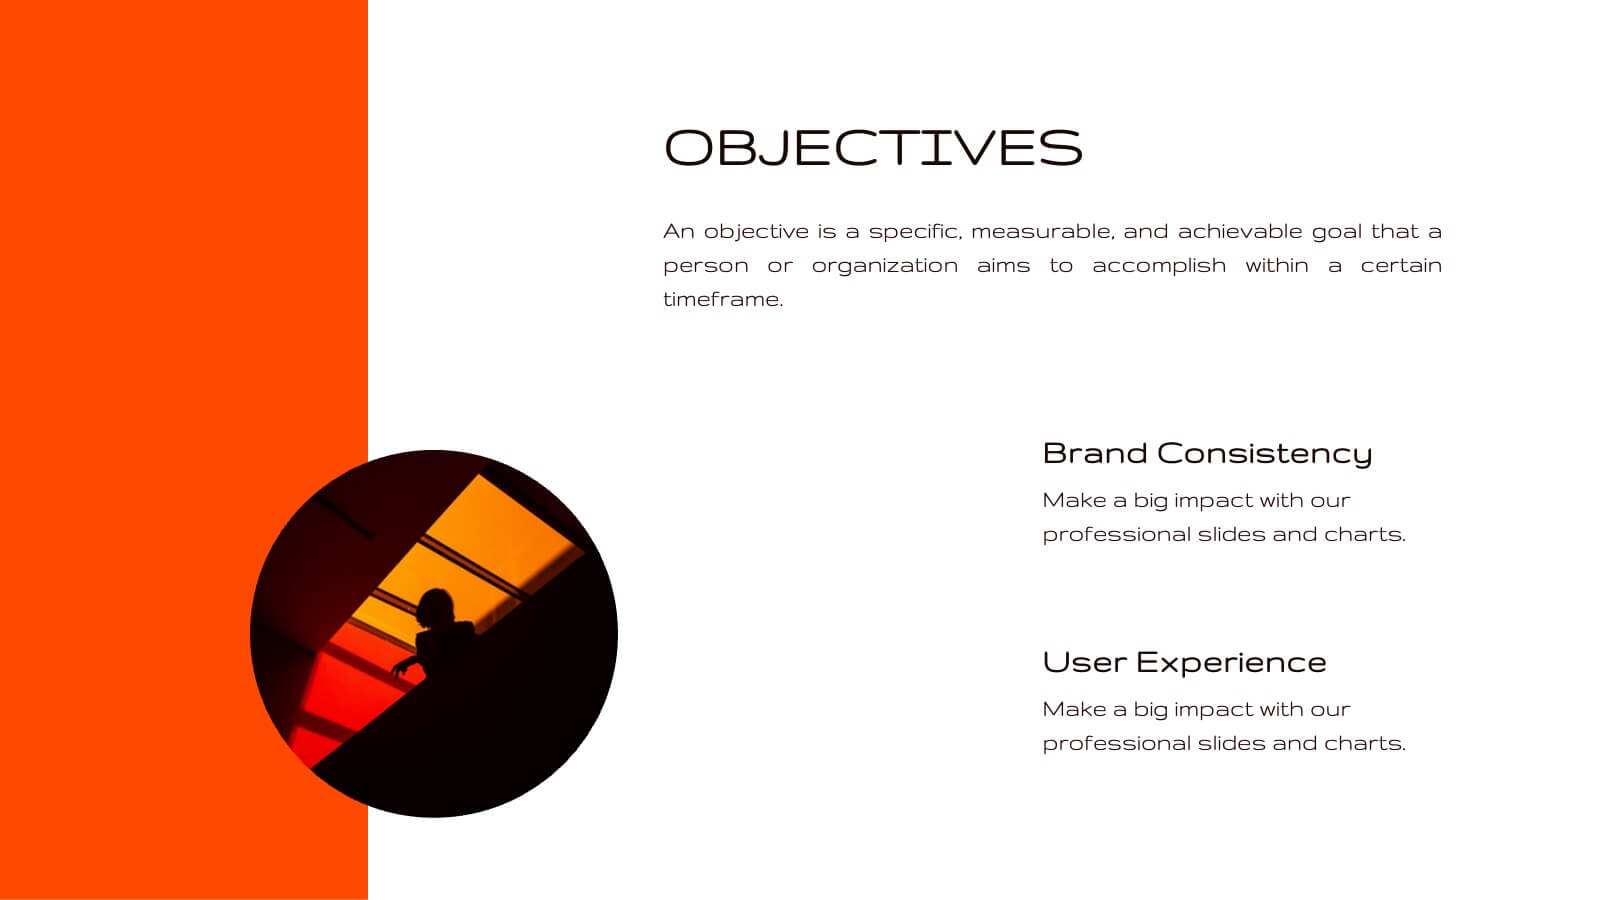
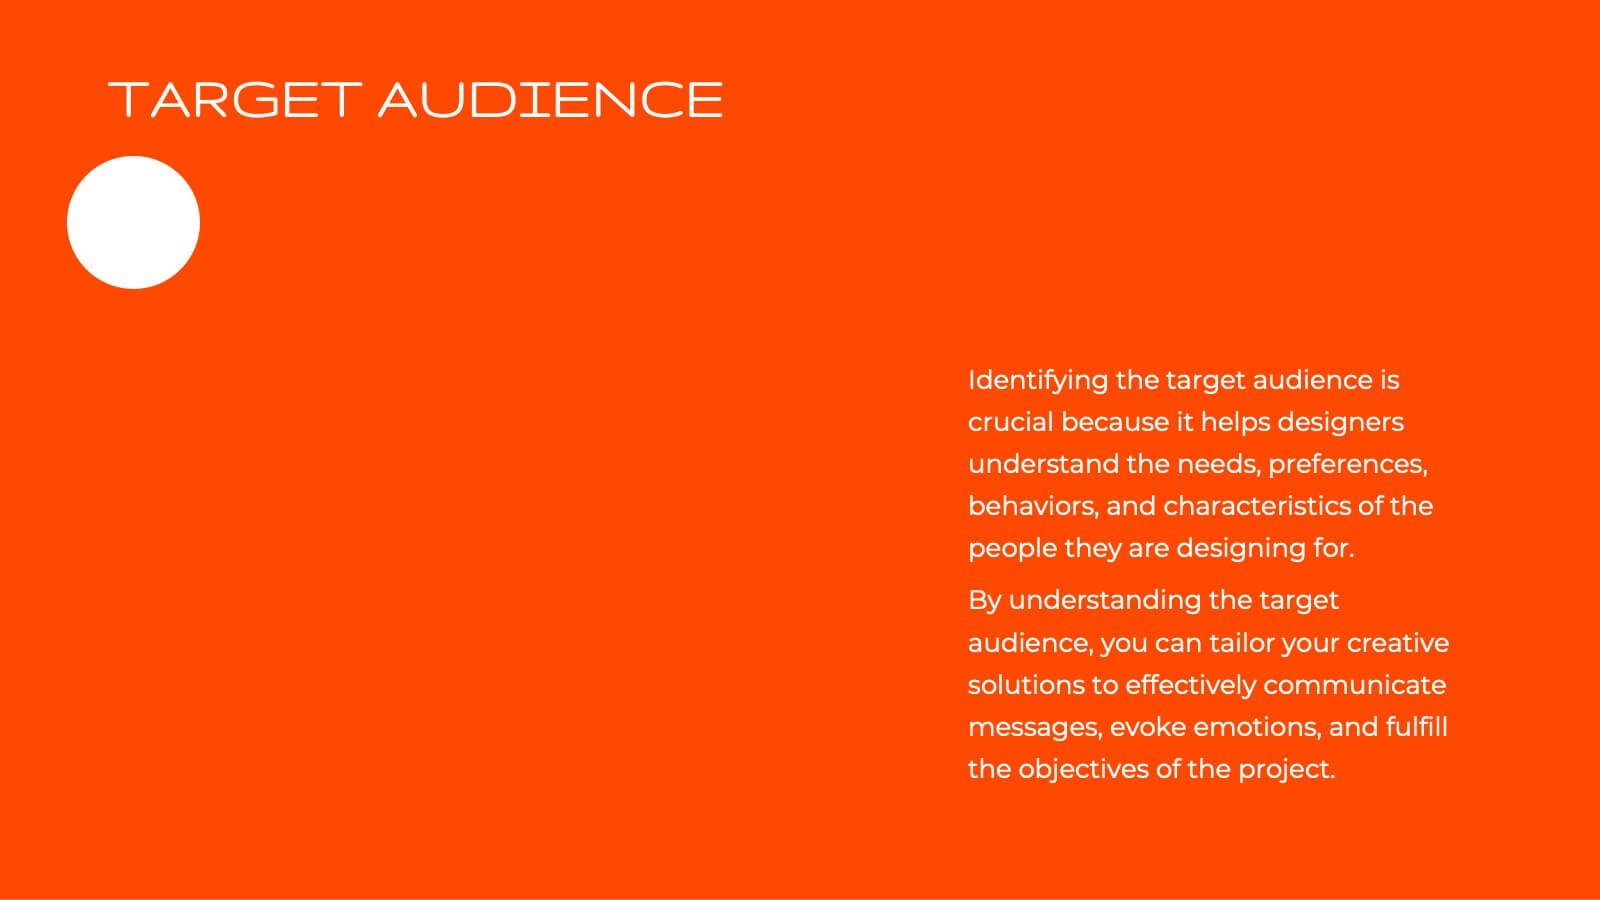
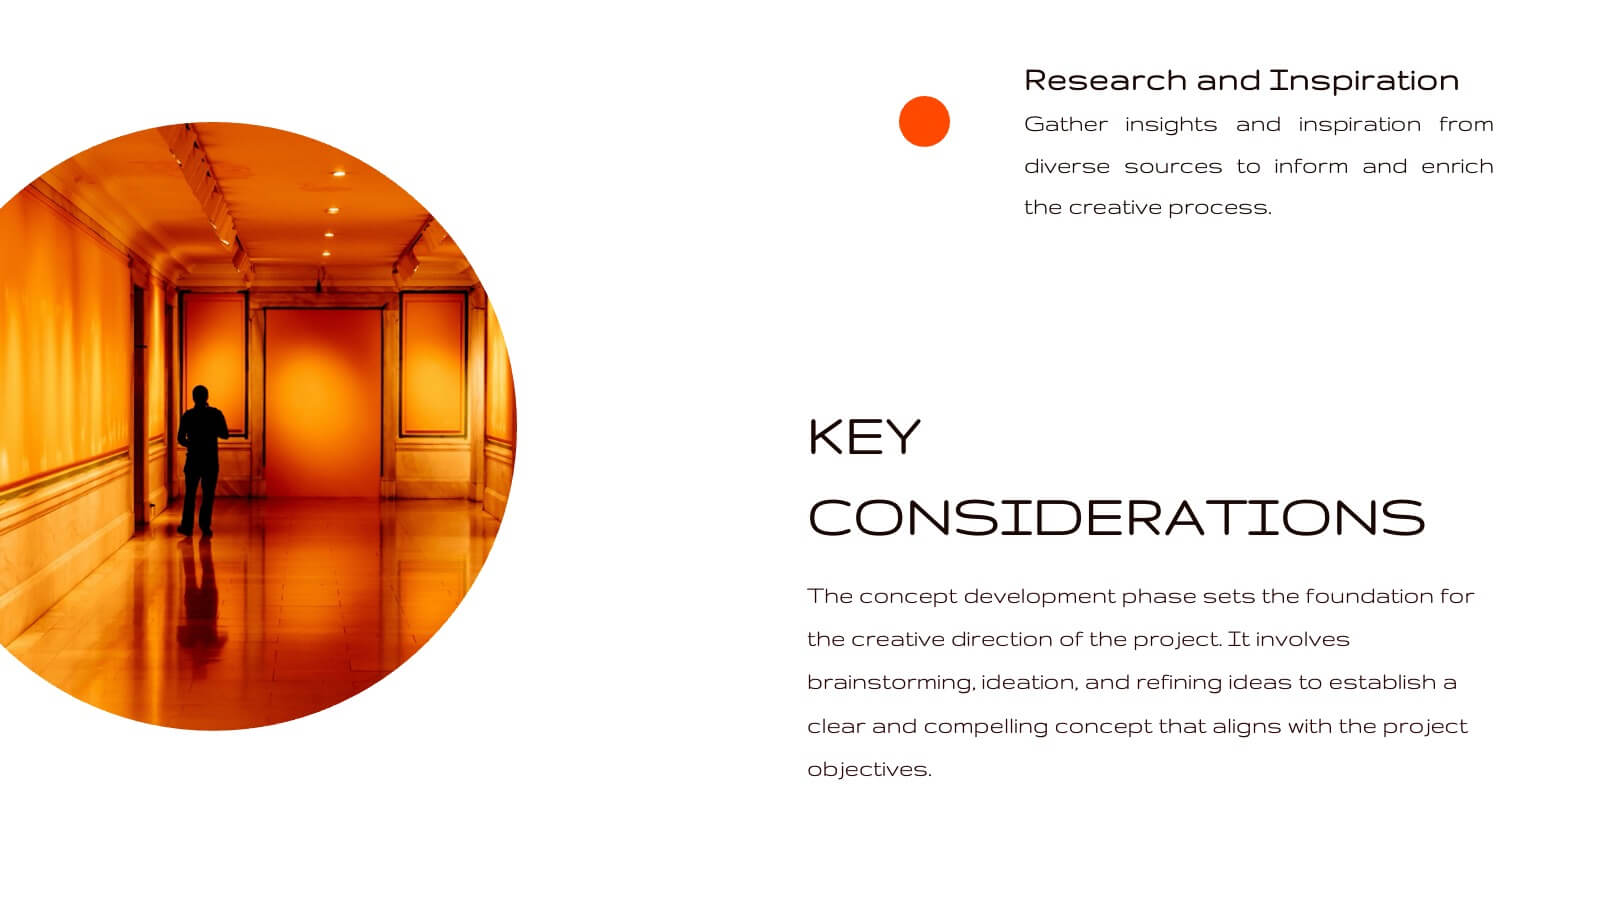
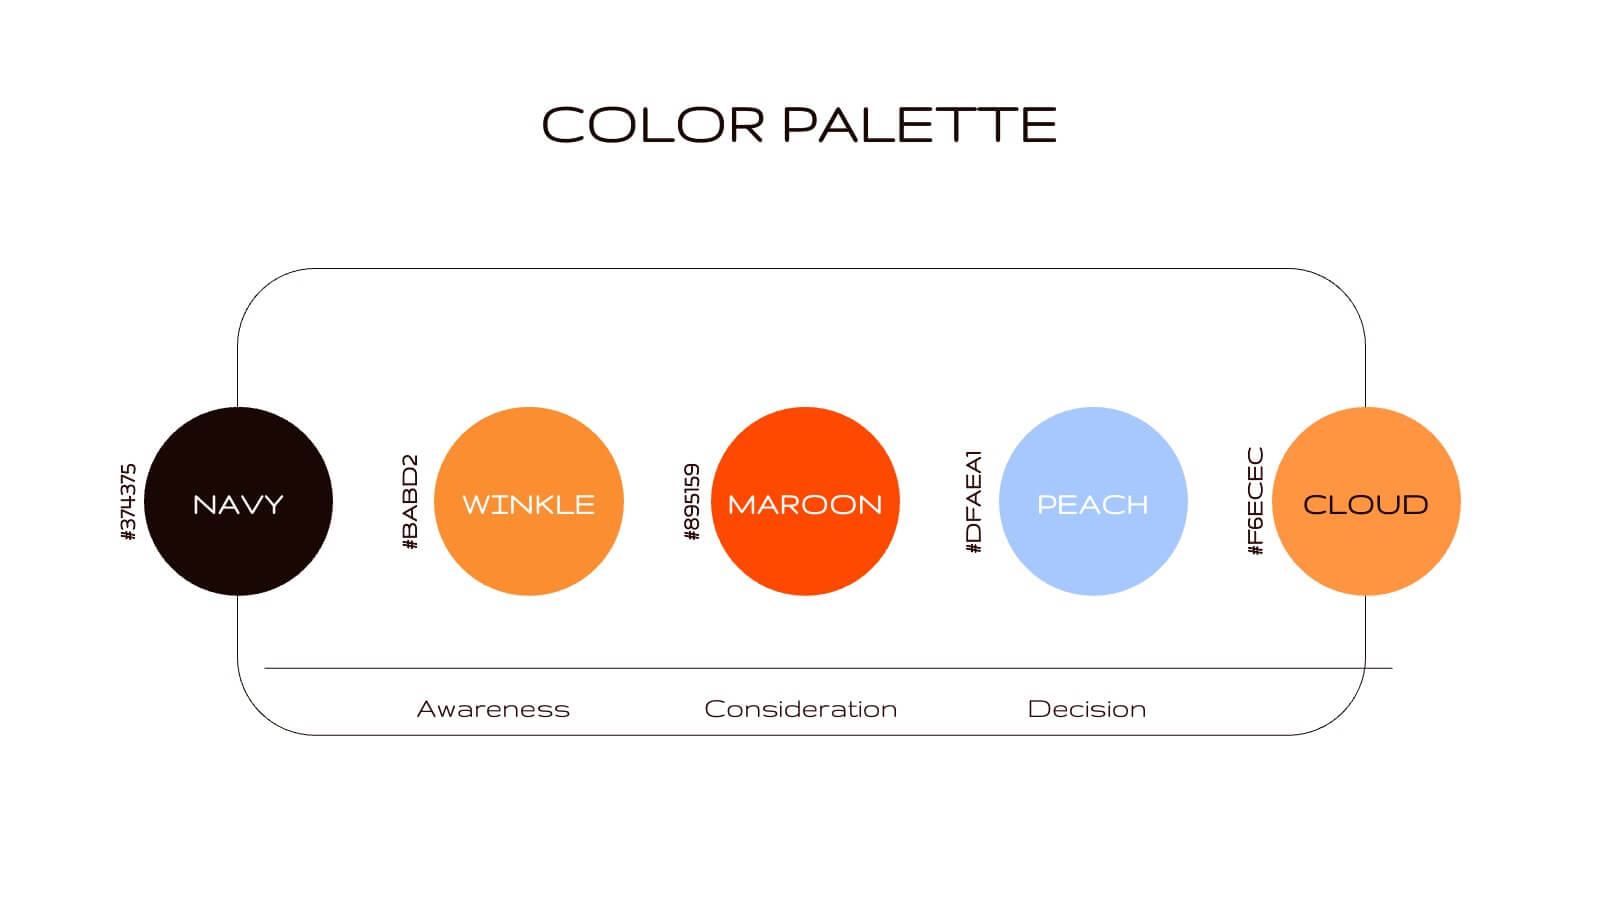
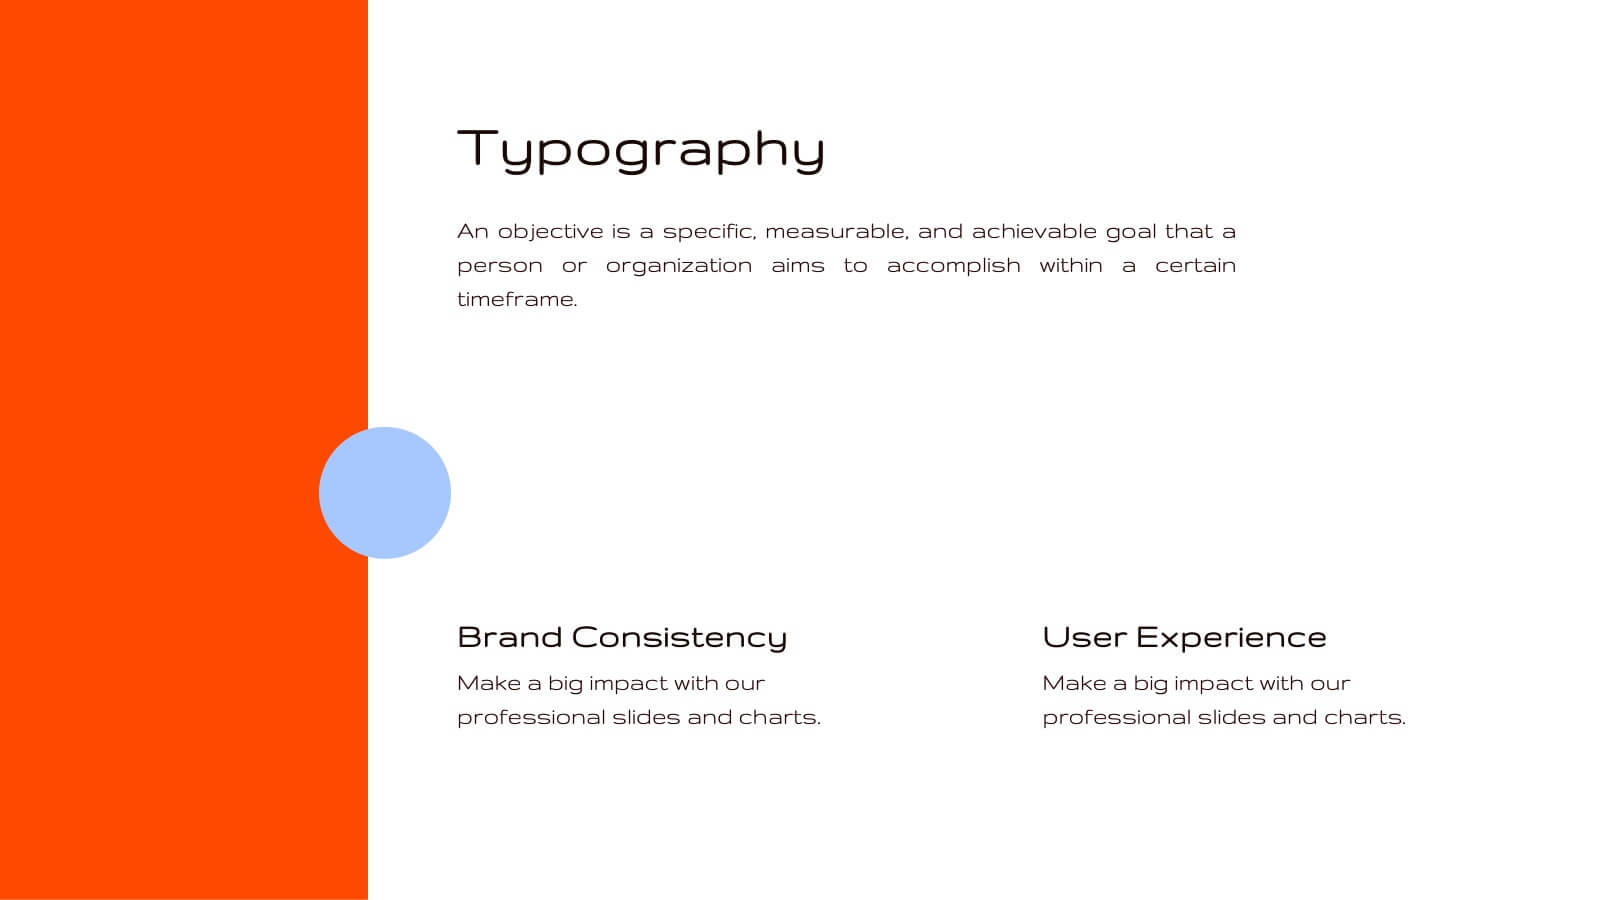
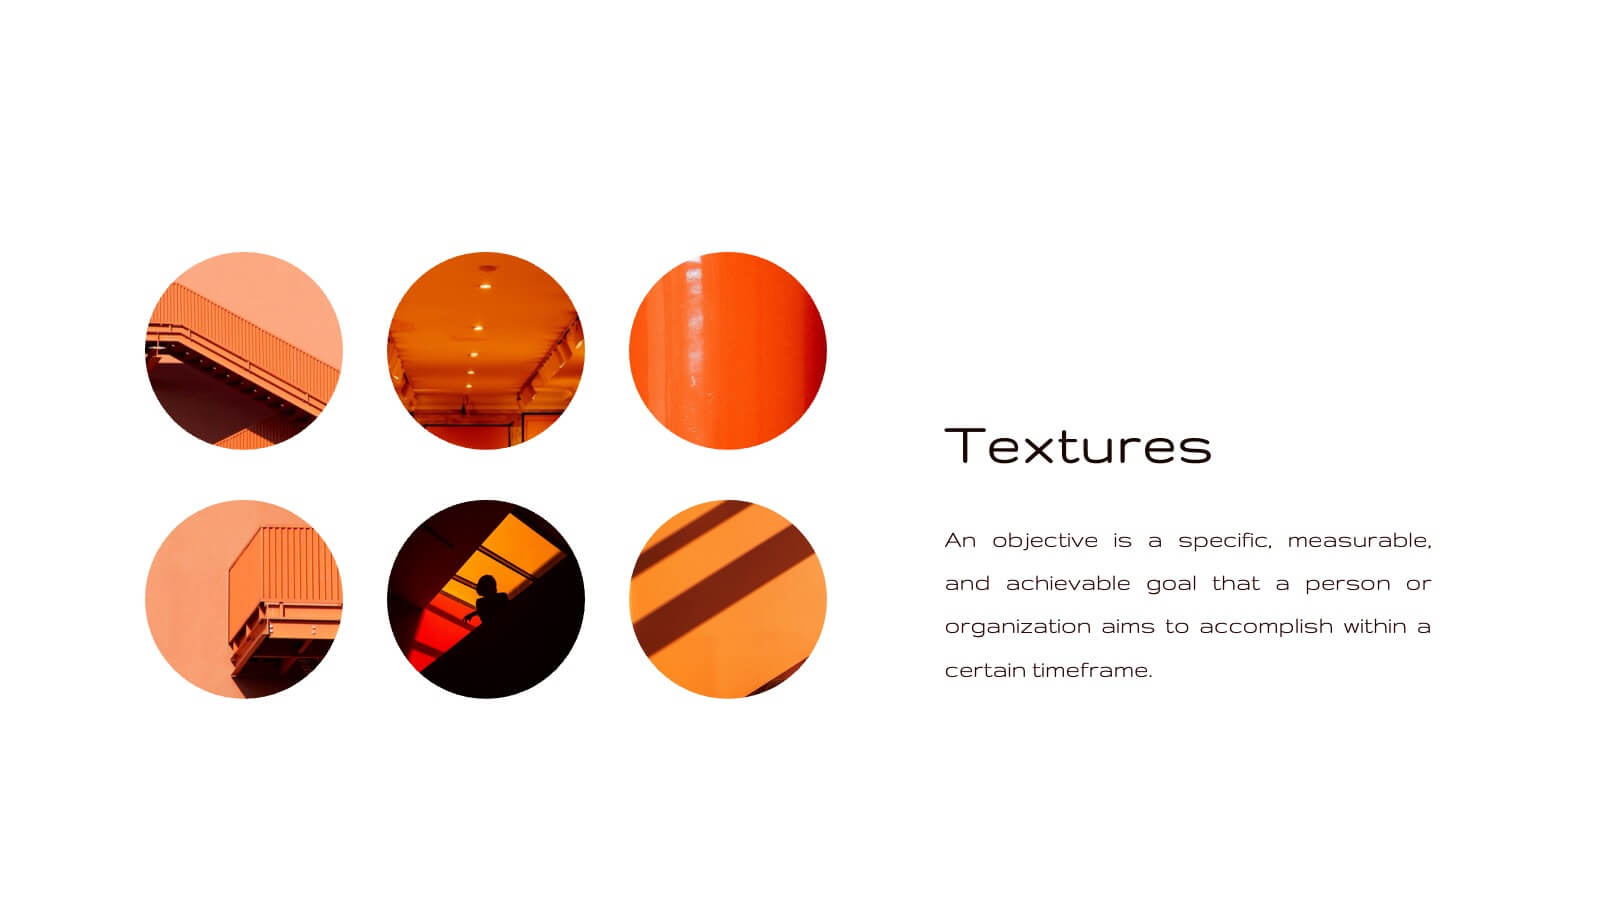
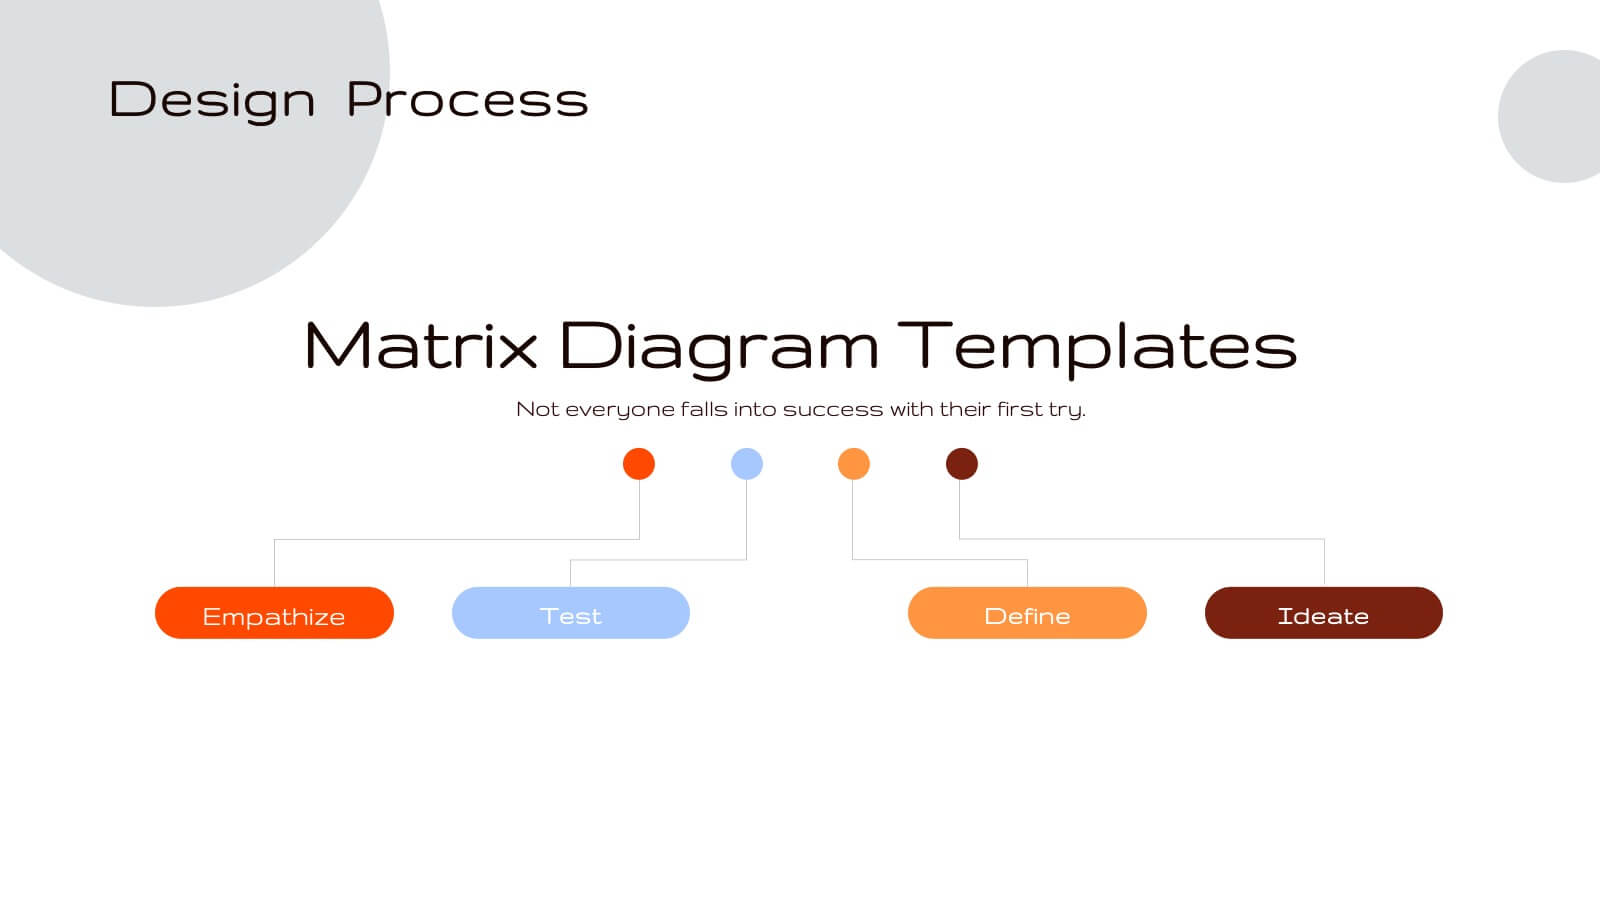
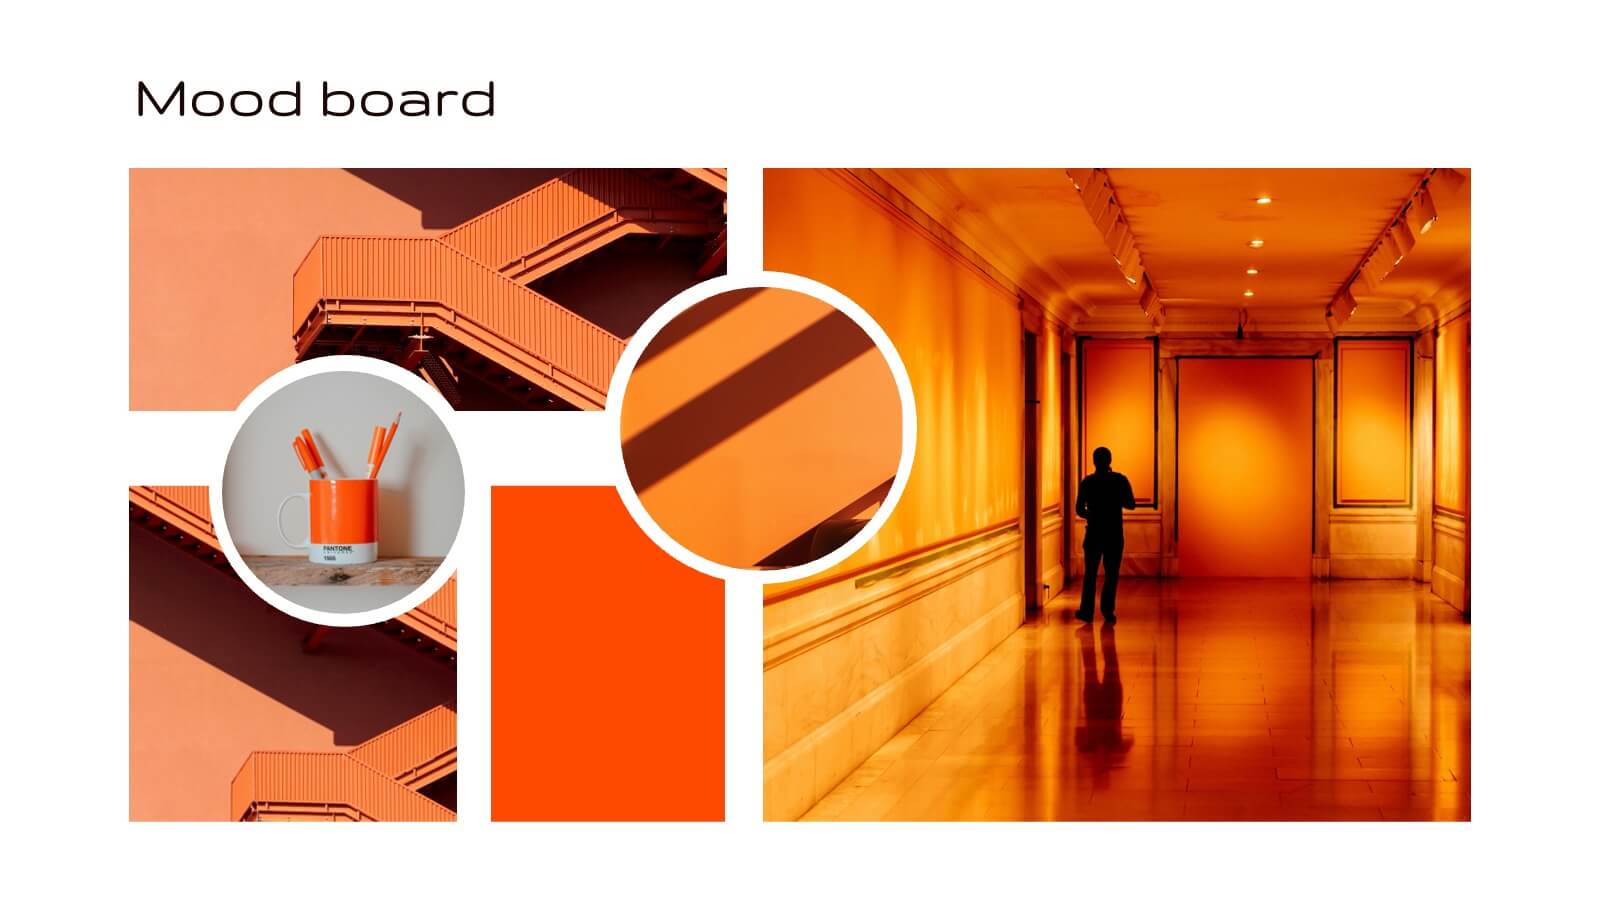
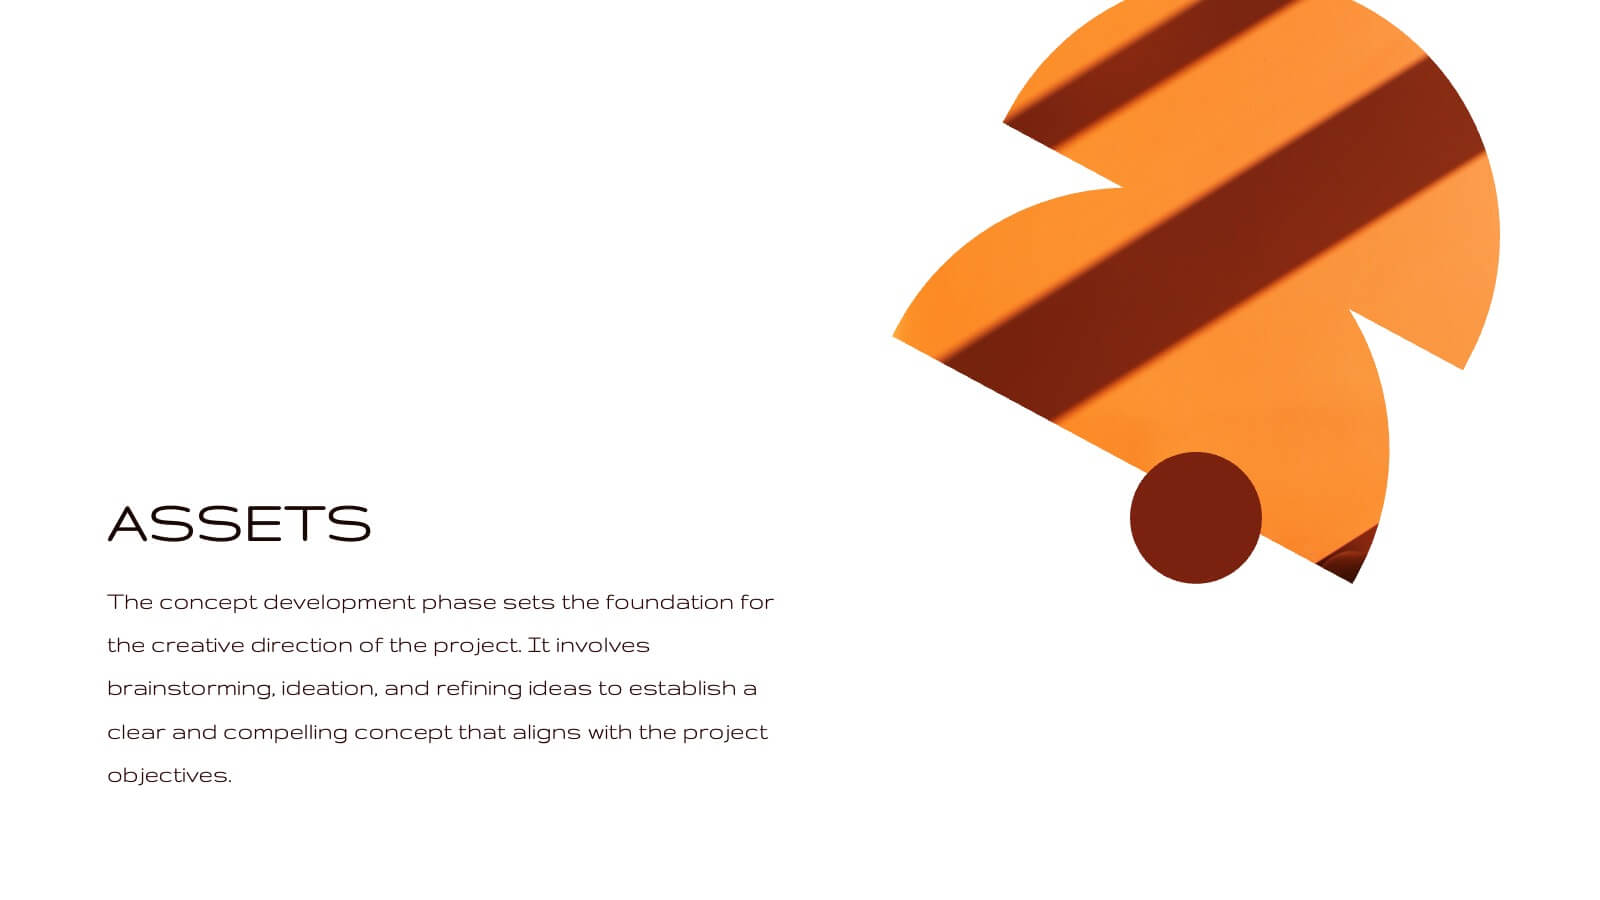
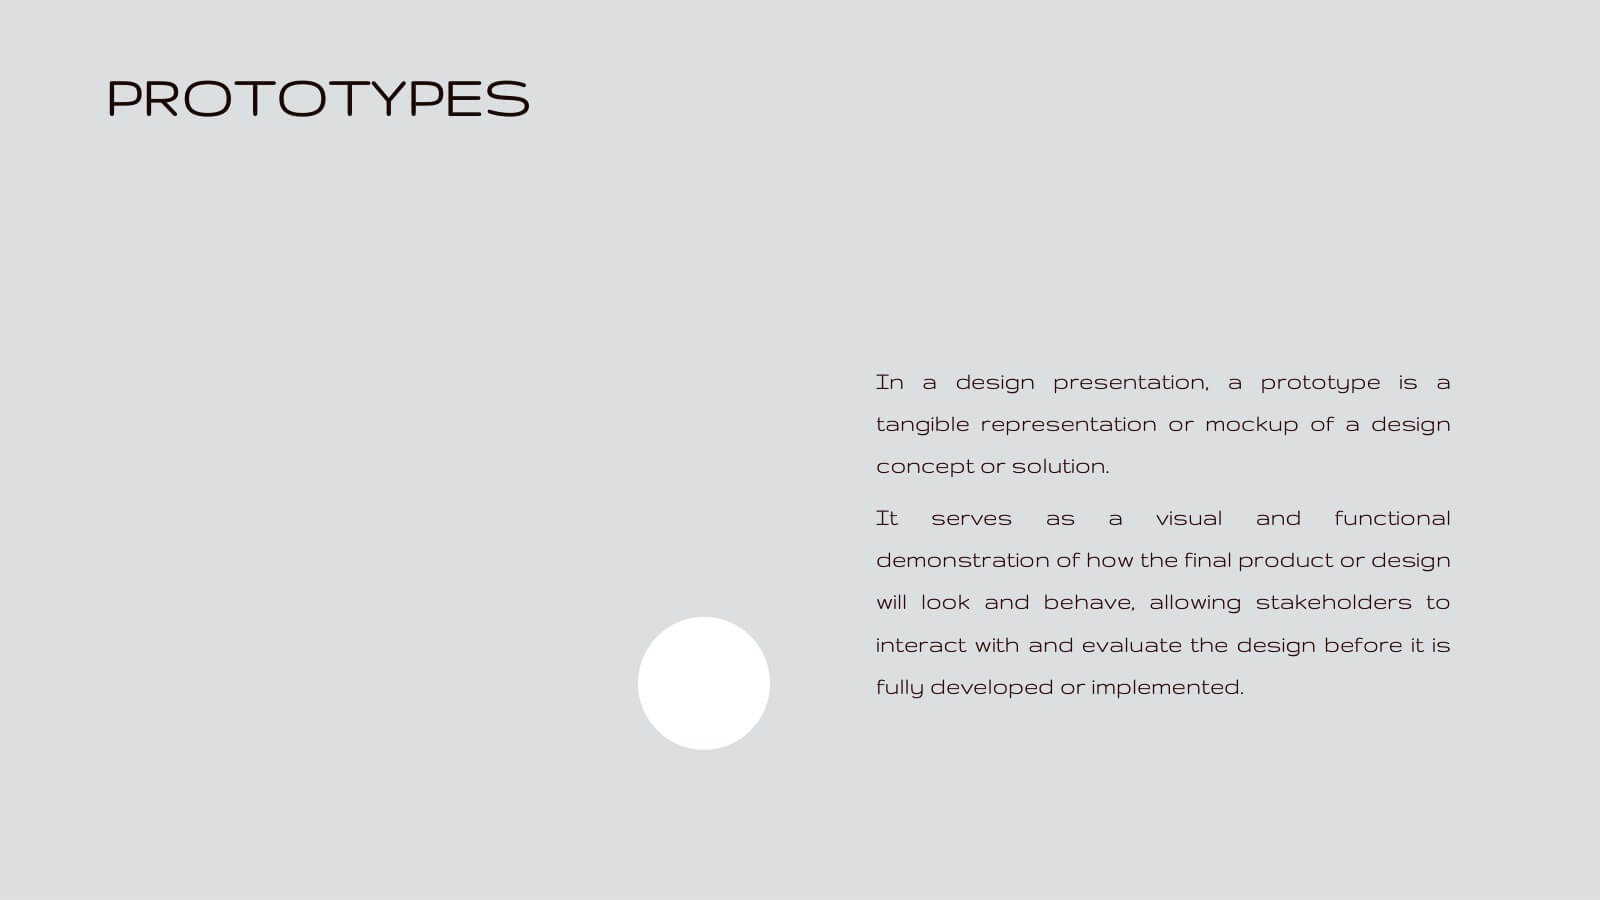
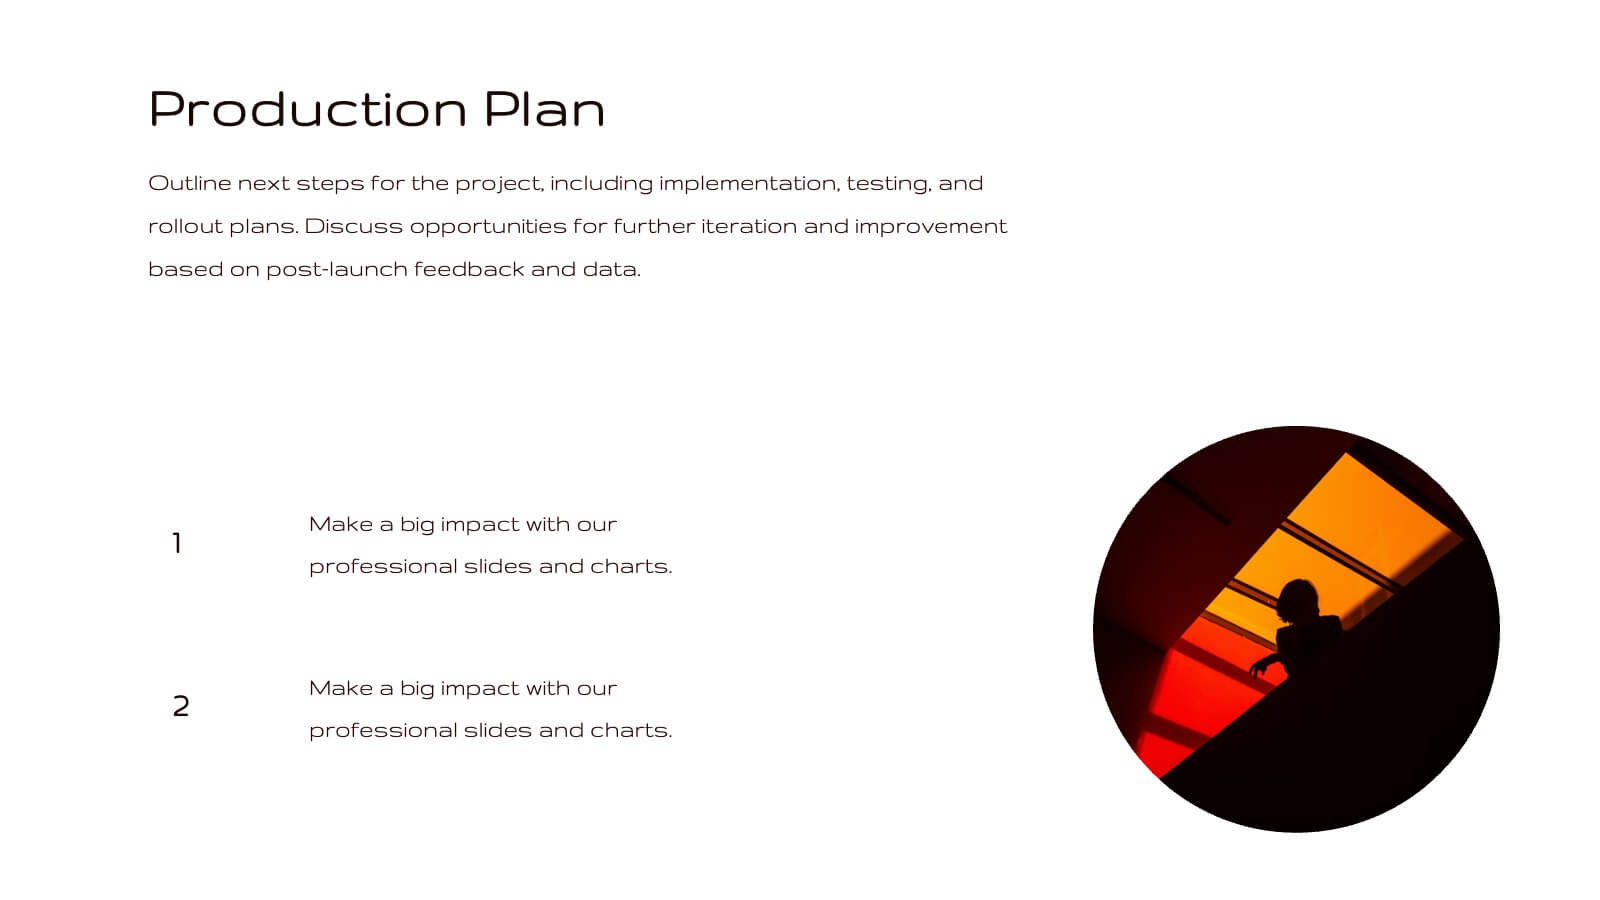
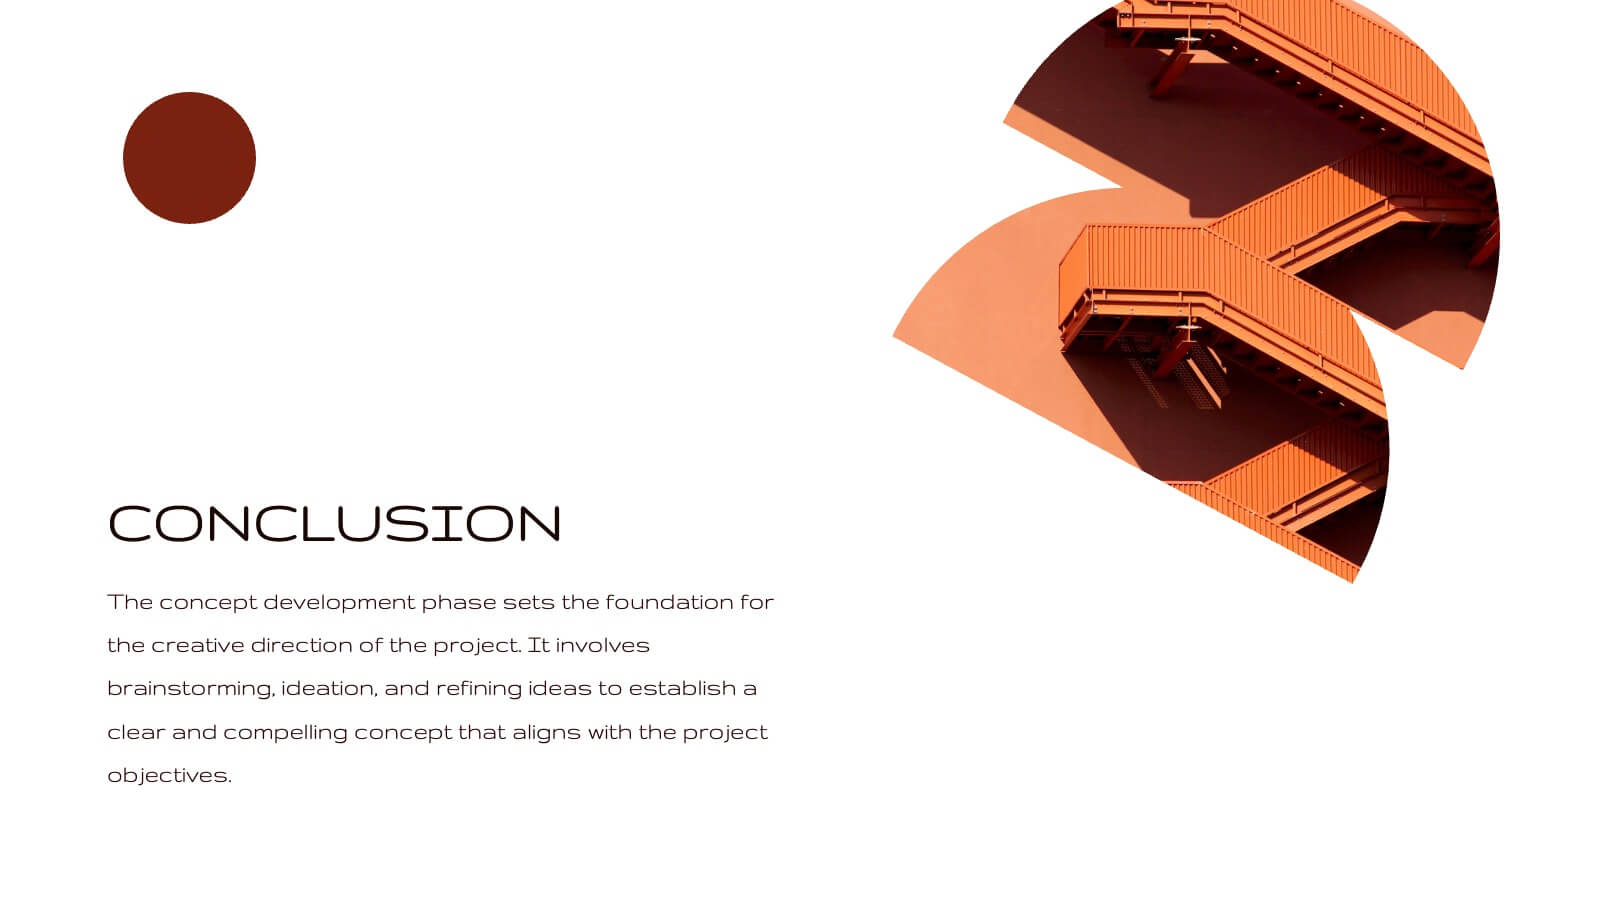
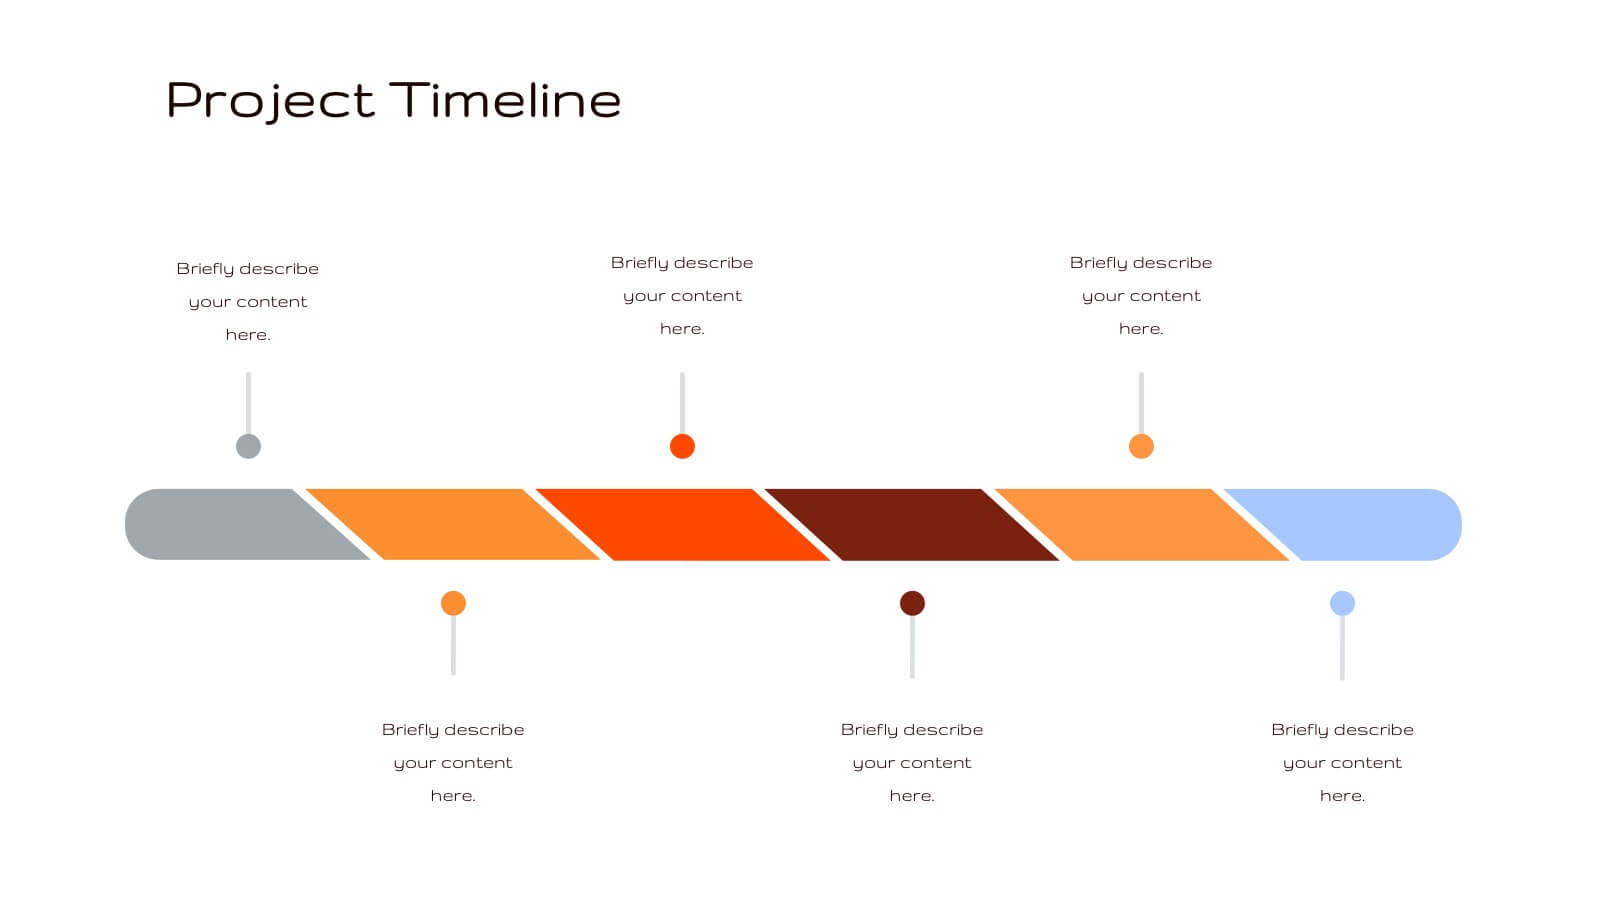
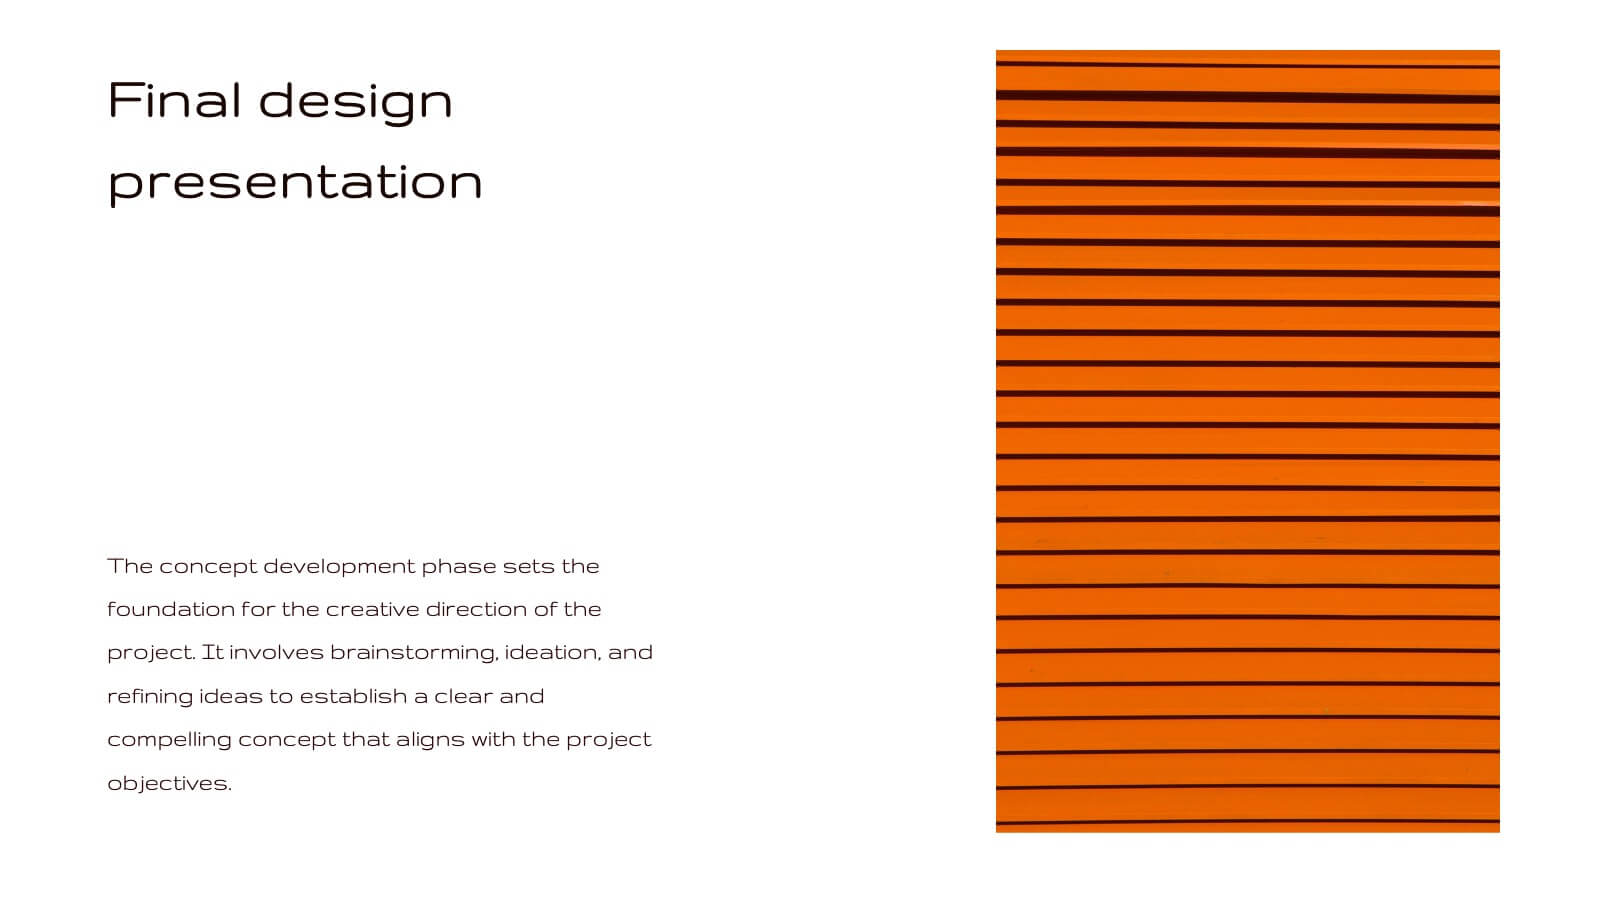
Radiance Creative Design Report Presentation
Bring your design ideas to life with this vibrant, engaging presentation template. Ideal for showcasing creative processes, concept development, and project timelines, it features a striking color palette and clean layout. This template is designed to captivate your audience and clearly communicate your design vision. Compatible with PowerPoint, Keynote, and Google Slides, it’s perfect for any platform.