


Características


¿Tienes alguna pregunta?
Recomendar


6 diapositivas
Public Healthcare System Strategy Presentation
Present key components of your medical or government plan with the Public Healthcare System Strategy Presentation. This clean and modern slide design uses a heart-centered layout with five surrounding icons to highlight core pillars—perfect for policy updates, strategy overviews, or health service workflows. Fully editable in Canva, PowerPoint, Keynote, and Google Slides.


10 diapositivas
Project Budget Breakdown Presentation
The "Project Budget Breakdown Presentation" template offers a clear and efficient way to visualize budget allocations within a project. It uses a visually appealing color scheme that highlights four different budget segments, each represented by a different color to ensure quick readability and easy understanding. The template allows you to illustrate percentages and corresponding financial values, making it straightforward for stakeholders to grasp budget allocations at a glance. This template is highly beneficial for project managers, financial analysts, and business executives who need to present and discuss budgetary details clearly and concisely in project meetings or budget reviews. It is adaptable for use in various industries, including construction, IT, marketing, and research development, supporting effective budget management and transparency.


4 diapositivas
Idea Generation for Business Development Presentation
Visualize your brainstorming process with this dynamic lightbulb-themed slide. Perfect for showcasing strategic thinking, innovation pipelines, or development stages. With colorful icons and space for four key points, it’s easy to tailor in PowerPoint, Keynote, or Google Slides. Ideal for entrepreneurs, startups, and corporate ideation sessions. Clean, modern, and impactful.


7 diapositivas
Lifecycle Stages in Customer Experience Presentation
Showcase the full customer journey with this Lifecycle Stages in Customer Experience presentation. Featuring a sleek infinity loop layout, this slide is ideal for visualizing cyclical engagement stages—like acquisition, onboarding, retention, and advocacy. Clean design and labeled touchpoints help convey insights clearly. Fully compatible with PowerPoint, Canva, and Google Slides.


5 diapositivas
Operational Structure Layout Presentation
Visualize team hierarchies and departmental flow with this operational structure layout. Ideal for displaying reporting lines, management roles, or project leads. Clean, minimal, and easy to edit in Canva, PowerPoint, or Google Slides—perfect for internal presentations, HR planning, or business development overviews. Keep your structure clear and professional.


6 diapositivas
Global Transportation & Logistics Infographics
The "Global Transportation and Logistics" infographic template, suitable for PowerPoint, Keynote, and Google Slides, is an invaluable tool for professionals in the logistics, shipping, and supply chain industries. This comprehensive template is designed to effectively communicate the complexities and scope of global transportation and logistics. This template features key elements such as global shipping routes, logistics management, and supply chain operations. Its detailed and informative design is perfect for presentations that need to illustrate the intricacies of global logistics, from transportation networks to logistical challenges. This is especially useful for strategic planning, educational purposes, or corporate presentations in the logistics sector. The color scheme of the template reflects global connectivity and efficiency, incorporating shades of blue, green, and earth tones. This professional and visually appealing design not only enhances the clarity of the information but also adds a global perspective to your presentation. Whether used for training, client meetings, or industry conferences, this template ensures your insights into global transportation and logistics are presented with precision and professionalism.
5 diapositivas
Feedback Rating Smile Icons Presentation
Light up your presentation with a playful visual that turns audience feedback into clear, colorful insights. This slide helps you compare ratings, highlight sentiment patterns, and present review data in a friendly, memorable way. Perfect for surveys, reports, and performance reviews. Fully compatible with PowerPoint, Keynote, and Google Slides.


6 diapositivas
4 Stage Roadmap Template
Navigate your projects with clarity using our "4 Stage Roadmap Template." This engaging presentation template offers a unique, pathway-like design to outline the progression of any project through four distinct stages. Each step is visually differentiated, making it easy to follow and understand the sequence and dependencies of tasks. Perfect for project managers and teams, this template ensures your strategic milestones are visually aligned and easy to communicate. Compatible with PowerPoint, Keynote, and Google Slides, it's an essential tool for effective project visualization and management.


15 diapositivas
Business Journal Infographic
A Business Journal Infographic is a visual representation of data, information, or concepts related to business topics that typically follow the style and format often found in business journals or publications. This infographic is designed to present complex information quickly and clearly. The purpose of this is to convey information in a visually engaging and easily digestible format, making it easier for readers to grasp complex business concepts or data. With this template transform your business narrative into a captivating visual story that not only informs but inspires readers to delve into the world of entrepreneurship.


6 diapositivas
Tables of Content Analysis Infographic
Table of Contents analysis refers to the examination and evaluation of the structure and content of a document's table of contents. It is commonly used as a preliminary step to understand the flow of information within a longer document, such as a book, report, thesis, or research paper. This infographic template provides insights into the document's structure and can help readers determine whether the document is relevant to their needs. This infographic is designed to provide a quick overview of the topics covered in the document and their distribution, helping readers understand the organization of the content at a glance.


12 diapositivas
Compliance and Policy Management Presentation
Visualize your compliance ecosystem with the Compliance and Policy Management Presentation. Designed around a planetary orbit concept, this slide maps core policies at the center with surrounding regulations and enforcement layers. Each orbit can represent levels of governance, department roles, or regulatory zones—making it ideal for risk teams, auditors, and legal advisors. Fully customizable in PowerPoint, Keynote, and Google Slides for seamless use.


26 diapositivas
Poseidon Sales Pitch Deck Template Presentation
Unleash your persuasive power with the Poseidon Sales Pitch Deck template! This sleek and modern deck is designed to elevate your pitch, making your business the undeniable choice for potential clients or investors. With a compelling company overview and a clear problem statement, this template sets the stage for presenting your solution as the ultimate answer to your market’s challenges. The deck includes essential slides like competitive landscape analysis, revenue models, and marketing strategies to give your pitch a comprehensive edge. The visually appealing design combined with well-organized sections ensures your message is clear, concise, and impactful. Customize it to fit your brand identity and make your unique selling proposition stand out. Perfect for startups, established businesses, or anyone looking to make a powerful impression, this template is compatible with PowerPoint, Keynote, and Google Slides. Take your pitch to the next level and close those deals with confidence!


6 diapositivas
Employee Survey Results Infographic
"Survey results" typically refer to the collected data and findings from a survey conducted to gather information from a specific group of people, often for the purpose of research or decision-making. This infographic template is a visual representation of the data collected from an employee survey. It presents key findings, insights, and trends in a visually engaging format. This allows you to summarize the importance of employee feedback, and the positive impact of improvement efforts. This survey results infographic can be shared within the organization to communicate the survey outcomes to employees, managers, and leadership.


8 diapositivas
Target Demographic Insights
Get a clear view of your audience with the Target Demographic Insights Presentation. This template uses a visual bullseye layout to highlight key demographic data through concentric circles and percentages. Ideal for marketers, brand strategists, or analysts, it helps you communicate audience segmentation and market reach effectively. Fully editable in PowerPoint, Keynote, and Google Slides.


10 diapositivas
Effective Team Communication Presentation
Streamline your Effective Team Communication with this modern infographic template. Designed to enhance collaboration and workflow clarity, this slide helps visualize key communication strategies for better team efficiency. Fully customizable in PowerPoint, Keynote, and Google Slides, making it perfect for corporate training, leadership meetings, and project planning.


22 diapositivas
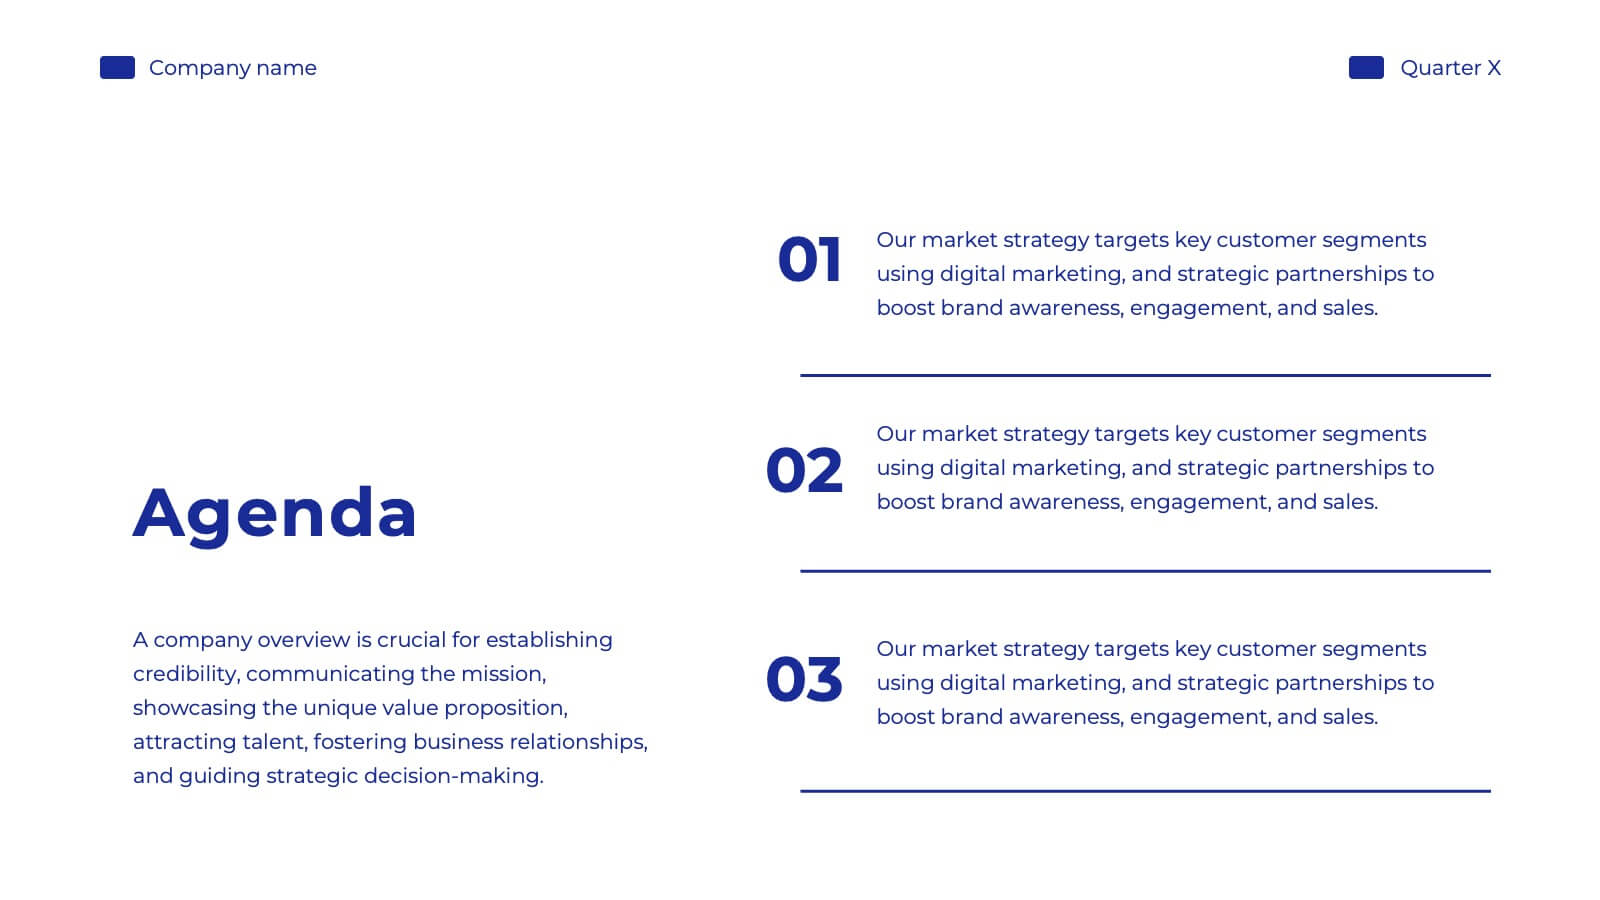
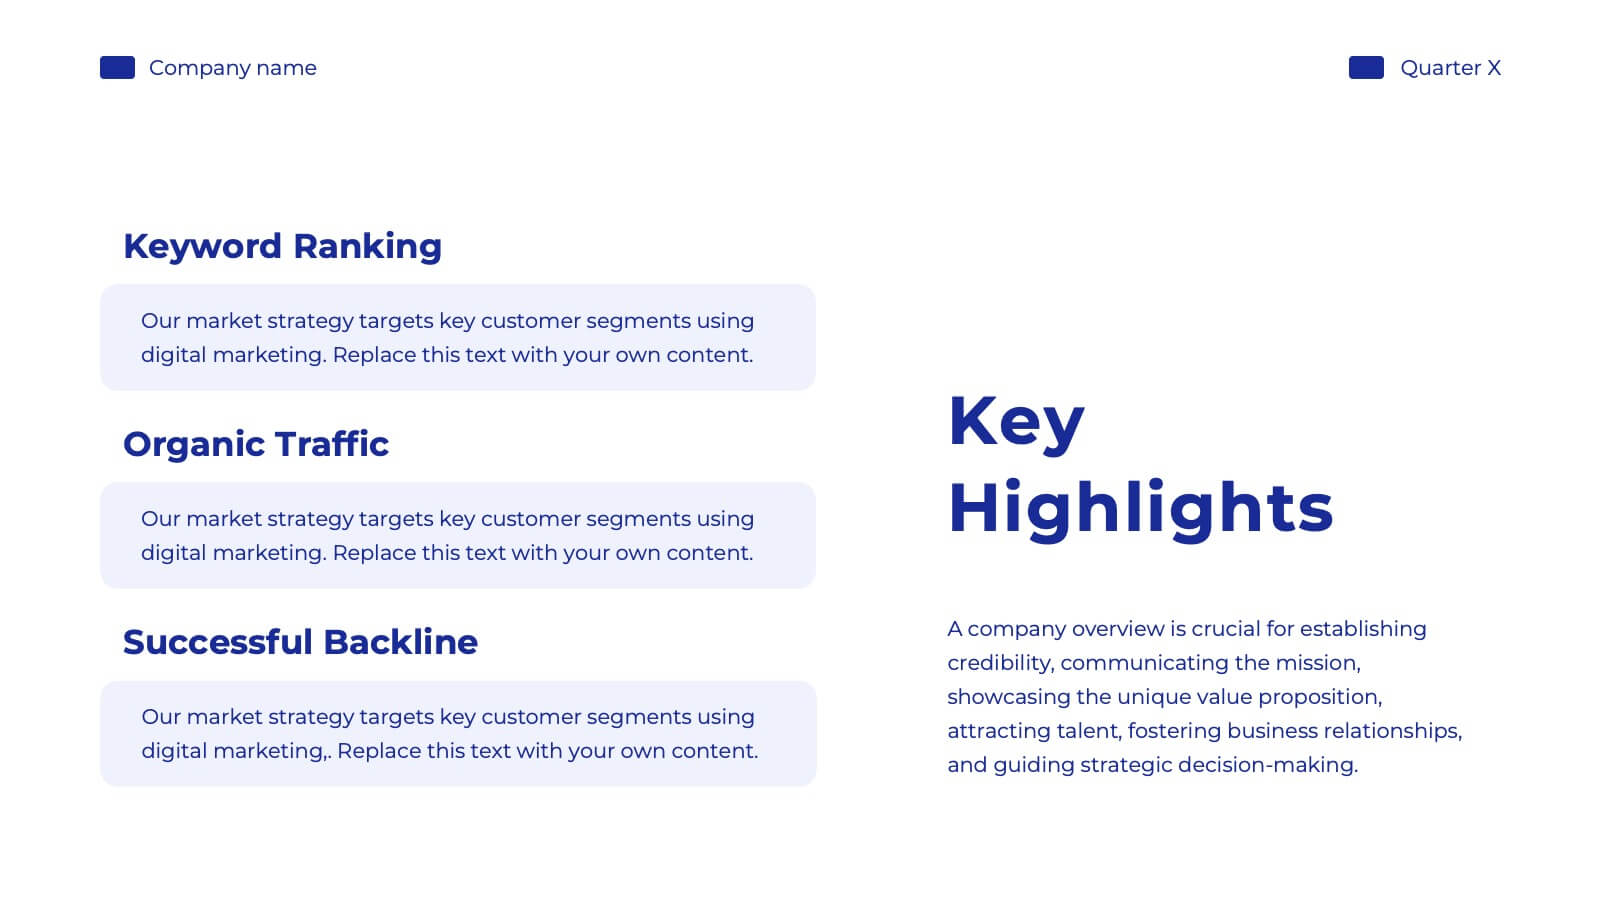
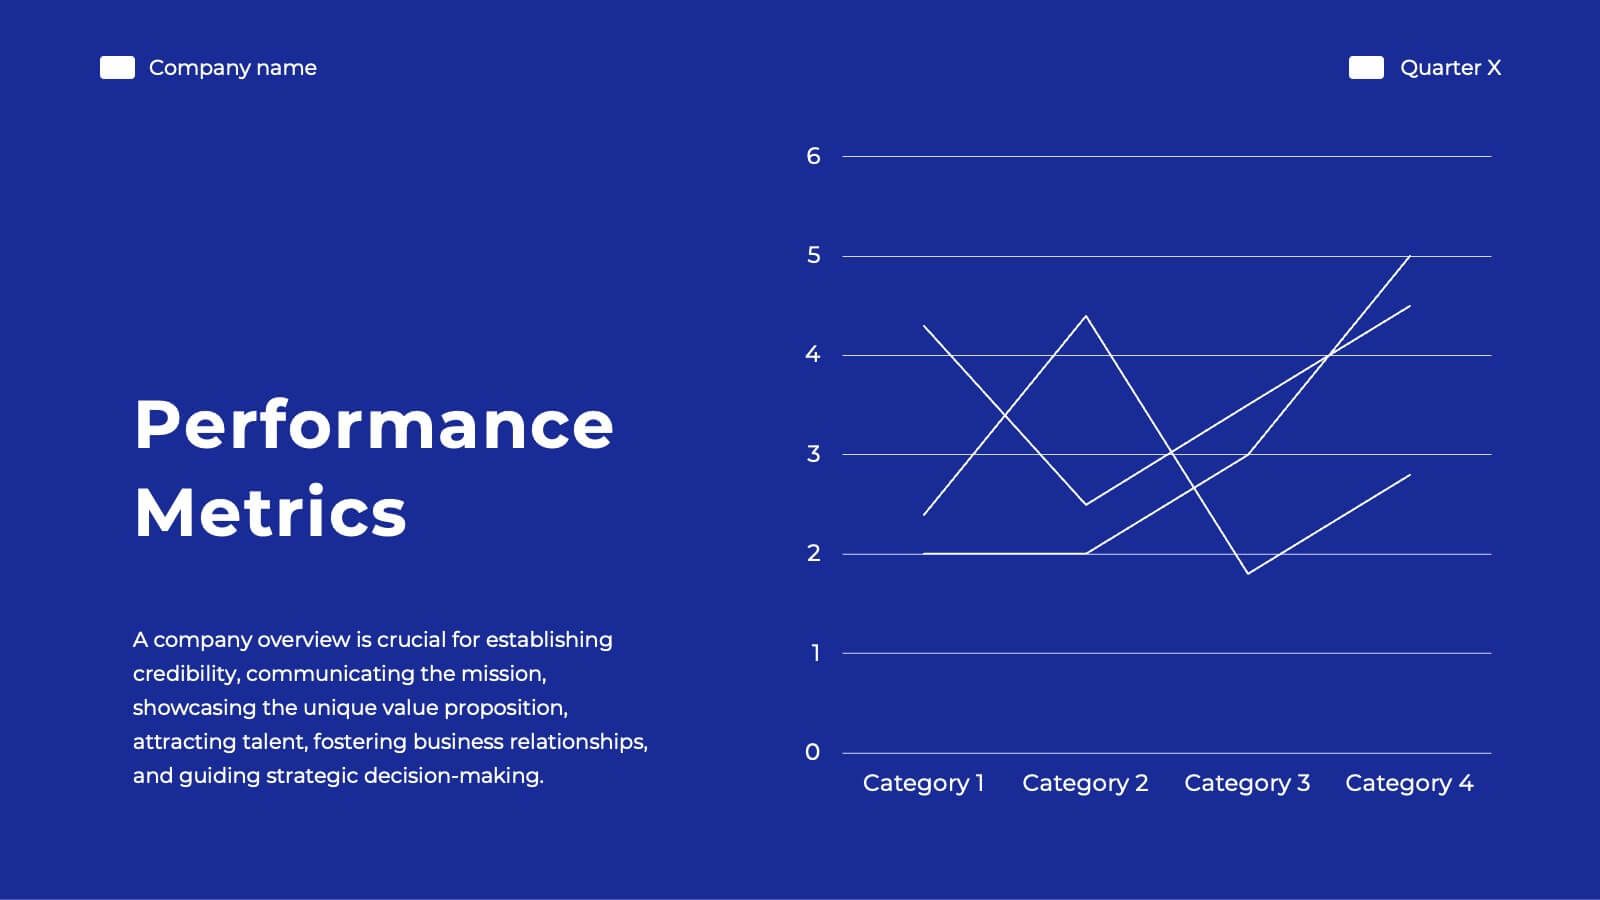
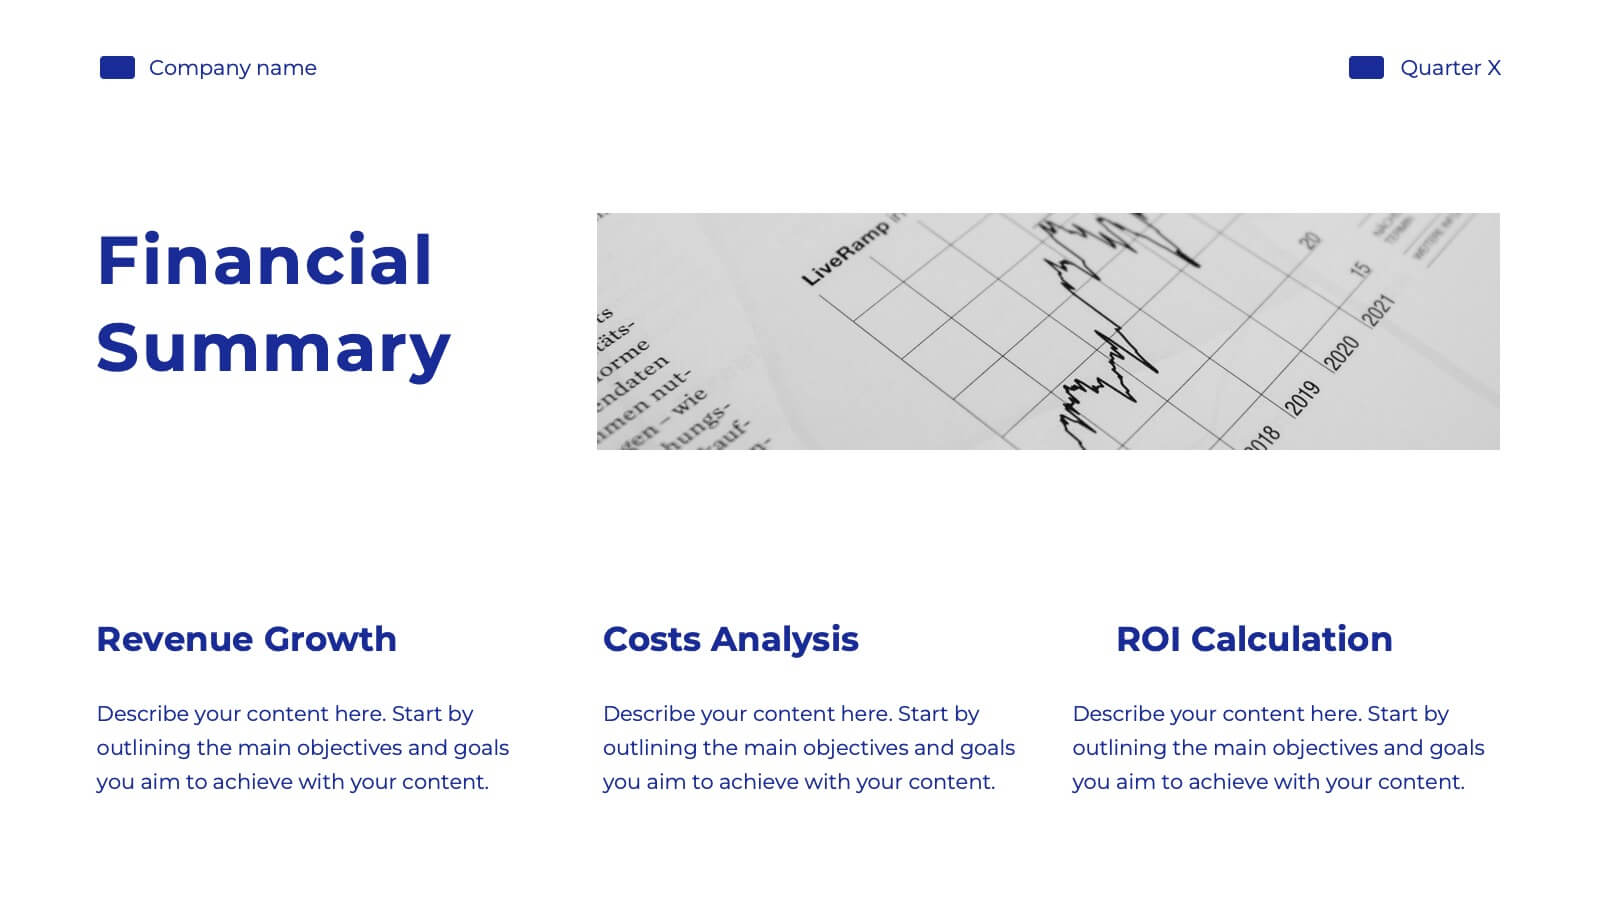
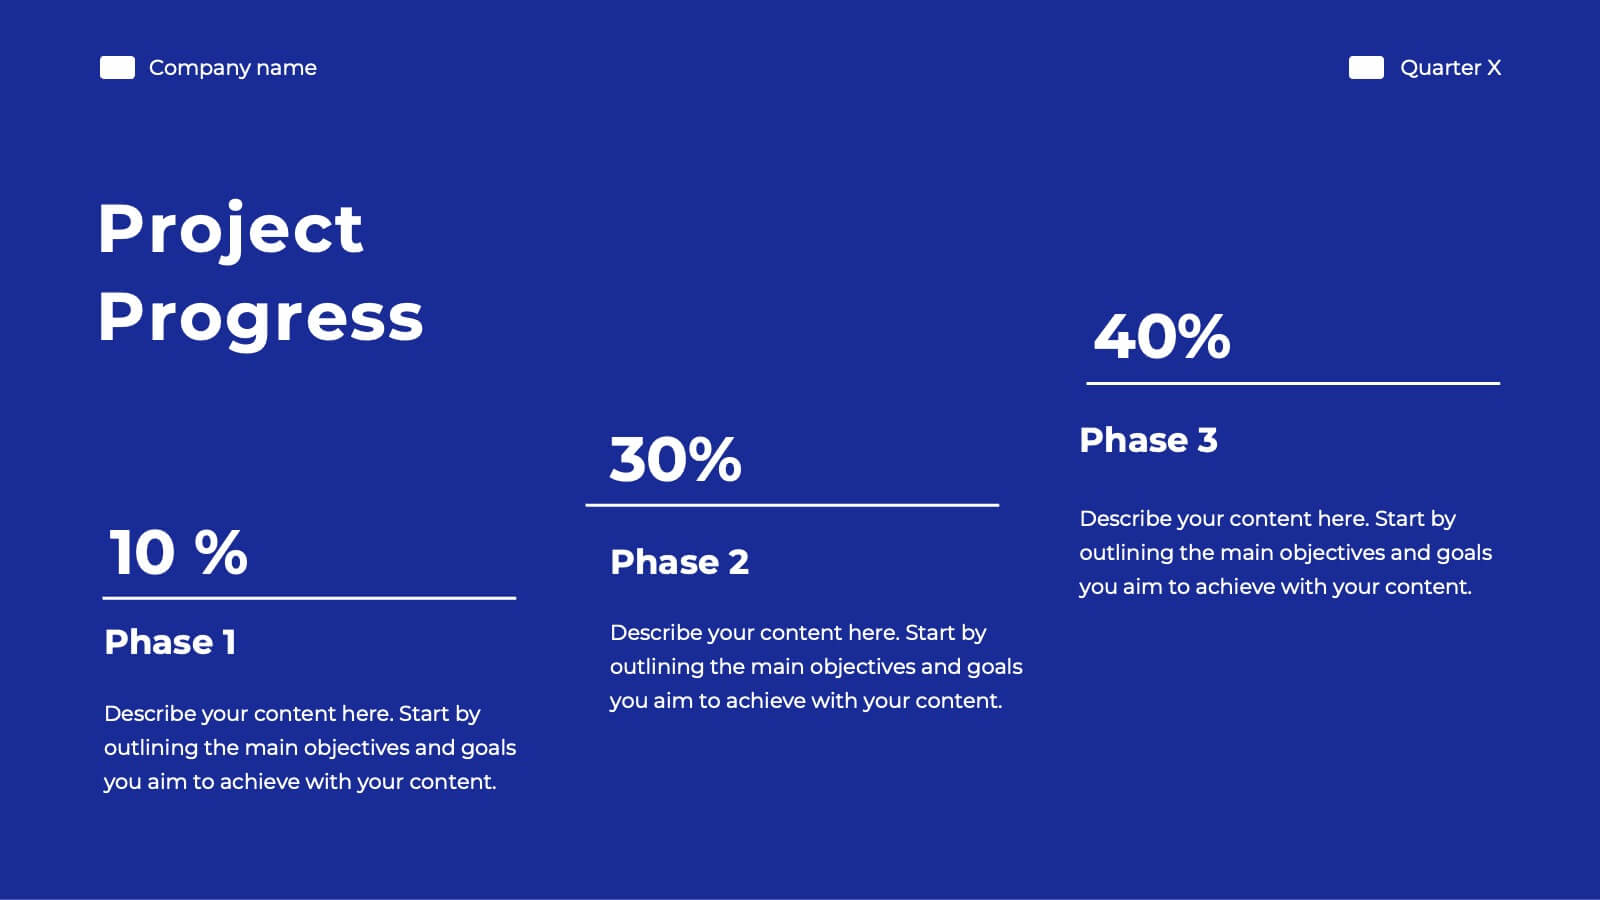
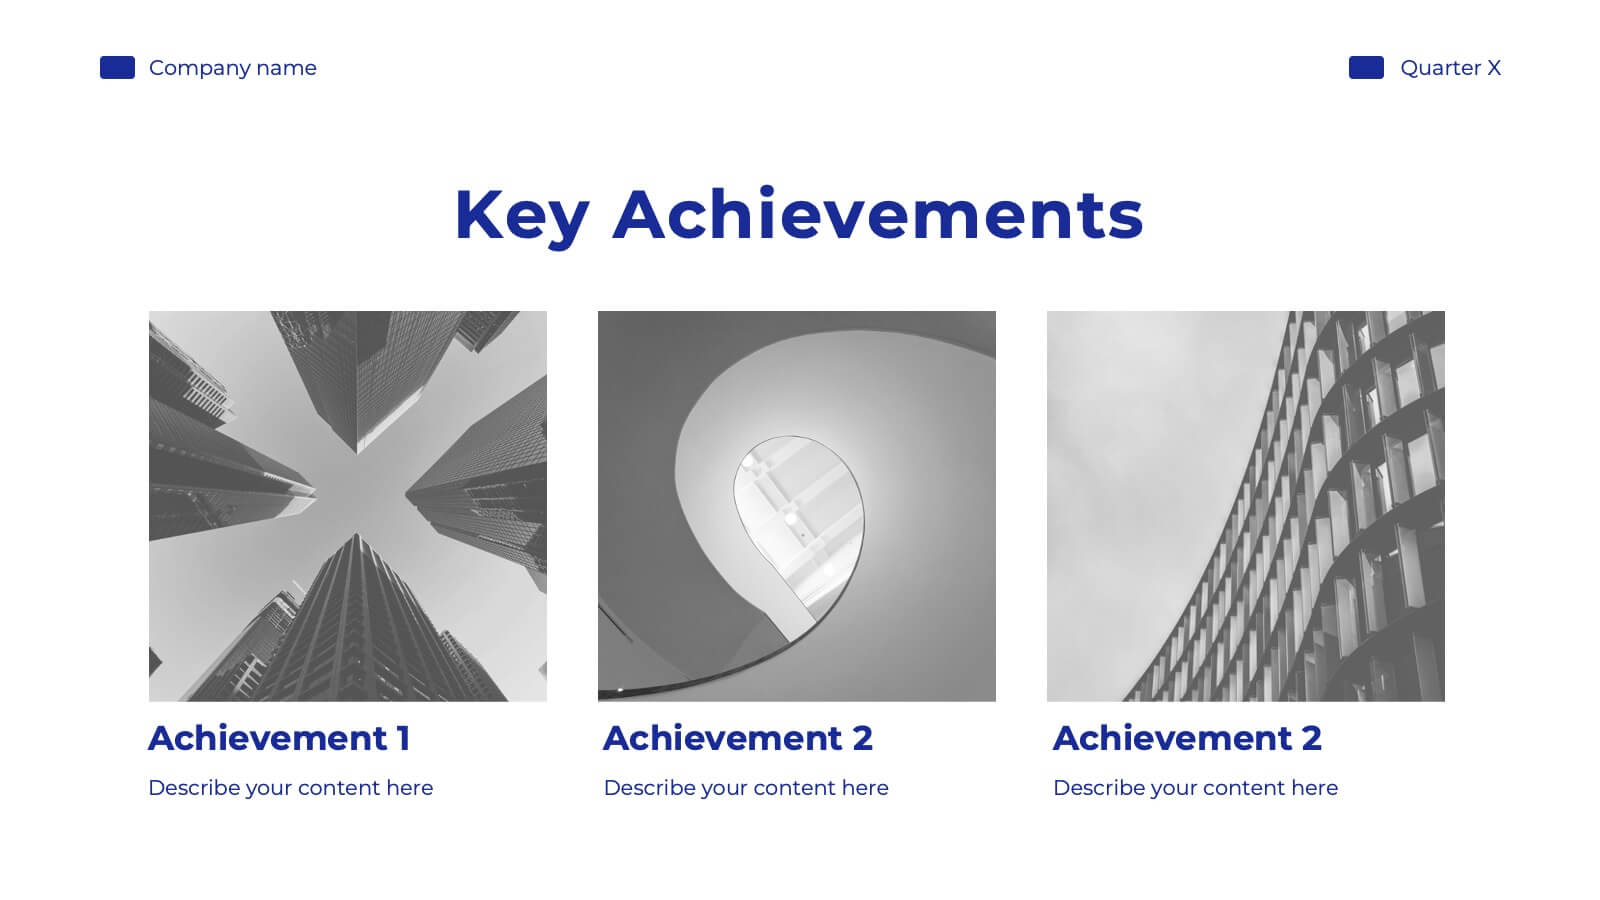
Frost Financial Report Presentation
Transform your brand with this comprehensive rebranding project template! Perfect for presenting brand identity, market analysis, and strategic positioning, it includes slides for logos, color palettes, and brand guidelines. Engage your audience with visually striking designs and detailed content. Compatible with PowerPoint, Keynote, and Google Slides for easy, professional presentations on any platform.


5 diapositivas
Brief Overview of Key Insights Presentation
Present essential information at a glance with this Brief Overview of Key Insights slide. Designed around a bold key graphic, this layout highlights up to four major takeaways with icons and concise descriptions. Ideal for summaries, analysis highlights, or recommendations. Fully editable in Canva, PowerPoint, or Google Slides.