


Características


¿Tienes alguna pregunta?
Recomendar


21 diapositivas
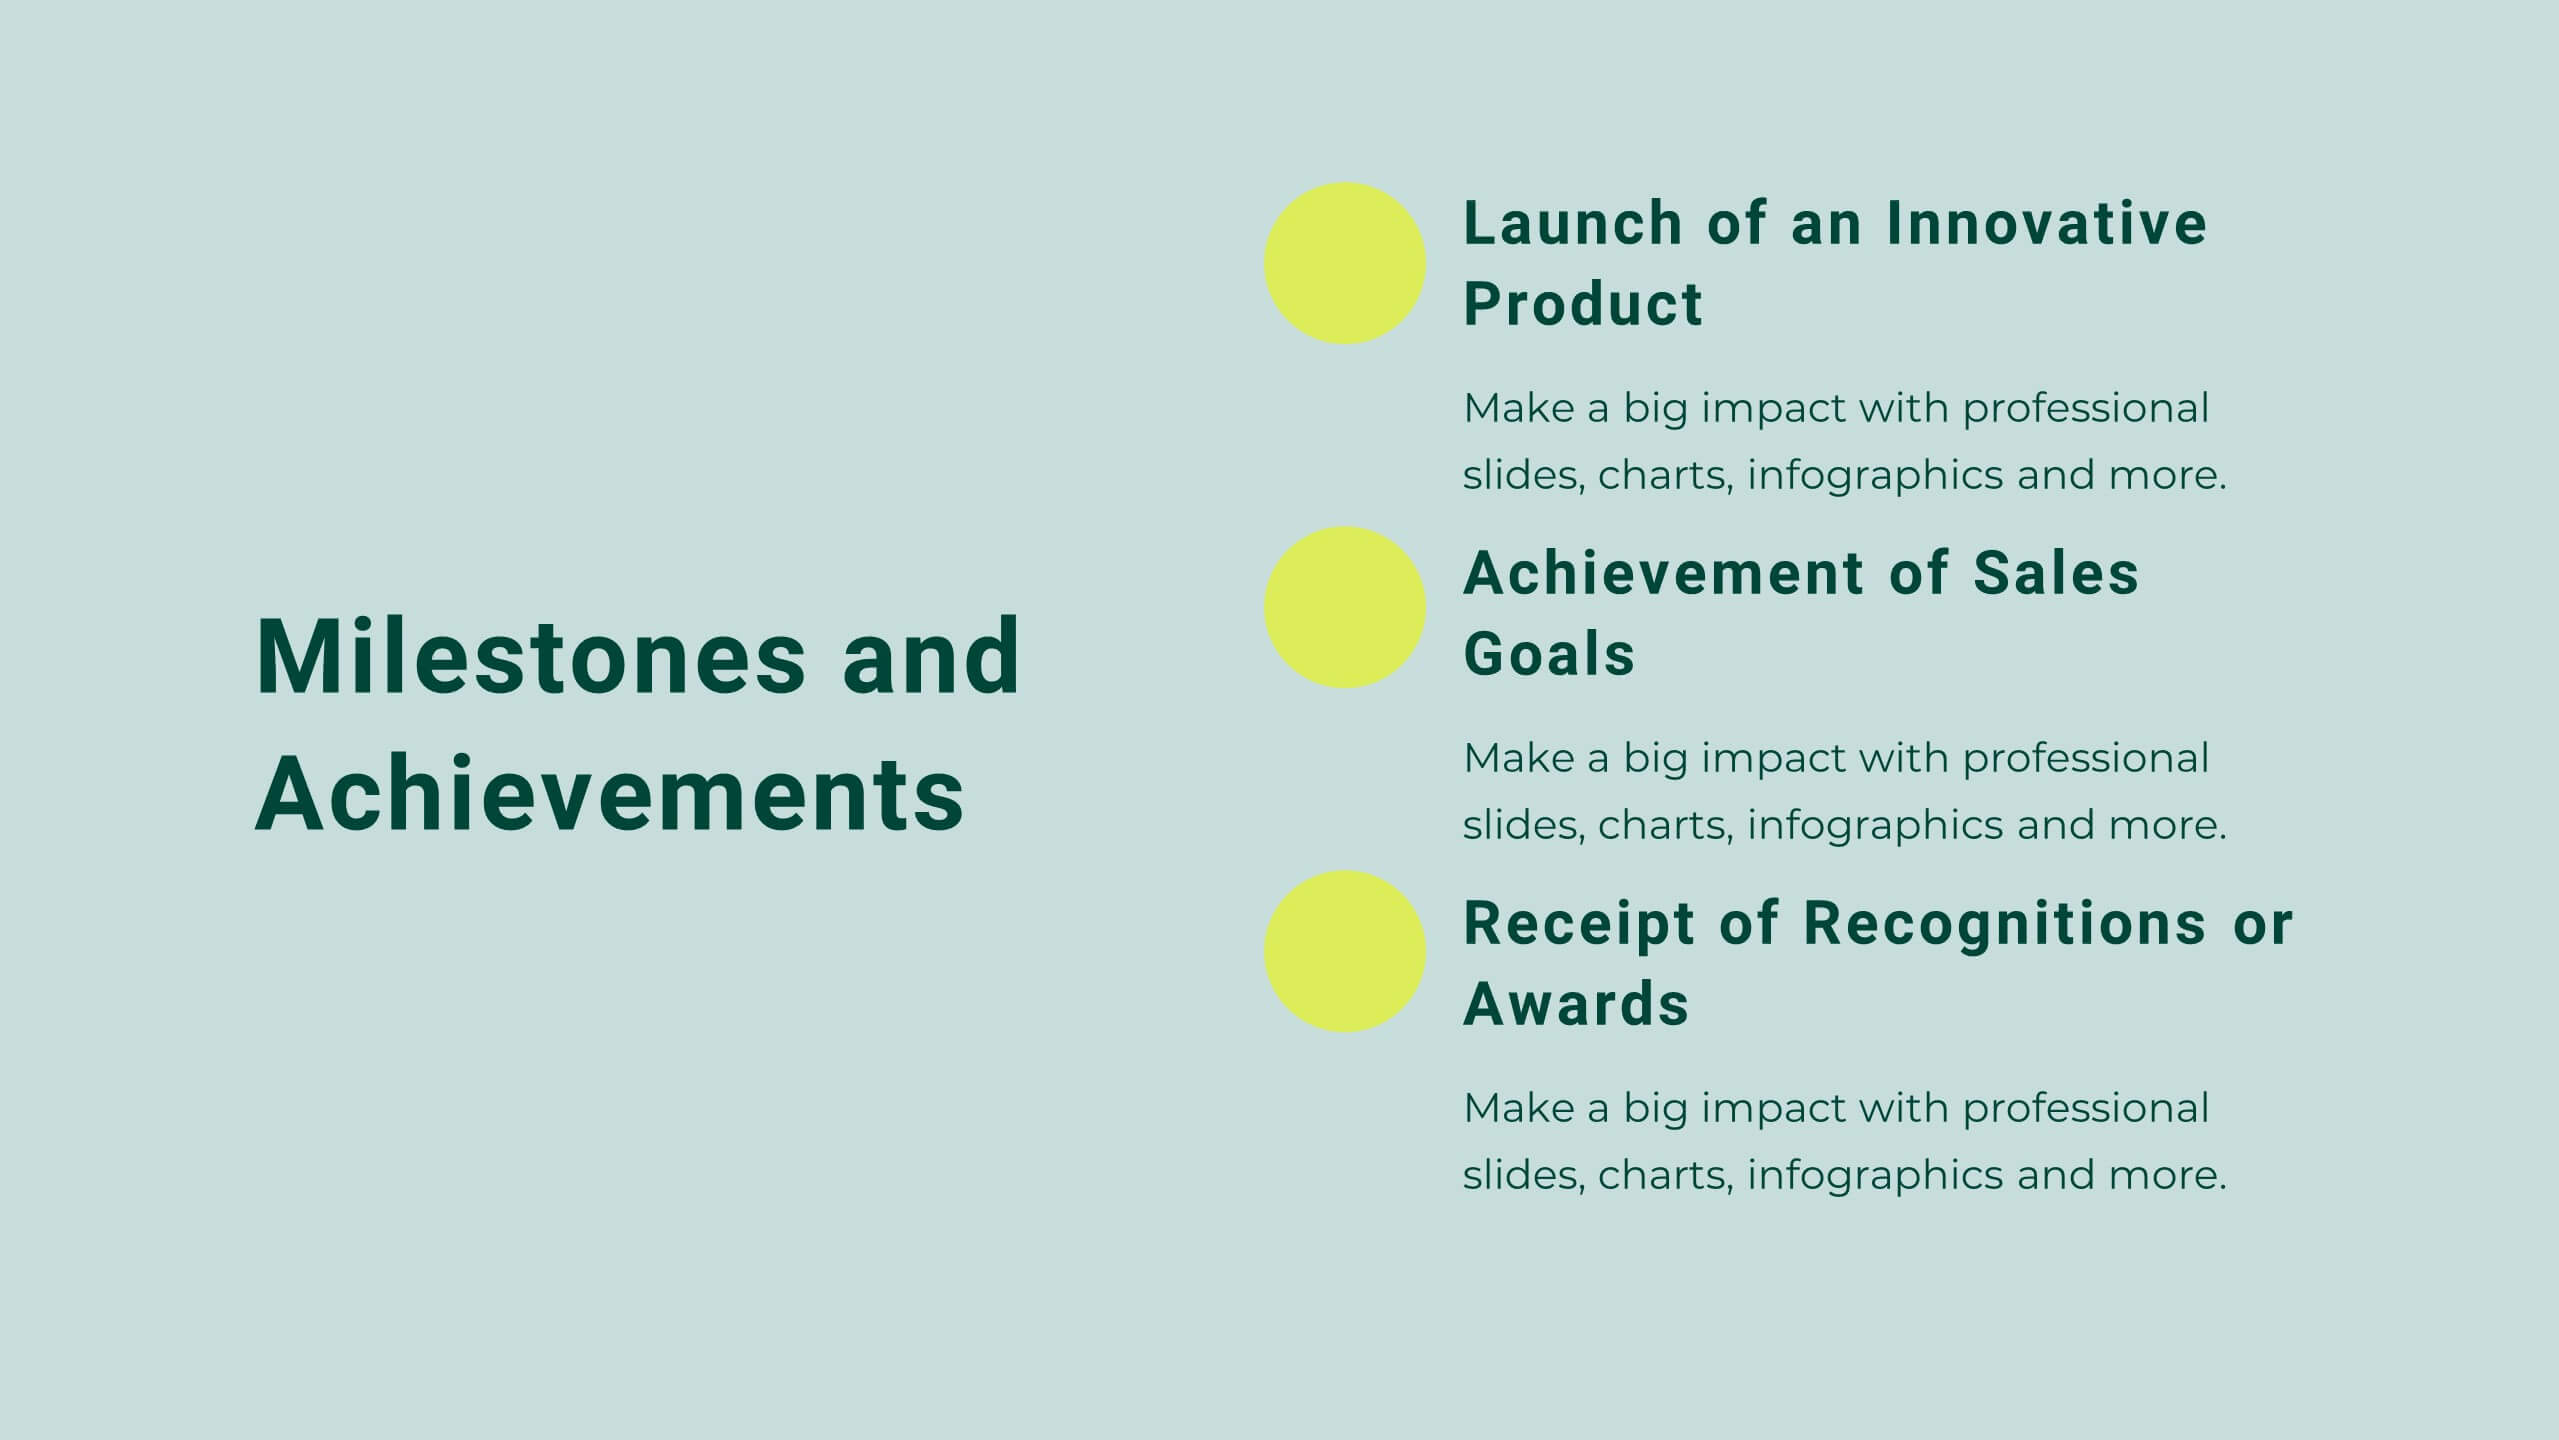
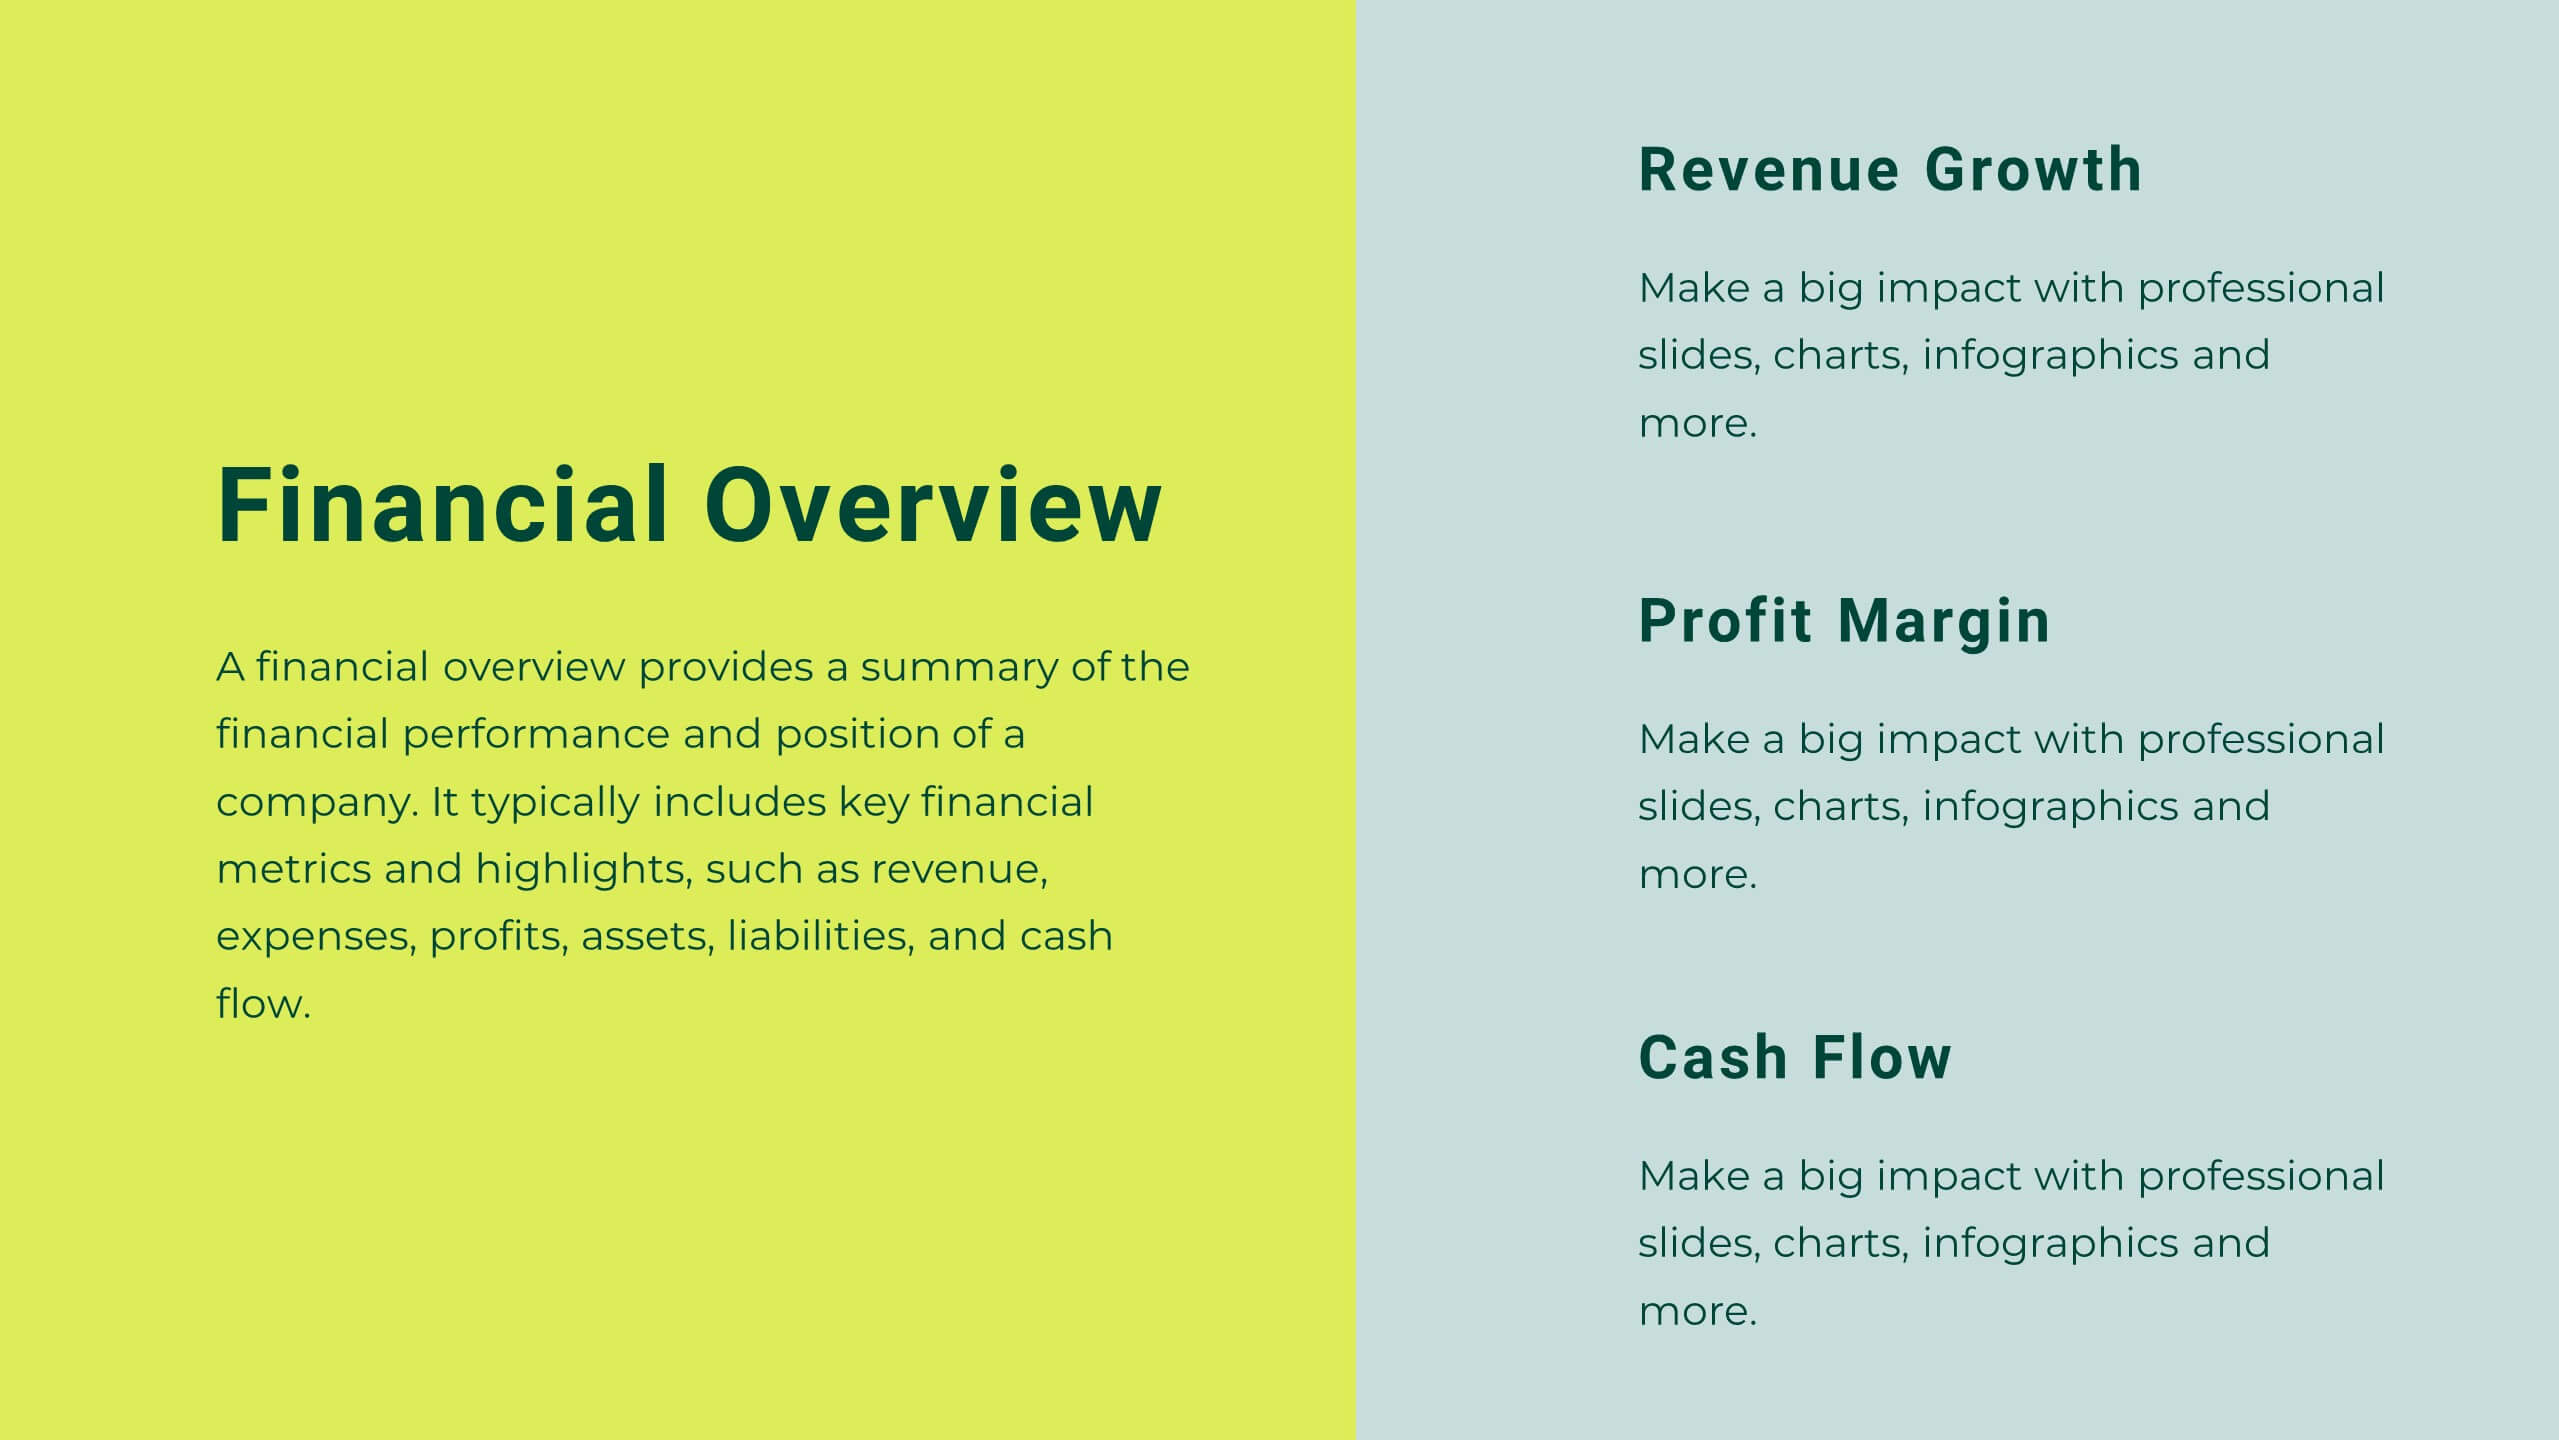
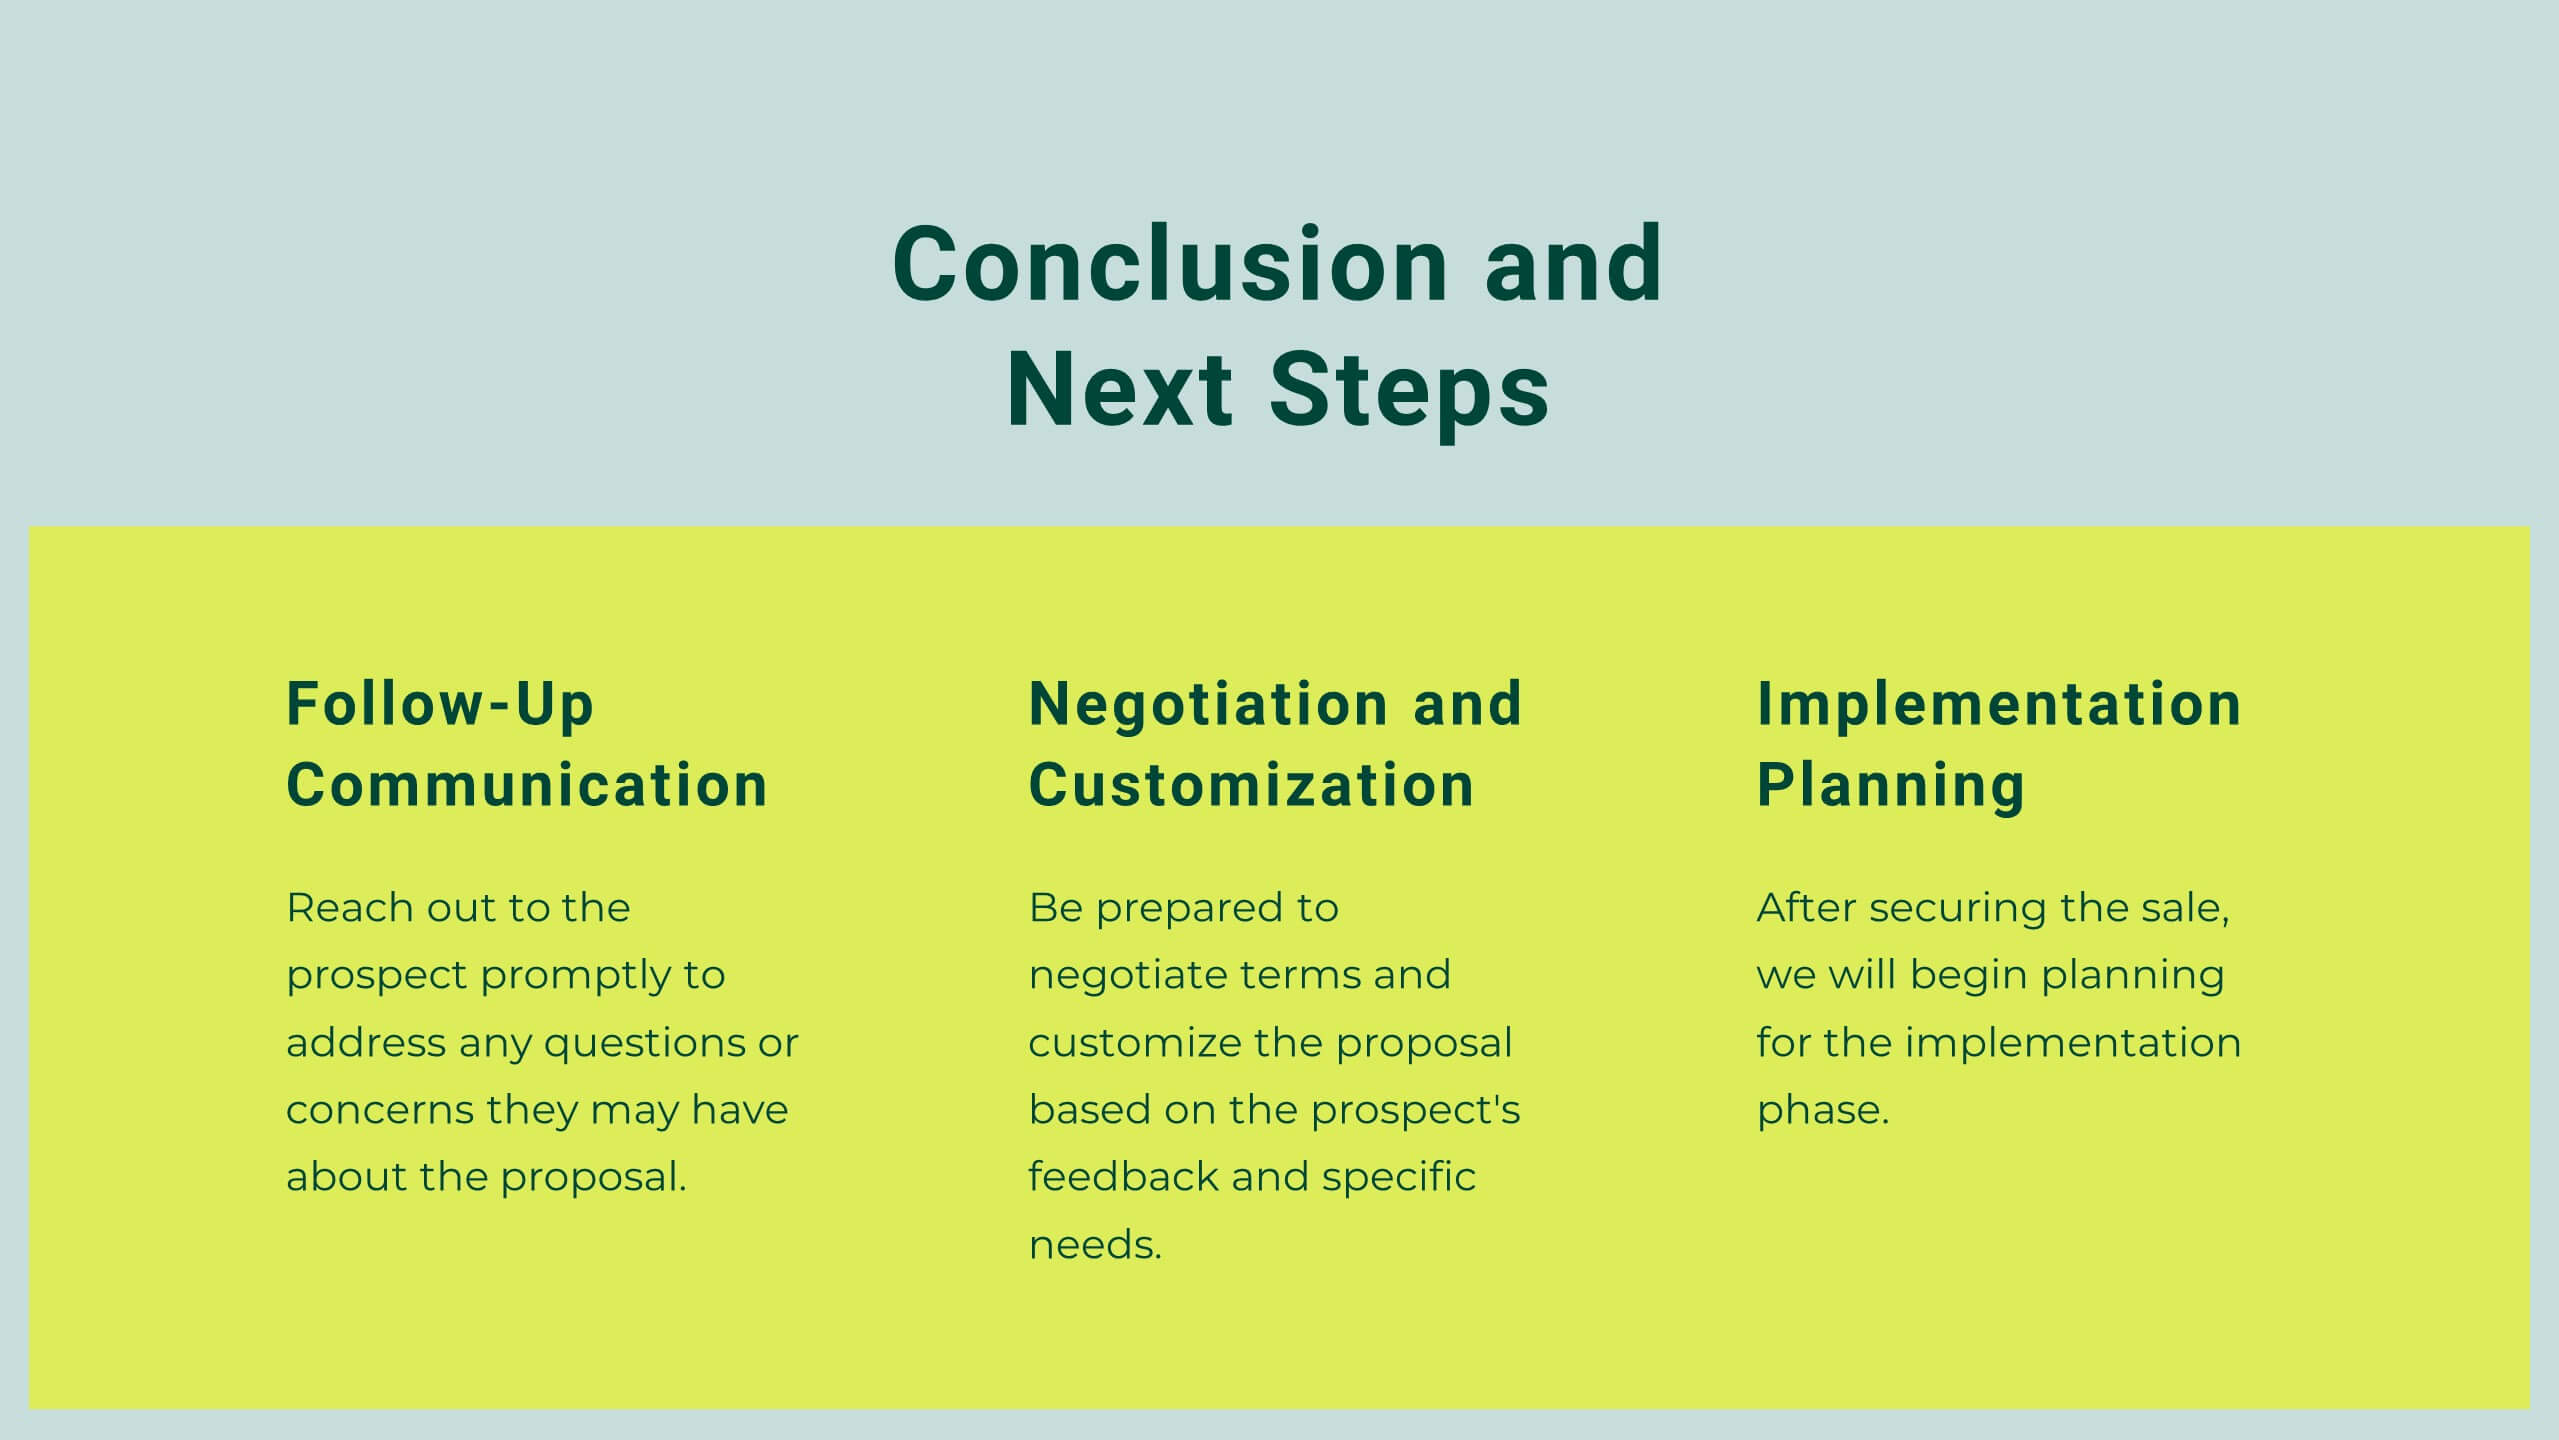
Nimbus Startup Growth Plan Presentation
Supercharge your startup's growth with this vibrant presentation template! Ideal for outlining your business plan, it includes slides for mission, market analysis, and financial overview. Capture investor attention with clear visuals and compelling content. Compatible with PowerPoint, Keynote, and Google Slides for a seamless presentation experience on any platform.


5 diapositivas
Editable Data Charts Presentation
Bring your data to life with a clean, engaging layout that makes every insight easy to understand. This presentation helps you explain percentages, comparisons, and key metrics with clarity while keeping your narrative smooth and professional. Designed for clear data storytelling and effortless editing, it's fully compatible with PowerPoint, Keynote, and Google Slides.


7 diapositivas
E-Learning Infographic Presentation Template
An E-learning Infographic is an informative design that shows all the different ways that e-learning can be used in your classroom, as well as the benefits associated with each one. This infographic illustrates the popularity of e-learning and gives tips for creating compelling learning materials. This template is equipped with all the resources needed to create your e-learning infographic. It comes fully customizable and ready-to-use. This Infographic template provides a bare-bone structure and design, leaving space for you to add your own content and create the best presentation!


6 diapositivas
Visual Business Concept Triangle
Communicate processes, concepts, or growth stages with this dynamic triangle layout. Perfect for highlighting five key ideas or steps in a sleek, professional way. Fully customizable in PowerPoint, Keynote, and Google Slides for easy personalization.


26 diapositivas
Venture Capital Dark Presentation
Present your investment vision with confidence using our Venture Capital presentation template, ideal for PowerPoint, Keynote, and Google Slides. This template is expertly crafted for venture capitalists, startup founders, and financial advisors looking to create persuasive and engaging presentations that attract investment. Our Venture Capital template is designed to showcase the potential of innovative startups to savvy investors. It includes a range of slides that detail market analysis, growth potential, business strategies, and investment opportunities, all laid out in an easy-to-understand format. With this template, you can effectively communicate complex financial data and investment propositions through clear visuals and concise text. Featuring customizable charts, graphs, and diagrams, the template allows for a personalized touch, making it easier to highlight the unique selling points of investment opportunities. Whether you're presenting to angel investors, venture capital firms, or at a funding pitch, this template will help you to articulate your message with clarity and impact. Increase the visibility of your venture capital presentations with our SEO-optimized template and position yourself as a thought leader in the field of investment and startup growth.


5 diapositivas
Agile Project Roadmap Presentation
Visualize your quarterly project plans with clarity using this Agile roadmap slide. Designed with a horizontal layout for Q1 to Q4, this infographic includes three workstreams and color-coded bars to represent initiatives or sprints. Icons provide quick visual cues for different teams or objectives. Ideal for agile teams, product managers, or project leads who need a clean, editable layout. Compatible with PowerPoint, Keynote, and Google Slides.


7 diapositivas
Daily Puzzle Infographics
Engage and entertain your audience with our daily puzzle infographic. This template is a dynamic and interactive way to present puzzles diagrams to captivate your audience. This template is designed to add an element of fun and engagement to your presentations. The design immediately grabs attention and sparks curiosity. Compatible with Powerpoint, Keynote, and Google Slides. The well-organized layout enables smooth navigation through the infographic. This is perfect for educators, game designers, content creators, or anyone seeking to add an interactive and entertaining element to their presentations.


4 diapositivas
Team Collaboration Strategy
Illustrate cross-functional teamwork with this visually engaging slide. Featuring color-coded team clusters, it's perfect for showcasing group dynamics, collaborative workflows, or project responsibilities. Use this diagram to break down organizational units, collaboration models, or department contributions. Fully editable in PowerPoint, Keynote, and Google Slides.


7 diapositivas
World Map Weather Infographic
A world weather map is a graphical representation that displays current weather conditions and forecasts across different regions of the world. Unveil the world's atmospheric tapestry with our world map weather infographic template. This visually stunning and informative infographic is your passport to understanding global weather patterns, giving you a clear view of climate diversity and trends across continents. This template is designed to provide an overview of various meteorological parameters, including temperature, precipitation, wind speed and direction, humidity, and atmospheric pressure.


5 diapositivas
Dynamic SWOT Quadrant Assessment Presentation
Present your strategy with clarity using the Dynamic SWOT Quadrant Assessment Presentation. This clean, four-quadrant layout organizes your Strengths, Weaknesses, Opportunities, and Threats in a visually balanced format, perfect for strategic reviews and planning workshops. The bold quadrant visuals help guide the audience’s focus while allowing for detailed commentary alongside each factor. Fully customizable in PowerPoint, Keynote, and Google Slides.


5 diapositivas
Country Highlight Asia Map Presentation
Showcase your regional insights with a clean and modern map that brings focus to key countries across Asia. Ideal for displaying market reach, growth metrics, or strategic locations, this visual layout makes data storytelling simple and effective. Fully compatible with PowerPoint, Keynote, and Google Slides for easy customization.


5 diapositivas
Five-Step Process Improvement Presentation
Streamline operations with the Five-Step Process Improvement presentation. This template visually maps out key phases of business optimization, using a structured timeline to highlight each step's purpose and impact. Perfect for project managers, consultants, and corporate strategists, this design helps teams track progress and refine workflows effectively. Fully editable and compatible with PowerPoint, Keynote, and Google Slides for effortless customization.


21 diapositivas
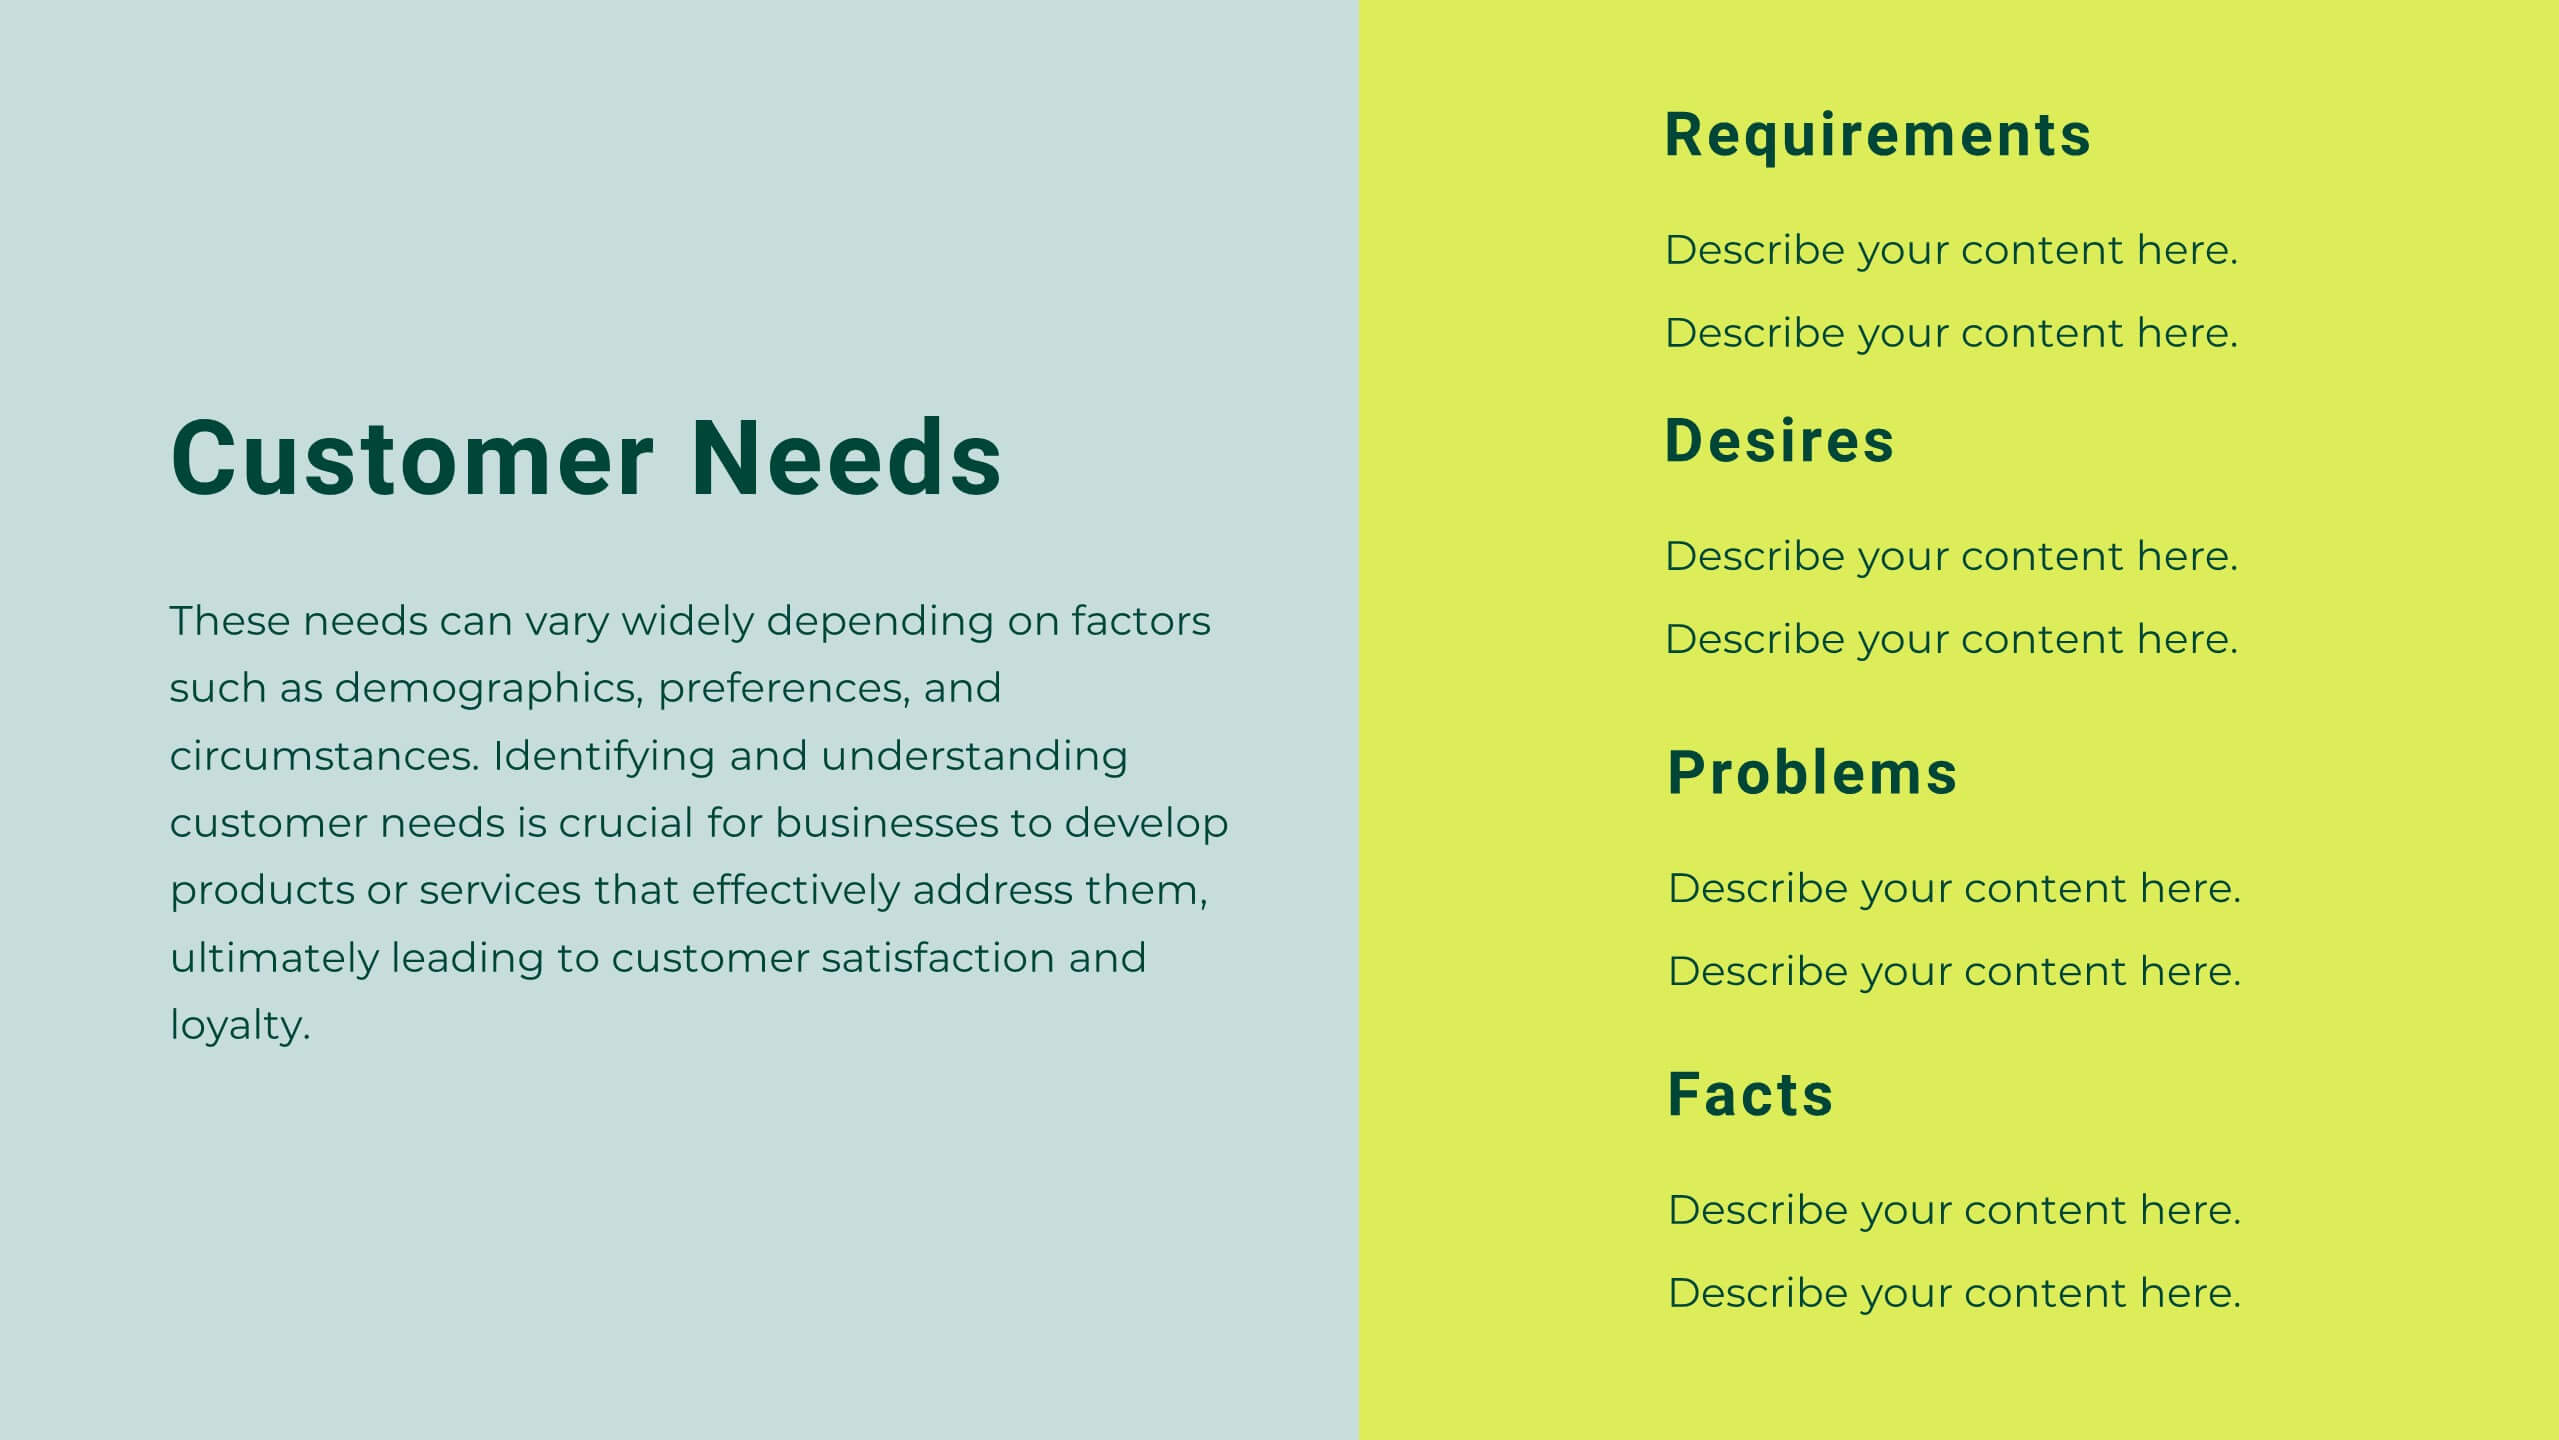
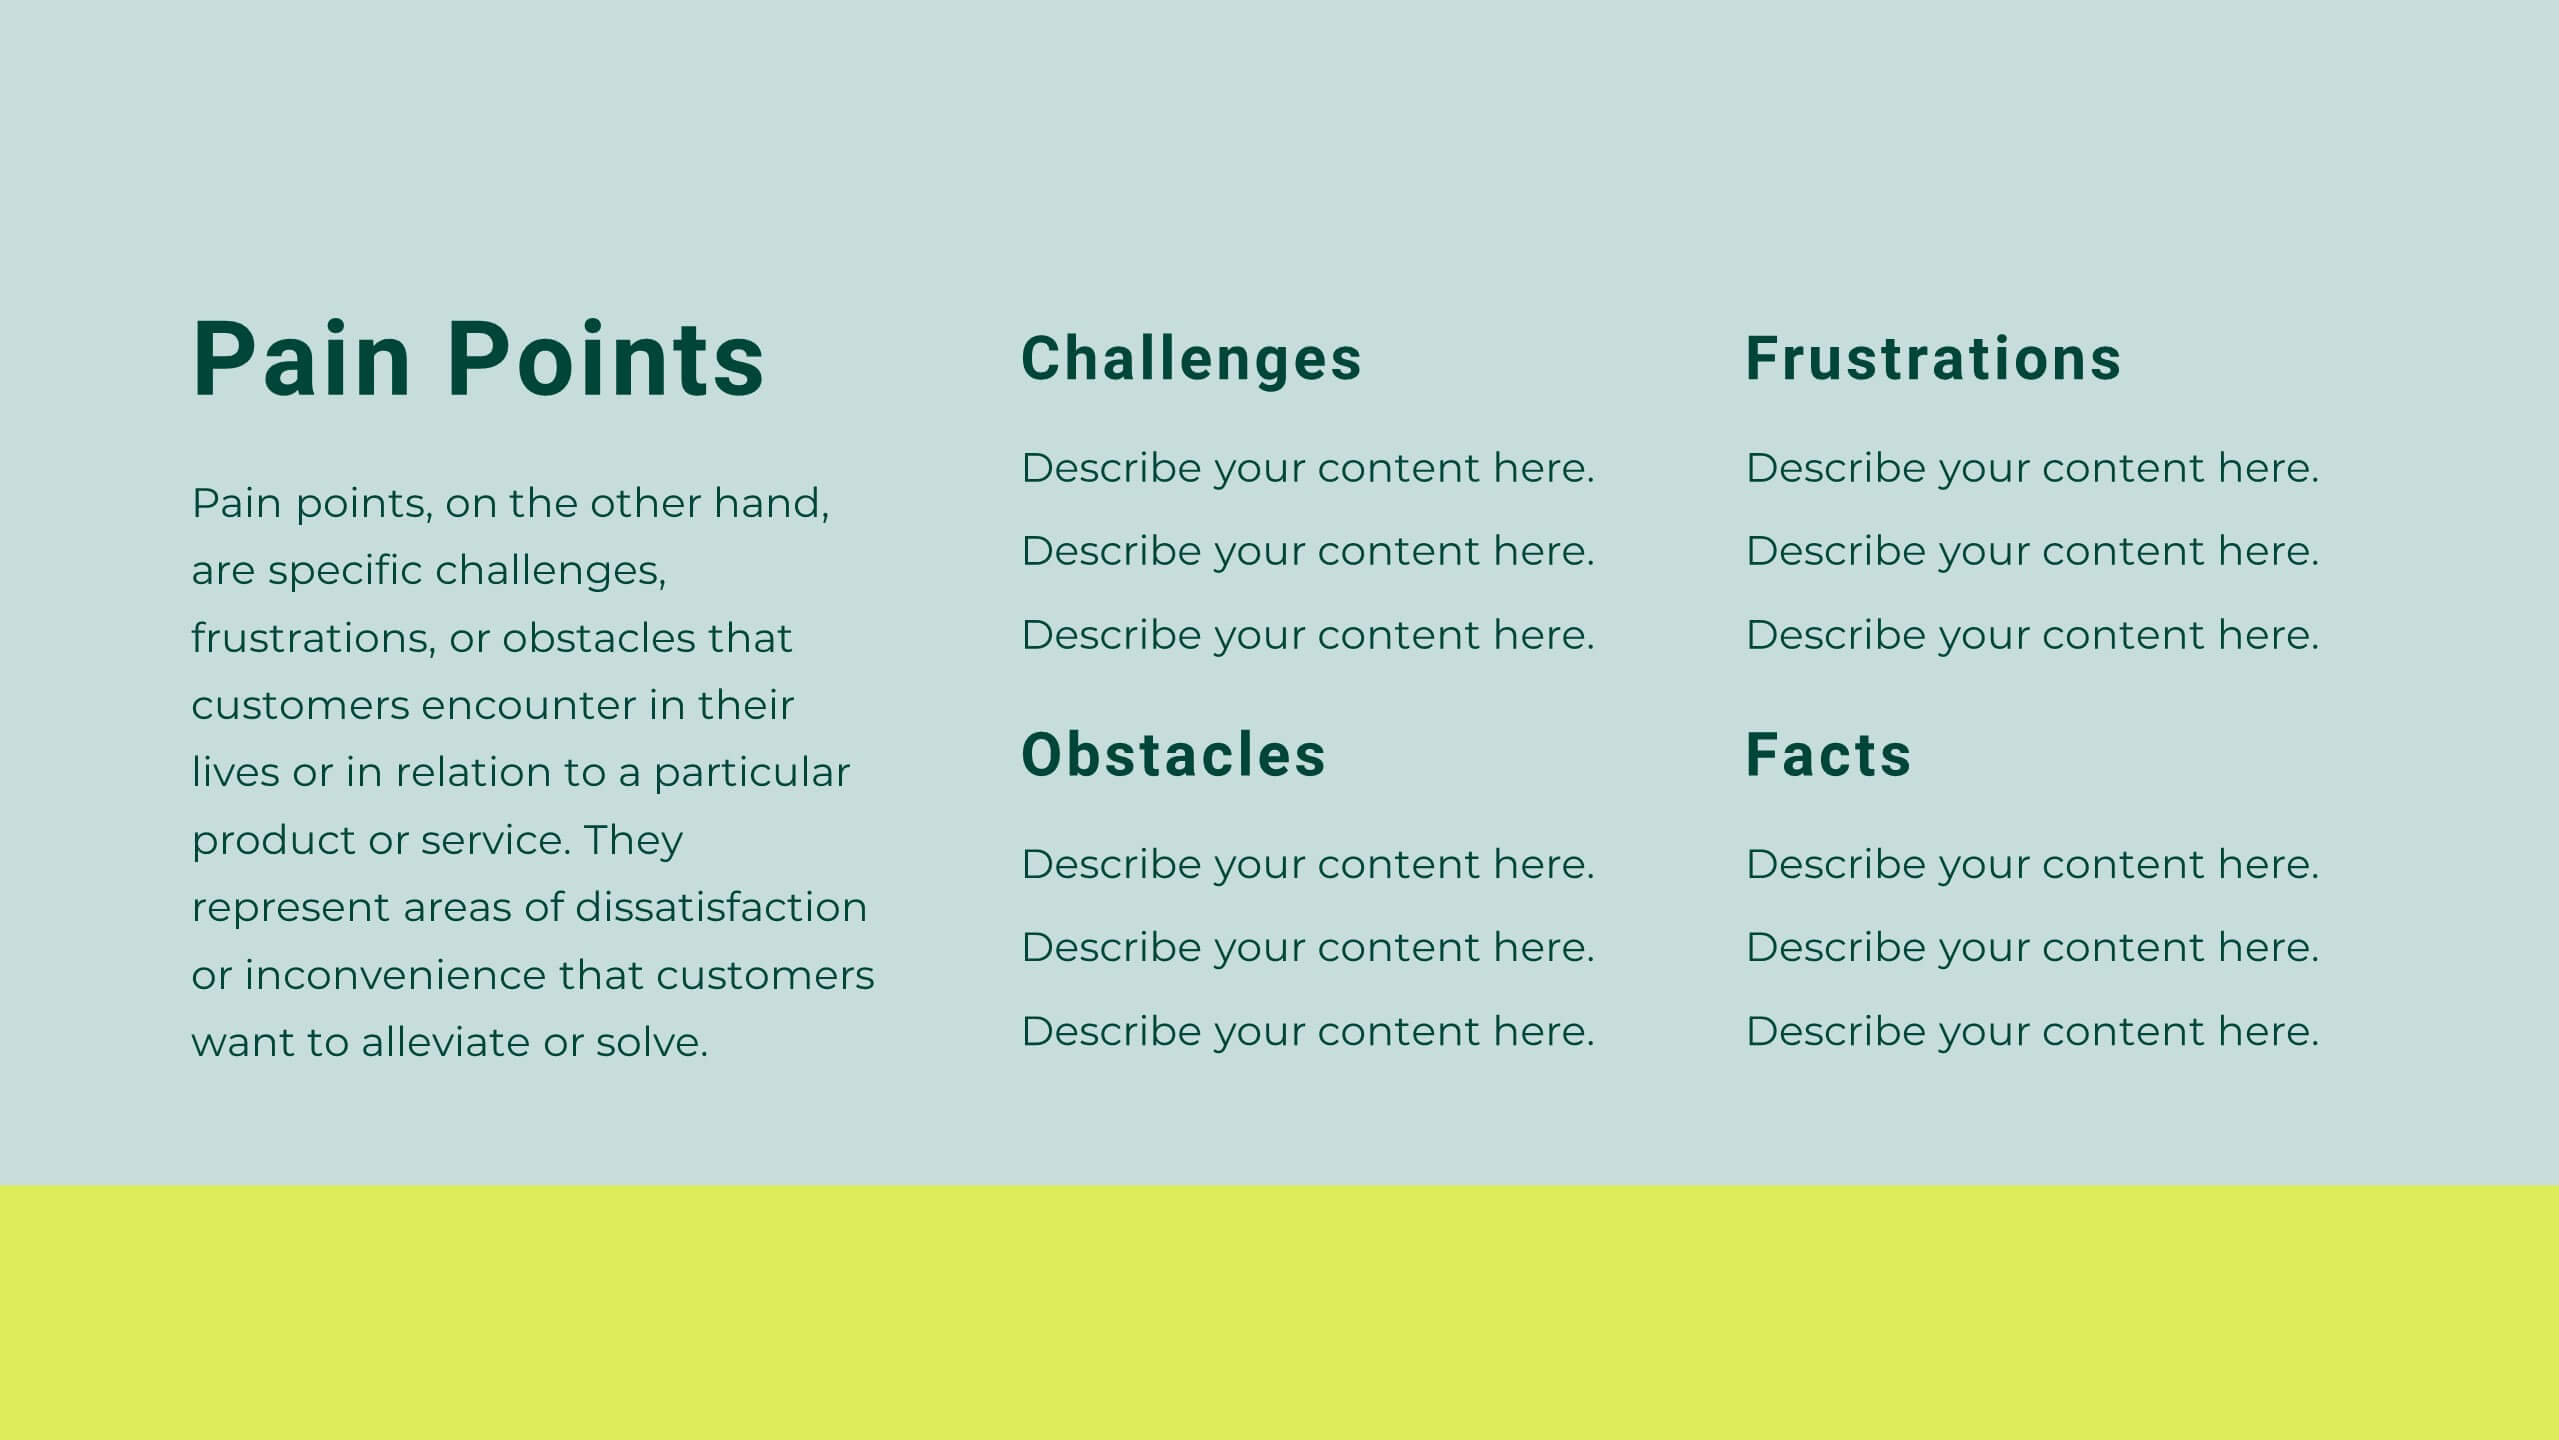
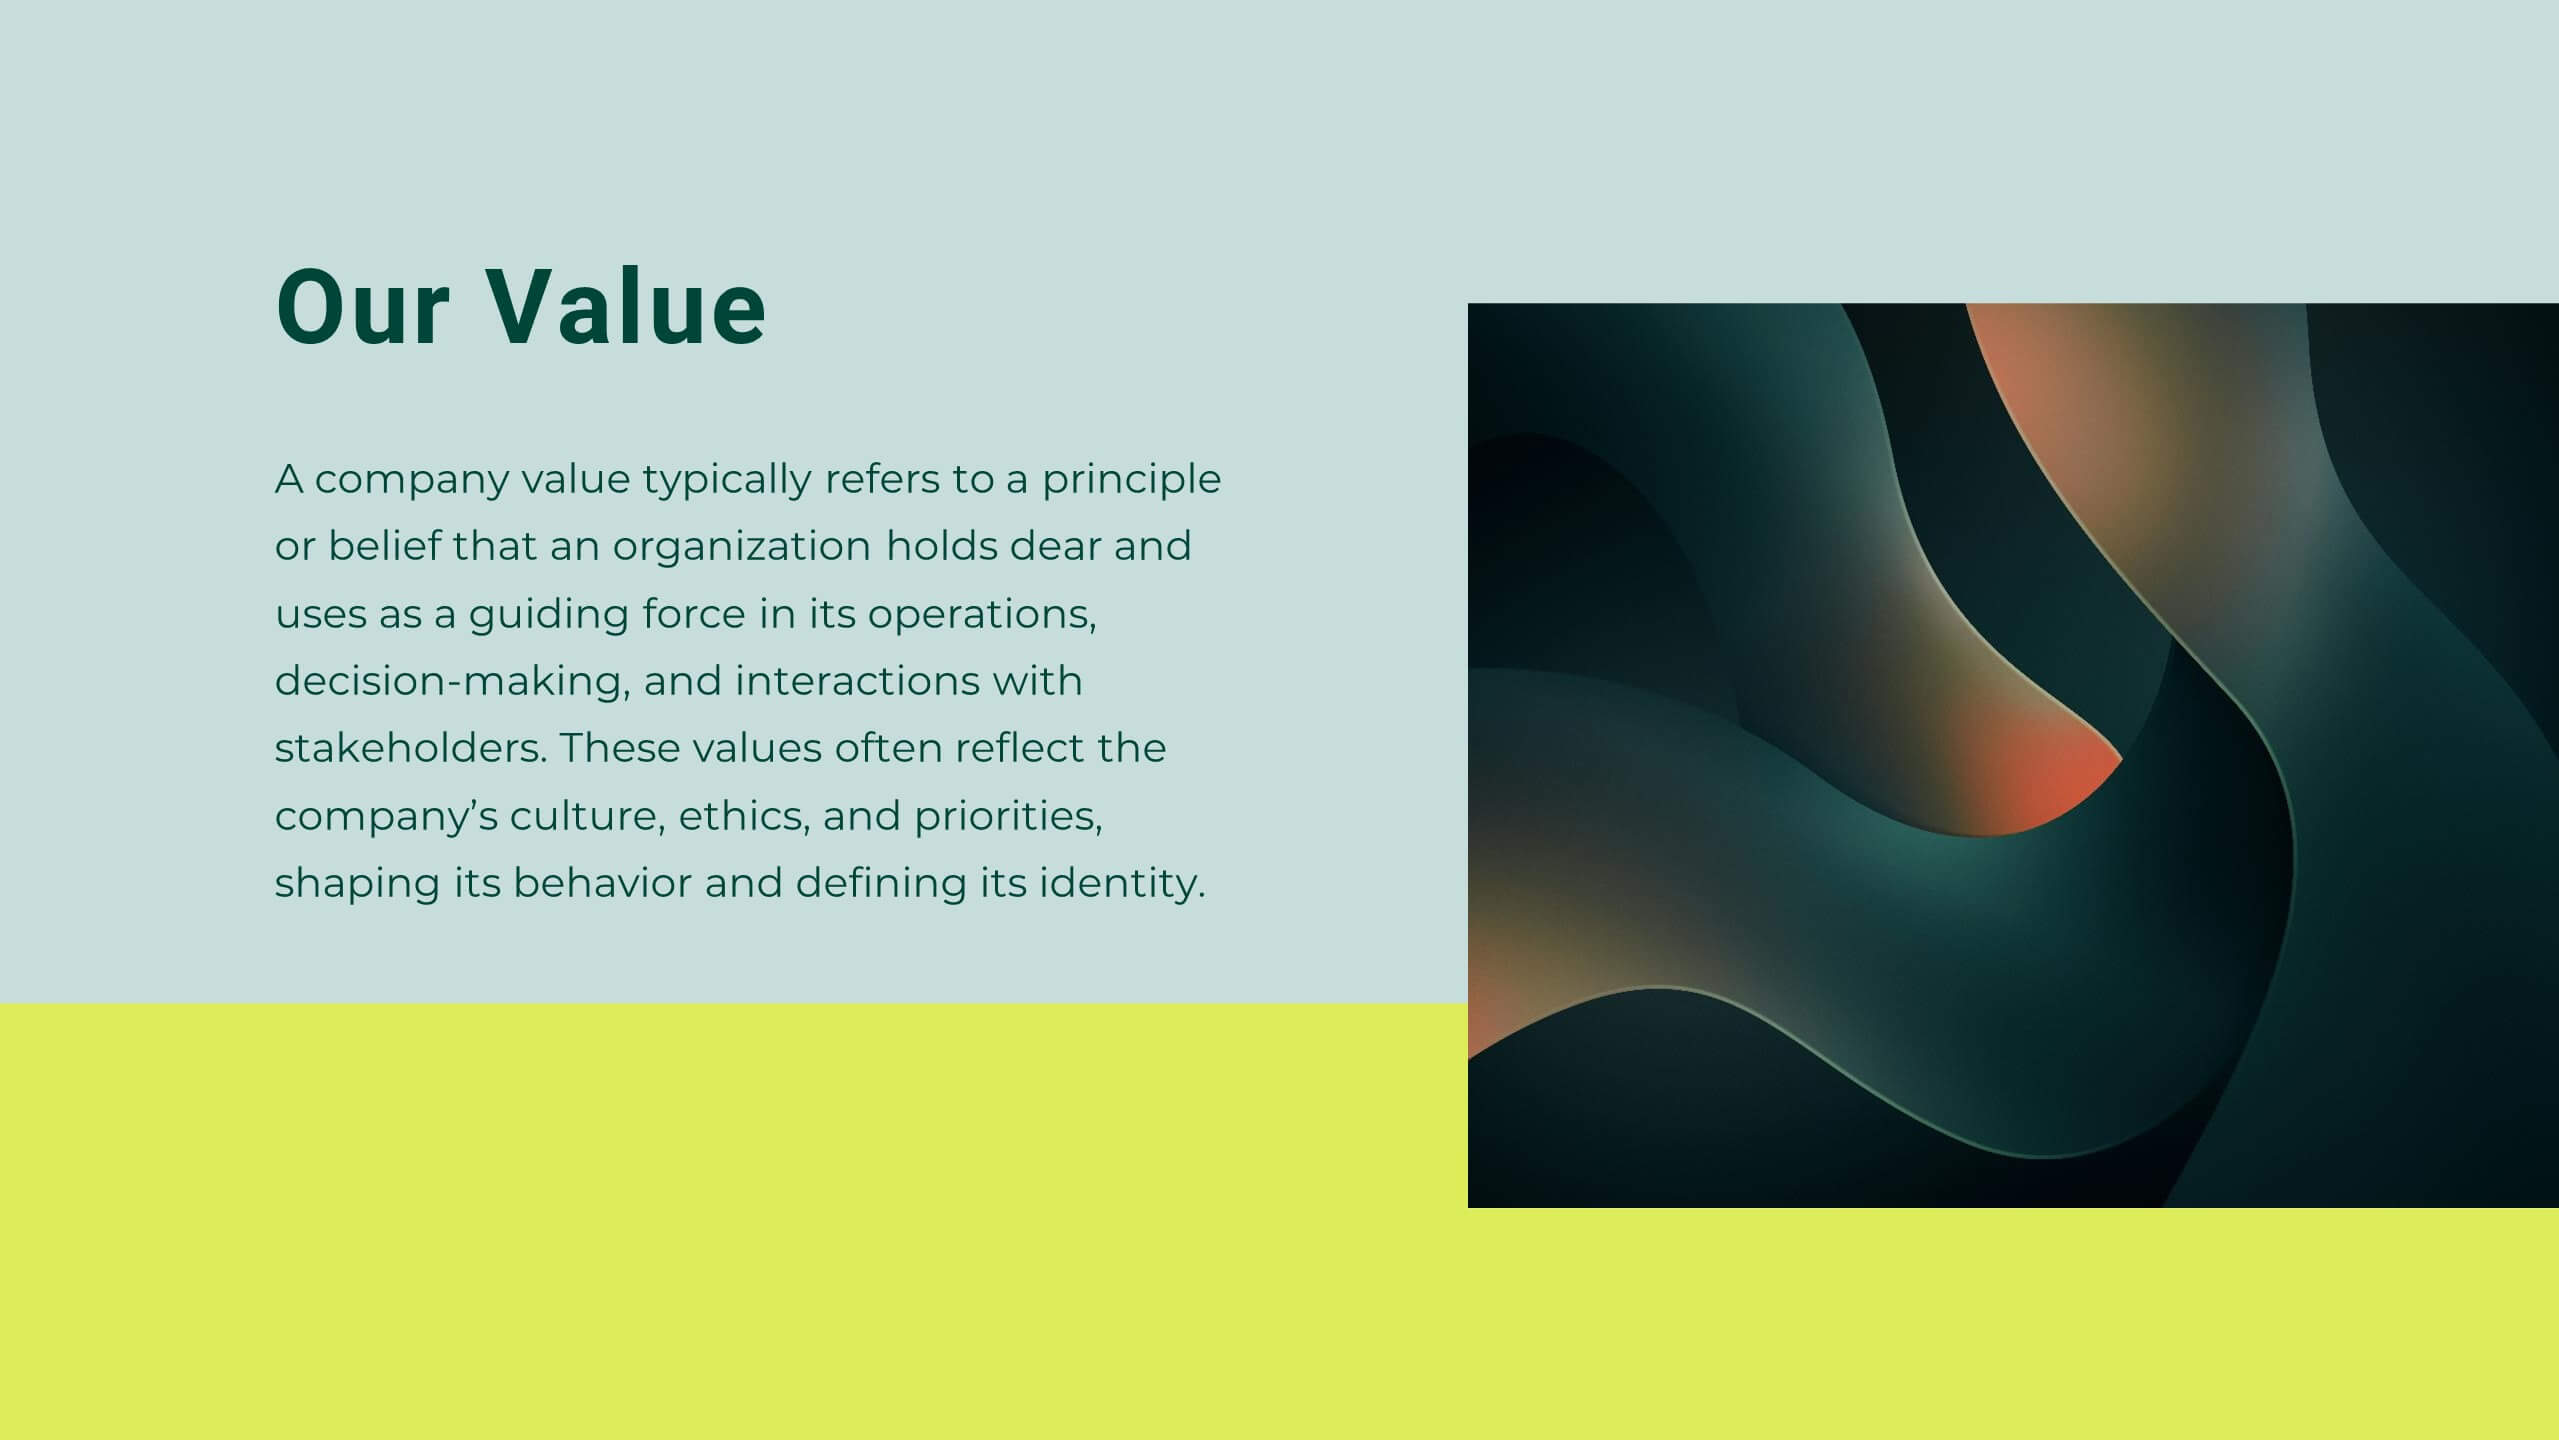
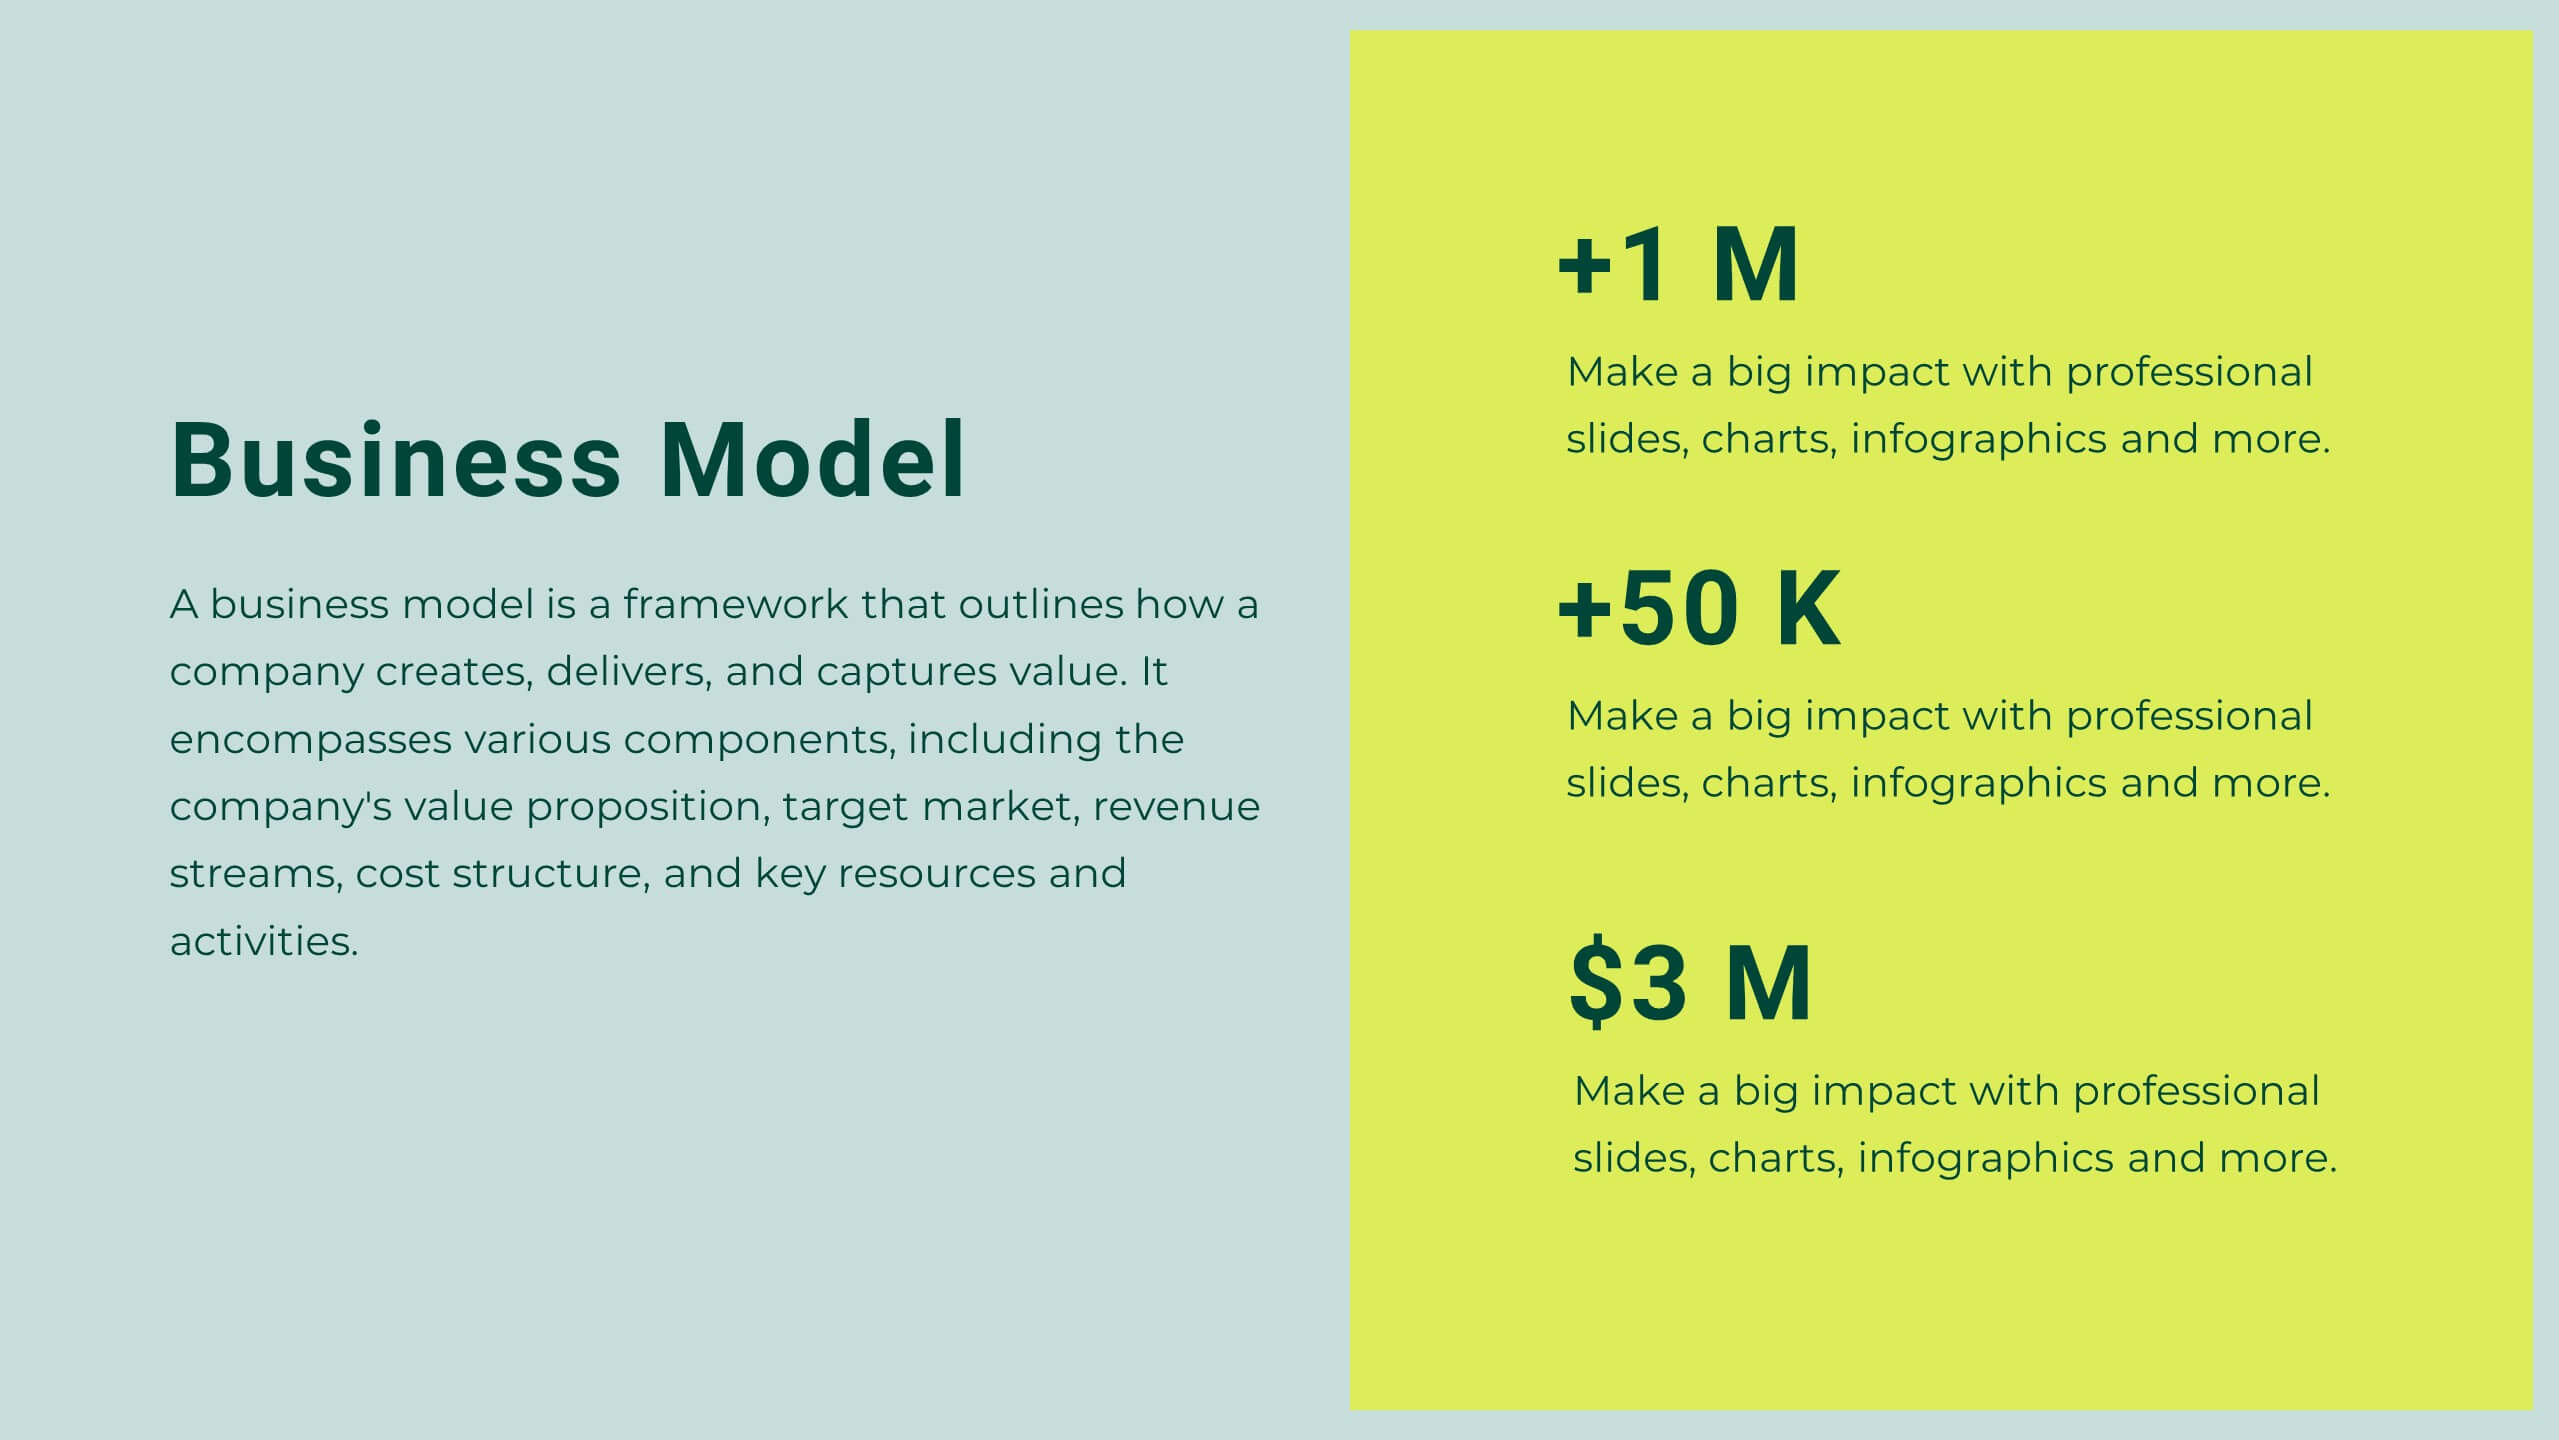
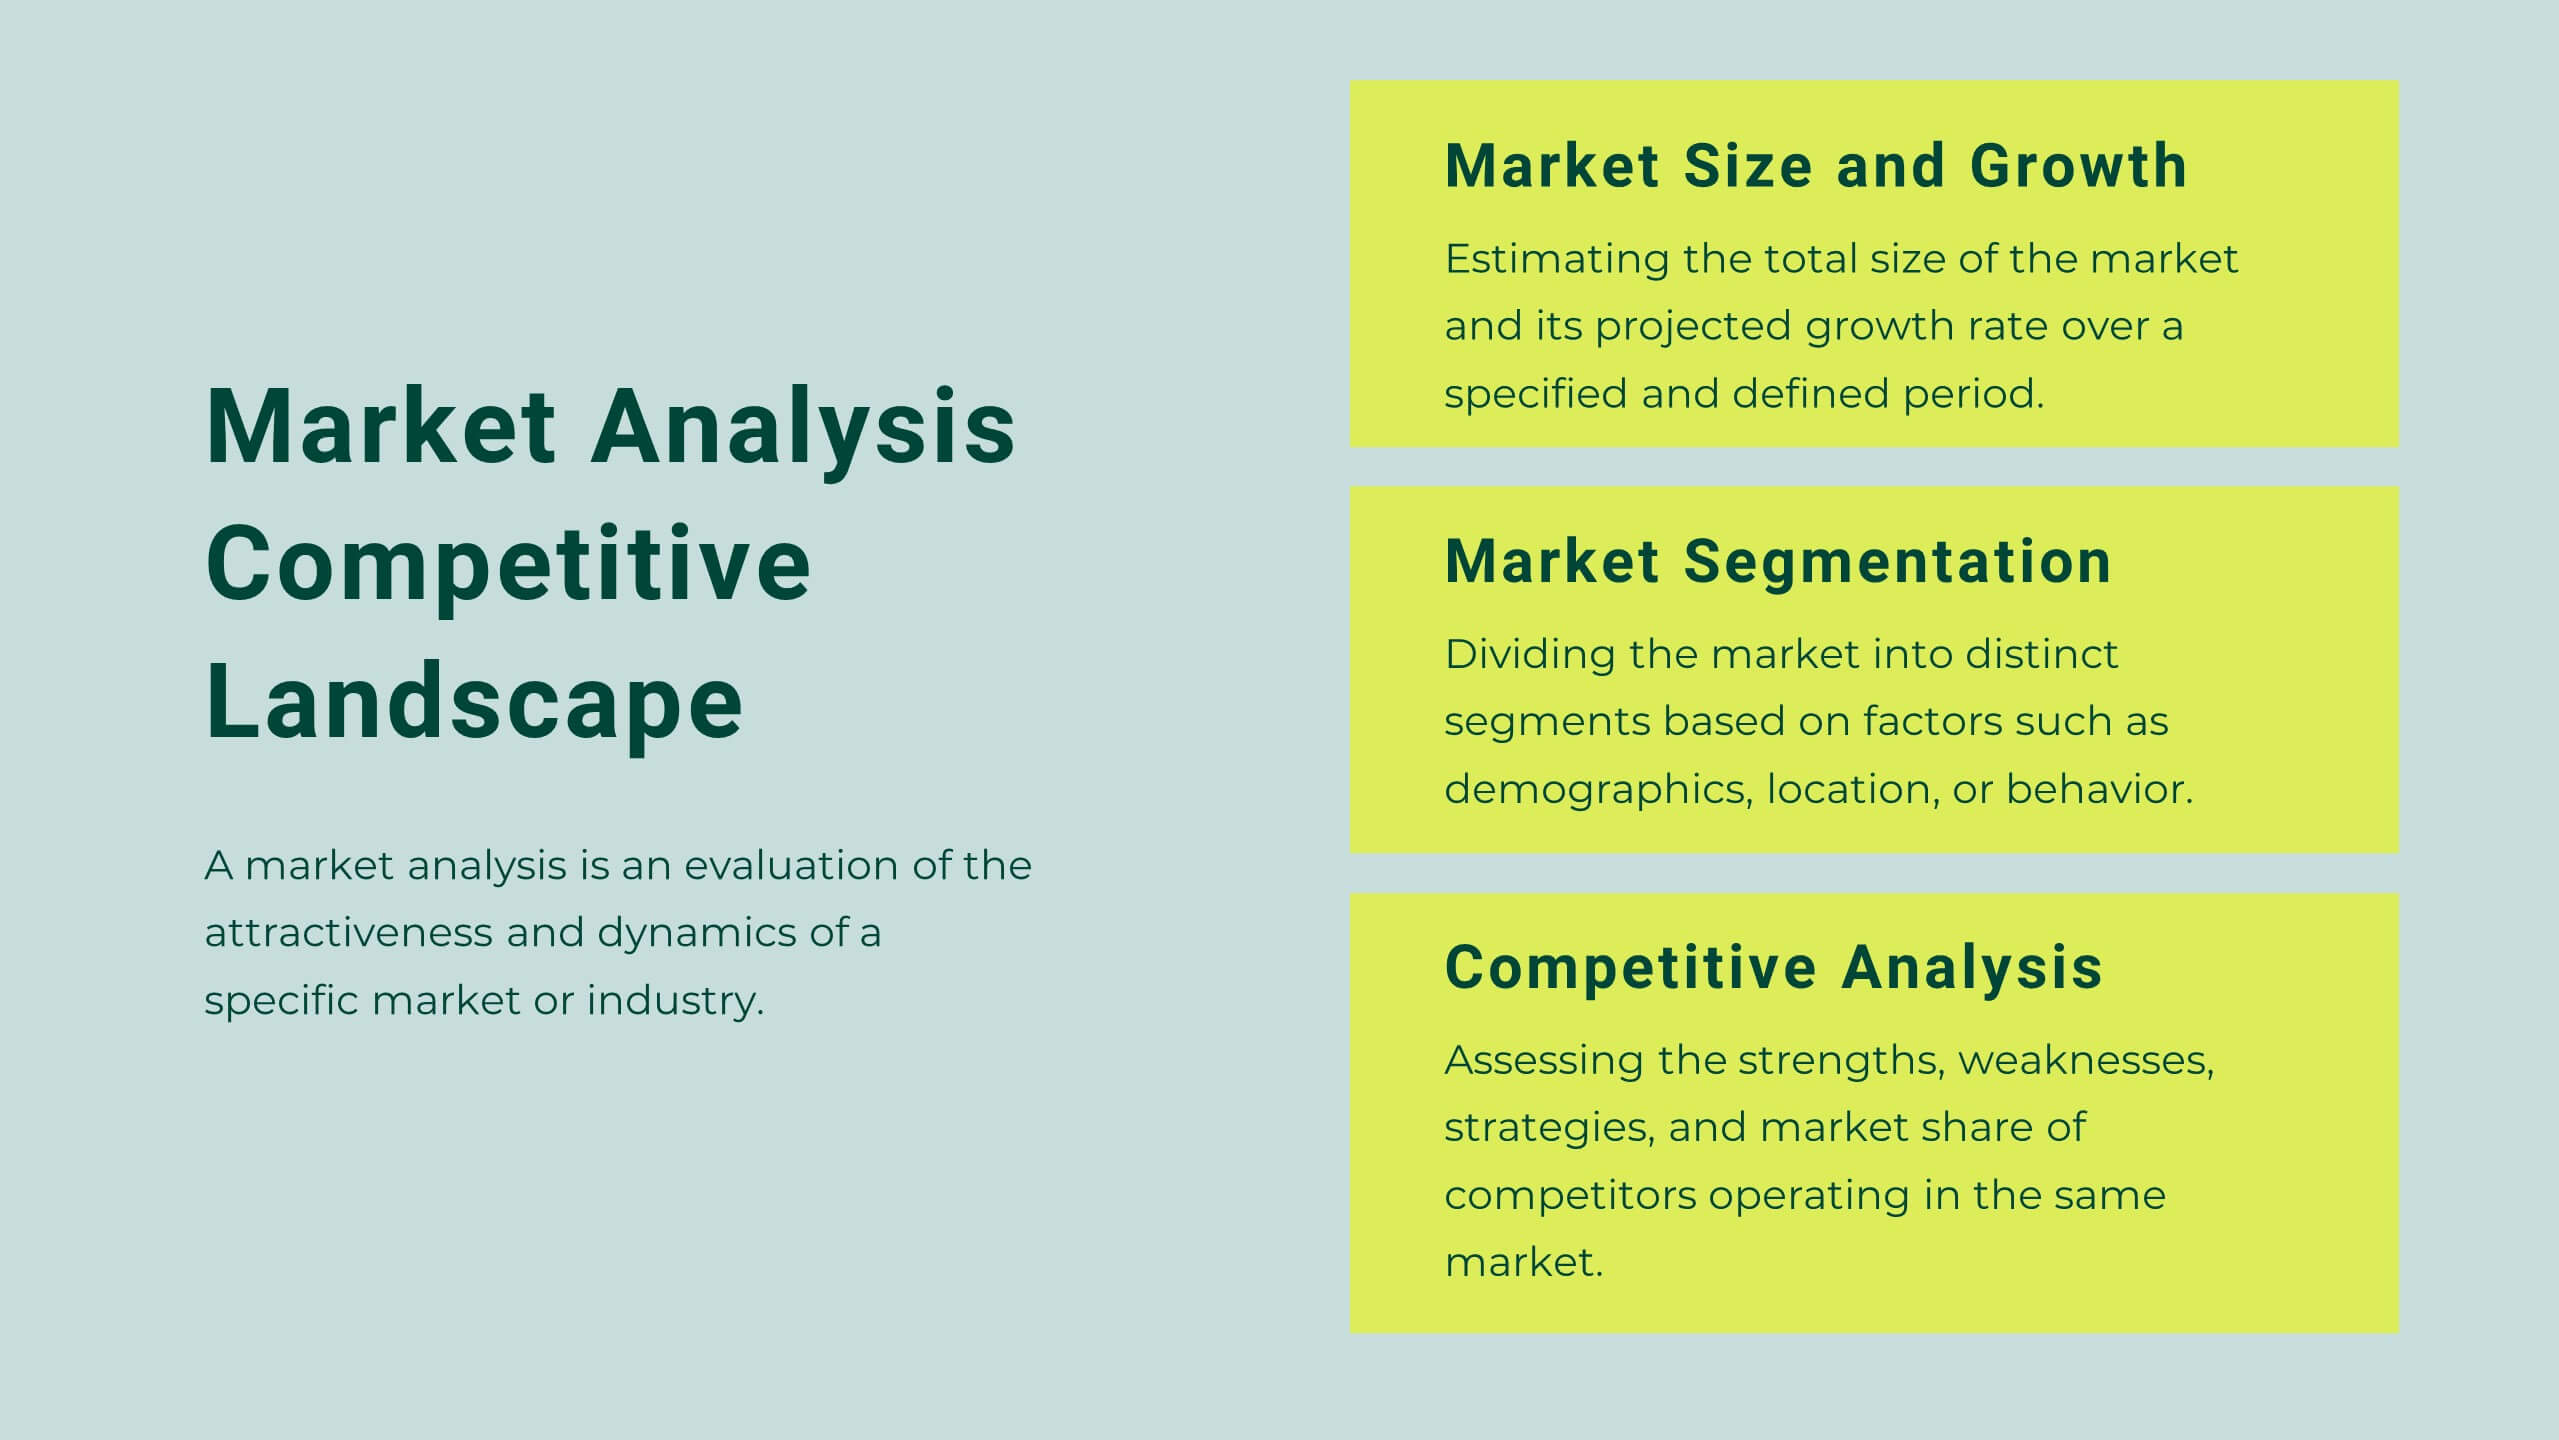
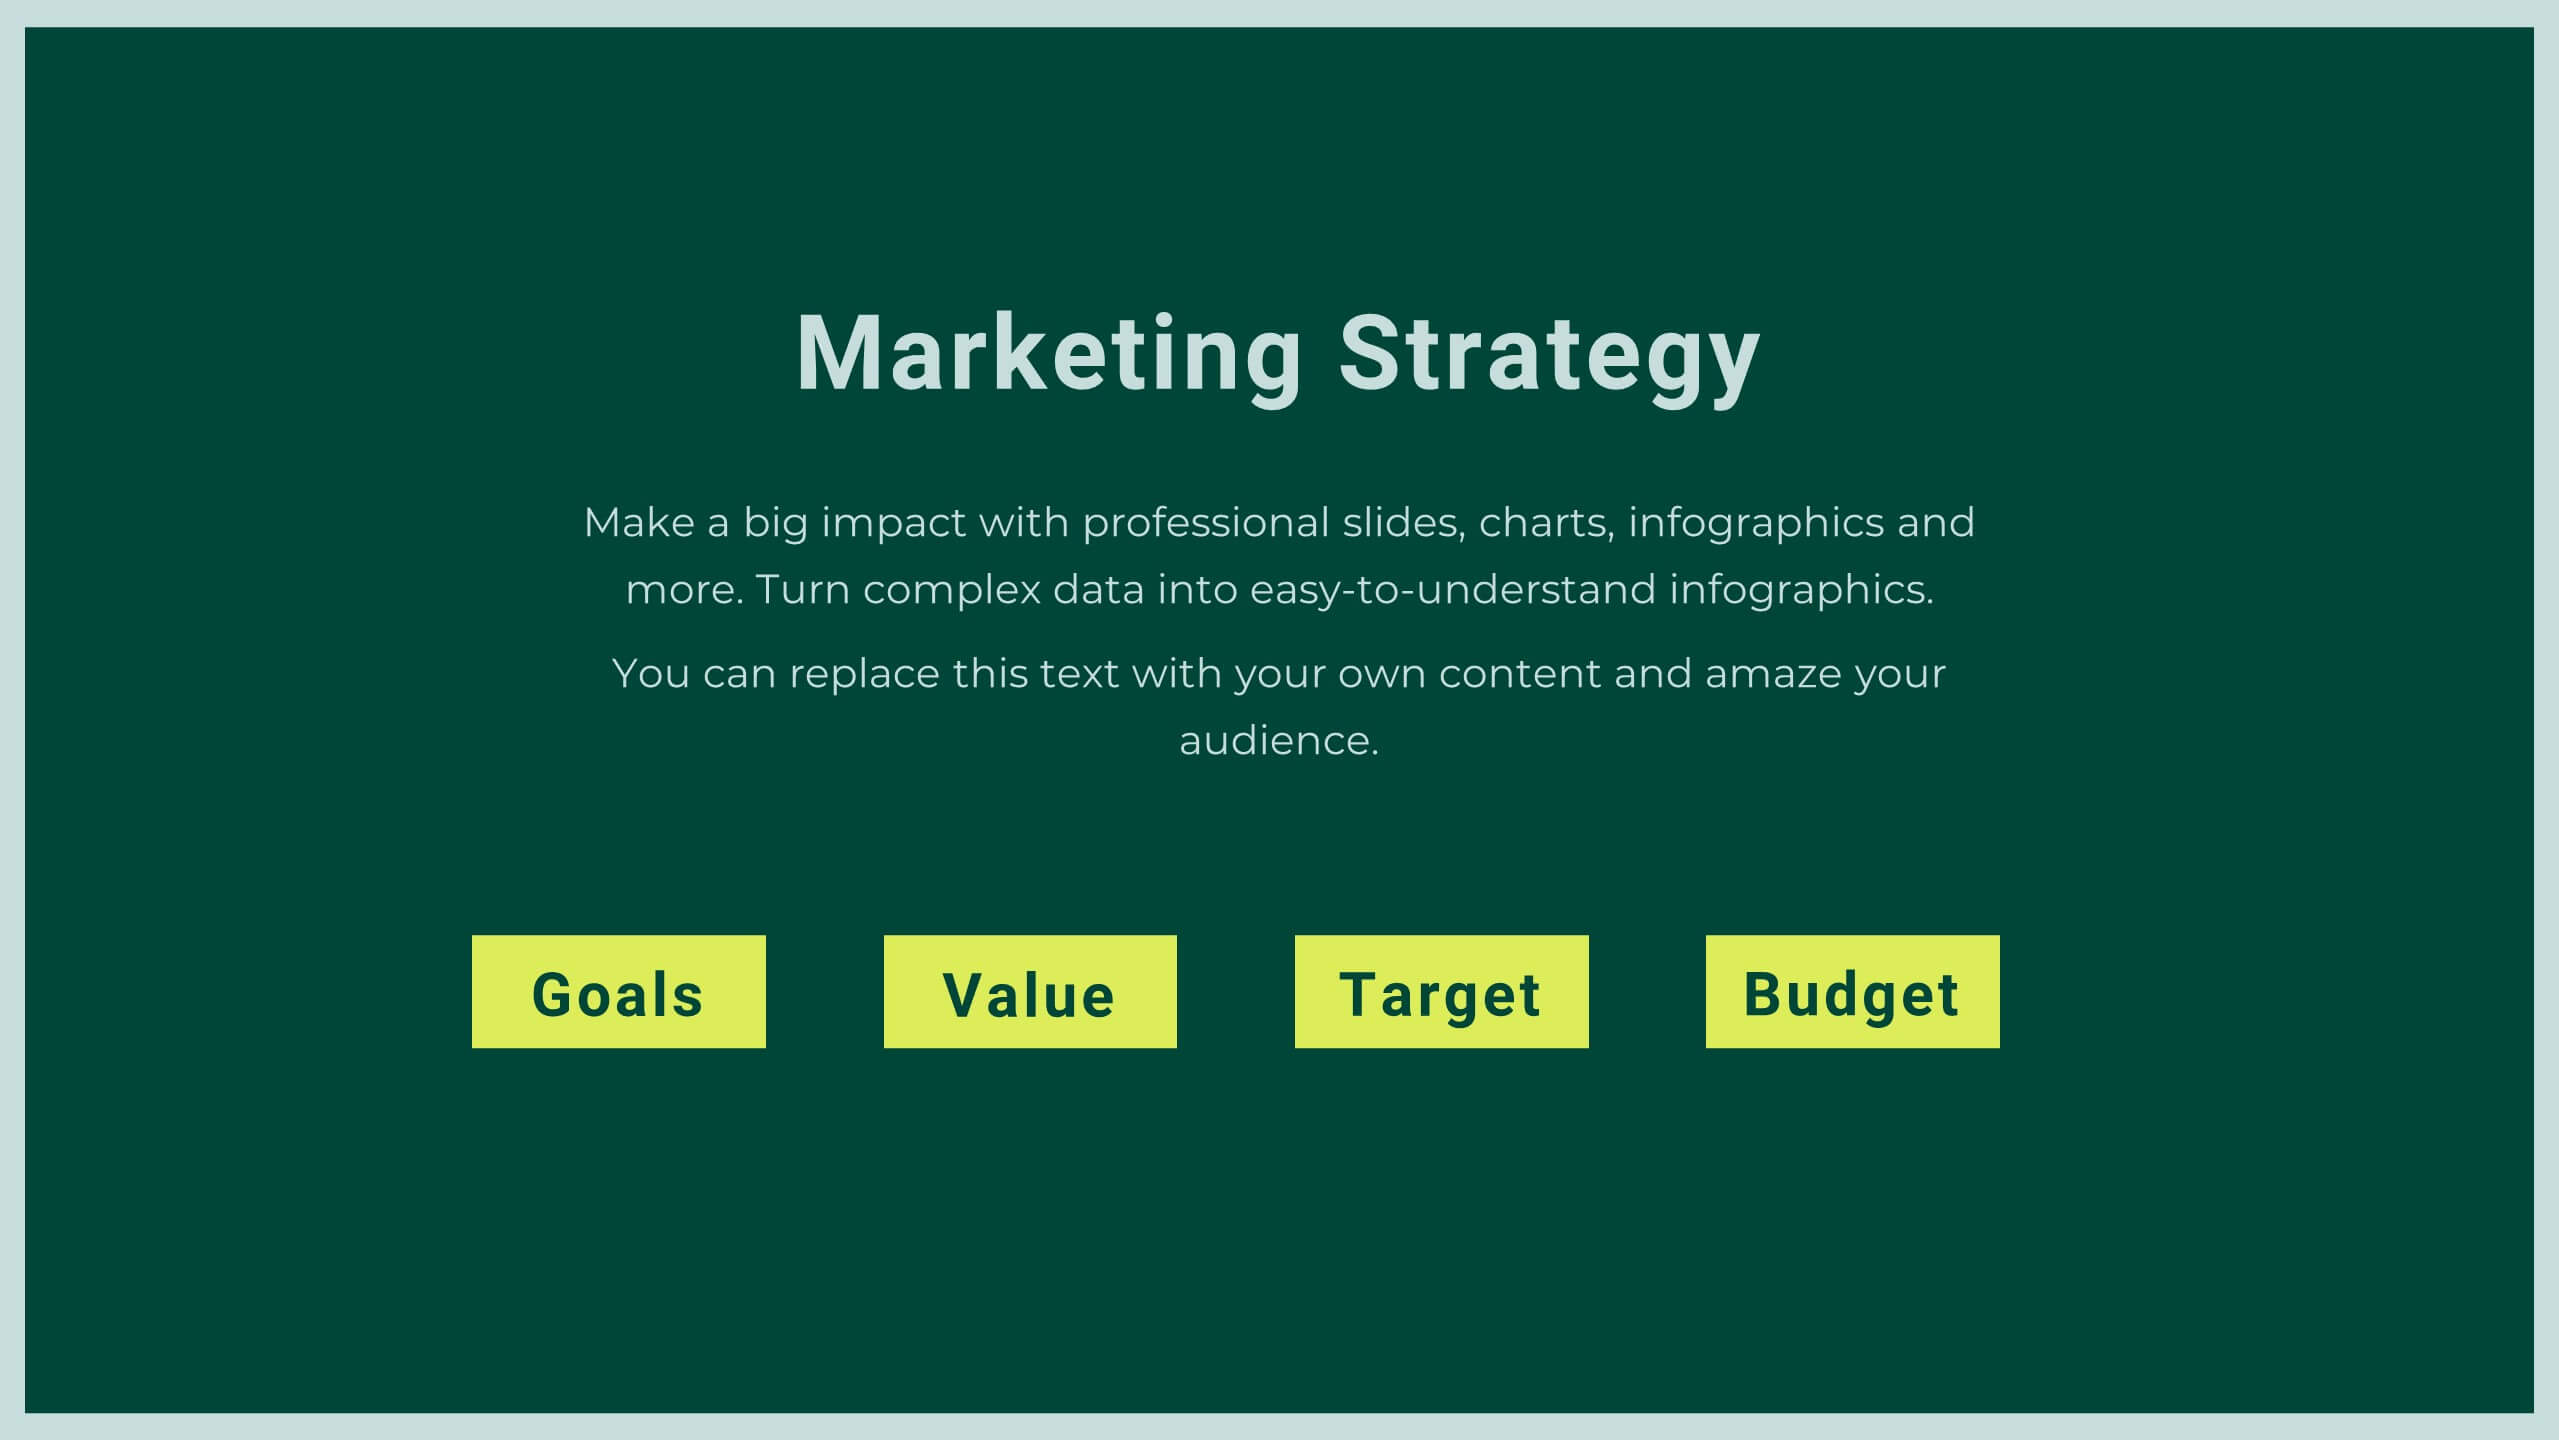
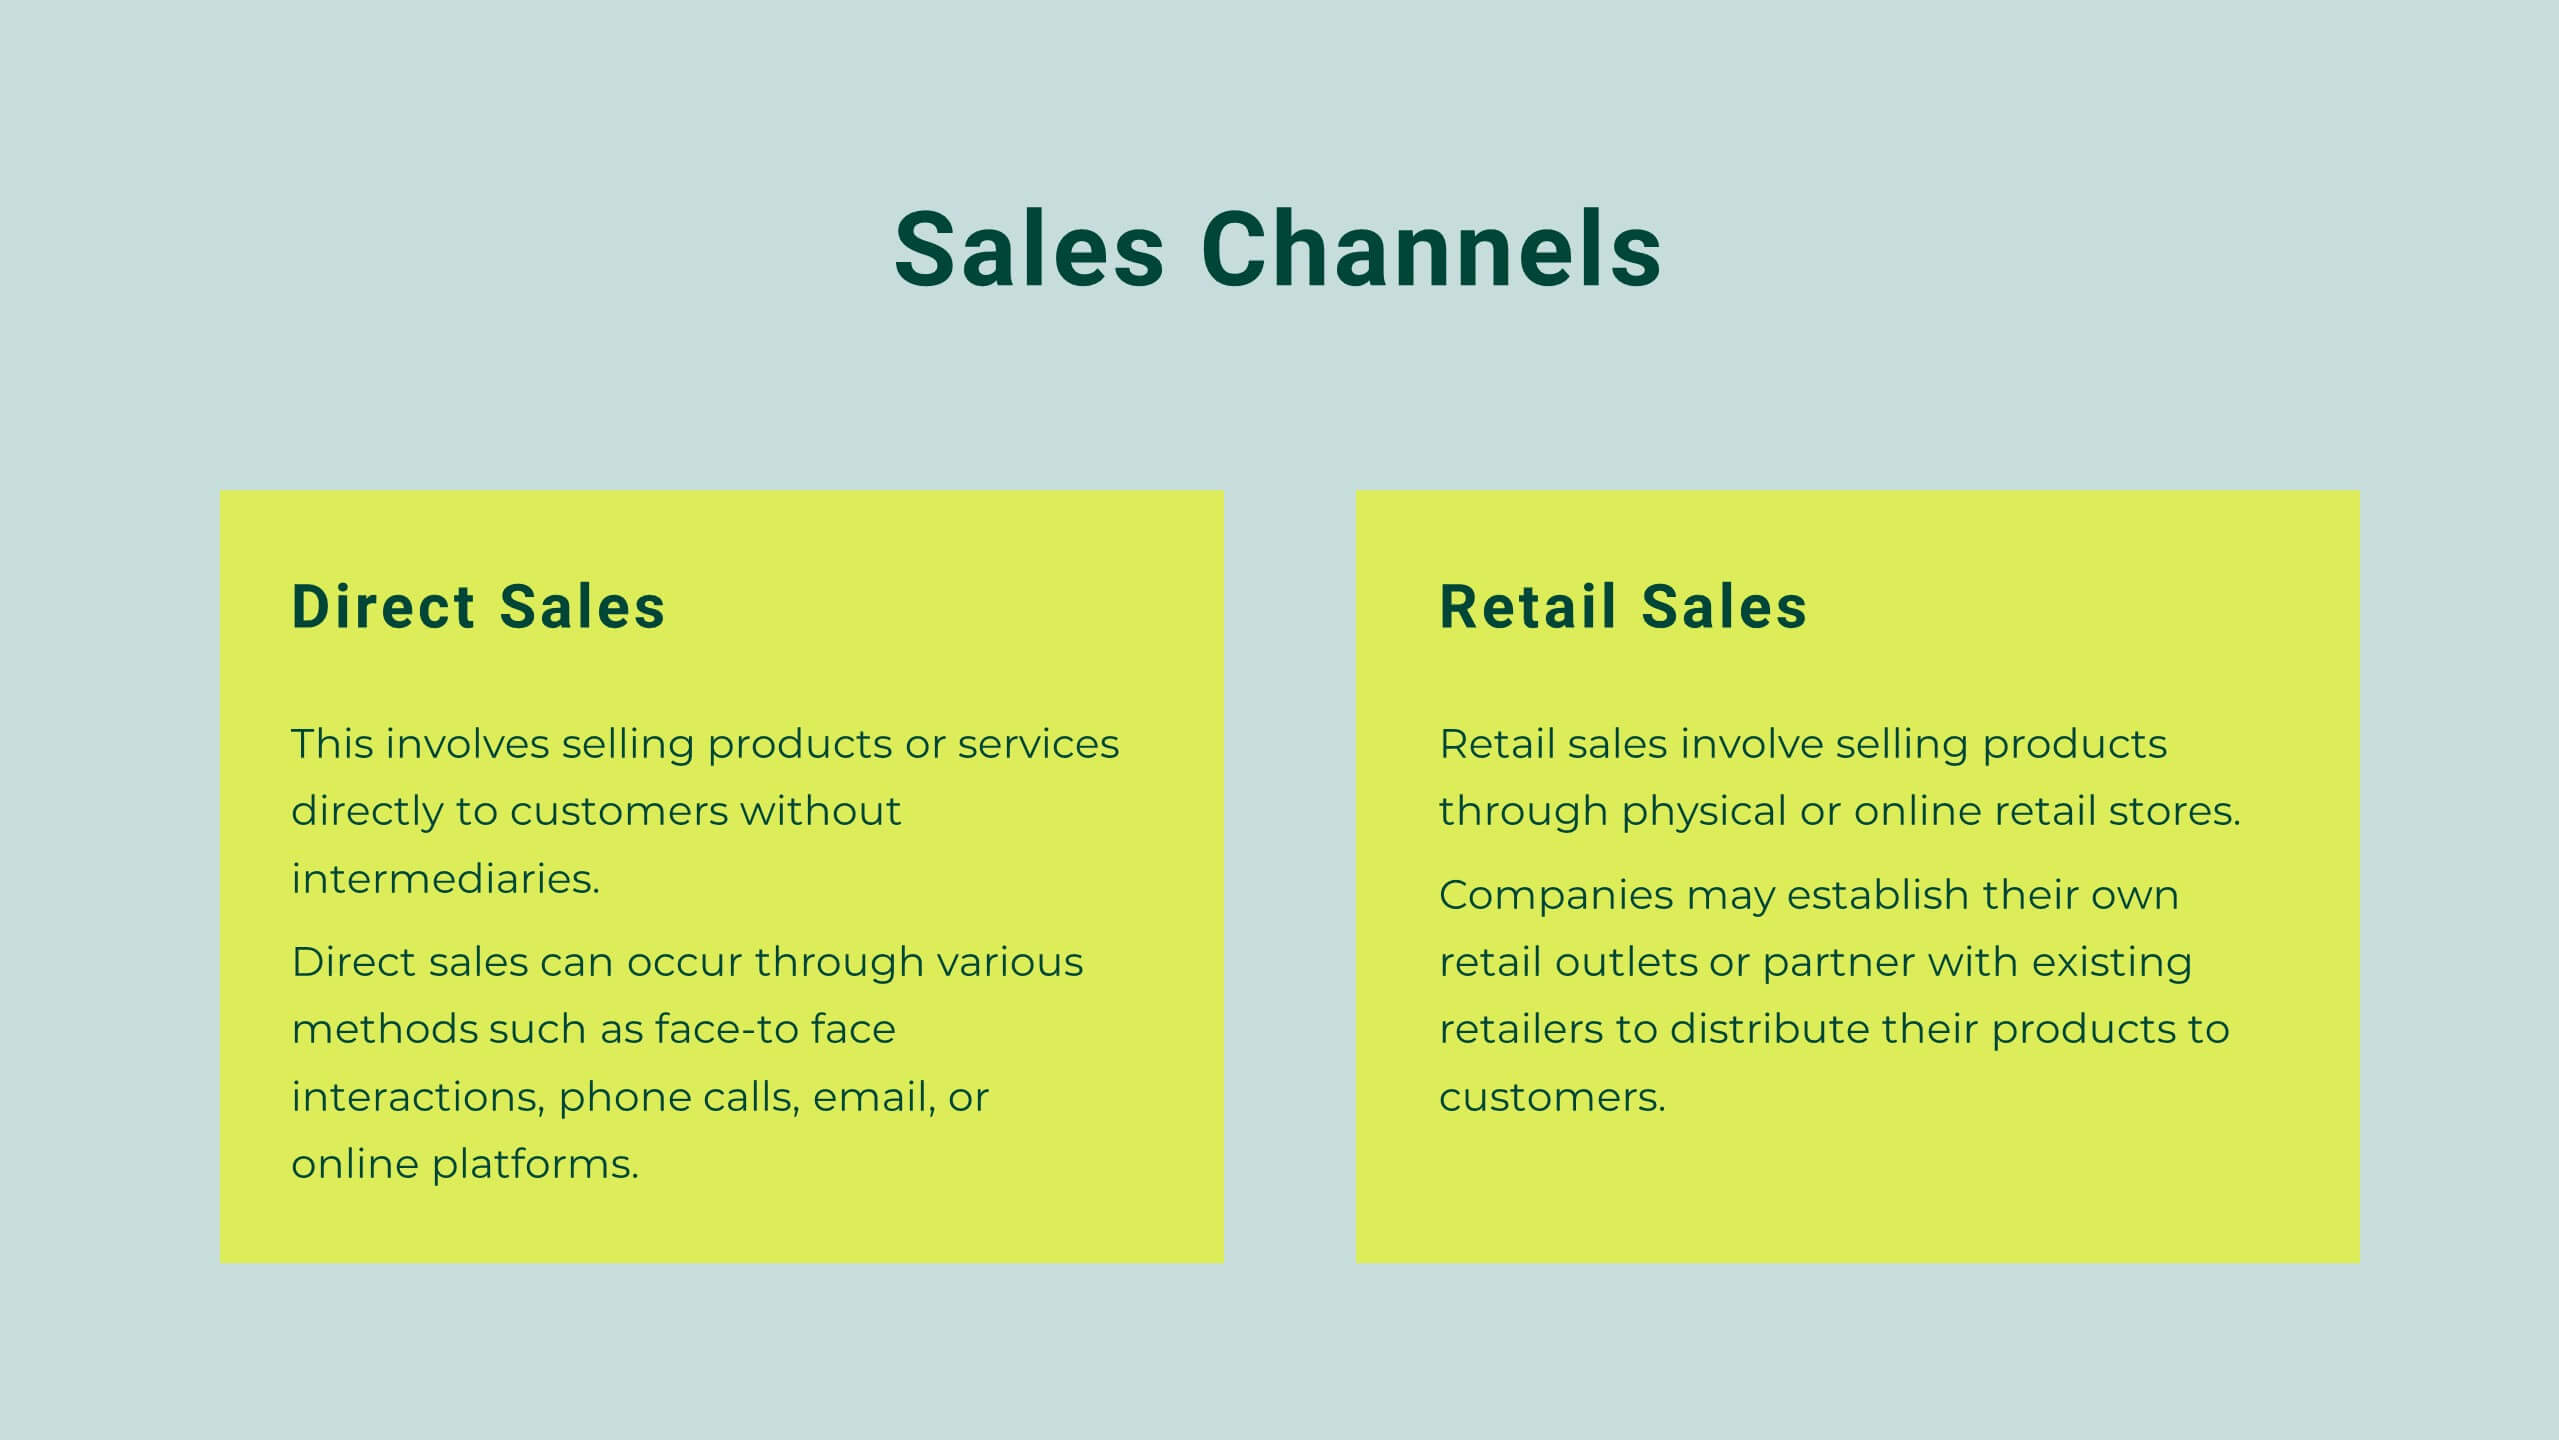
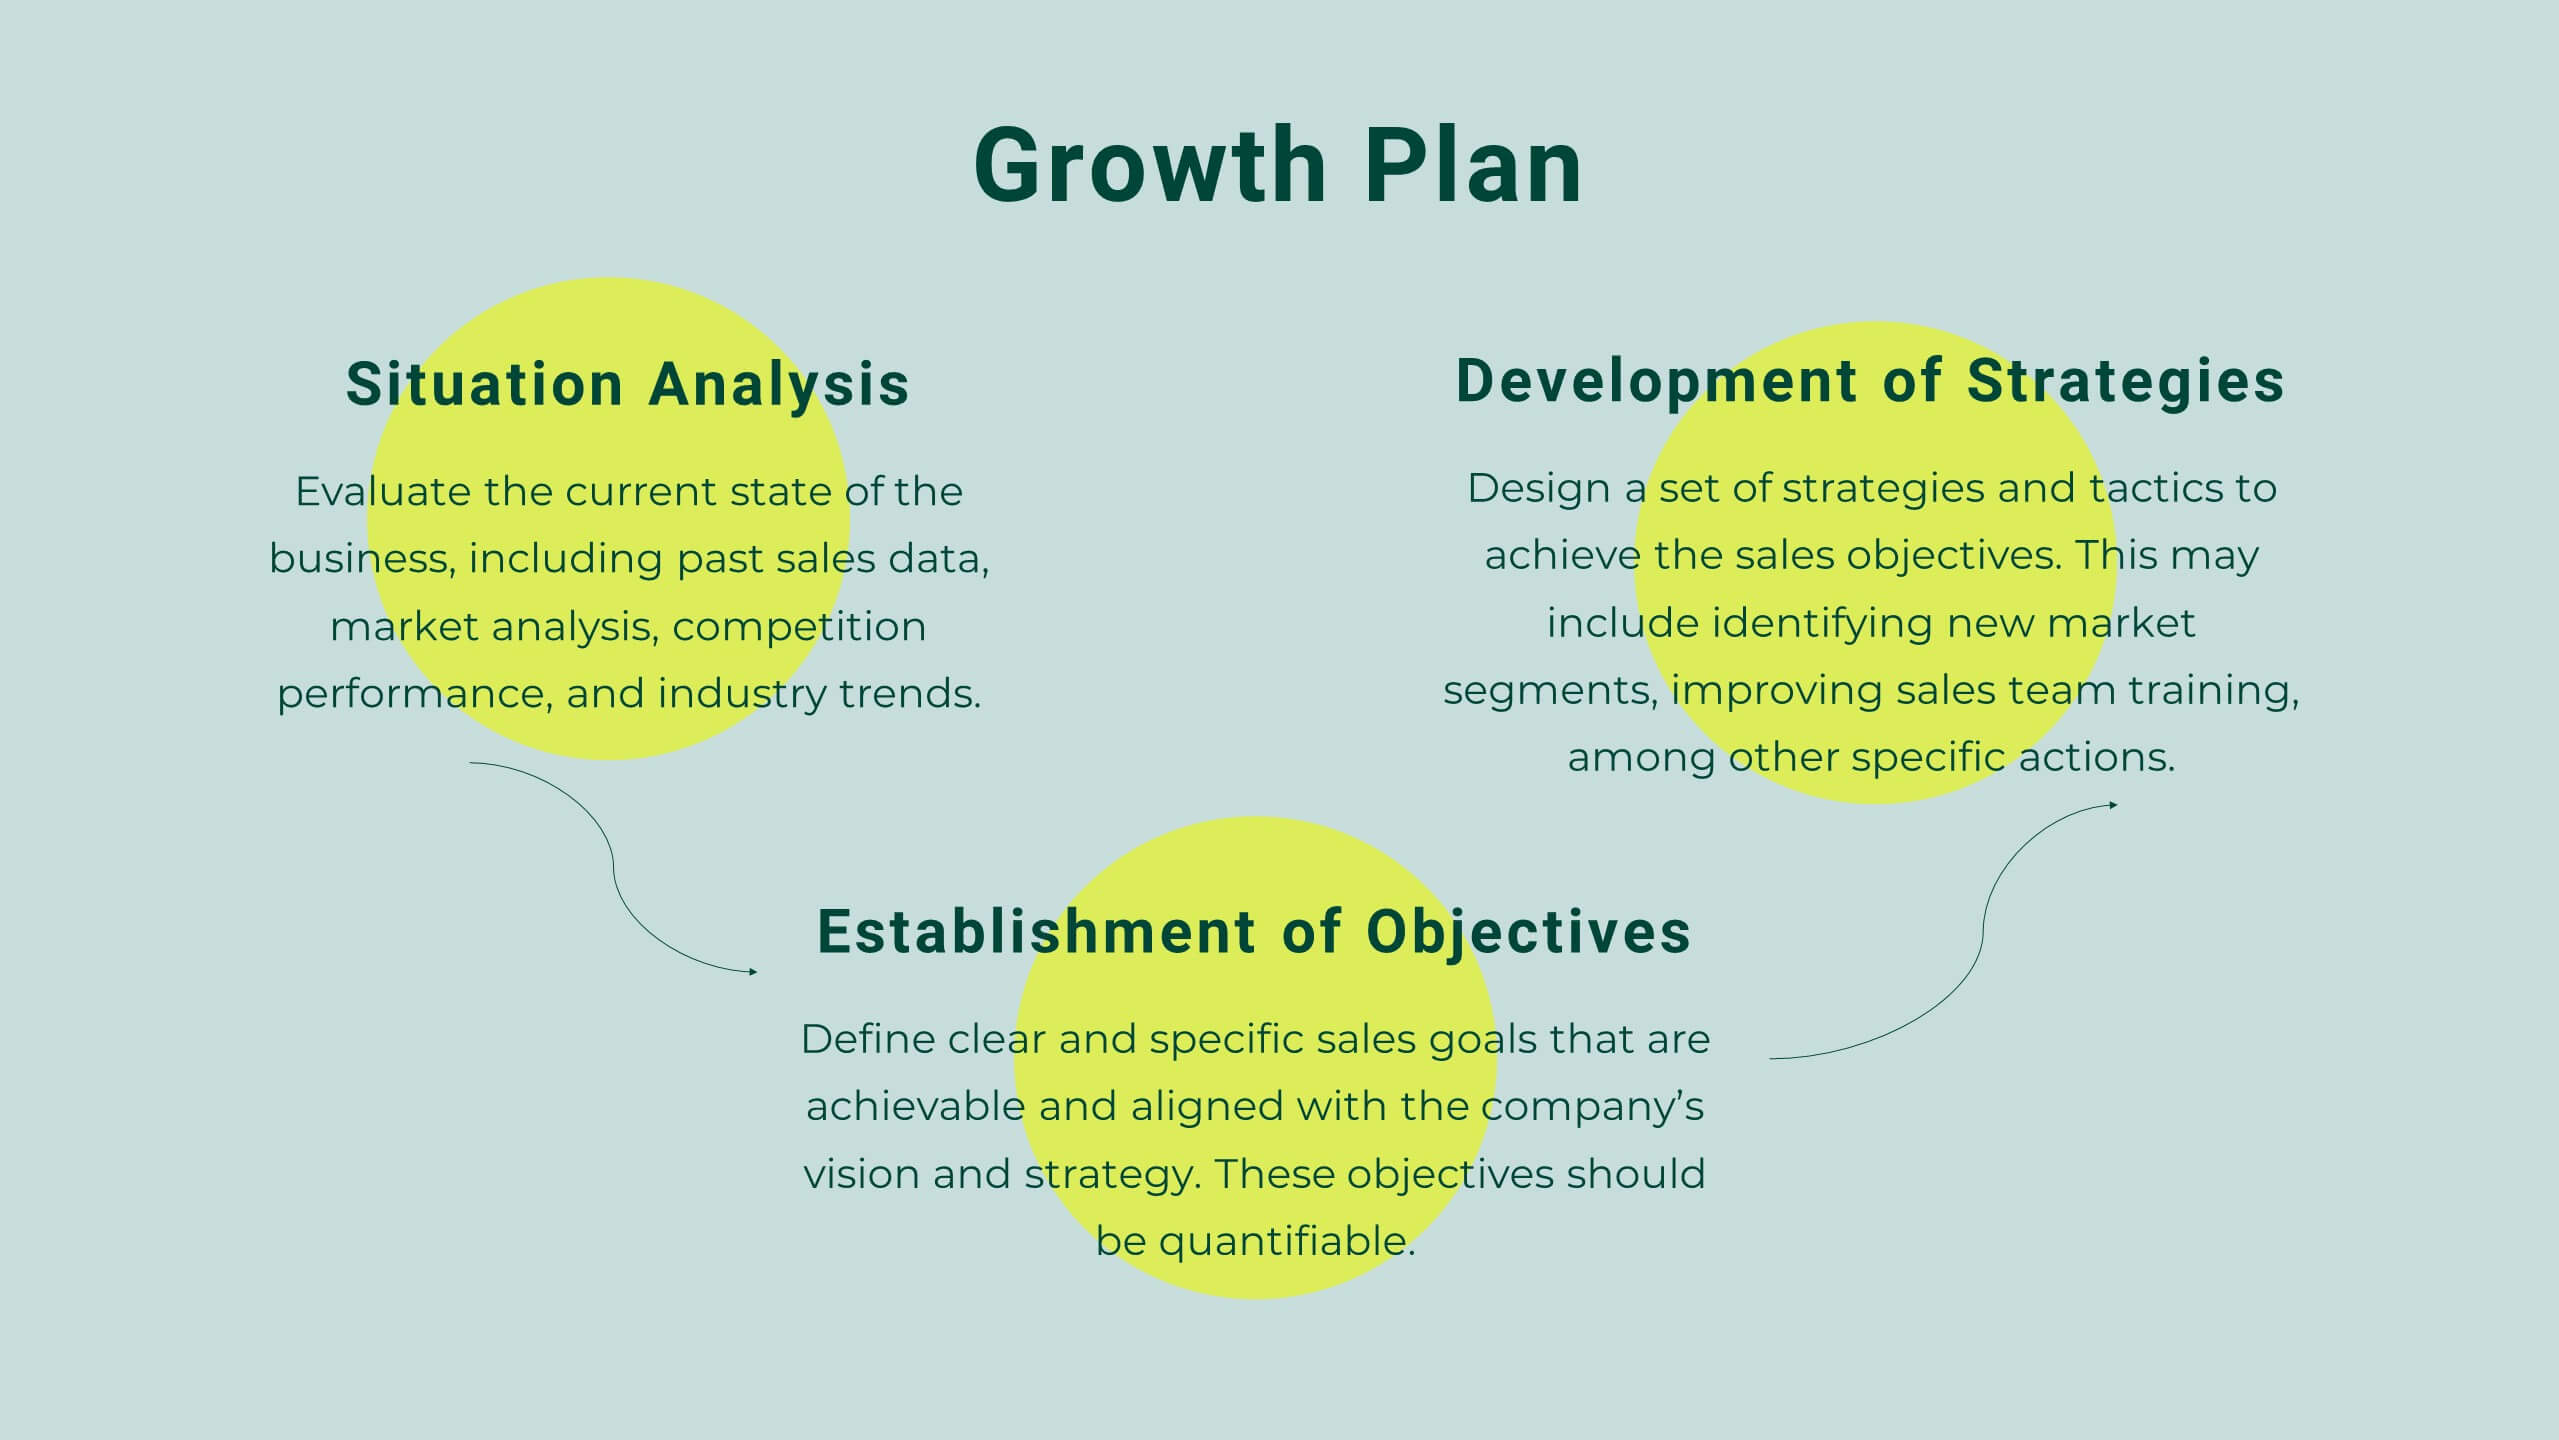
Fluorion Startup Strategy Presentation
Kickstart your business with this modern and professional Startup Strategy Presentation Template. Designed to help entrepreneurs, startups, and business owners present their vision, goals, and strategies effectively. This template includes 21 fully customizable slides covering essential sections such as mission and vision, market analysis, business model, financial overview, and growth plan. Compatible with PowerPoint, Keynote, and Google Slides for seamless editing and presentation.


10 diapositivas
Remote Work Best Practices Presentation
Streamline your team's productivity with this Remote Work Best Practices presentation. Ideal for hybrid or fully remote businesses, this layout features five key steps illustrated in a connected visual path, helping communicate structure and flow. With a clean, modern design and editable sections, it's perfect for onboarding, policy training, or workflow optimization. Compatible with PowerPoint, Keynote, and Google Slides for easy customization.


2 diapositivas
App Interface Device Preview Presentation
Display your mobile app design with this sleek interface preview layout. Centered around a realistic smartphone mockup, this template includes four surrounding sections for text or key features. Ideal for pitch decks or product demos, it's fully editable in PowerPoint, Keynote, or Google Slides to match your brand.


8 diapositivas
Customer Targeting and Persona Creation Presentation
Hook your audience with a clean, modern layout that zooms in on what really matters—your ideal customer. This customer persona template helps visualize traits, behaviors, and key targets for effective marketing. Perfect for campaign planning, branding, or audience research. Fully compatible with PowerPoint, Keynote, and Google Slides.


6 diapositivas
Organizational Change Process Presentation
Make complex transitions look simple with this modern visual template. Perfect for illustrating every stage of organizational change, this infographic-style design helps communicate key steps with clarity and focus. Easily editable and professionally designed, it's compatible with PowerPoint, Keynote, and Google Slides for seamless integration into your workflow.