


Características


¿Tienes alguna pregunta?
Recomendar


6 diapositivas
Healthy Meal Planning Template Presentation
Visualize balanced nutrition with the Healthy Meal Planning Template. Featuring a layered jar graphic, this presentation organizes up to six content sections—ideal for meal prep, wellness routines, or health education. Clean and editable in PowerPoint, Keynote, and Google Slides. Perfect for nutritionists, fitness professionals, or wellness-focused content planning.


21 diapositivas
Nucleus Project Timeline Presentation
Plan with precision using this clean and modern Project Timeline Presentation Template. Highlight key phases, milestones, and deliverables with visually organized sections such as Project Overview, Objectives, Budget Breakdown, Resource Allocation, and Risk Management. Perfect for presenting timelines, evaluation criteria, and next steps to stakeholders. Fully customizable and compatible with PowerPoint, Keynote, and Google Slides.


5 diapositivas
Product Development to Decline Model Presentation
Showcase the full journey of a product from its inception to phase-out with the Product Development to Decline Model presentation. This circular diagram clearly outlines the four core stages, ideal for product managers, business analysts, and strategic planners. Each section features clean icons and editable text zones to highlight key insights and milestones. Fully customizable in PowerPoint, Keynote, and Google Slides.


13 diapositivas
Organizational Company Profile Presentation
Elevate your business overview with this straightforward Company Profile template. The opening slide announces the essence of your business, preparing the audience for a journey through your organizational landscape. Structured to highlight the key areas of your business, the template includes an 'About Us' section, laying out your mission and vision. Learn about the dedicated team behind the success with the 'Meet Our Team' slide, providing a personal touch to your corporate identity. Set clear, achievable goals with a slide dedicated to outlining your short-term and long-term objectives. Engage your audience with a 'Business Facts' slide that provides tangible insights into your company's performance. Finally, the 'Contact Us' slide offers a clear invitation for further dialogue, fostering potential partnerships. Ideal for those searching for a comprehensive yet accessible company presentation, this template is designed to convey your business strengths and opportunities effectively.


22 diapositivas
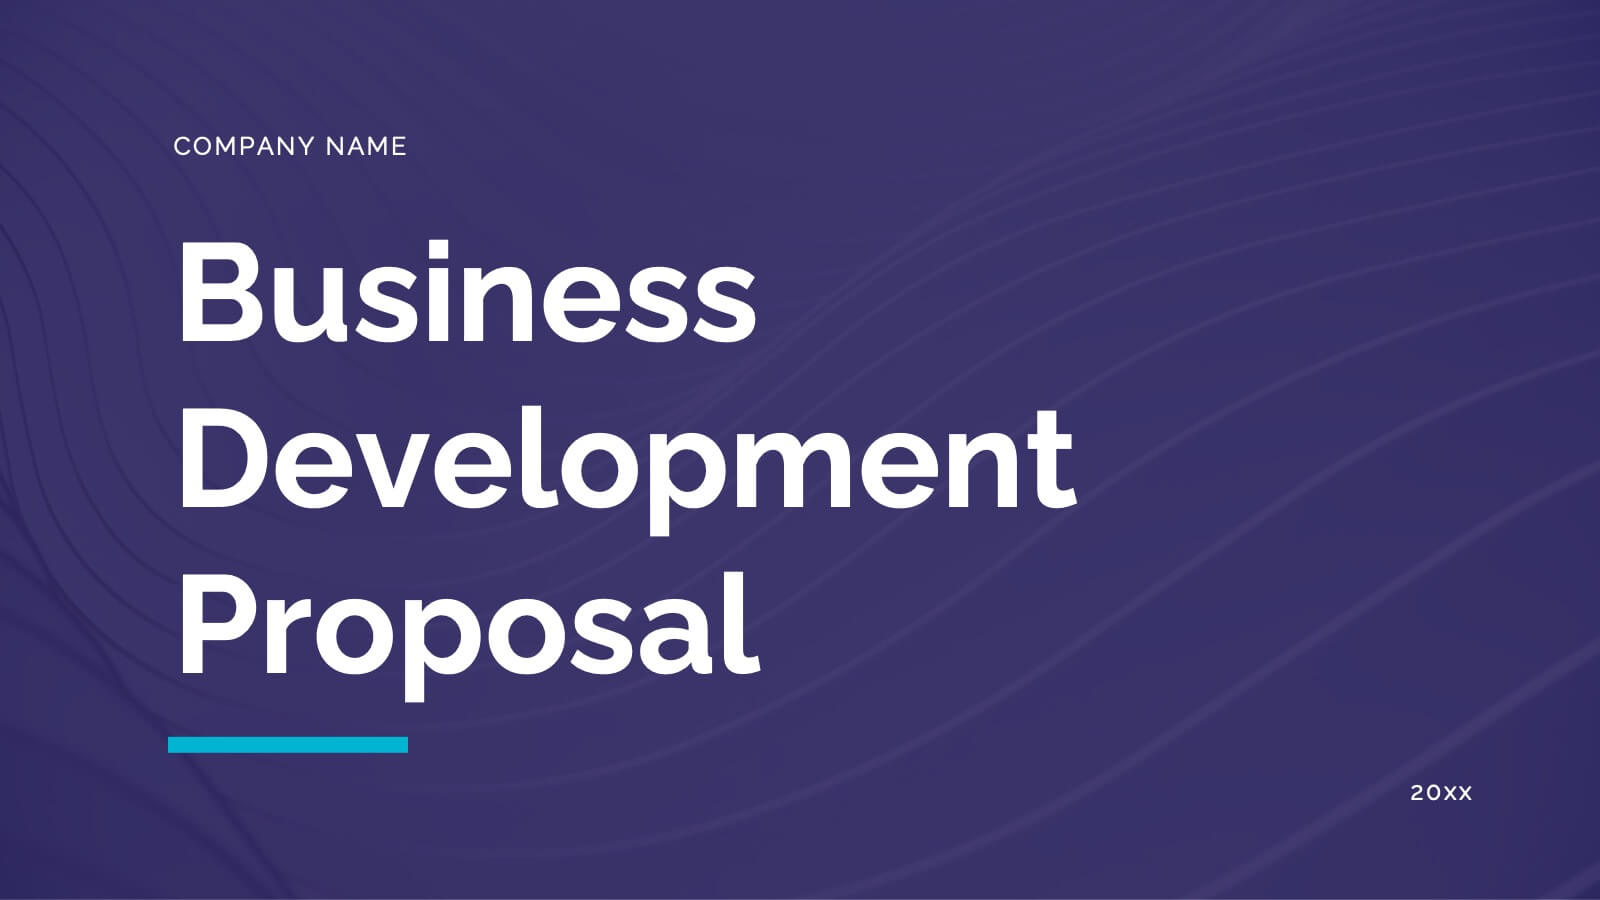
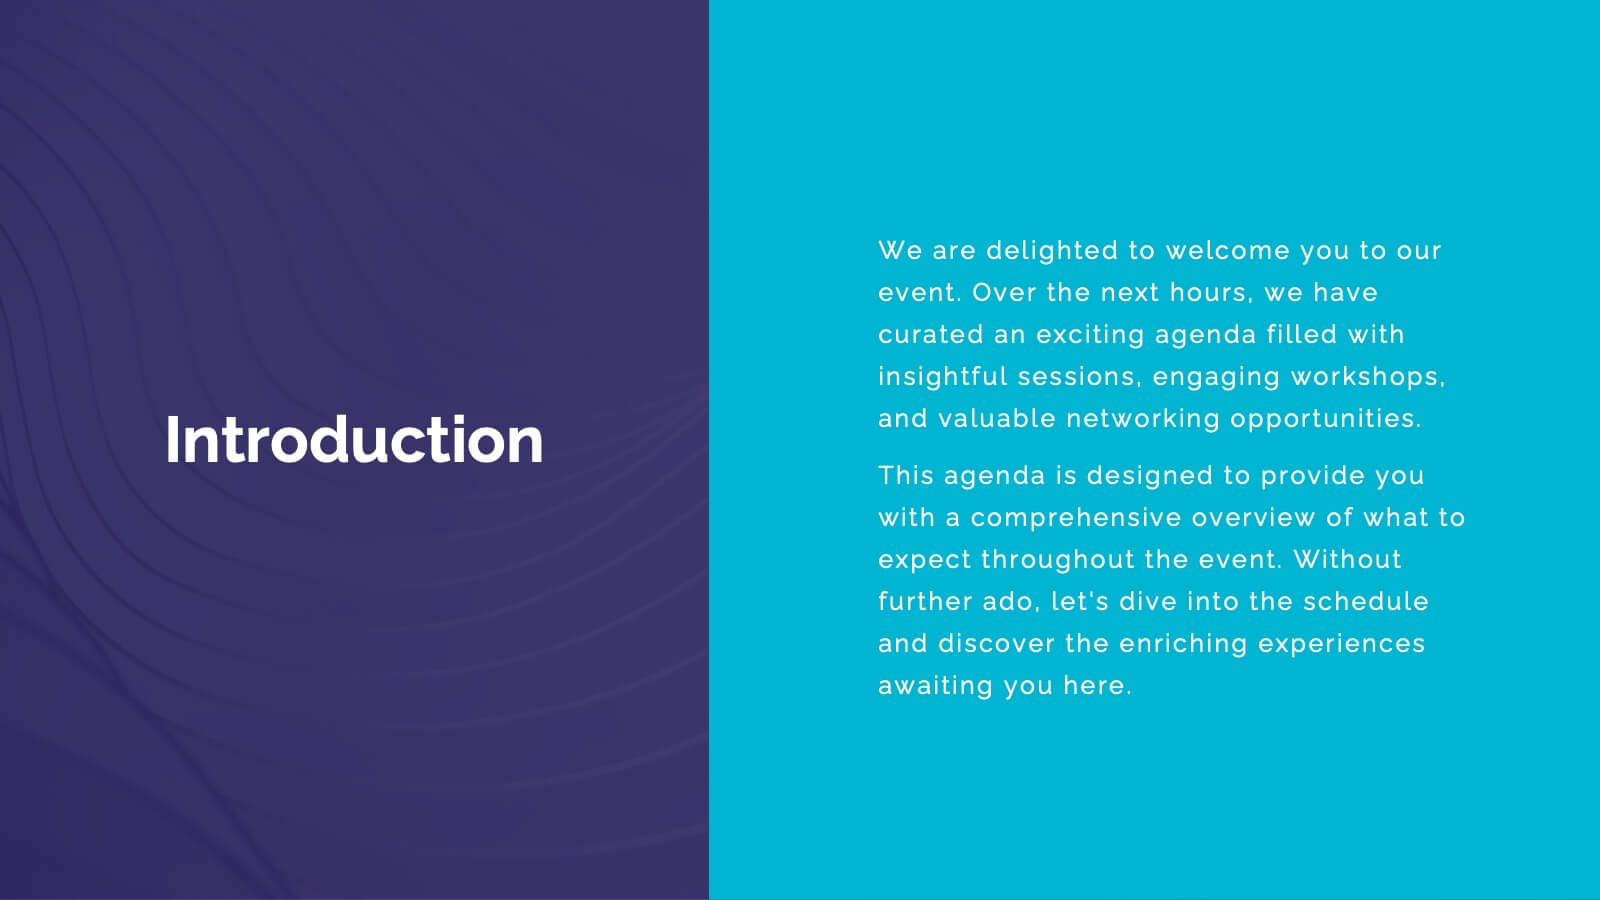
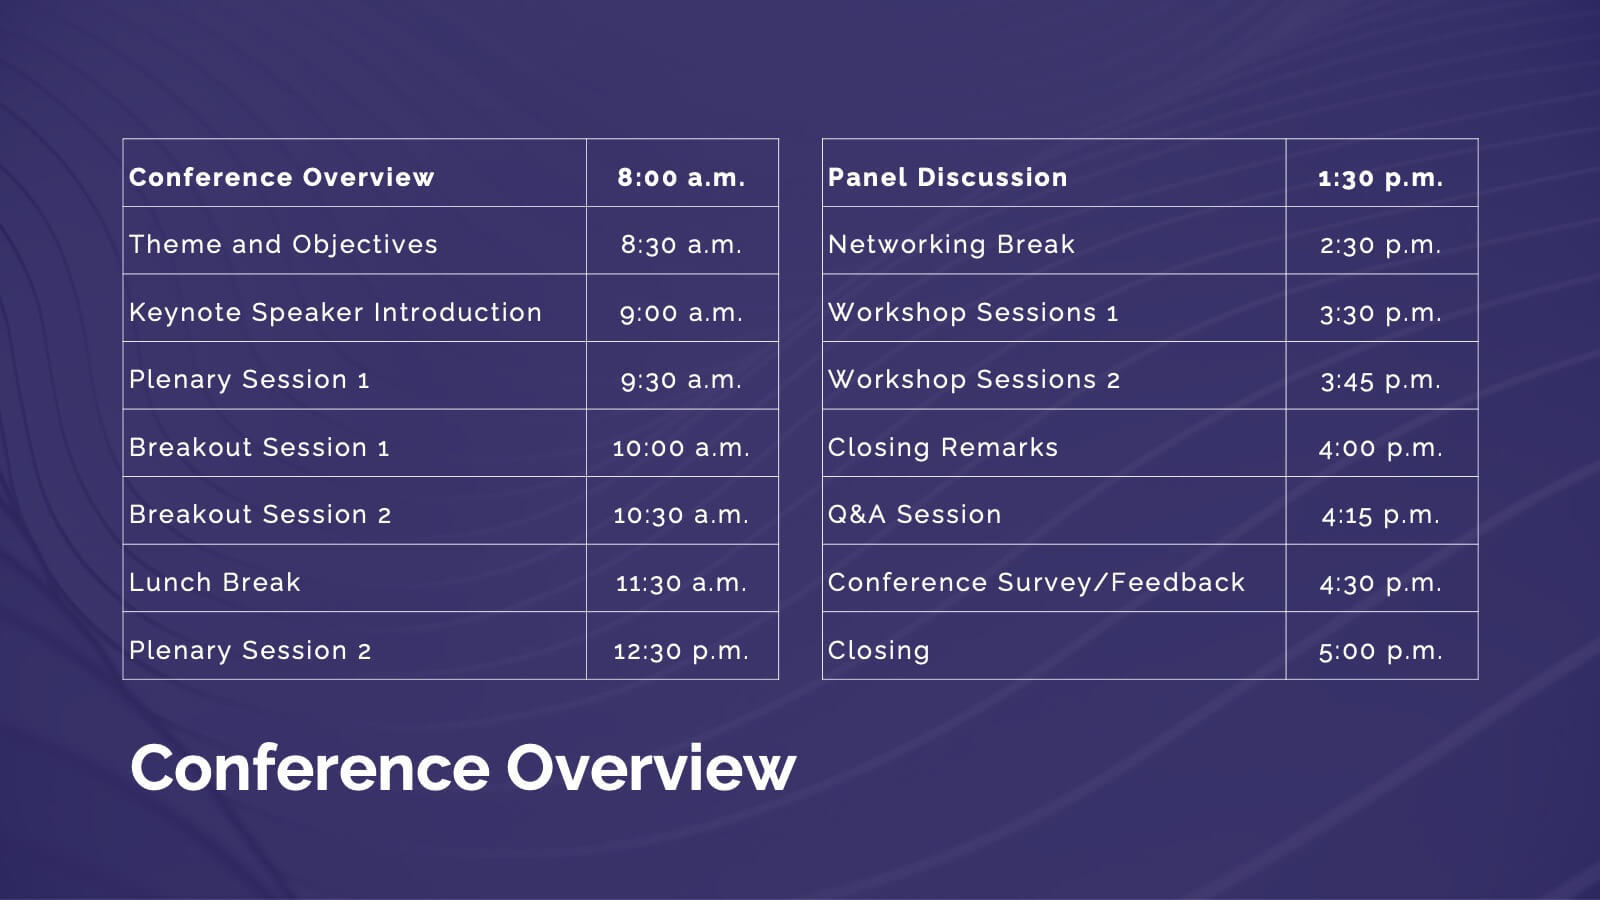
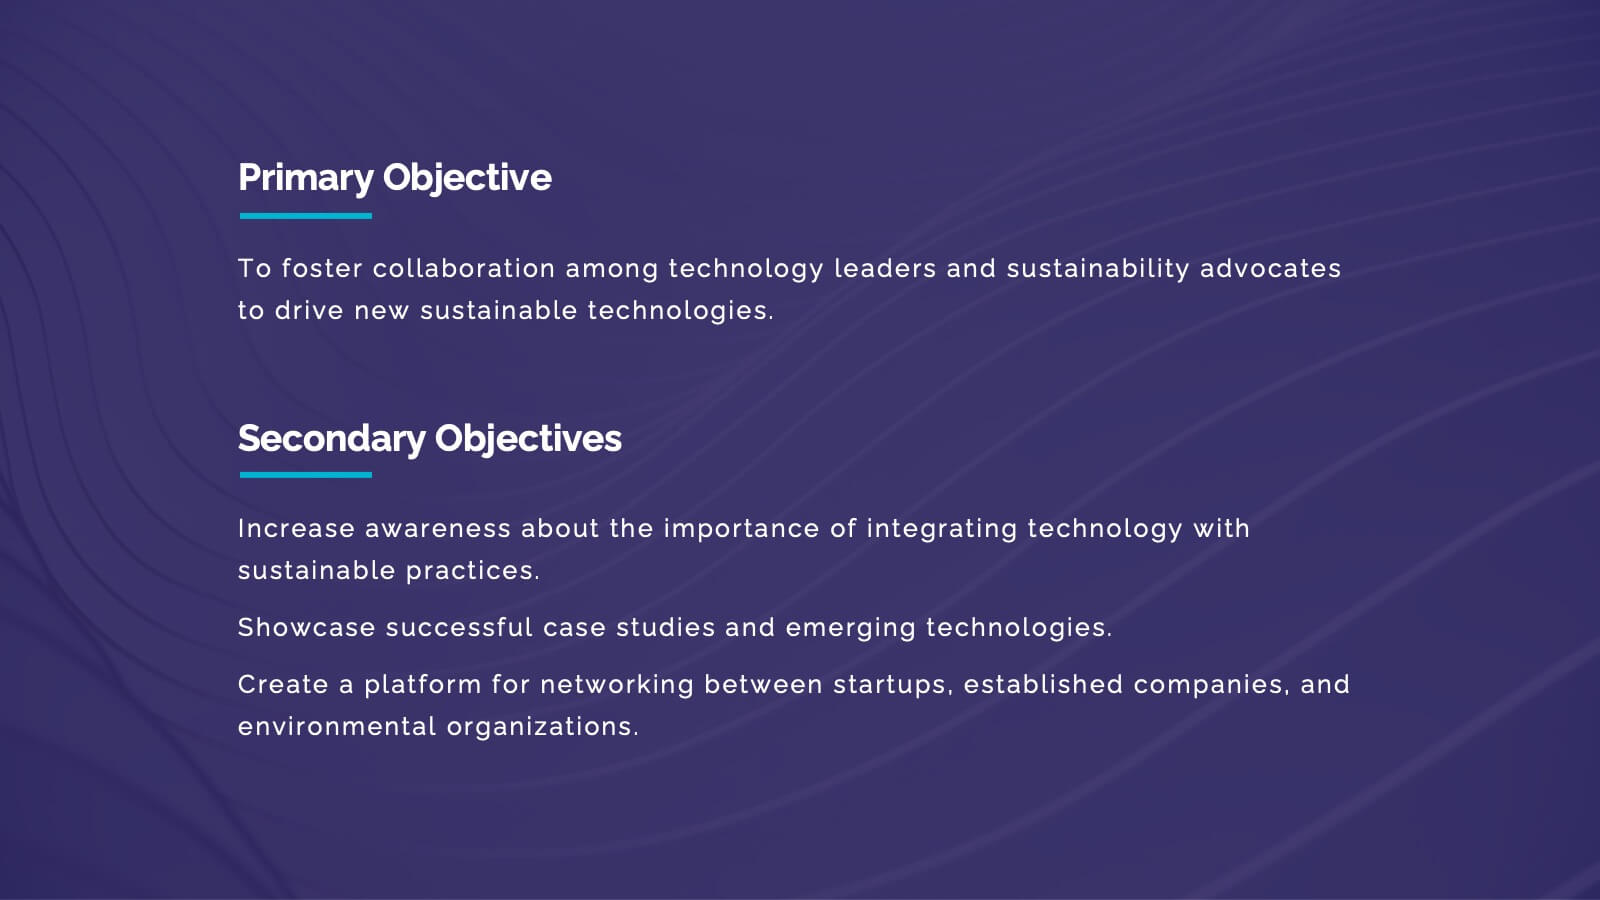
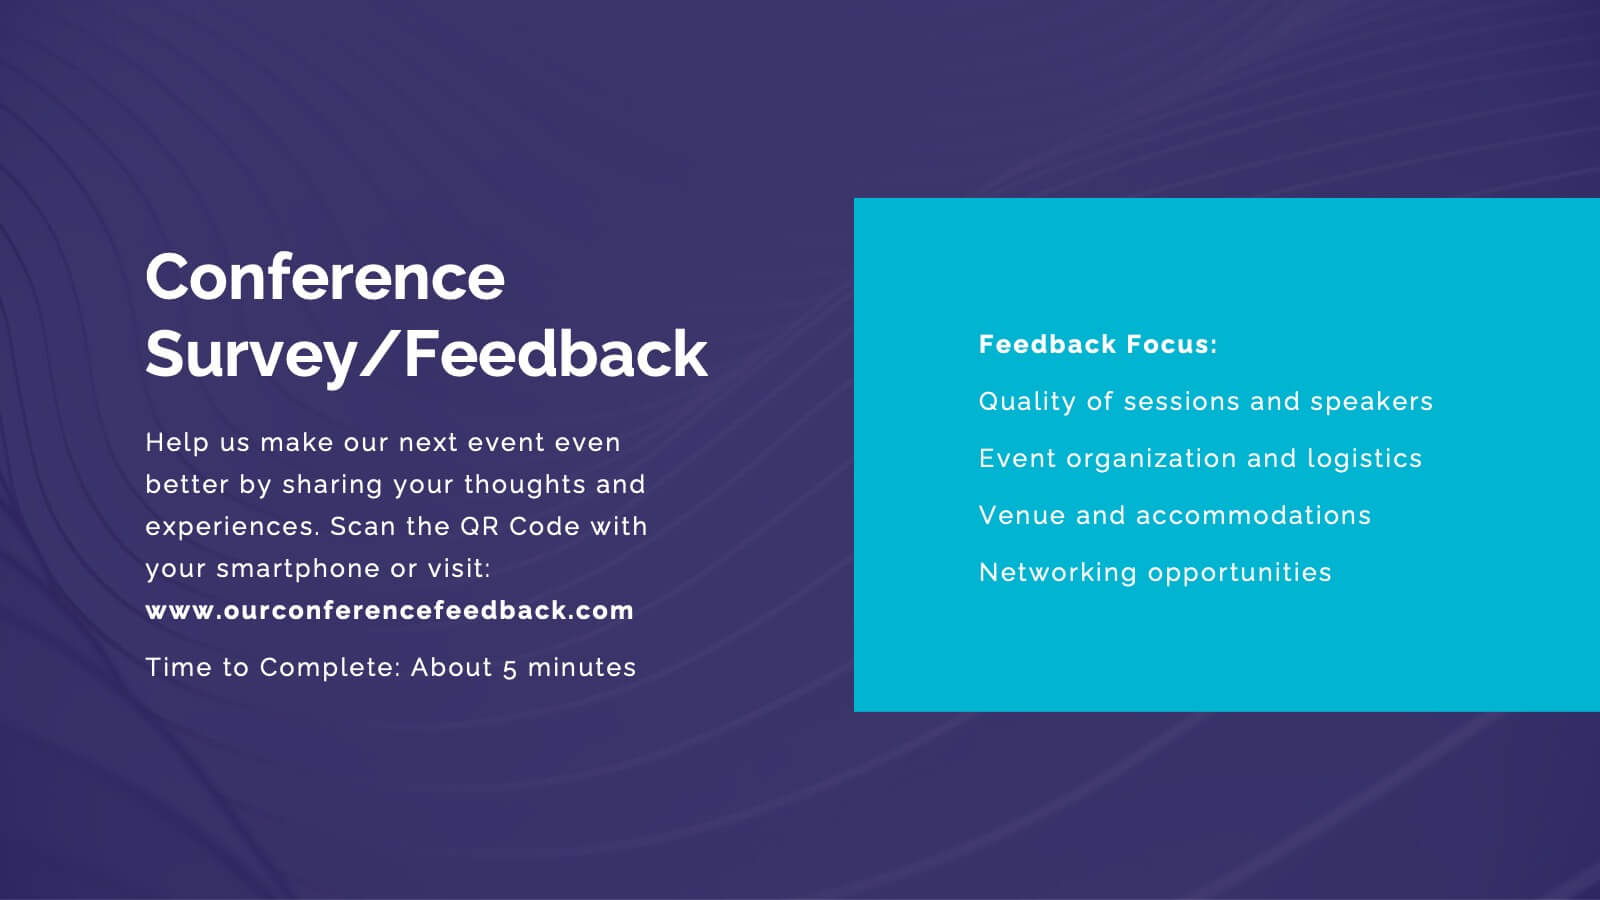
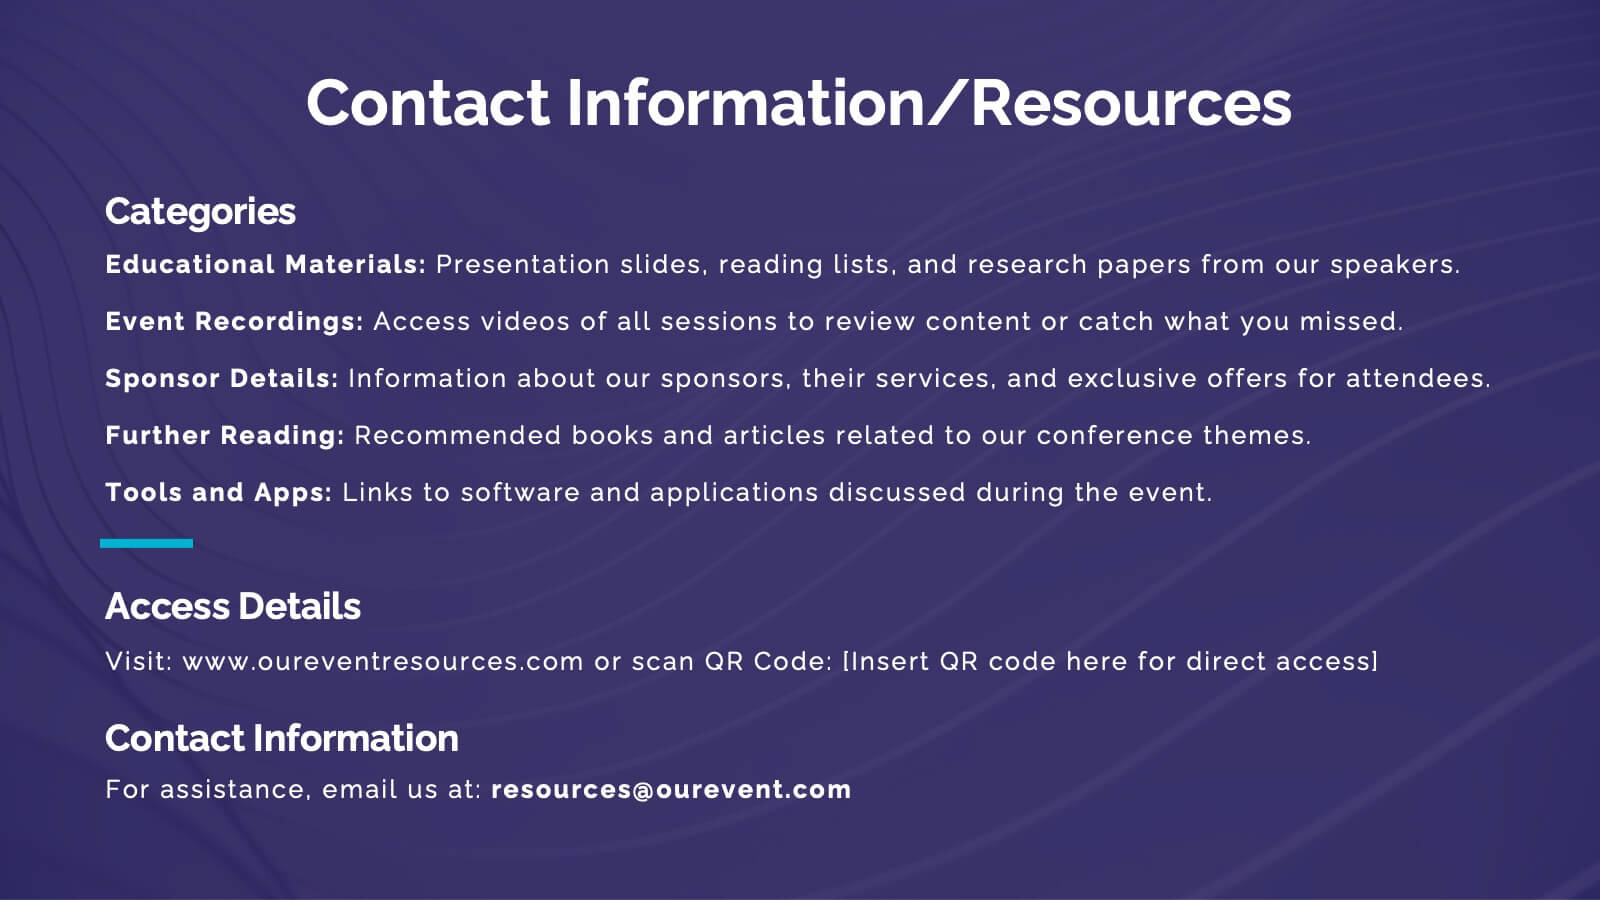
Nimbus Business Development Proposal Presentation
Boost your business presentations with this vibrant, professional template designed for business development proposals. Perfect for detailing conference overviews, themes, objectives, and keynotes, it features a clean and engaging layout. Highlight critical sessions and networking opportunities to captivate your audience. Compatible with PowerPoint, Keynote, and Google Slides, it ensures seamless presentations on any platform.


7 diapositivas
Social Network Infographic Presentation
A Social Network Infographic is a visual representation of data that shows the connections and relationships between individuals, groups, or organizations within a social network. Use this template to illustrate the structure of a social network, and to analyze patterns and trends in the interactions between users. This Infographic includes a visual representation of networking, in graphs and diagram, with icons representing individuals and lines representing connections between them. This template can be customized with different colors, fonts, and text in Powerpoint, Keynote, and Google Slides.


29 diapositivas
Shadowglow Brand Guidelines Proposal Presentation
Present a cohesive brand vision with this professional template, designed for crafting detailed and visually compelling brand guidelines. Highlight essential components like brand vision and mission, brand values, and identity elements, including color palettes, typography, and imagery. This template seamlessly incorporates customer personas, tone and voice guidelines, and brand touchpoints to define the essence of your brand's communication. Utilize slides for website, social media, and packaging strategies to establish consistency across all platforms. Customizable and compatible with PowerPoint, Google Slides, and Keynote, this design ensures clarity and professionalism, making it ideal for agencies or teams presenting comprehensive brand proposals.


5 diapositivas
Healthcare Industry Report
Deliver key medical insights with this modern, stethoscope-themed slide. Ideal for showcasing health metrics, clinical data, or medical updates, the layout includes four sections with health icons and clear callouts for easy readability. Fully customizable in PowerPoint, Keynote, and Google Slides.


8 diapositivas
Dynamic Pricing Strategies Presentation
Navigate market complexities with our 'Dynamic Pricing Strategies' presentation template, perfect for outlining variable pricing models that respond to market demands. This versatile tool is ideal for businesses looking to adapt and thrive, with designs compatible with PowerPoint, Keynote, and Google Slides.


6 diapositivas
Financial Report and Charts Presentation
Deliver financial insights with impact using this Financial Report and Charts Presentation Template. Featuring a clean layout with a money bag visual and percentage breakdowns, it’s perfect for showcasing profit distribution, investment categories, or budget summaries. Fully customizable in PowerPoint, Keynote, and Google Slides.


6 diapositivas
McKinsey Strategy Implementation Model Presentation
Visualize organizational alignment with the McKinsey 7S Model slide. Featuring a clean circular layout, it highlights Strategy, Structure, Systems, Shared Values, Style, Staff, and Skills. Ideal for consulting, planning, or leadership presentations. Fully editable and compatible with PowerPoint, Google Slides, and Keynote for easy customization and branding.


6 diapositivas
Threat and Mitigation Bowtie Model
Break down complex threats and responses with the Threat and Mitigation Bowtie Model Presentation. This infographic visualizes the relationship between root causes, a central hazard event, and its potential consequences—alongside the controls that mitigate them. Clean, editable layouts and multiple visual states let you emphasize either side of the bowtie. Ideal for risk assessments, business continuity planning, and safety presentations. Compatible with PowerPoint, Keynote, and Google Slides.


5 diapositivas
Chemistry Lessons Infographics
Dive into the fascinating world of chemistry with our chemistry lessons infographics. Set against a backdrop of bold orange, black, and blue, this template captures the vibrant essence of chemical reactions and laboratory experiments. Tailored for educators, students, and science enthusiasts, this collection is perfect for enhancing lesson plans, study materials, or research presentations. Compatible with Powerpoint, Keynote, and Google Slides. With its creative, lab-themed design, each infographic is enriched with striking graphics and icons, providing a visual feast that simplifies complex concepts and promotes the joy of learning chemistry.


10 diapositivas
Africa Market Potential and Growth Map Presentation
Unlock business opportunities with the Africa Market Potential and Growth Map template, designed to showcase market analysis and growth trends across different African regions. It features a map highlighting specific countries coupled with adjustable data bars reflecting market potential percentages. This template is ideal for presentations focusing on market trends, investment opportunities, and growth forecasts in Africa.


26 diapositivas
The Impact of 5G Technology Presentation
Step into the future with this insightful presentation on the impact of 5G technology. Covering key areas like faster connectivity, IoT advancements, industry applications, and potential challenges, this template helps you break down complex concepts with clarity. Fully customizable and compatible with PowerPoint, Keynote, and Google Slides for a seamless presentation experience.


6 diapositivas
Statistical Data Analysis Presentation
Delve into the details with the "Statistical Data Analysis" presentation templates, designed to simplify complex information into digestible insights. These templates feature interconnected gears symbolizing the intricate processes of data analysis, ideal for statisticians and analysts looking to present their findings effectively. Fully compatible with PowerPoint, Keynote, and Google Slides, they are a must-have for anyone presenting statistical data.


6 diapositivas
Project Proposal Timeline Infographic
Effectively manage and present the timelines of your projects with our Project Proposal Timeline Templates. Designed for clarity and impact, these templates aid project managers, planners, and coordinators in outlining the key milestones and phases of projects, ensuring all stakeholders are aligned with the project schedule. Each slide in the collection features a streamlined design, utilizing shades of green to emphasize different stages and important dates. The templates are equipped with intuitive layouts that include Gantt charts, timelines, and lists, making it easy to visualize the sequence of activities, dependencies, and deadlines. Customizable for various types of projects, these timeline slides allow for detailed specifications, enabling you to adjust durations, update tasks, and refine objectives as your project evolves. Whether used for internal planning or external presentations, these templates help convey your project's scope and schedule in a professional and easily understandable manner.