


Características


¿Tienes alguna pregunta?
Recomendar


6 diapositivas
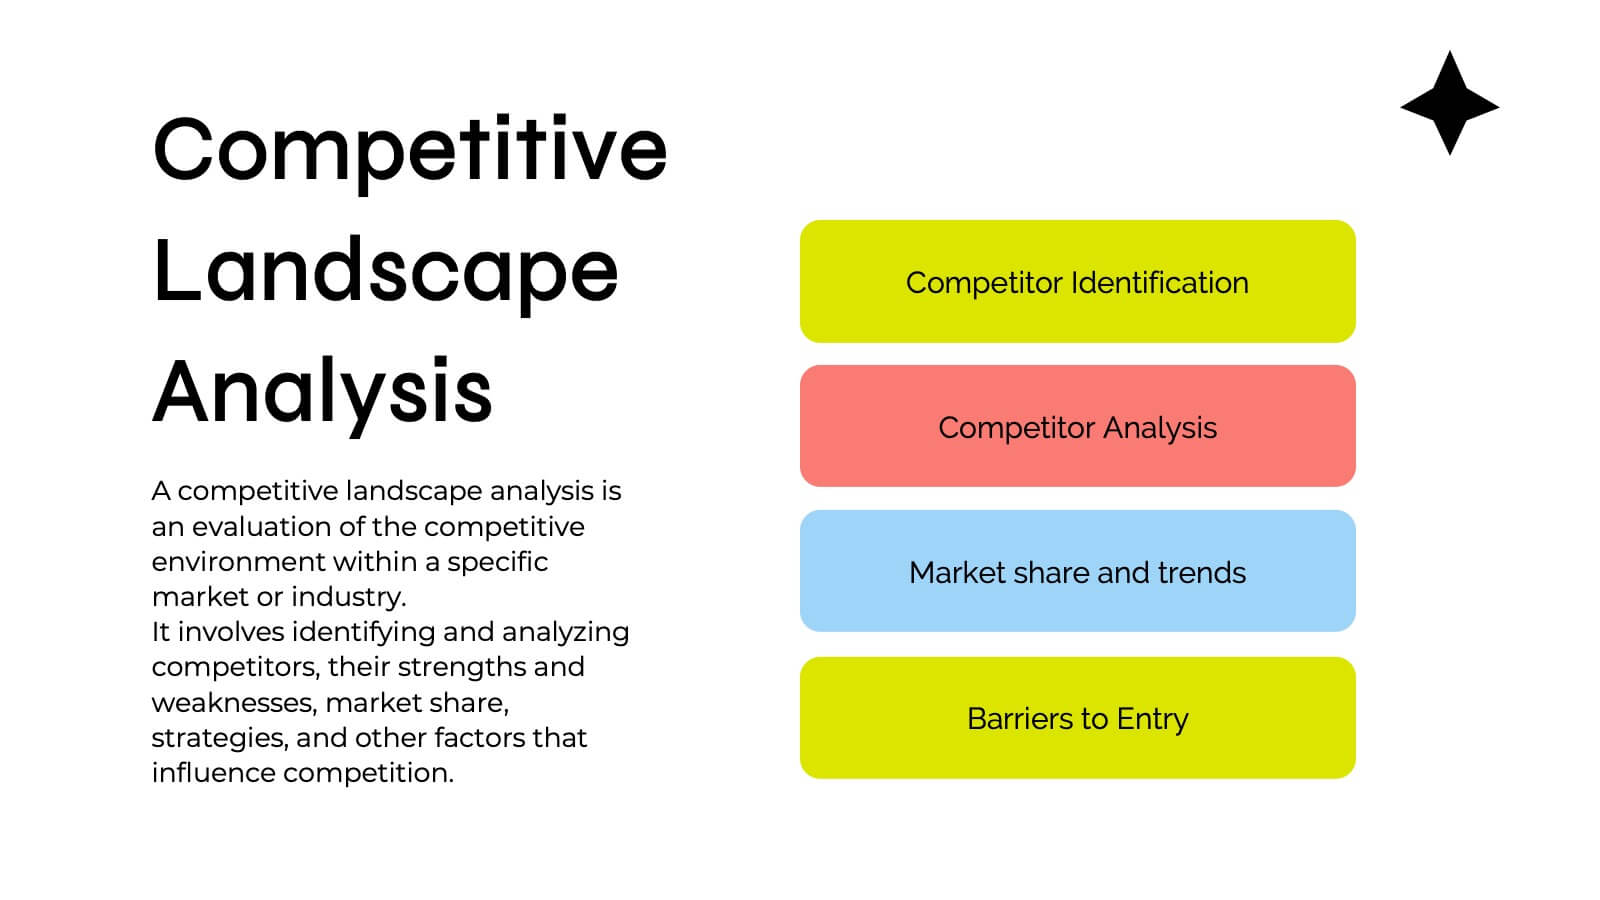
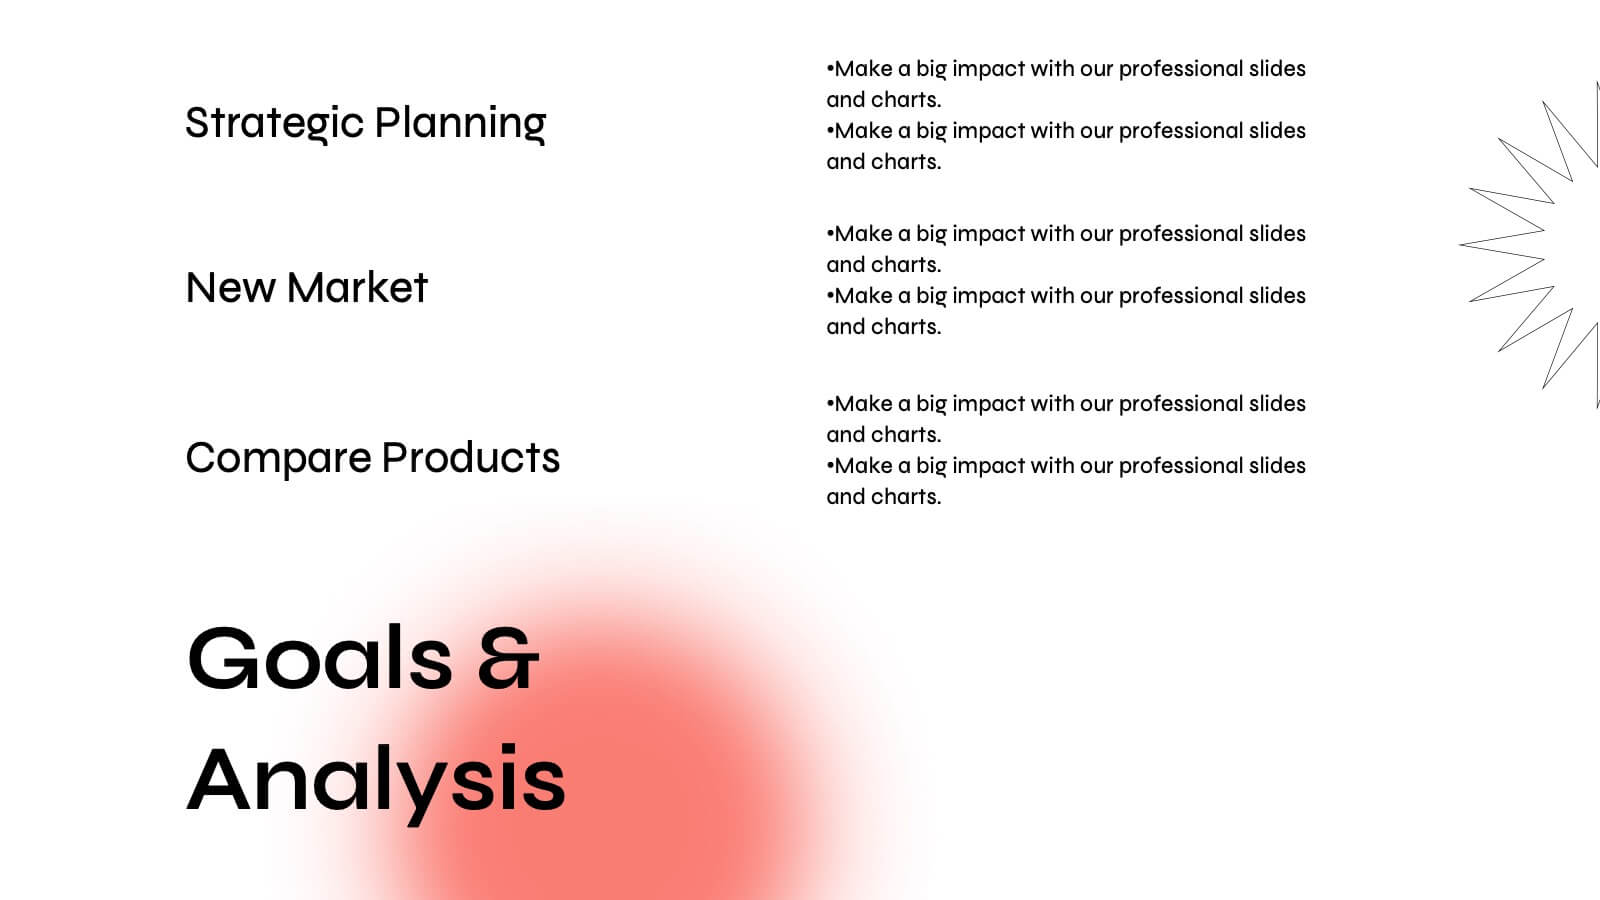
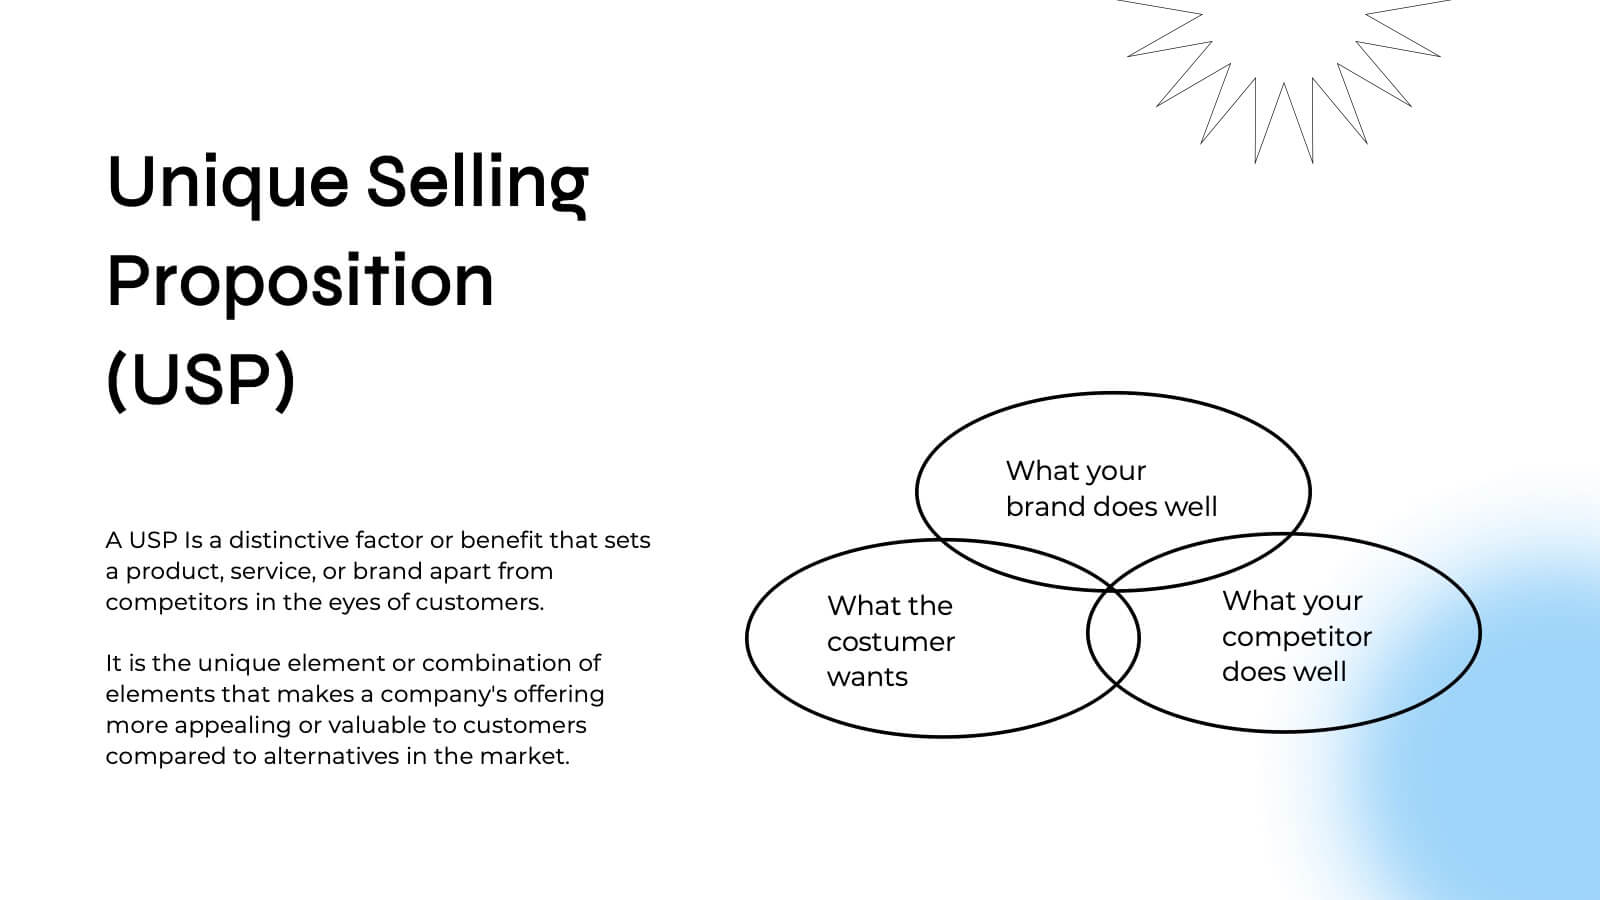
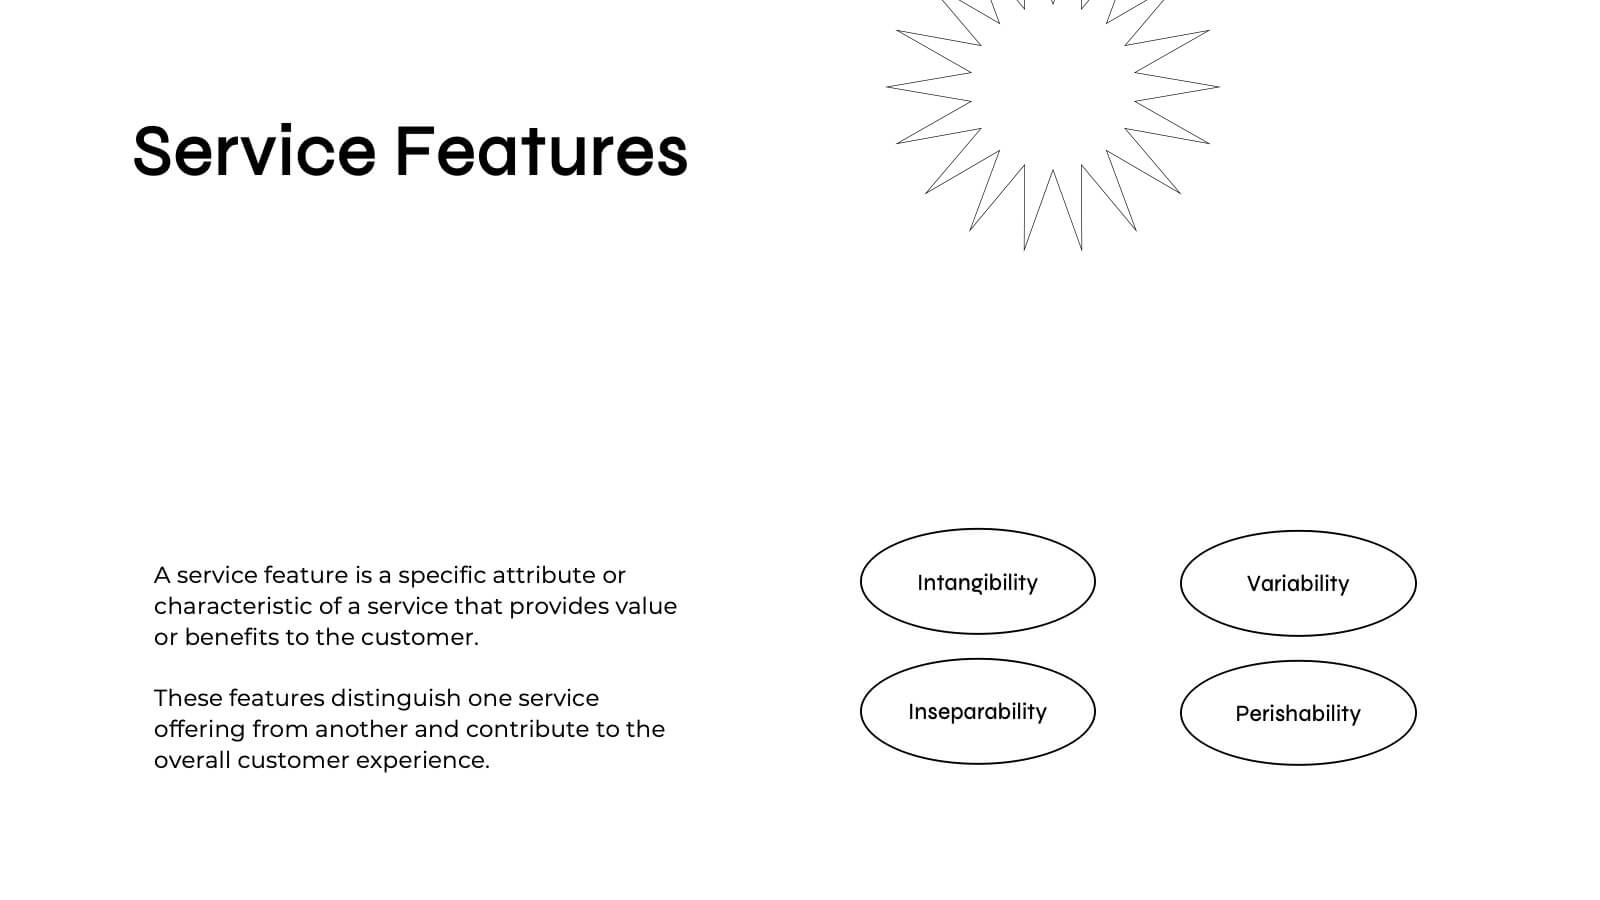
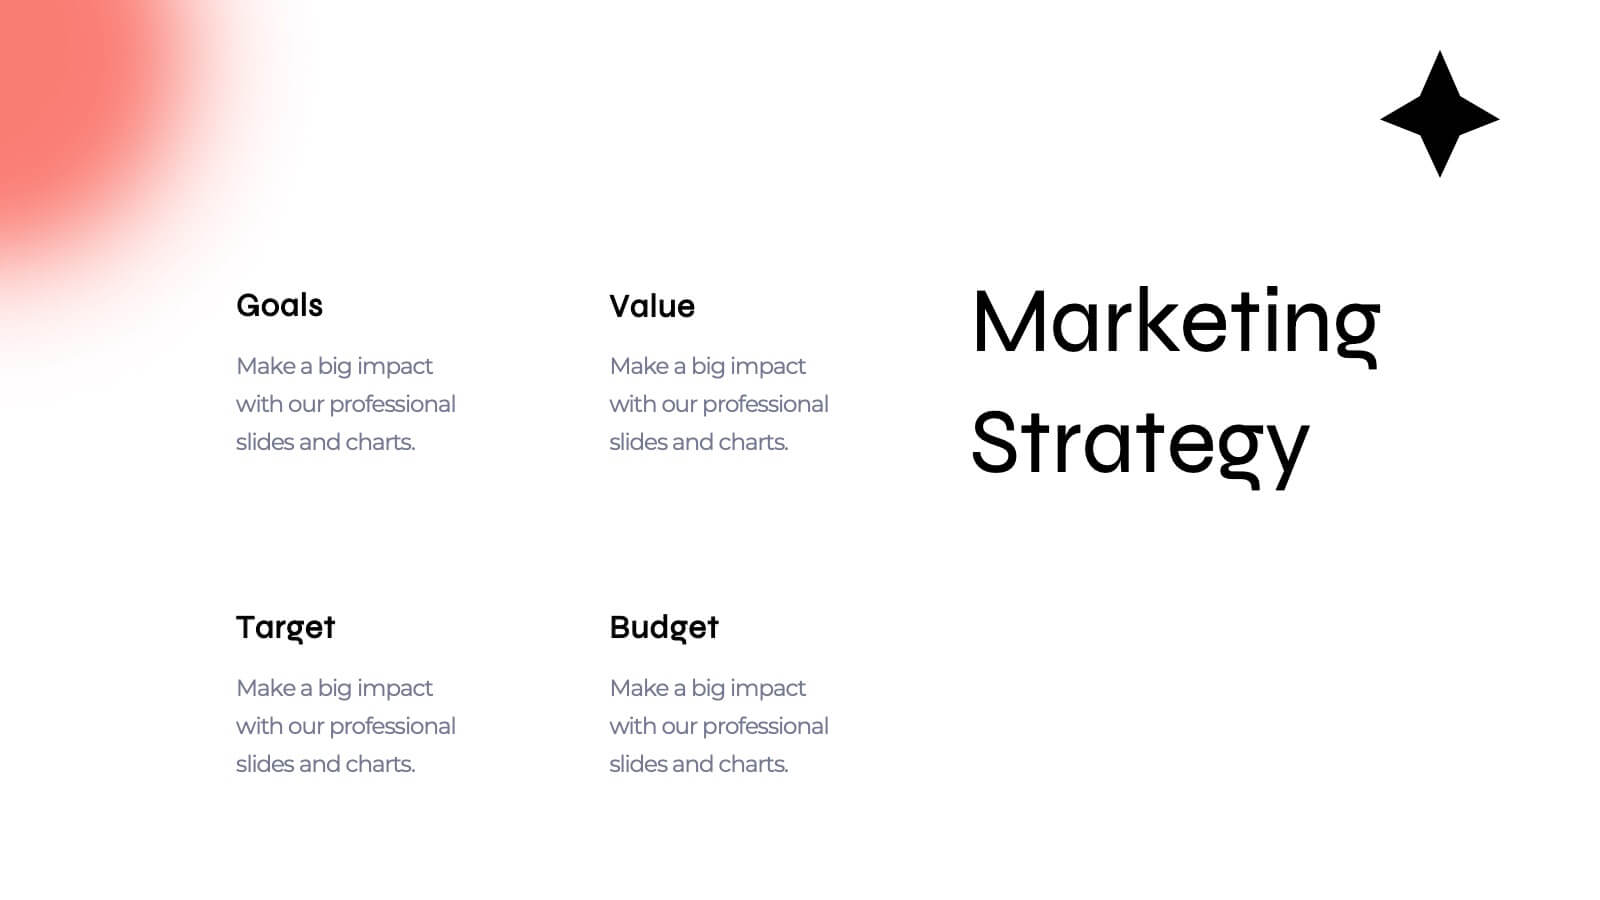
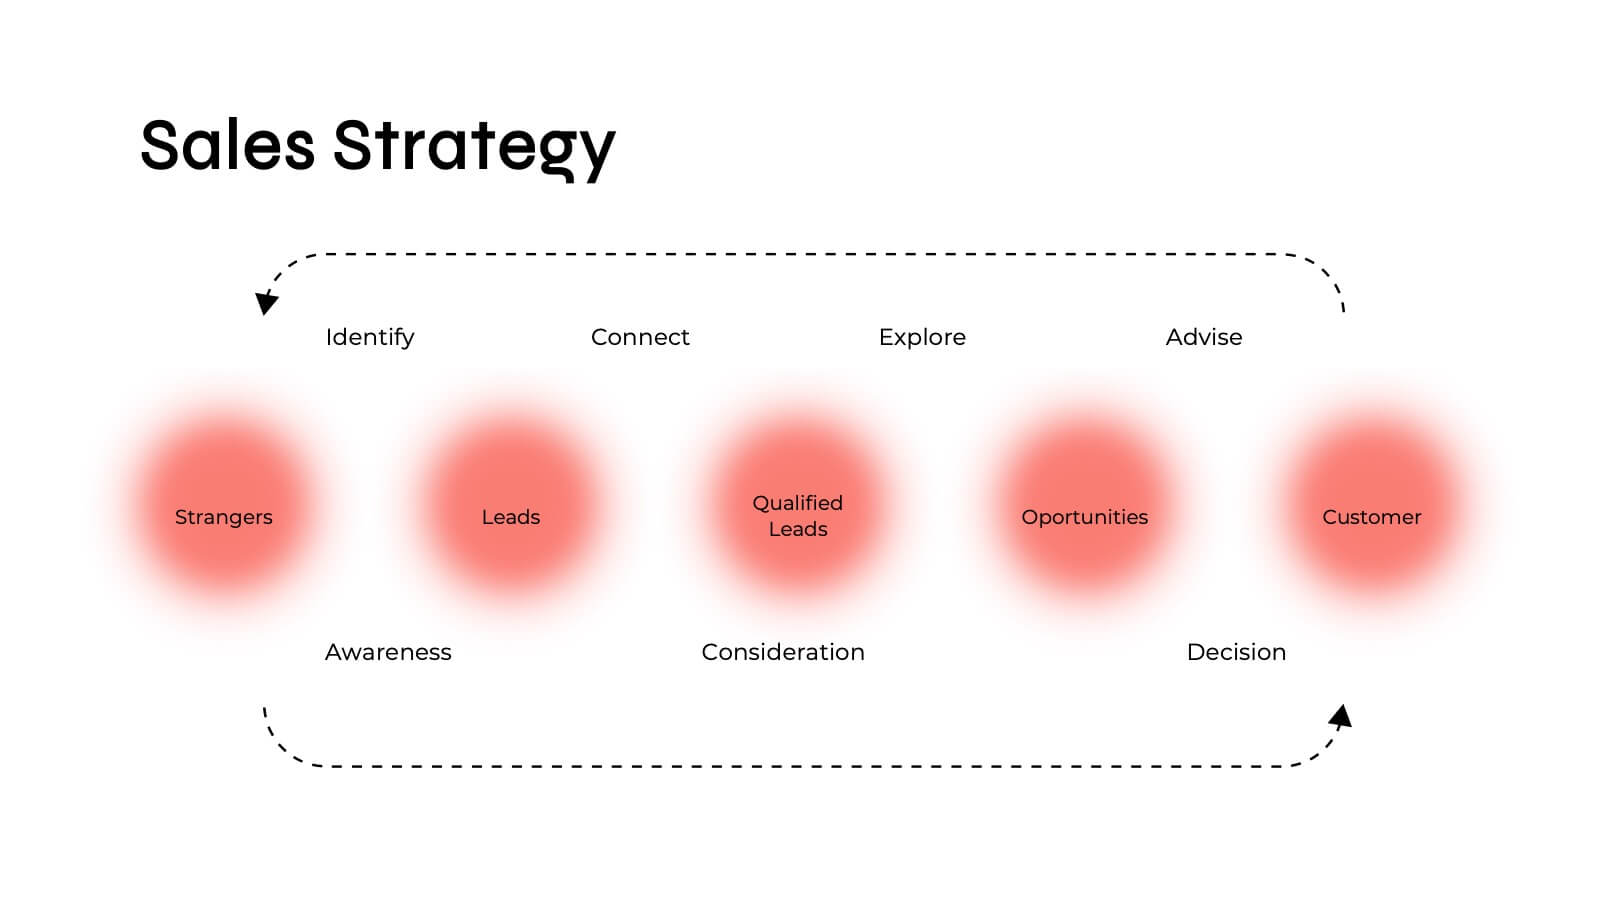
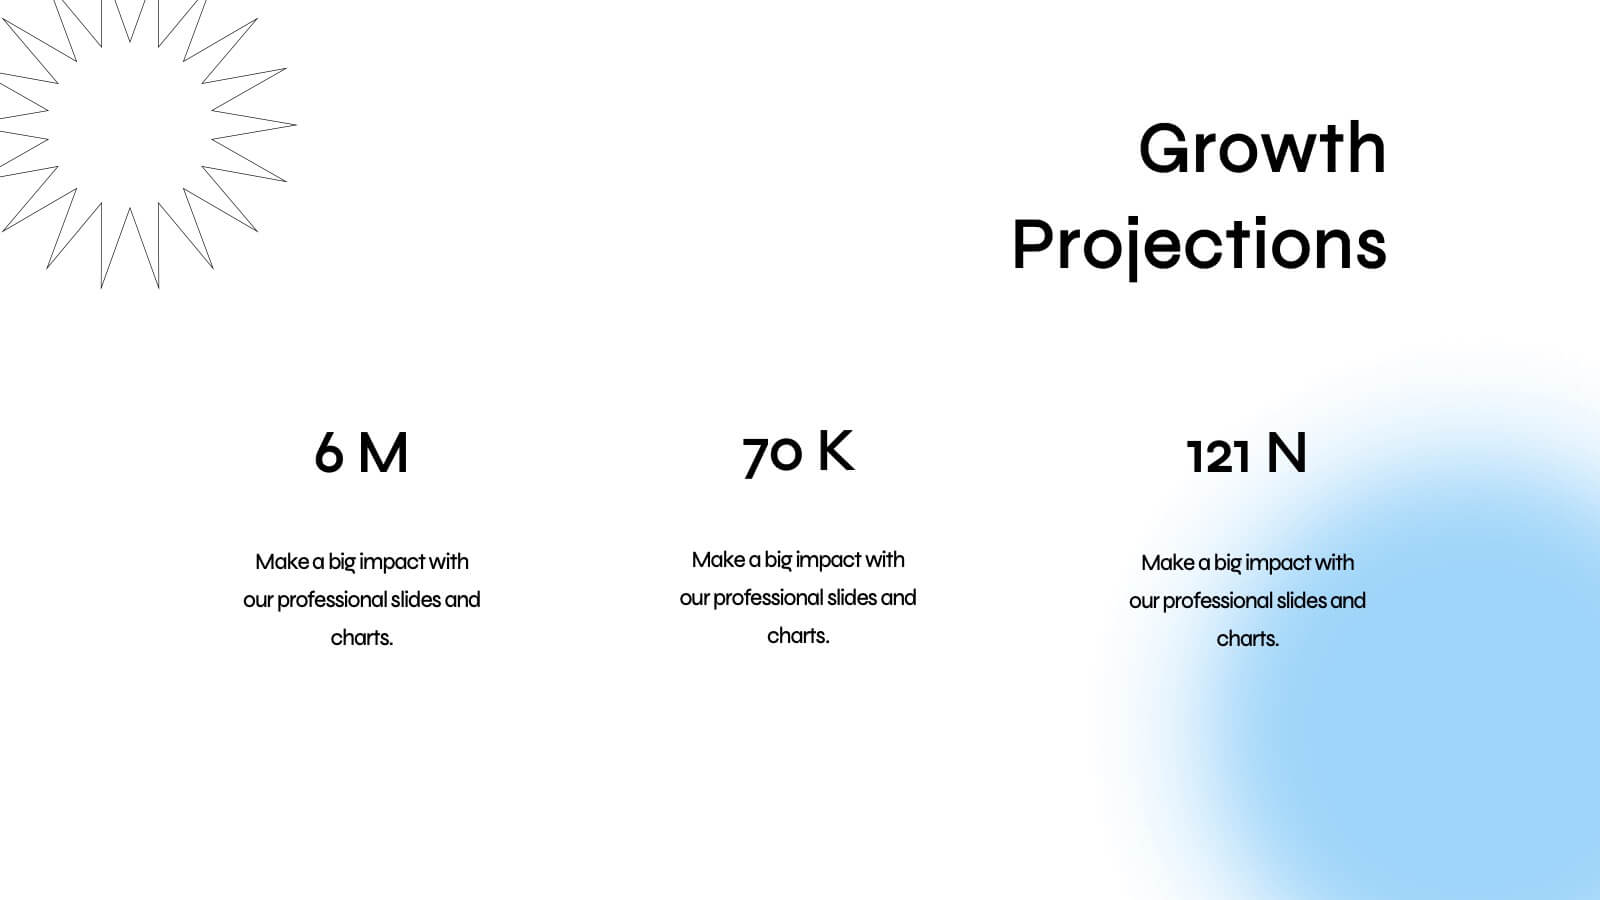
Business Marketing Strategy Infographic
Enhance your business presentations with our Business Marketing Strategy Infographic, tailored for PowerPoint, Google Slides, and Keynote. This comprehensive template is designed to help you effectively communicate complex marketing strategies in a visually engaging manner. Each slide offers a unique layout to present your marketing plans, from analysis to execution. Highlight key components like market research, goals, target audiences, and planned actions. With its customizable features, it's perfect for marketers aiming to outline strategies, set objectives, and convey tactics in a clear, concise way to team members and stakeholders alike.


5 diapositivas
Country Breakdown South America Map Presentation
Turn complex regional data into clear visual insights with this modern map layout designed for South America. Perfect for showcasing country statistics, market segmentation, or performance comparisons, this slide keeps information clean and engaging. Fully compatible with PowerPoint, Keynote, and Google Slides for easy editing and professional presentations.


26 diapositivas
Briarfall Rebranding Project Plan Presentation
This Brand Presentation Template offers a modern and structured approach to showcasing your brand identity, values, and strategic direction. Covering essential elements like audience personas, brand positioning, touchpoints, and performance metrics, it's fully customizable and perfect for businesses looking to strengthen their brand presence. Compatible with PowerPoint, Keynote, and Google Slides.


26 diapositivas
Coffee Shop Warm Company Profile Presentation
Coffee shops have become an important part of modern culture, especially in urban areas, and they come in various styles and themes. This presentation template is designed to bring the essence of your coffee haven to life. From the first sip to the last drop, let this presentation showcase the soul-warming experience your coffee shop provides. Fully customizable and compatible with Powerpoint, Keynote, and Google Slides. Utilize warm colors like browns, oranges, and yellows to evoke a cozy, comforting atmosphere. The template integrates coffee cup icons, latte art, and coffee bean graphics for a coffee-centric theme.


4 diapositivas
Fixed and Variable Cost Balance Presentation
Visualize cost distribution using a balanced scale metaphor. This presentation helps compare fixed and variable costs with editable sections for data input. Ideal for financial planning, budgeting, or cost control analysis. Fully customizable in PowerPoint, Keynote, and Google Slides to match any brand or business presentation style.


5 diapositivas
Tiered Strategy Framework Pyramid Presentation
Break down your plan into clear, actionable steps with this Tiered Strategy Framework Pyramid presentation. Each arrow-shaped tier helps visualize hierarchical strategies, workflows, or growth levels. Use this layout to communicate priorities, initiatives, or milestones in a sleek and modern format. Fully editable in Canva, PowerPoint, or Google Slides.


4 diapositivas
E-Learning Course Design Overview Presentation
Spark curiosity from the very first slide with a clean, modern layout that explains how effective online learning experiences are planned and delivered. This presentation walks through key elements of course structure, content flow, and learner engagement in a simple, visual way. Fully compatible with PowerPoint, Keynote, and Google Slides.


14 diapositivas
Agenda Institutional Infographic
Our institutional agenda slide templates are meticulously designed to cater to educational institutions, government bodies, and other large organizations. These templates help in organizing and presenting meeting agendas to ensure clear communication and systematic discussion of points in large-scale meetings. These templates feature a range of designs from sleek, modern minimalist styles to more structured and detailed layouts that incorporate elements like timelines, photo placeholders, and detailed text areas. They are perfect for outlining the sequence of topics, discussion points, key speakers, and timelines, enhancing both preparation and participation during institutional meetings. Fully editable and adaptable, these templates can be tailored to match the specific branding and communication styles of your institution. The varied designs ensure that there is a template to fit the unique needs of different types of meetings, whether it's a board meeting, a faculty gathering, or an inter-departmental committee.


5 diapositivas
Likelihood vs Impact Risk Matrix Presentation
Clearly prioritize your risks with the Likelihood vs Impact Risk Matrix Presentation. This intuitive grid layout lets you map potential threats based on severity and probability, helping teams focus on what matters most. Ideal for strategic planning, audits, and project risk reviews. Editable in PowerPoint, Canva, Keynote, and Google Slides.


8 diapositivas
Interactive Digital Learning Experience Presentation
Make your content more engaging with the Interactive Digital Learning Experience Presentation. This layout blends quiz-style visuals and educational icons, helping you present learning modules, assessments, or training checkpoints in a fun and intuitive way. Use it to simplify information, boost audience interaction, or highlight multiple-choice content. Fully editable in Canva, PowerPoint, Keynote, and Google Slides.


8 diapositivas
Social Media Engagement Metrics
Track engagement with clarity using the Social Media Engagement Metrics Presentation. This layout features a smartphone mockup at the center, with four vertically stacked icons representing key engagement indicators. Surrounding the device, space is allocated for concise data insights or definitions labeled A through D. Perfect for presenting analytics like likes, shares, comments, and reach. Fully editable in PowerPoint, Keynote, and Google Slides.


7 diapositivas
Watercolor Strategy Infographic
Dive into a cascade of strategic insights with our watercolor strategy infographic. Presented on a crisp white canvas, the splash of yellow, green, and blue emanates a fluidity that mirrors the dynamic nature of business strategies. Each hue merges seamlessly to provide a visual treat while retaining the core informational value. Tailored for Powerpoint, Keynote, and Google Slides, this template is embellished with customizable graphics, intricate icons, and flexible image placeholders, making it an ideal choice for any strategic visualization. Let your strategy flow, vivid and vibrant, just like watercolors on paper.


5 diapositivas
Beer Industry Infographics
The beer industry refers to the production, distribution, and sale of beer, which is a popular alcoholic beverage consumed worldwide. These vertical infographics provide key insights into the beer industry. They are designed to present data, facts, and trends in a visually engaging format, making it easy for viewers to understand and retain the information. The infographics feature a captivating design with beer-themed visuals, vibrant colors, and appealing typography. The visuals are carefully chosen to represent different aspects of the beer industry and create a cohesive and visually appealing infographic.

22 diapositivas
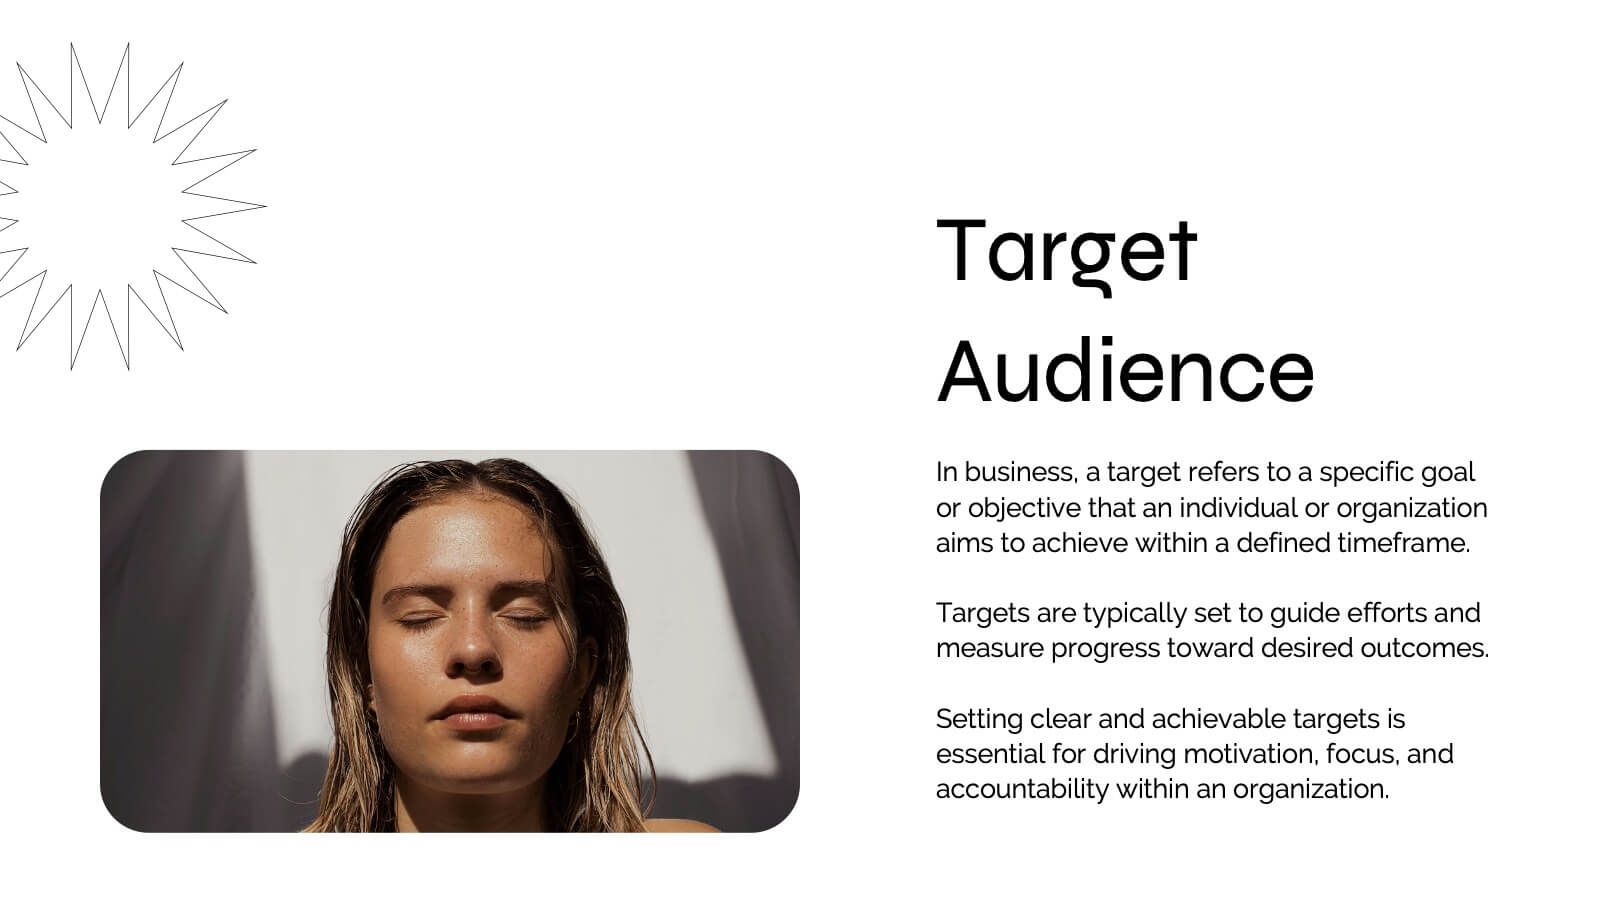
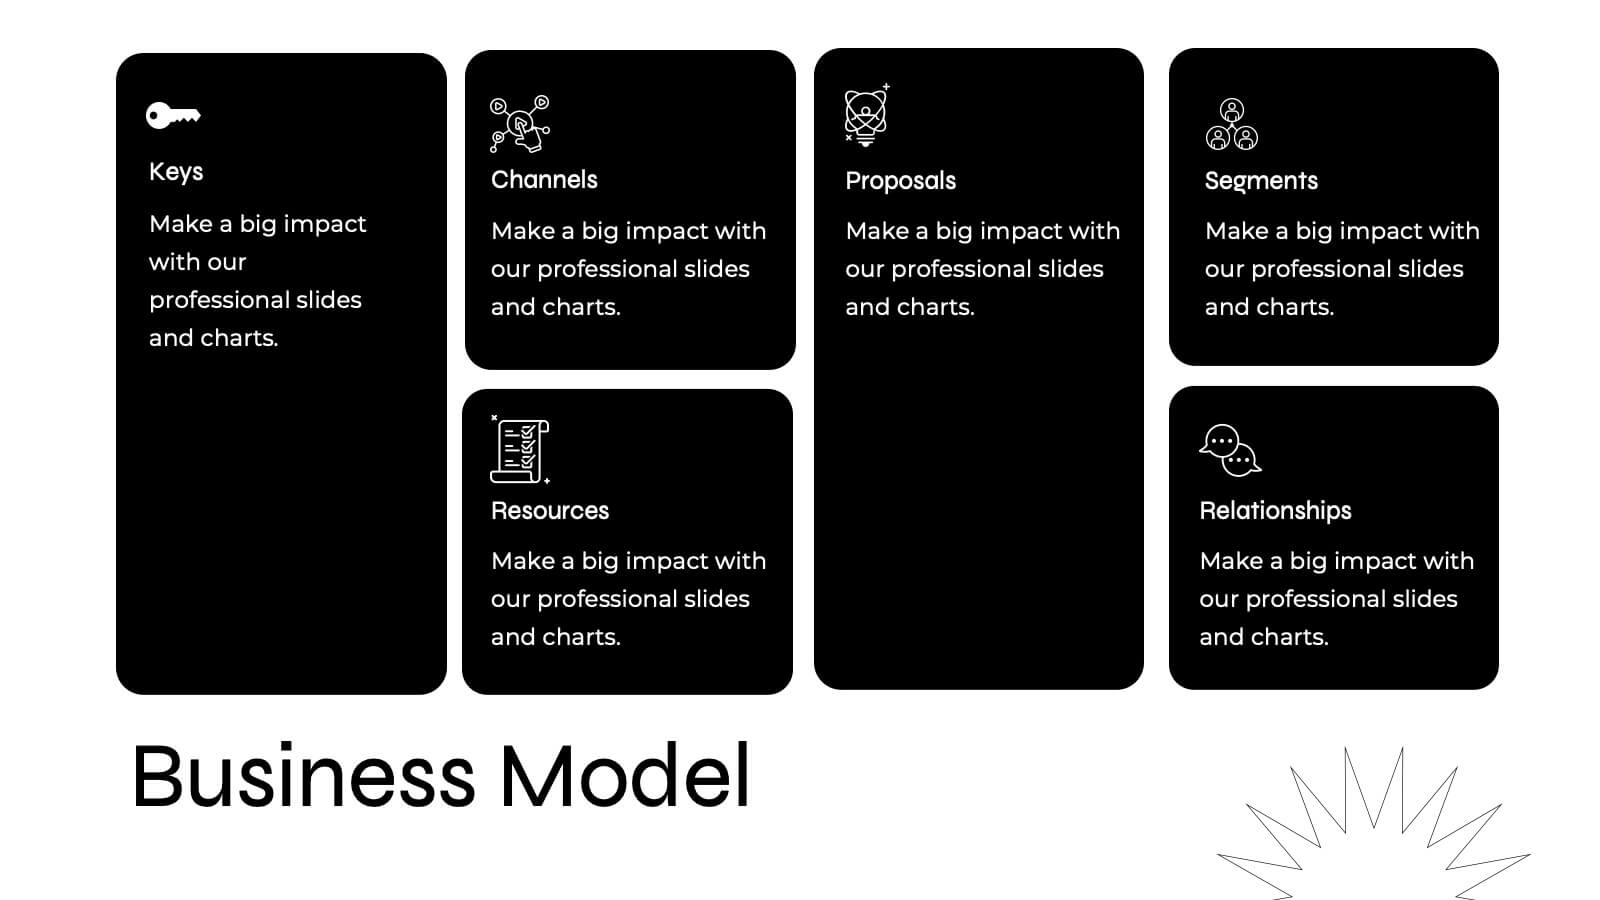
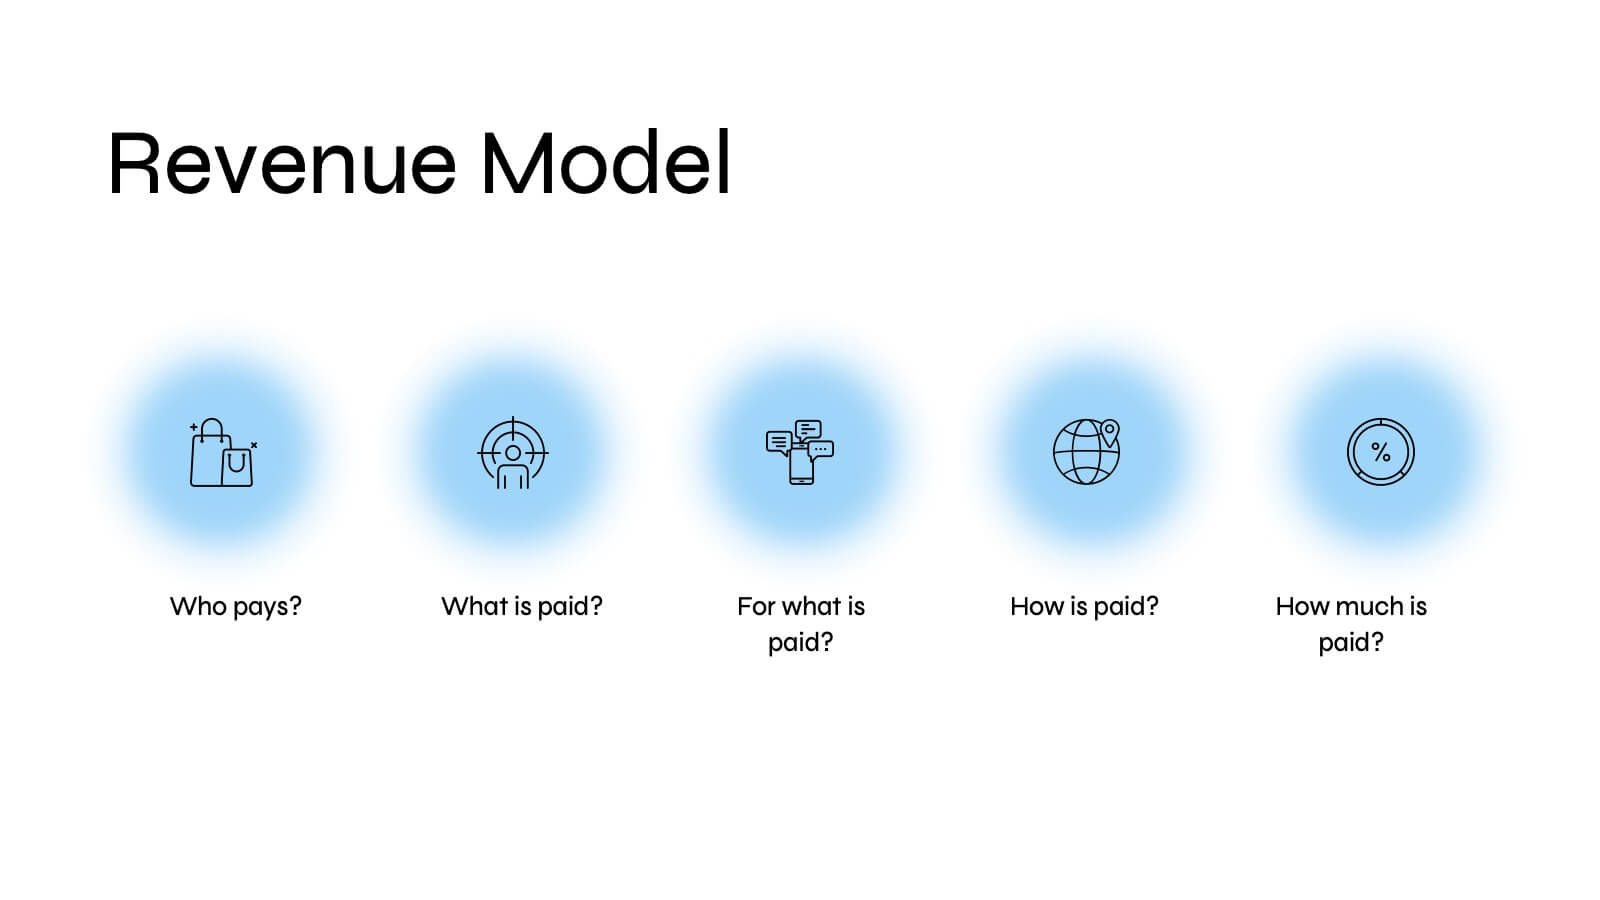
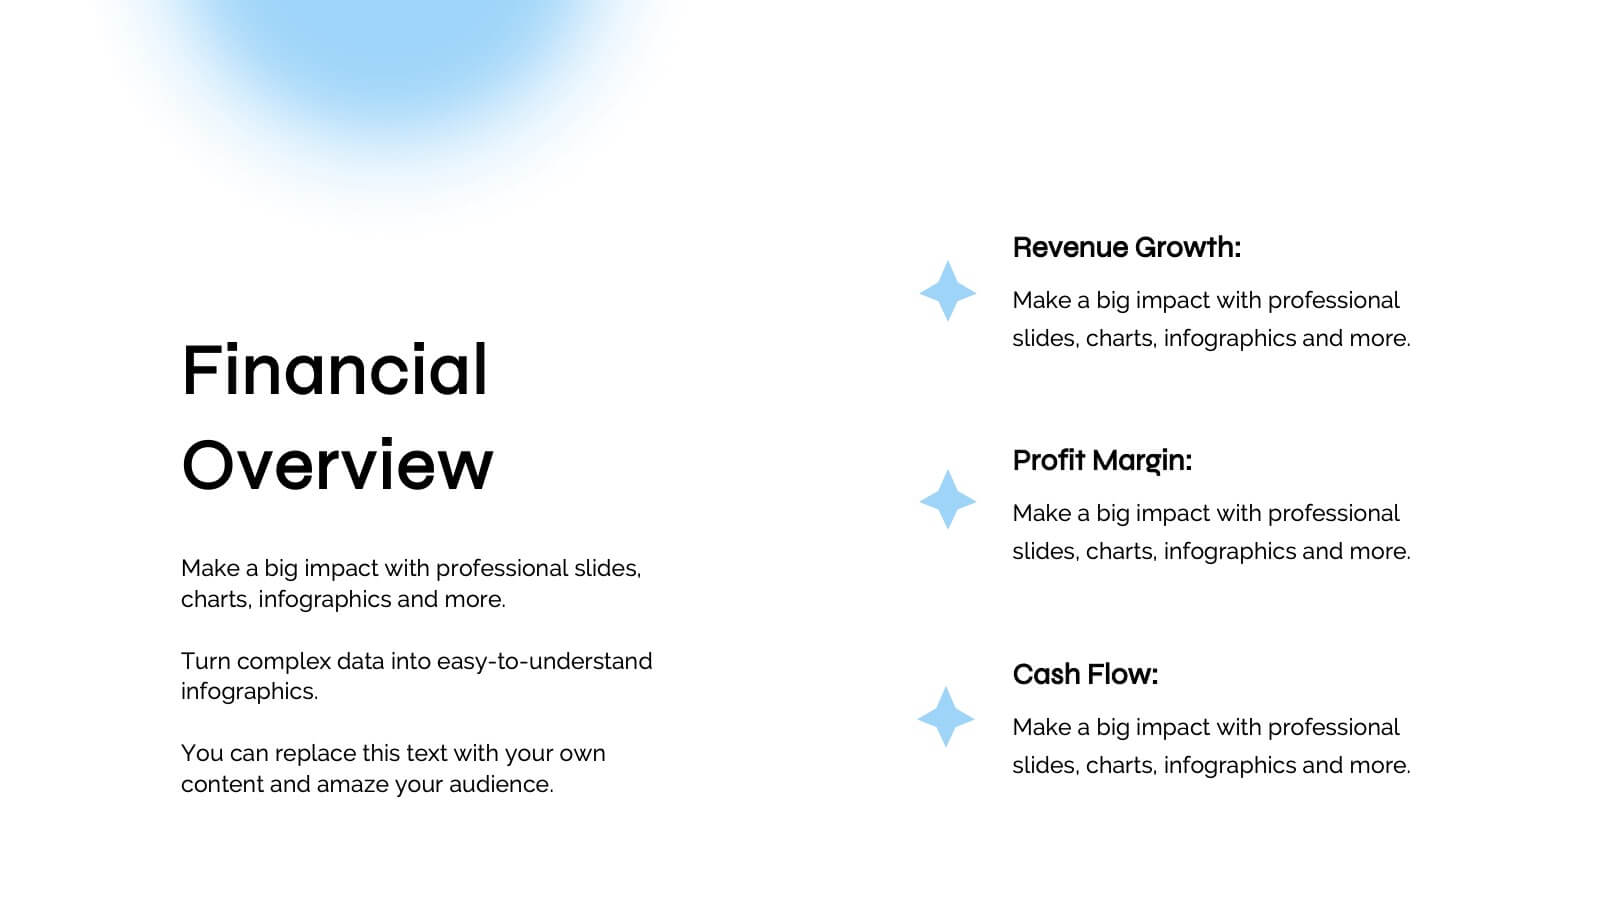
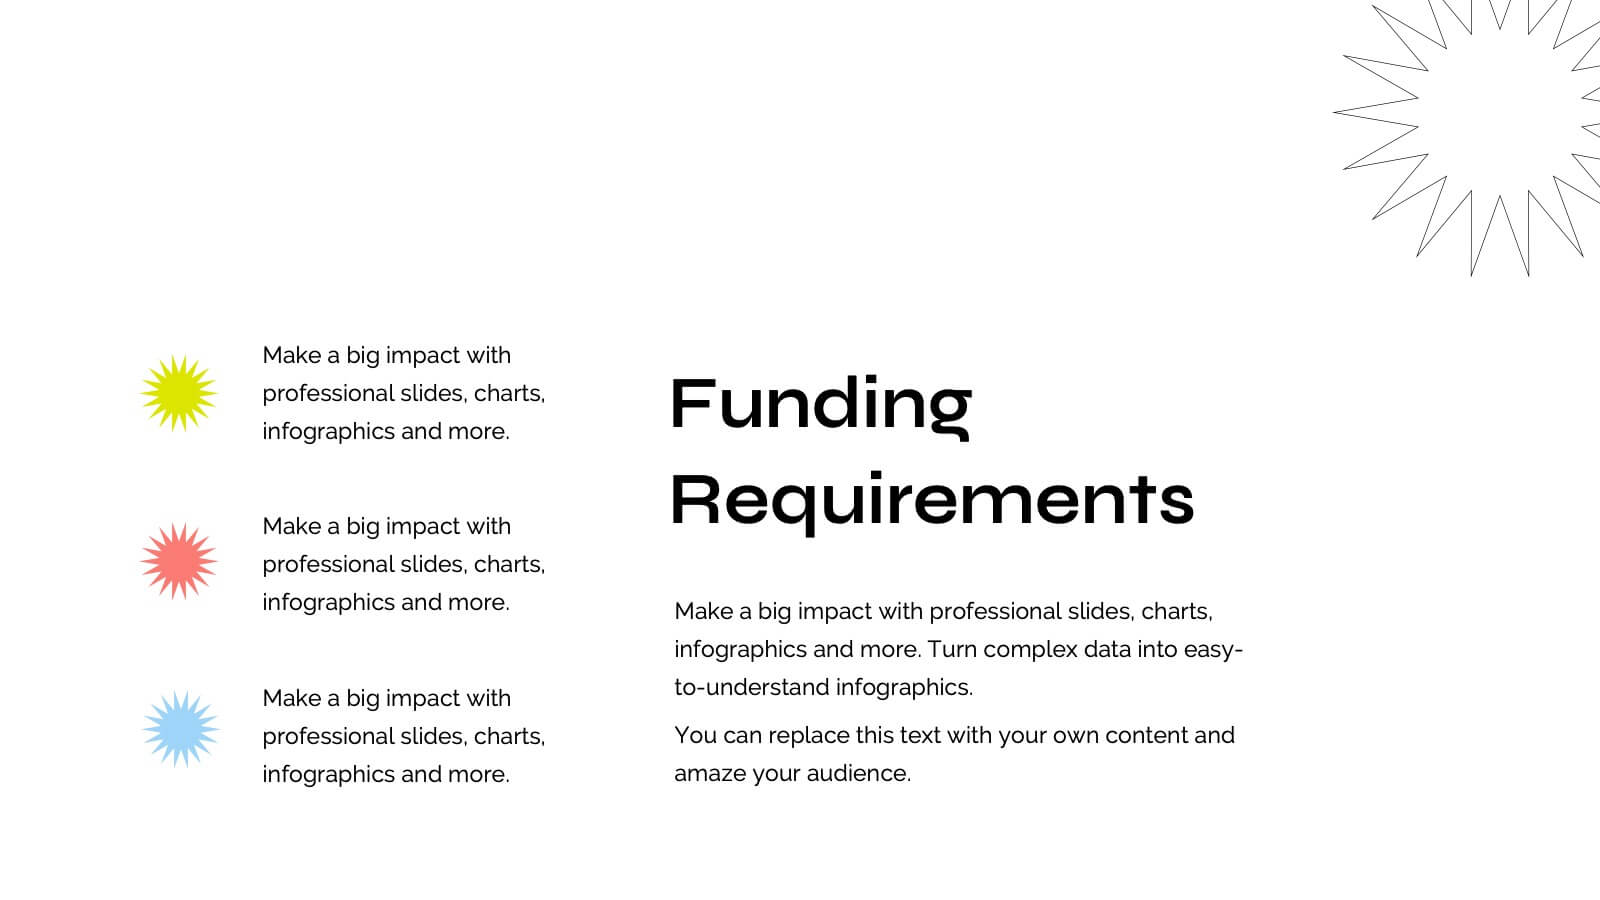
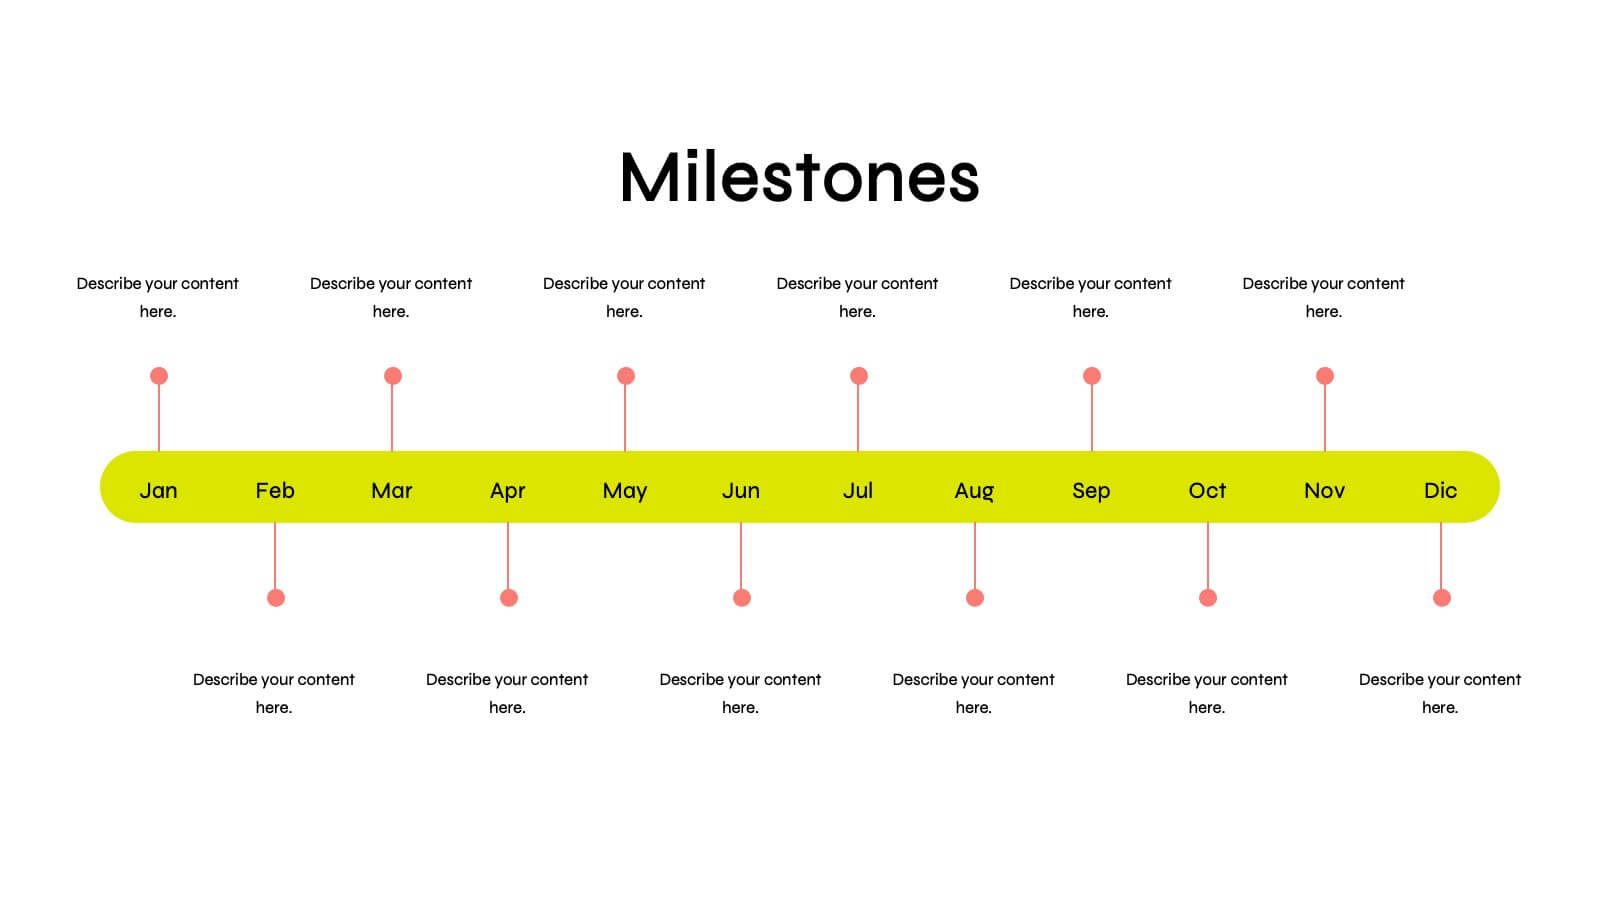
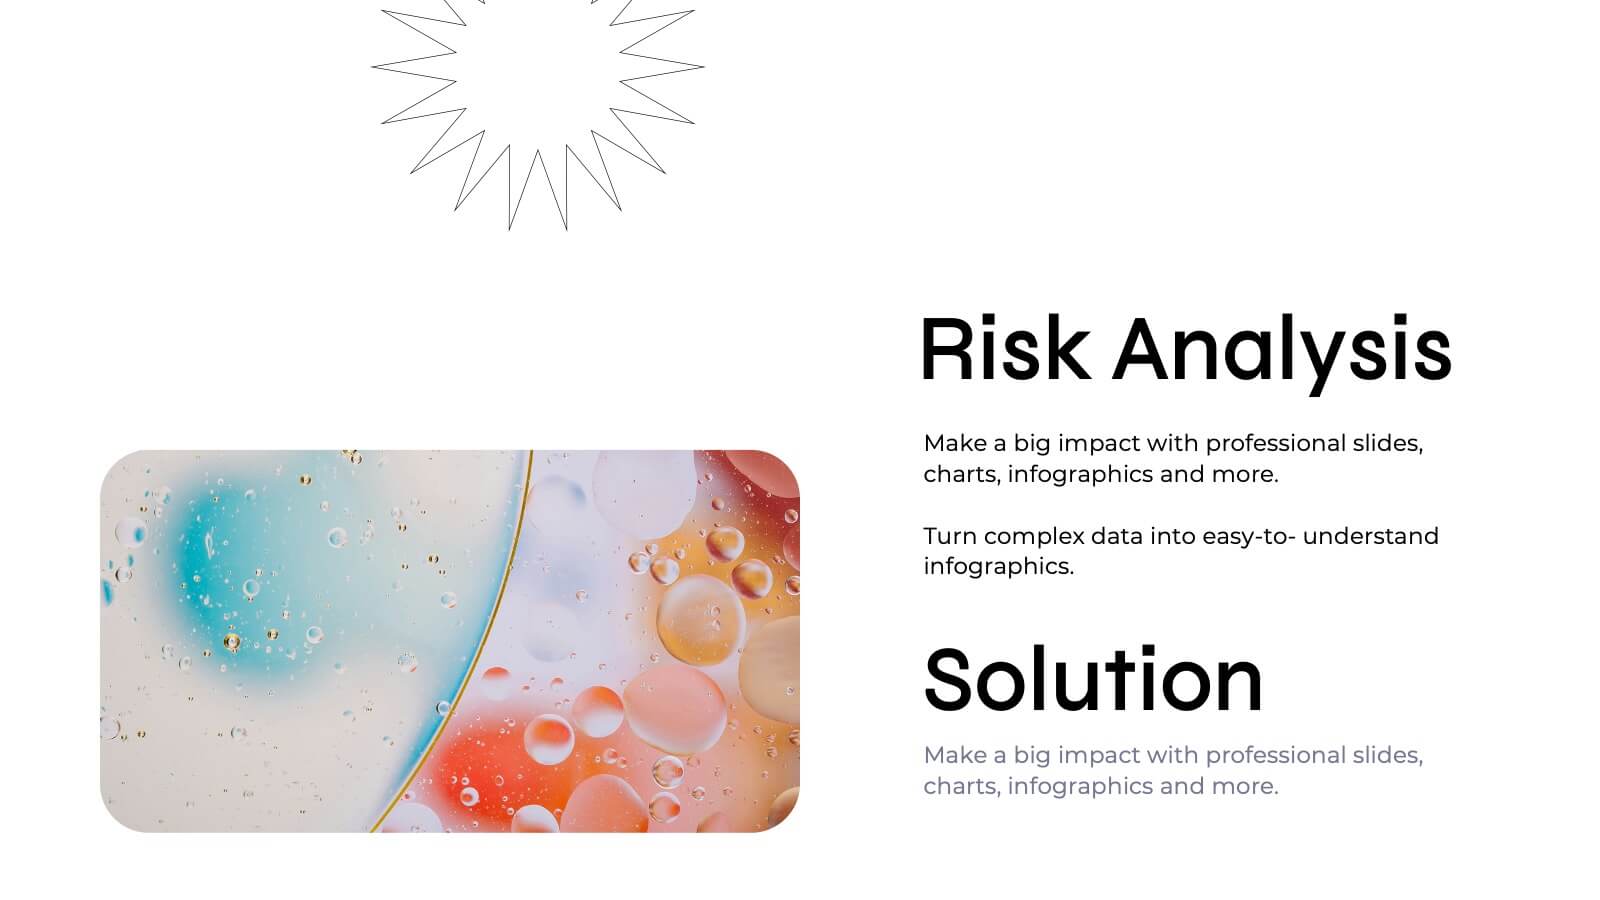
Quirinus Investor Pitch Presentation
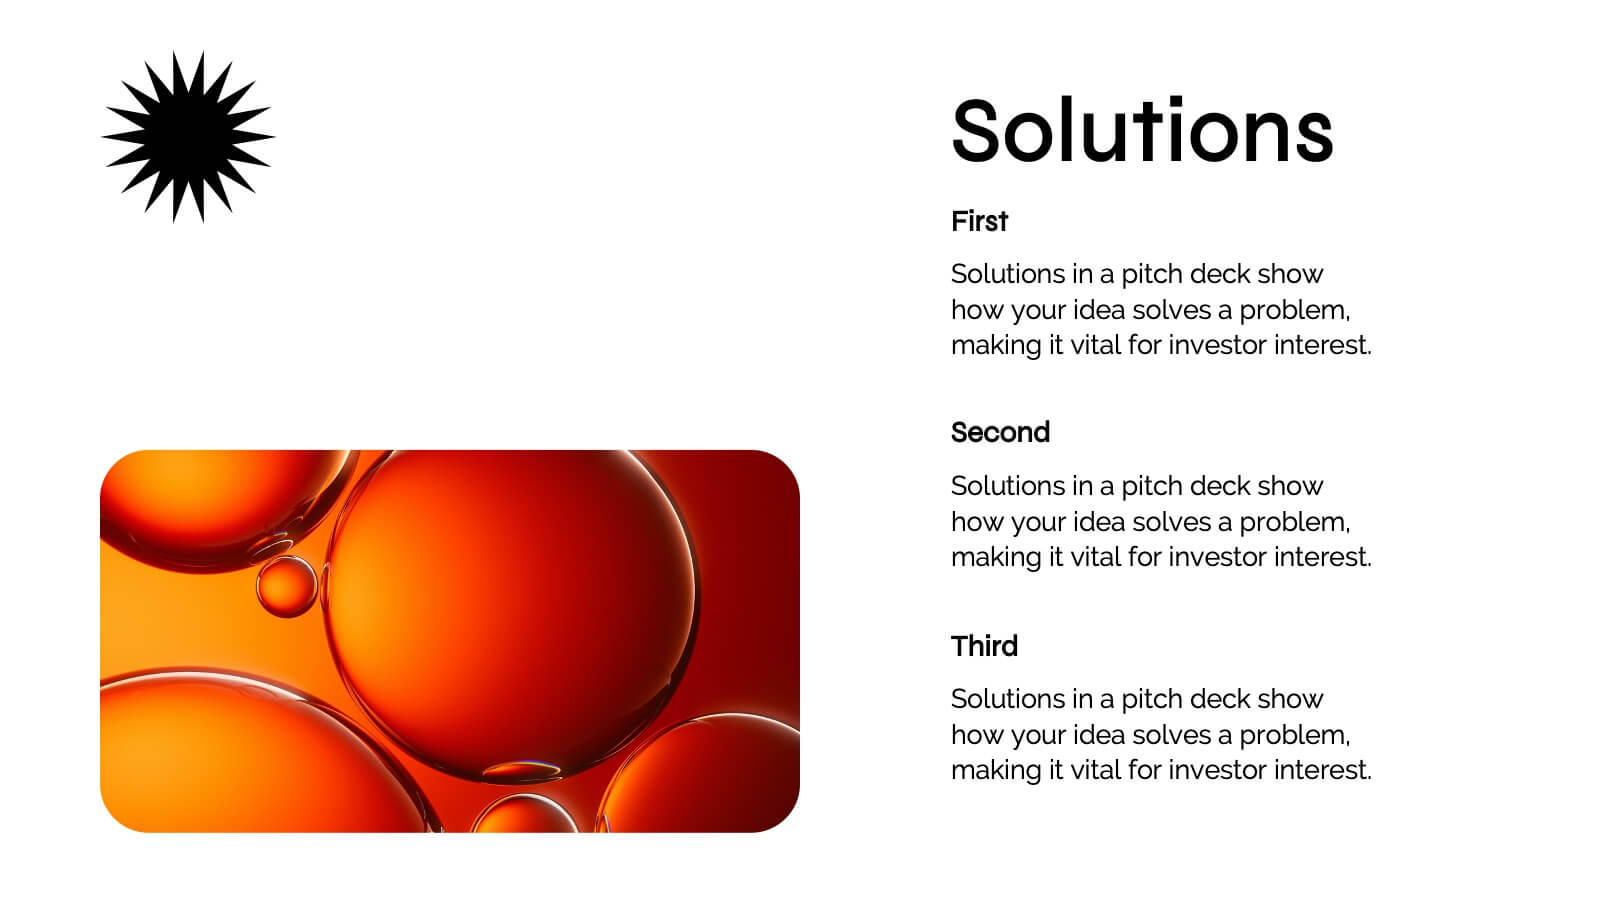
Ready to impress investors and stakeholders? This sleek and modern pitch deck template covers all the essentials, from problem statements and market opportunities to revenue models and growth projections. Each slide is designed to convey clear and compelling information for maximum impact. Fully compatible with PowerPoint, Keynote, and Google Slides, making it the perfect tool for your next product launch!


6 diapositivas
Strategy for Effective Solutions Presentation
Unlock strategic clarity with the Strategy for Effective Solutions template, which effectively organizes complex strategies into six interconnected segments, ideal for sequentially showcasing business insights. Its clear, systematic design supports concise communication and is compatible with PowerPoint, Keynote, and Google Slides, making it a versatile tool for professional presentations.


21 diapositivas
Flamelore Agile Project Plan Presentation
Organize and deliver your Agile Project Plan seamlessly with this dynamic presentation template. Designed to align with Agile principles, it features a comprehensive structure covering objectives, scope of work, and key deliverables. The template helps you outline a detailed project timeline and budget breakdown to keep stakeholders informed. Illustrate complex information with visual aids such as pyramids, charts, and process diagrams, making data interpretation effortless. Highlight team members, their roles, and responsibilities to foster transparency and accountability. With slides dedicated to risk assessment and evaluation criteria, you can confidently navigate potential challenges. This fully editable template works across PowerPoint, Google Slides, and Keynote, providing flexibility and a polished design for project managers, teams, and business professionals. Whether you're pitching to stakeholders or aligning your team, this Agile framework ensures clear communication and actionable steps.


4 diapositivas
HR Management Strategy Presentation
An engaging, structured design that turns complex planning into a clear, visual story. This presentation guides audiences through essential strategic steps, helping teams understand goals, processes, and people-centered initiatives with ease. Clean icons and modern layouts keep every point focused and professional. Fully compatible with PowerPoint, Keynote, and Google Slides.