


Características


¿Tienes alguna pregunta?
Recomendar


8 diapositivas
Company Vision and Strategic Direction Presentation
Present your company’s long-term goals with clarity using the Company Vision and Strategic Direction Presentation. This clean, icon-led layout helps communicate your vision, focus areas, and roadmap in a linear, easy-to-follow format. Ideal for executive updates, investor decks, or team briefings. Compatible with PowerPoint, Canva, and Google Slides.


4 diapositivas
Emerging AI Applications in Business
Showcase innovation with clarity using the Emerging AI Applications in Business Presentation. This sleek 4-step layout features modern icons and a profile-style AI illustration, perfect for outlining use cases such as automation, data insights, machine learning, or cloud-based AI solutions. Ideal for tech-driven strategy decks, startup pitches, or digital transformation briefings. Fully editable in PowerPoint, Keynote, and Google Slides.


7 diapositivas
Design Mockup Infographic
Present your creative projects with precision and style using this collection of design mockup templates. Each template is expertly crafted to showcase your graphic designs, digital art, or branding projects across multiple devices and settings, emphasizing both detail and context. Featuring sleek, modern layouts, these mockups integrate vibrant color schemes and dynamic typography to make your designs pop. Ideal for graphic designers, marketers, and creative agencies, these templates provide a professional setting for presenting web designs, app interfaces, and other digital products to clients and stakeholders. Customize these templates with ease, adding your own images and text to tailor the mockups to your specific project needs. Whether you're creating a portfolio, client presentation, or marketing materials, these mockups will help you display your work in the most effective and engaging way.


6 diapositivas
Informational Data Table Overview Presentation
Present your tasks with clarity using this Informational Data Table Overview presentation. Perfect for team planning, status updates, or project management, this slide helps you organize tasks by name, due date, priority, and assignment. Visual indicators make it easy to track progress at a glance. Fully editable in PowerPoint, Canva, and Google Slides.


6 diapositivas
Project Milestone Progress Presentation
Track project progress effortlessly with this Project Milestone Progress template. This structured, color-coded milestone tracker is perfect for monitoring timelines, identifying key deliverables, and keeping stakeholders informed. Fully editable—adjust dates, tasks, and colors to match your project requirements. Compatible with PowerPoint, Keynote, and Google Slides, ensuring seamless integration into your workflow.


5 diapositivas
Business Planning and Execution Presentation
Align your business objectives and execution plan with this modern, arrow-themed presentation slide. Featuring four sequential sections with bold icons and customizable titles, this layout is perfect for showcasing milestones, KPIs, or phases of a strategic process. Designed for clarity and impact, it's compatible with PowerPoint, Keynote, and Google Slides.


6 diapositivas
User Satisfaction Scoring System
Showcase user feedback with this vibrant User Satisfaction Scoring System Presentation. Featuring a semi-circle scale with expressive icons, it's perfect for visualizing survey results or customer experience insights. Fully editable in PowerPoint, Keynote, and Google Slides, this slide helps simplify scoring metrics while keeping your presentation clear, engaging, and professional


21 diapositivas
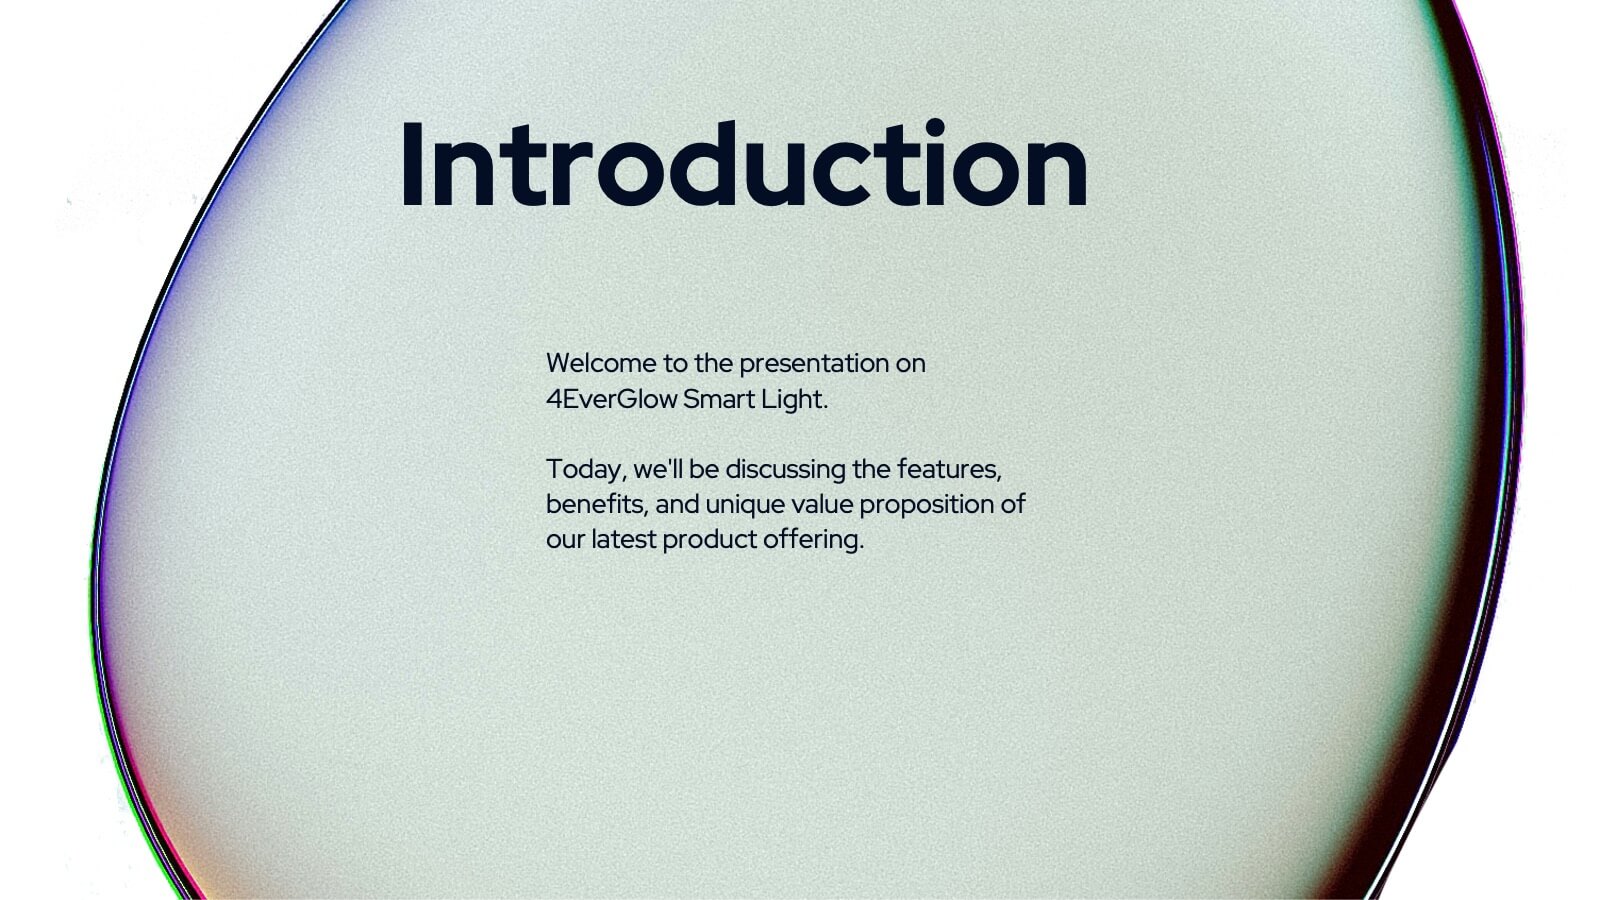
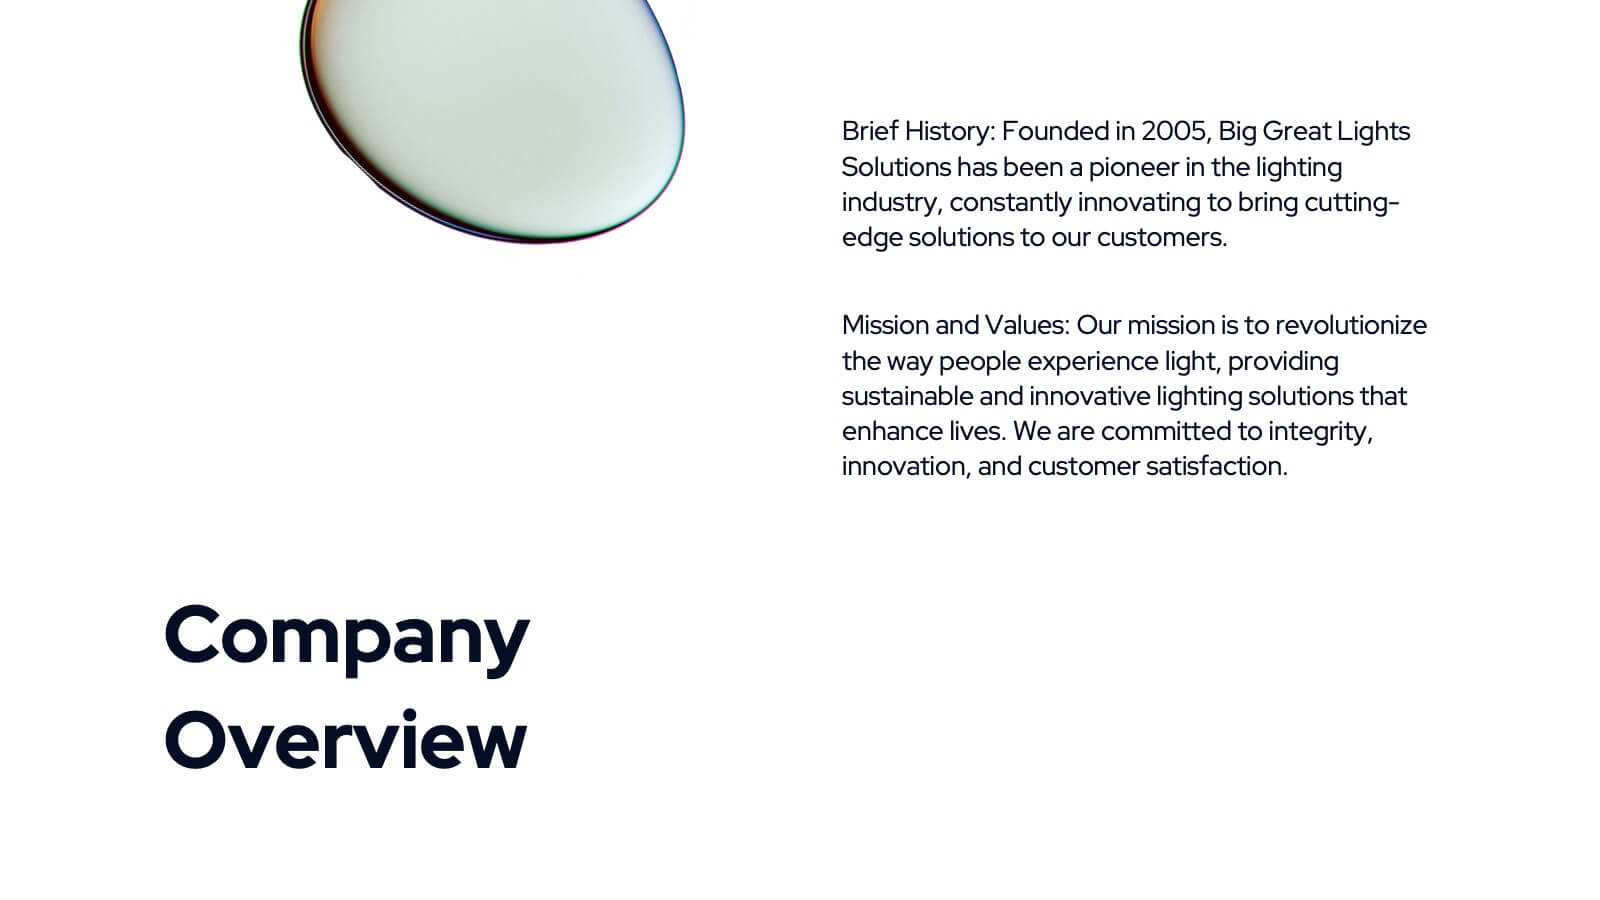
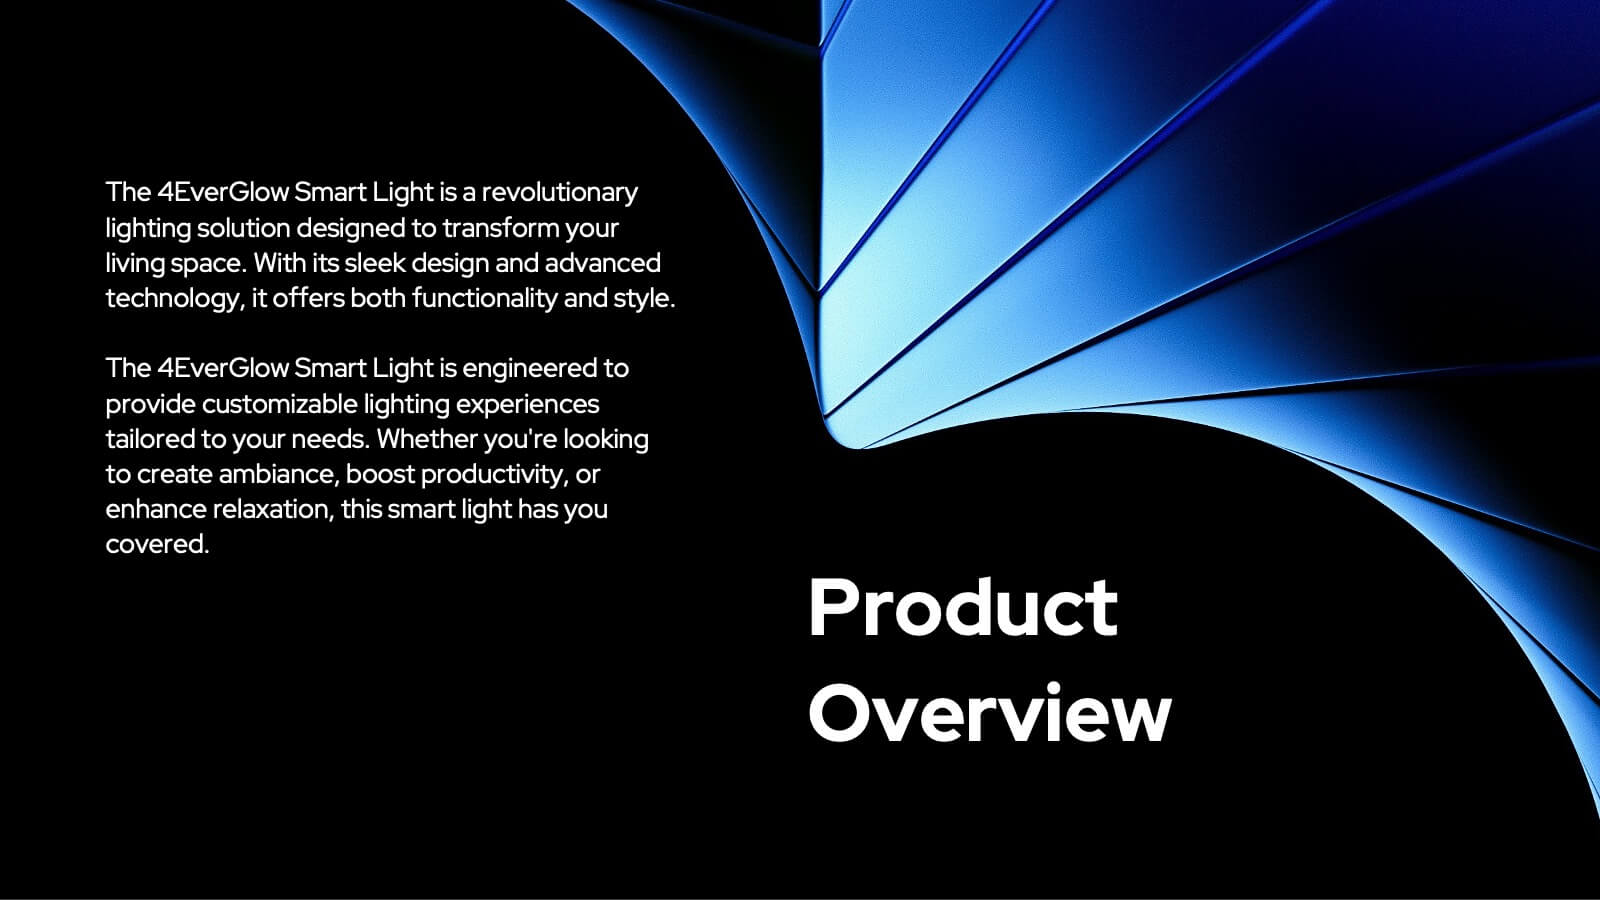
Selkie New Product Proposal Presentation
Dive into your next big idea with this sleek, Selkie-inspired presentation template, designed for presenting a new product proposal! Highlight key features, market opportunities, and potential growth in a visually captivating format that flows effortlessly. Engage your audience and make an impact. Compatible with PowerPoint, Keynote, and Google Slides for easy customization.


5 diapositivas
Marketing Funnel AIDA Breakdown
Visually map out your marketing strategy with the Marketing Funnel AIDA Breakdown Presentation. This template clearly illustrates the four essential stages—Attention, Interest, Desire, and Action—using a clean funnel design for easy audience understanding. Ideal for sales pitches, marketing plans, and campaign reports. Fully editable in PowerPoint, Keynote, and Google Slides.


7 diapositivas
Timeline Logistics Infographic
A timeline infographic is a visual representation of the history of your company, product or service. This infographic template is the perfect way to show off your knowledge of a subject while also making it easy for your audience to digest all the information you've presented on hand. This infographic can be used to show the growth of your business. It’s also a great way to show the growth of your career. This template is simple and easy to use, but it’s also very powerful. You can add any icons you want and customize any text on the infographic. Compatible with Powerpoint, Keynote, and Google Slides. This is perfect for any occasion!
22 diapositivas
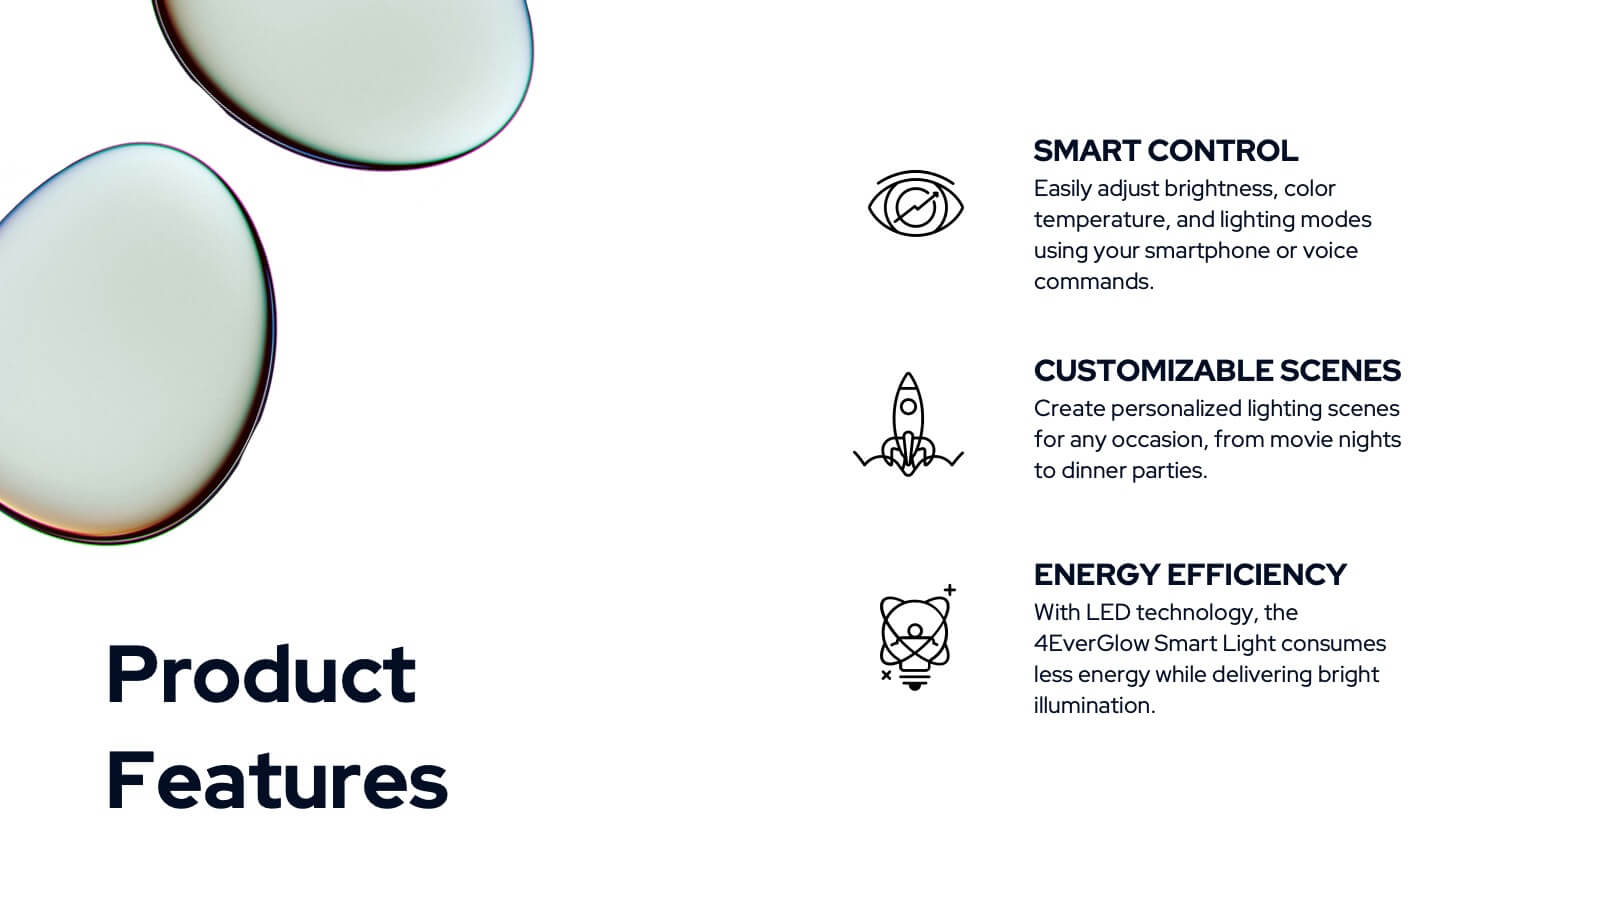
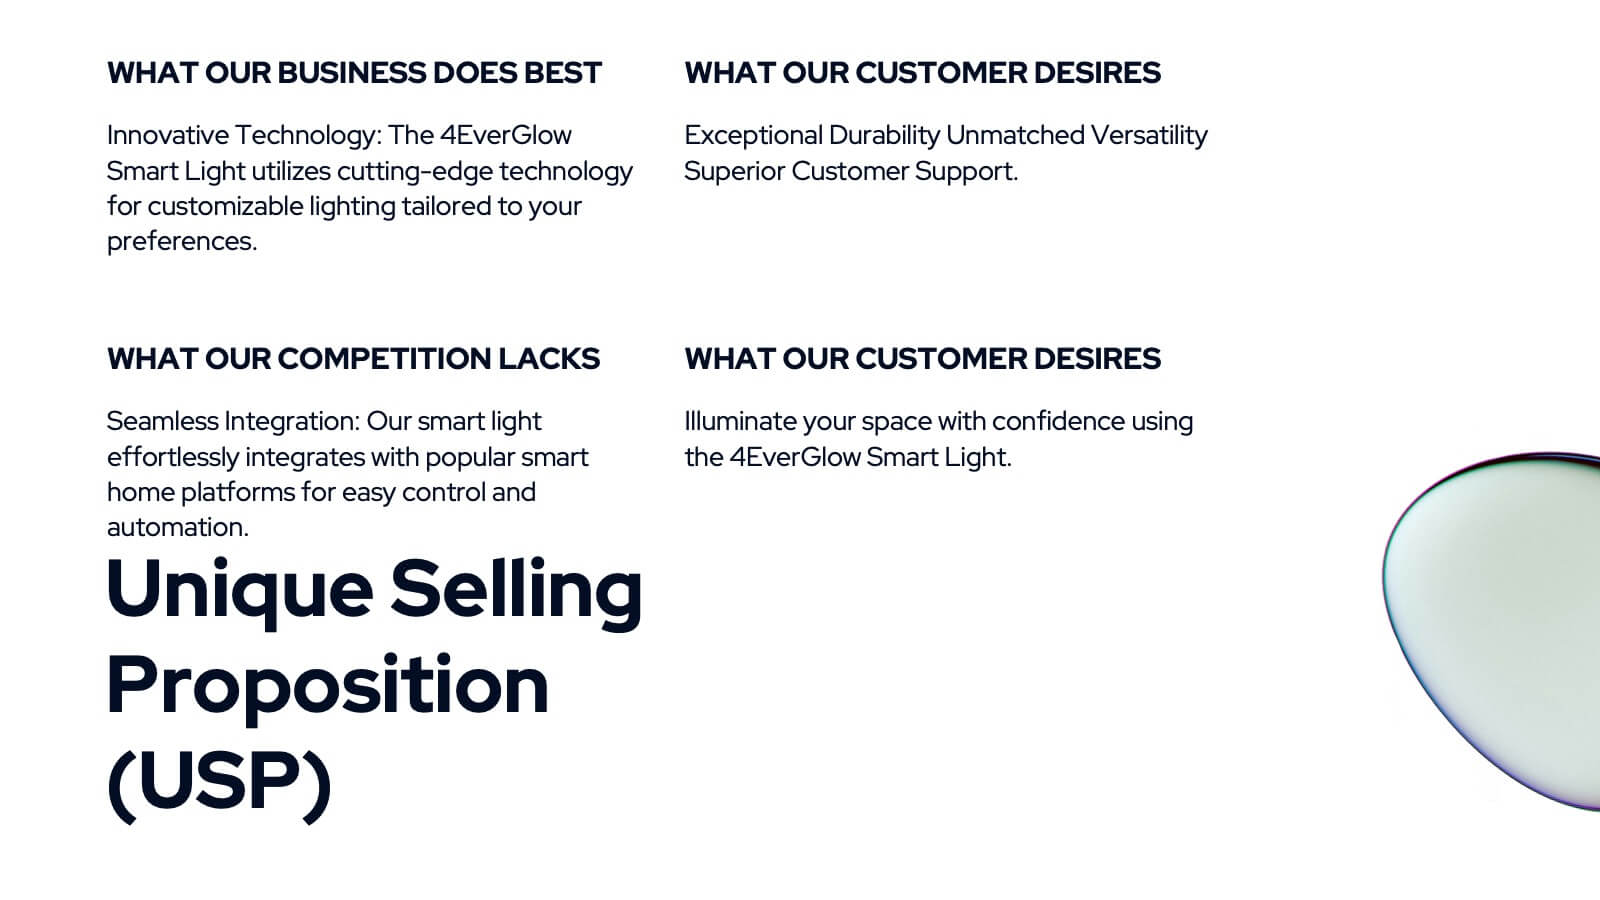
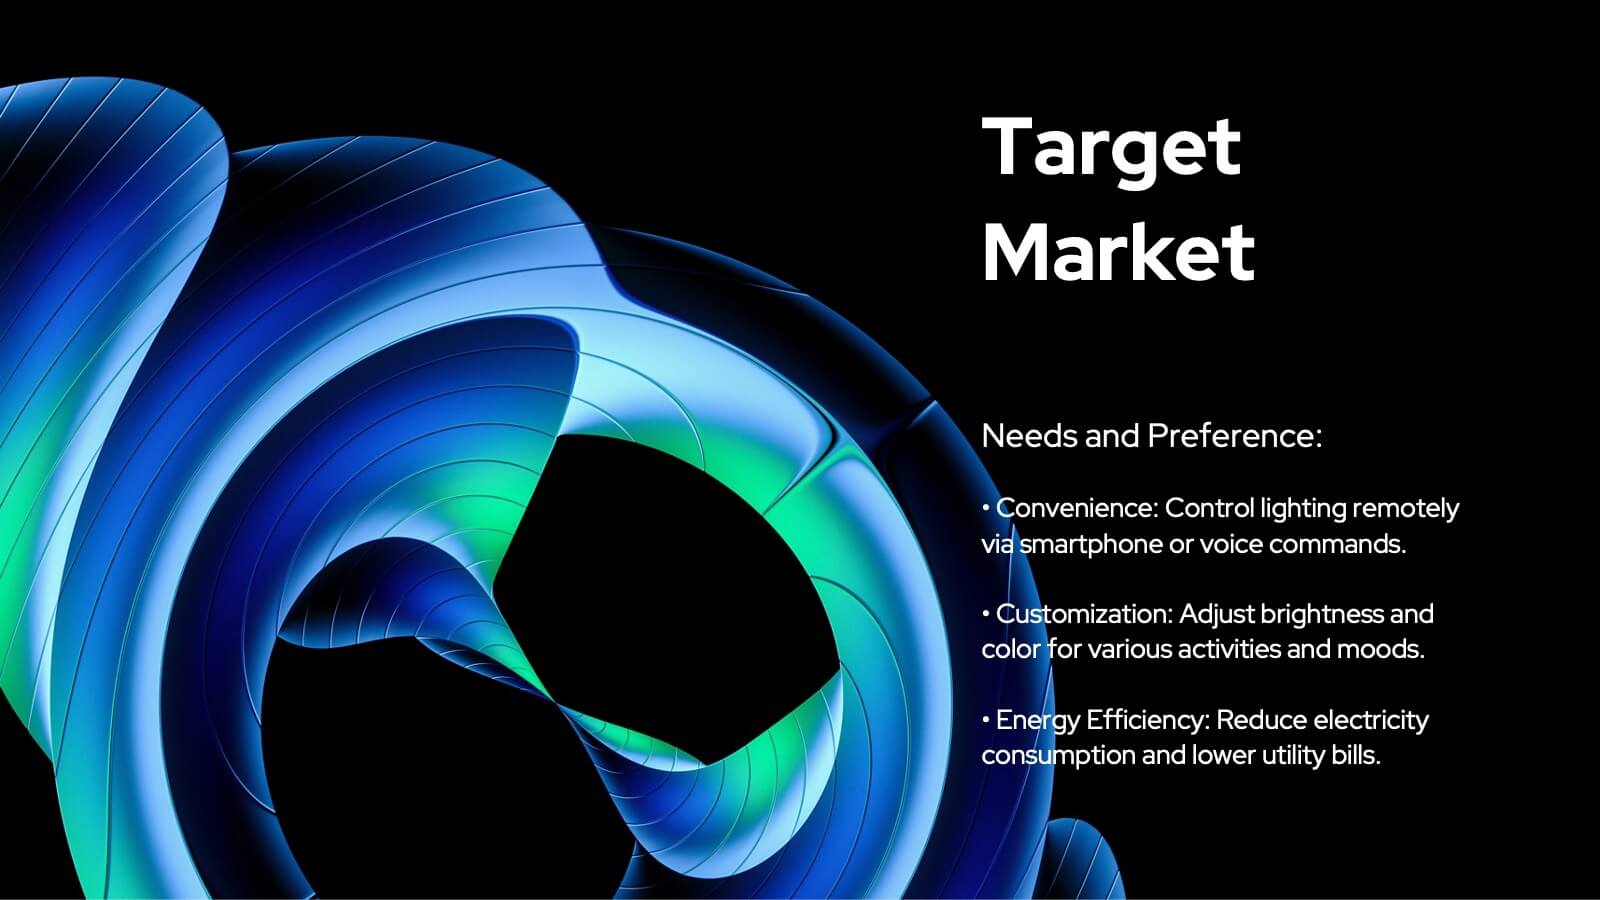
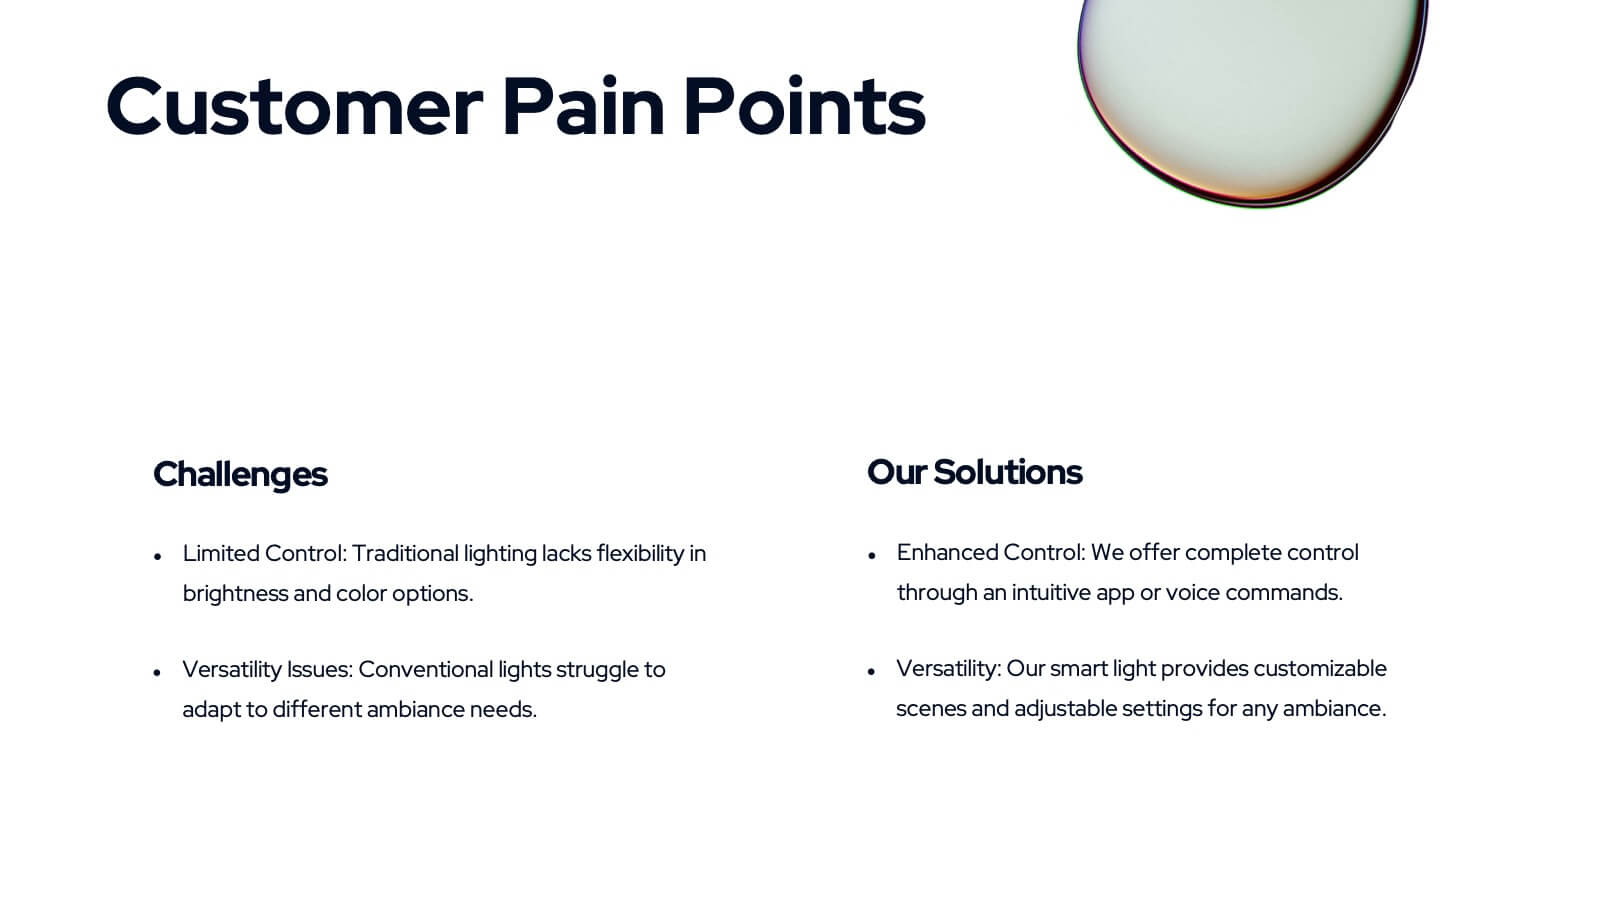
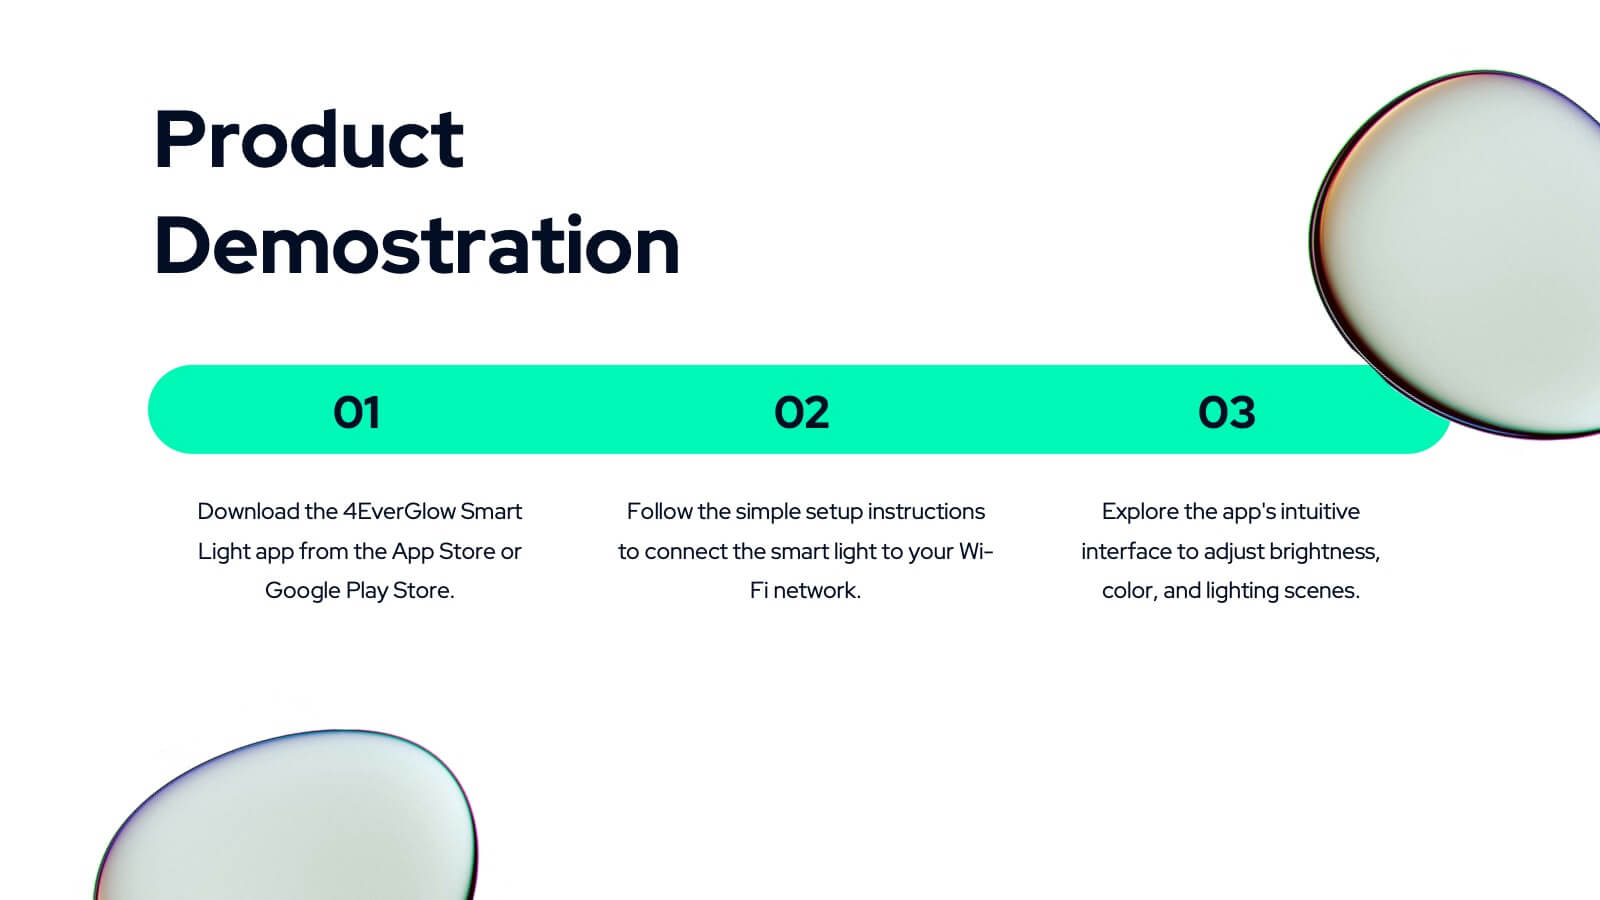
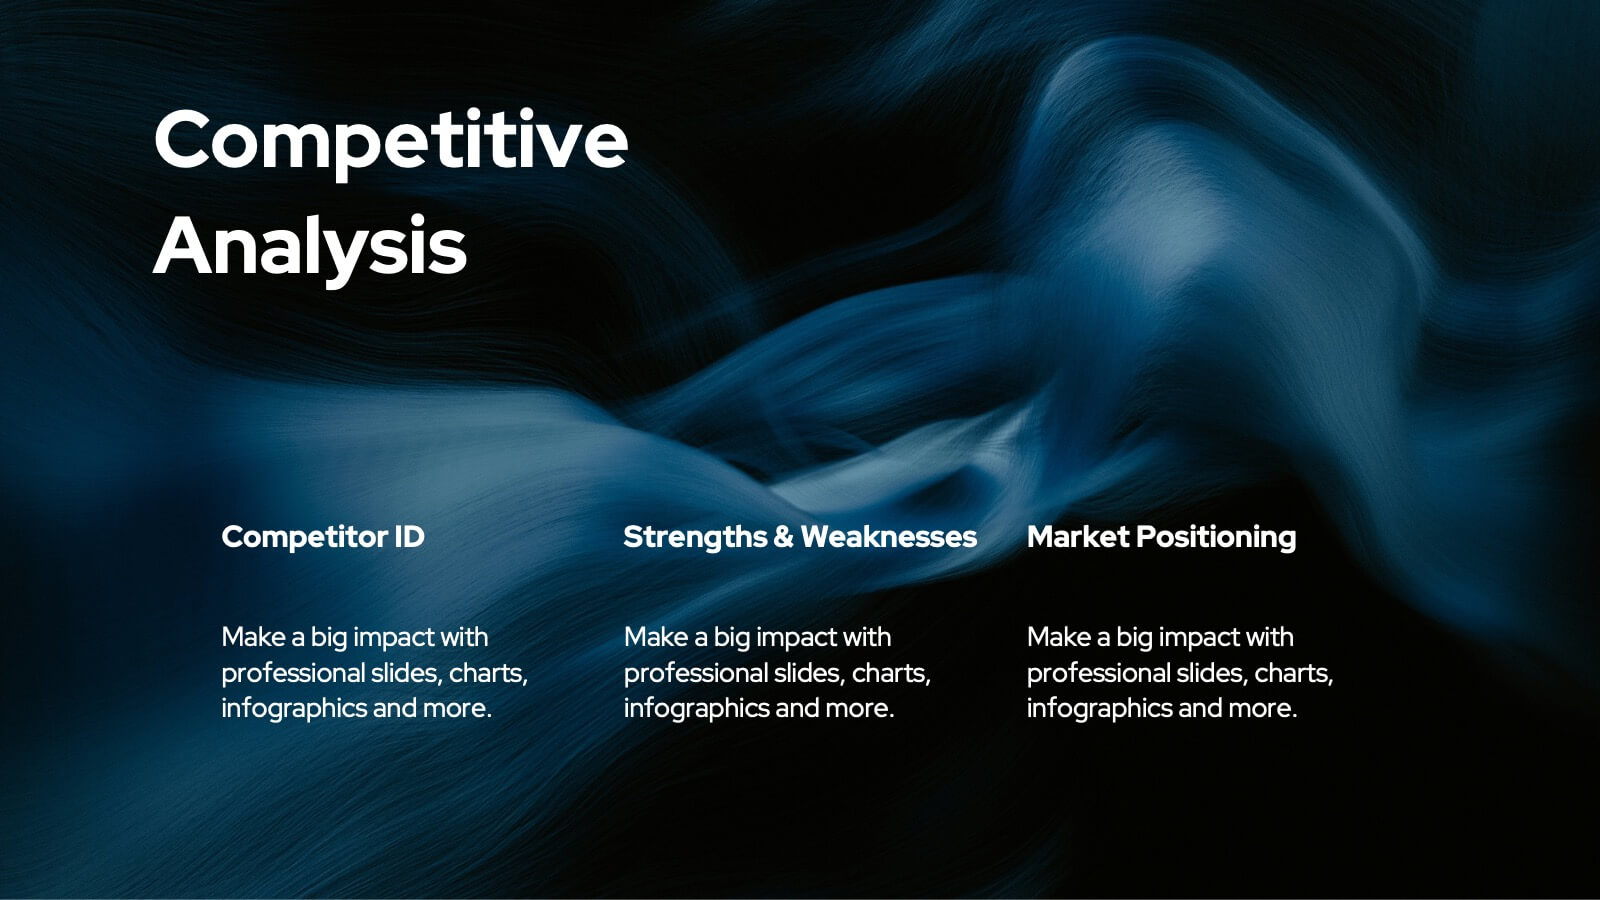
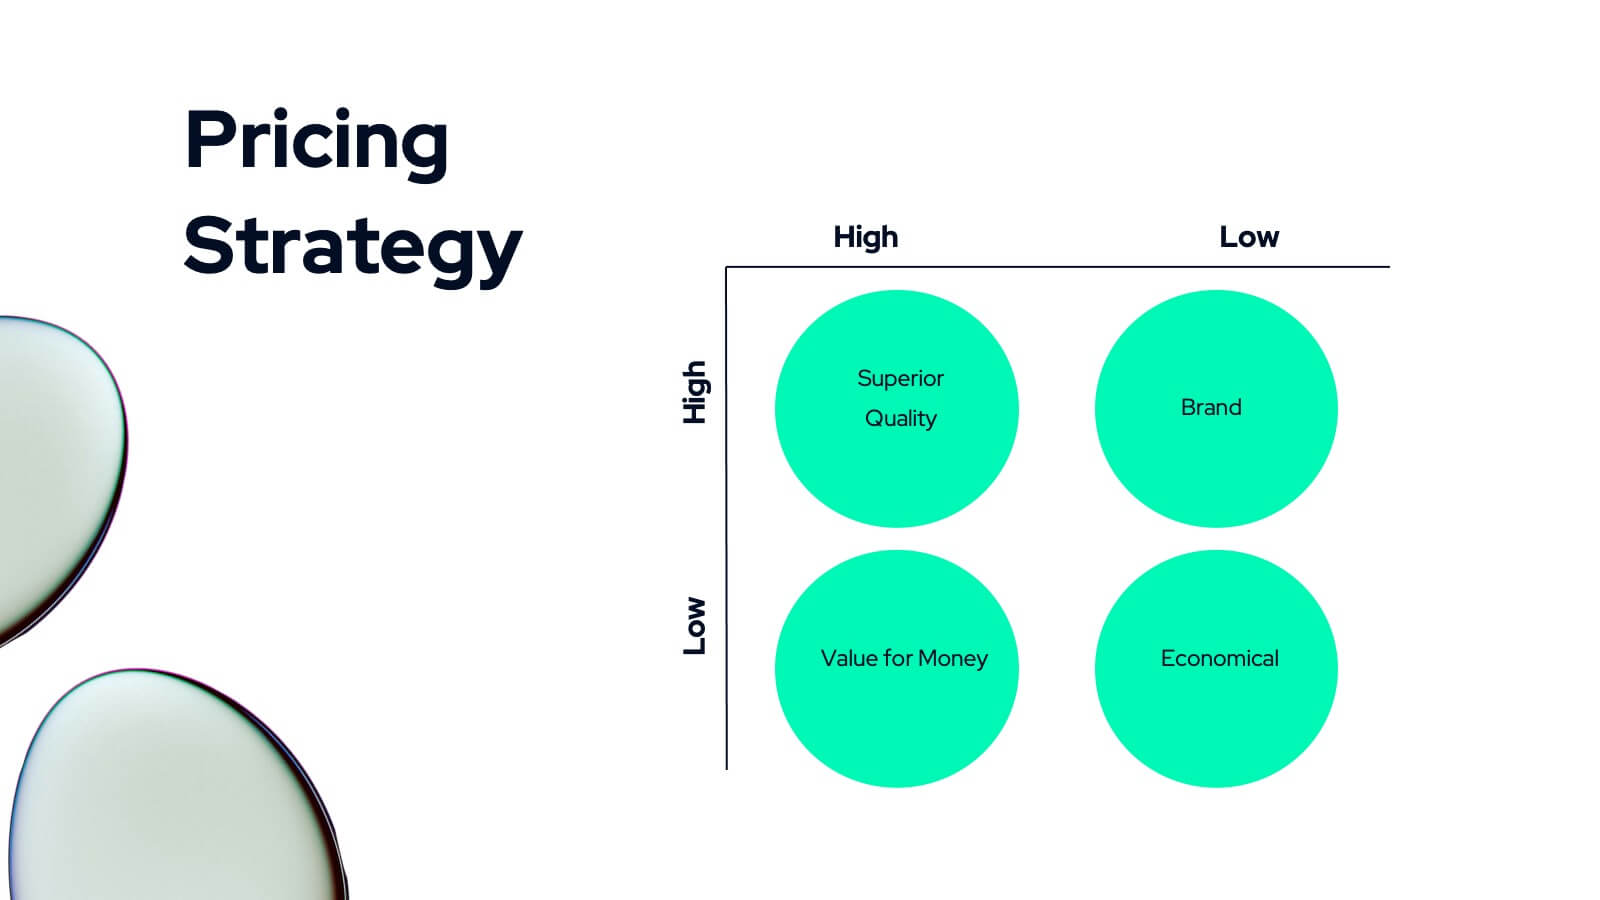
Beacon Product Development Plan Presentation
Develop your product strategy with this dynamic template! Perfect for highlighting company overview, product features, and market analysis. Showcase your target market, unique selling proposition, and competitive analysis with ease. Ideal for product demonstrations and sales strategy discussions. Compatible with PowerPoint, Keynote, and Google Slides. Impress your audience and elevate your product development presentations!


6 diapositivas
Product Comparison Table Presentation
Compare features, performance, or specifications at a glance with this Product Comparison Table Presentation. Featuring colorful bar charts and side-by-side metrics, this layout is perfect for showcasing multiple options clearly and professionally. Fully customizable in PowerPoint, Keynote, and Google Slides.


6 diapositivas
Legal Compliance and Business Law Presentation
The Legal Compliance and Business Law template elegantly demystifies the complexity of legal compliance, showcasing essential aspects like regulations, law, legal systems, rules, standards, and requirements in an interconnected format. Ideal for presentations that require clear and concise delivery of compliance strategies. This template is compatible with PowerPoint, Keynote, and Google Slides.


8 diapositivas
Benefits Table Template
Optimize your presentation of complex options with our "Benefits Table Template." Designed to clearly distinguish between different plans, this template enables you to showcase Plan A, Plan B, and Plan C with ease. Each column is distinctively colored and detailed to ensure your audience can grasp the variances in benefits at a glance. Ideal for comparing packages, costs, or strategic choices in a corporate setting, this template helps clarify decision-making processes. Compatible with PowerPoint, Keynote, and Google Slides, it is an invaluable tool for business analysts, sales teams, and marketers aiming to communicate effectively with their stakeholders.


7 diapositivas
Time Management Importance Infographic
Time management is a crucial skill that involves organizing and prioritizing tasks, activities, and responsibilities to make the most effective use of your time. Creating an infographic about the importance of time management is a valuable tool for conveying this critical skill visually and succinctly, let our template guide you. Customize the content, design, and visuals to create an engaging and informative infographic that effectively communicates the importance of time management. This presentation will inspire your audience to seize the day and make the most of their time!


5 diapositivas
Creative Watercolor Style Presentation
Splash your ideas onto the page with a layout that blends artistic watercolor accents and clean, modern structure. This presentation helps you showcase insights, steps, or concepts in a visually soothing format that feels both creative and professional. Ideal for storytelling or branding discussions. Fully compatible with PowerPoint, Keynote, and Google Slides.


7 diapositivas
Education Infographic Presentation Template
An education infographic is a visual representation of information related to education. It is used to present information in a clear, concise and easy-to-understand manner. It can be used to show statistics, facts, or data on a variety of educational topics such as student enrollment, graduation rates, test scores, and more. This template has bright and colorful photo designs that make it fun to use and easy to read. You can add your own pictures and customize the colors to make it look just the way you want. This template has many charts and graphs you can use to show all kinds of information.