


Características


¿Tienes alguna pregunta?
Recomendar


6 diapositivas
Three-Part Comparative Venn Layout Presentation
Showcase relationships, overlaps, and distinctions across three core elements with this elegant petal-style Venn layout. Perfect for comparing strategies, audiences, or product features. Each section includes customizable labels and icons. Fully editable in PowerPoint, Keynote, and Google Slides—ideal for business analysis, educational presentations, and marketing plans.


4 diapositivas
Environmental Sustainability Presentation
Showcase sustainable strategies with this triangle-style infographic focused on Environmental Sustainability. Perfect for illustrating the relationship between ecological, economic, and social pillars. The arrow-based design emphasizes continuity and impact. Fully customizable and ideal for PowerPoint, Keynote, and Google Slides presentations.


20 diapositivas
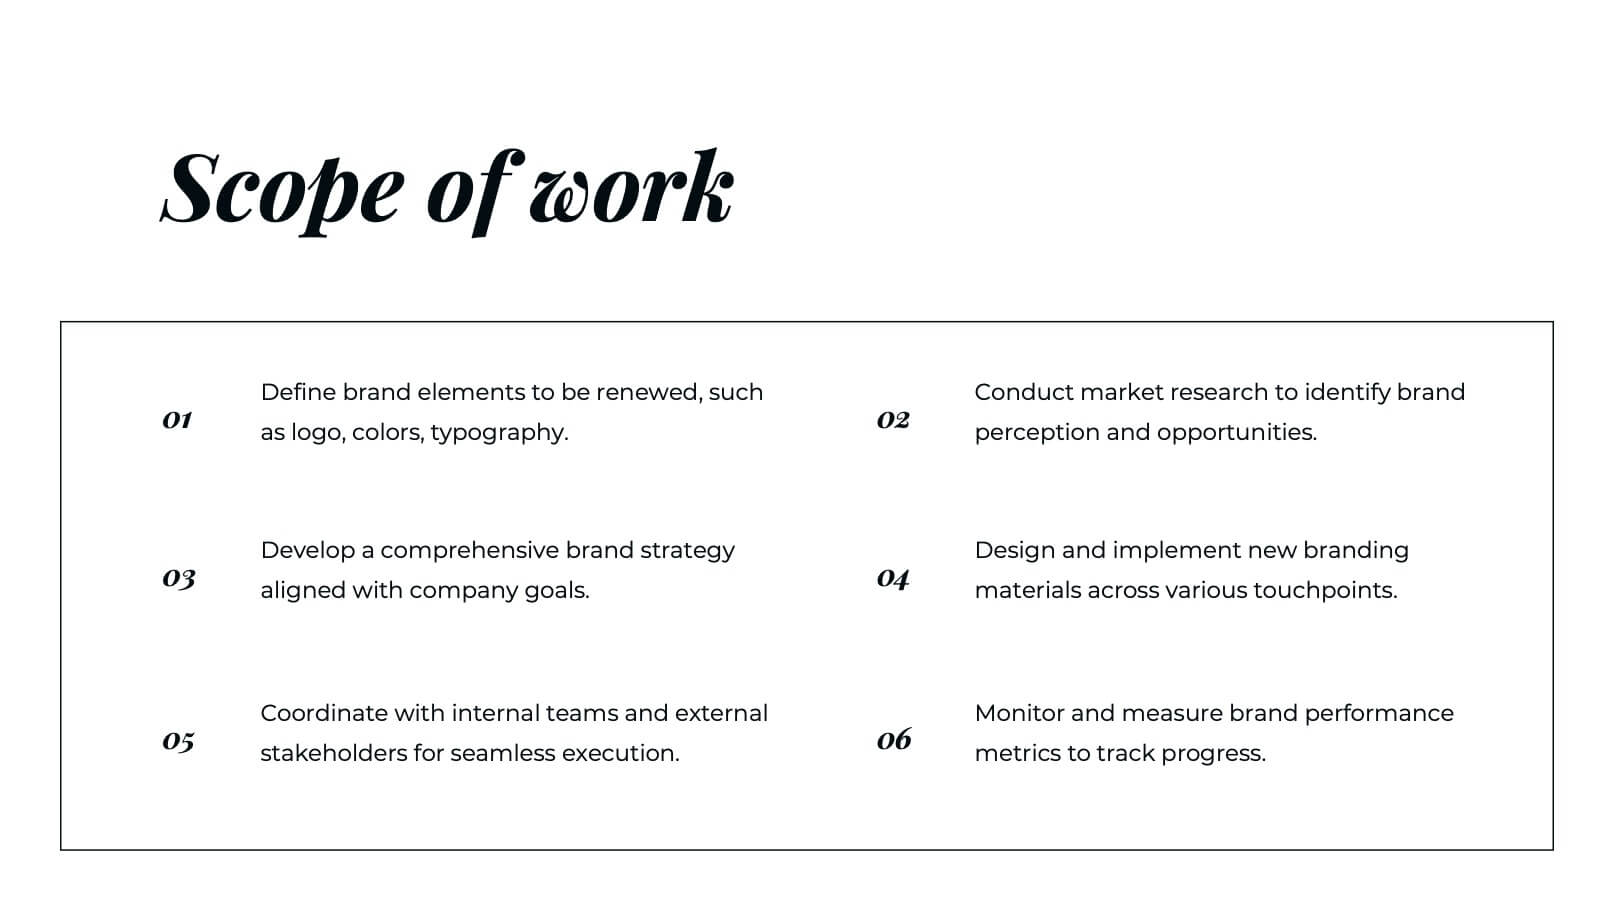
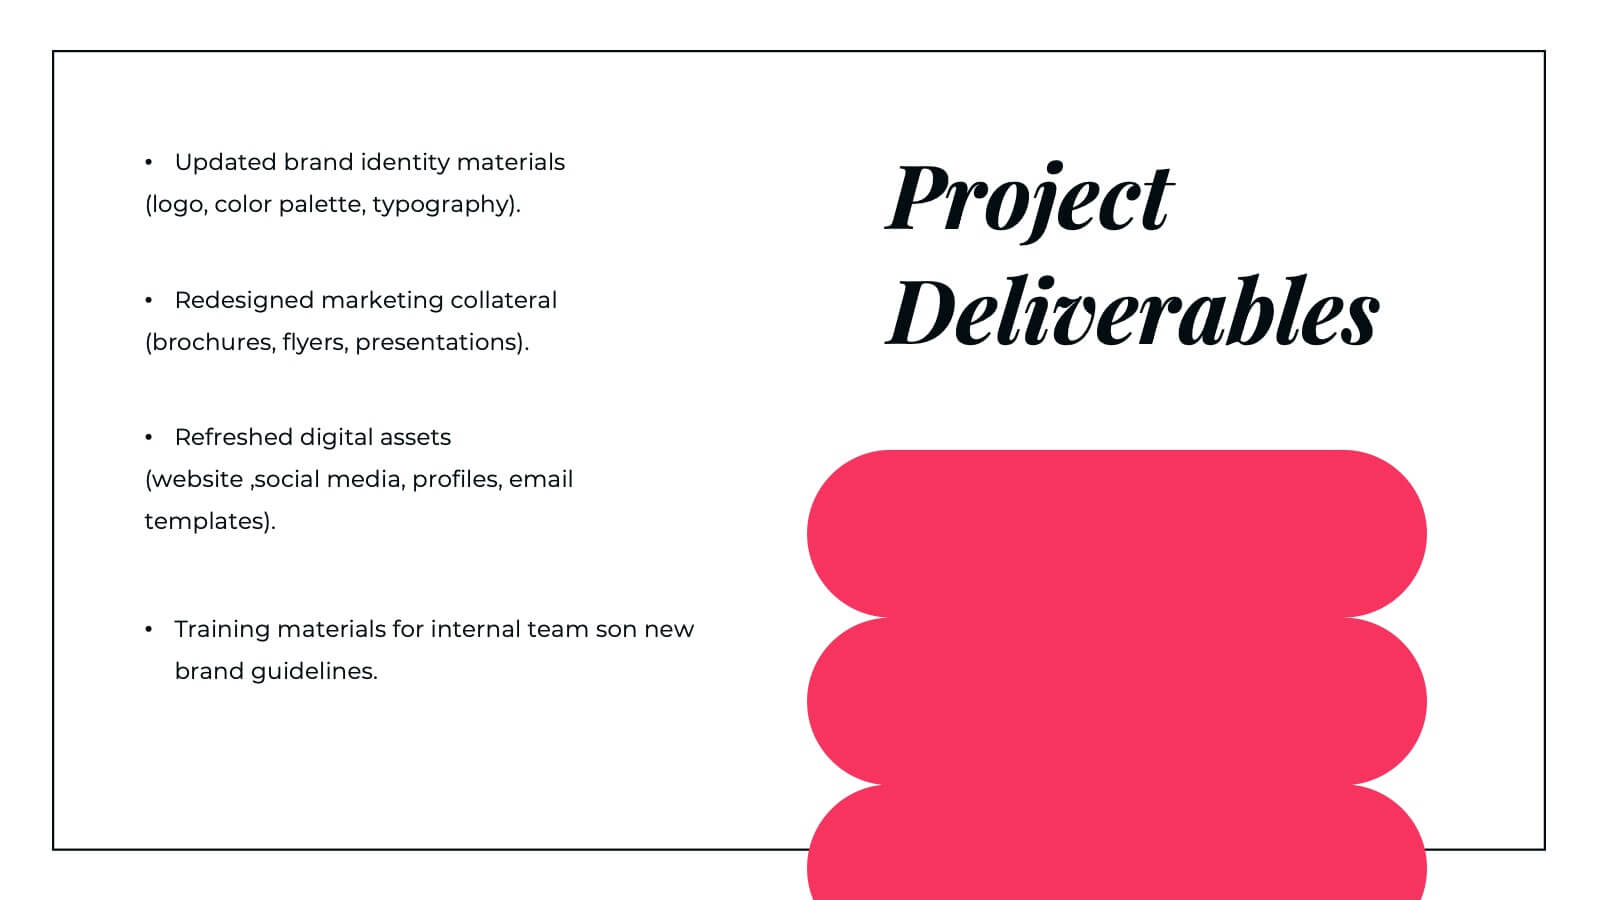
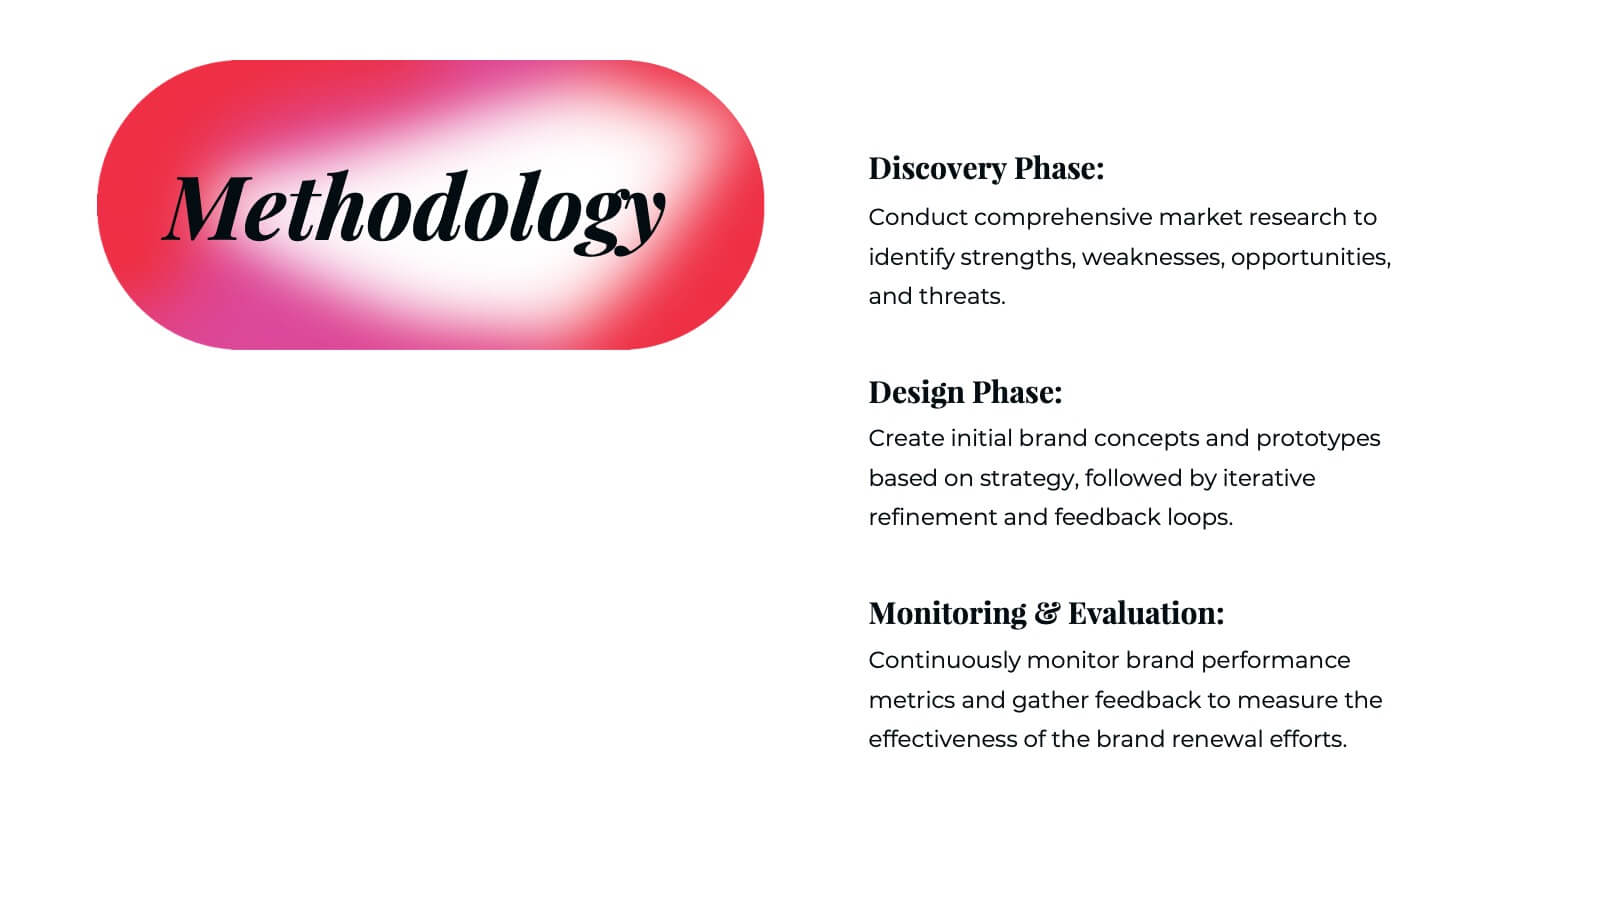
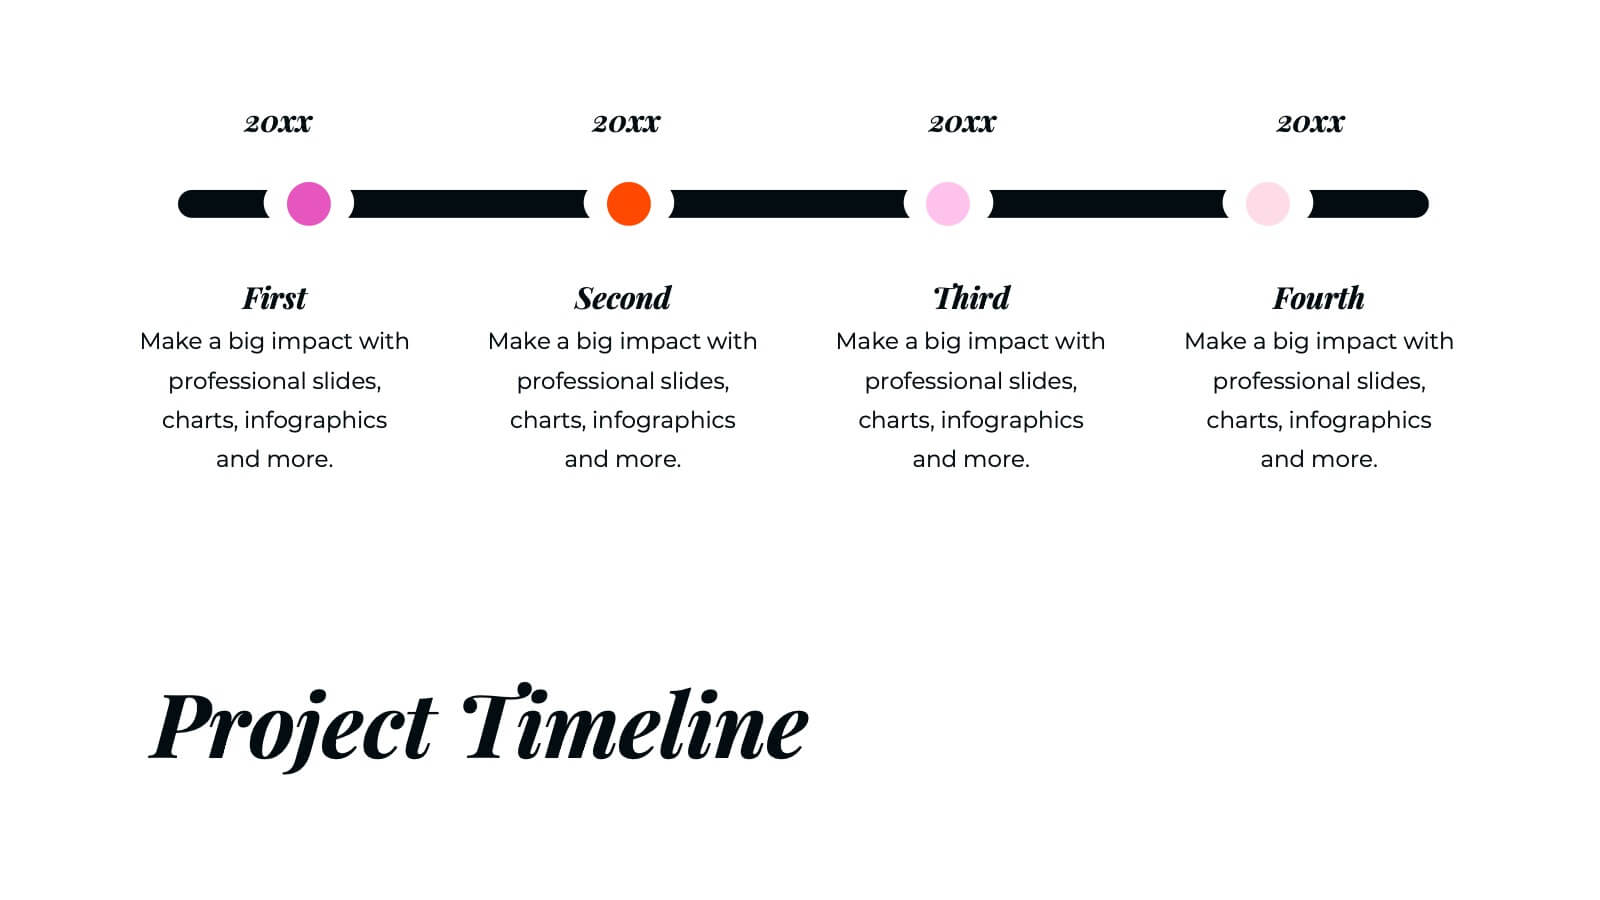
Waterfall Project Proposal Presentation
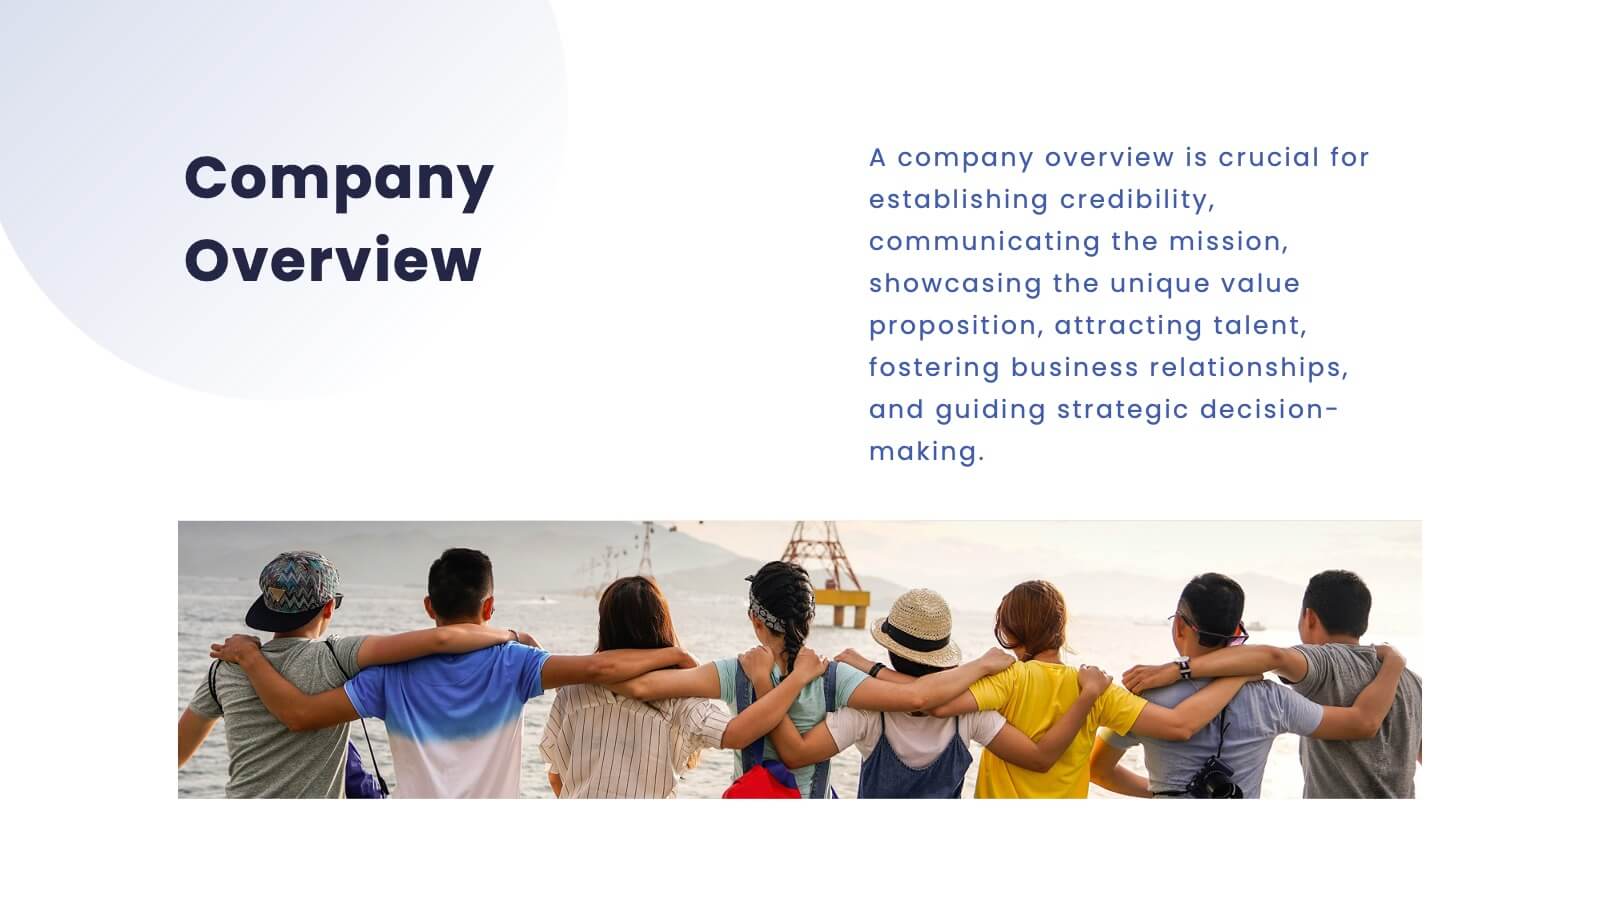
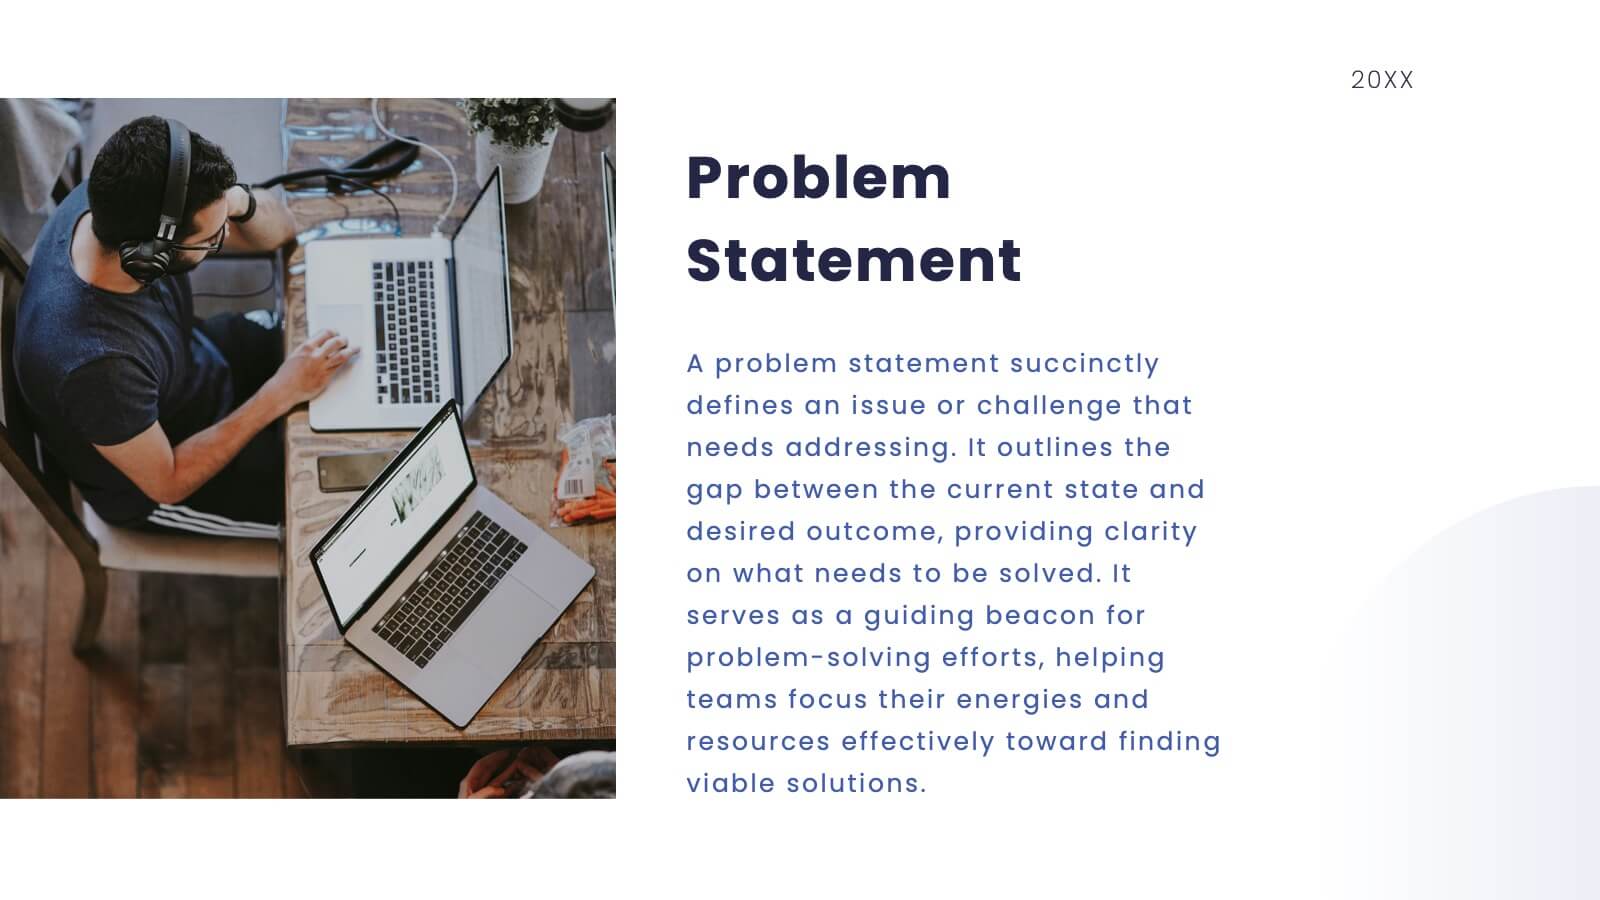
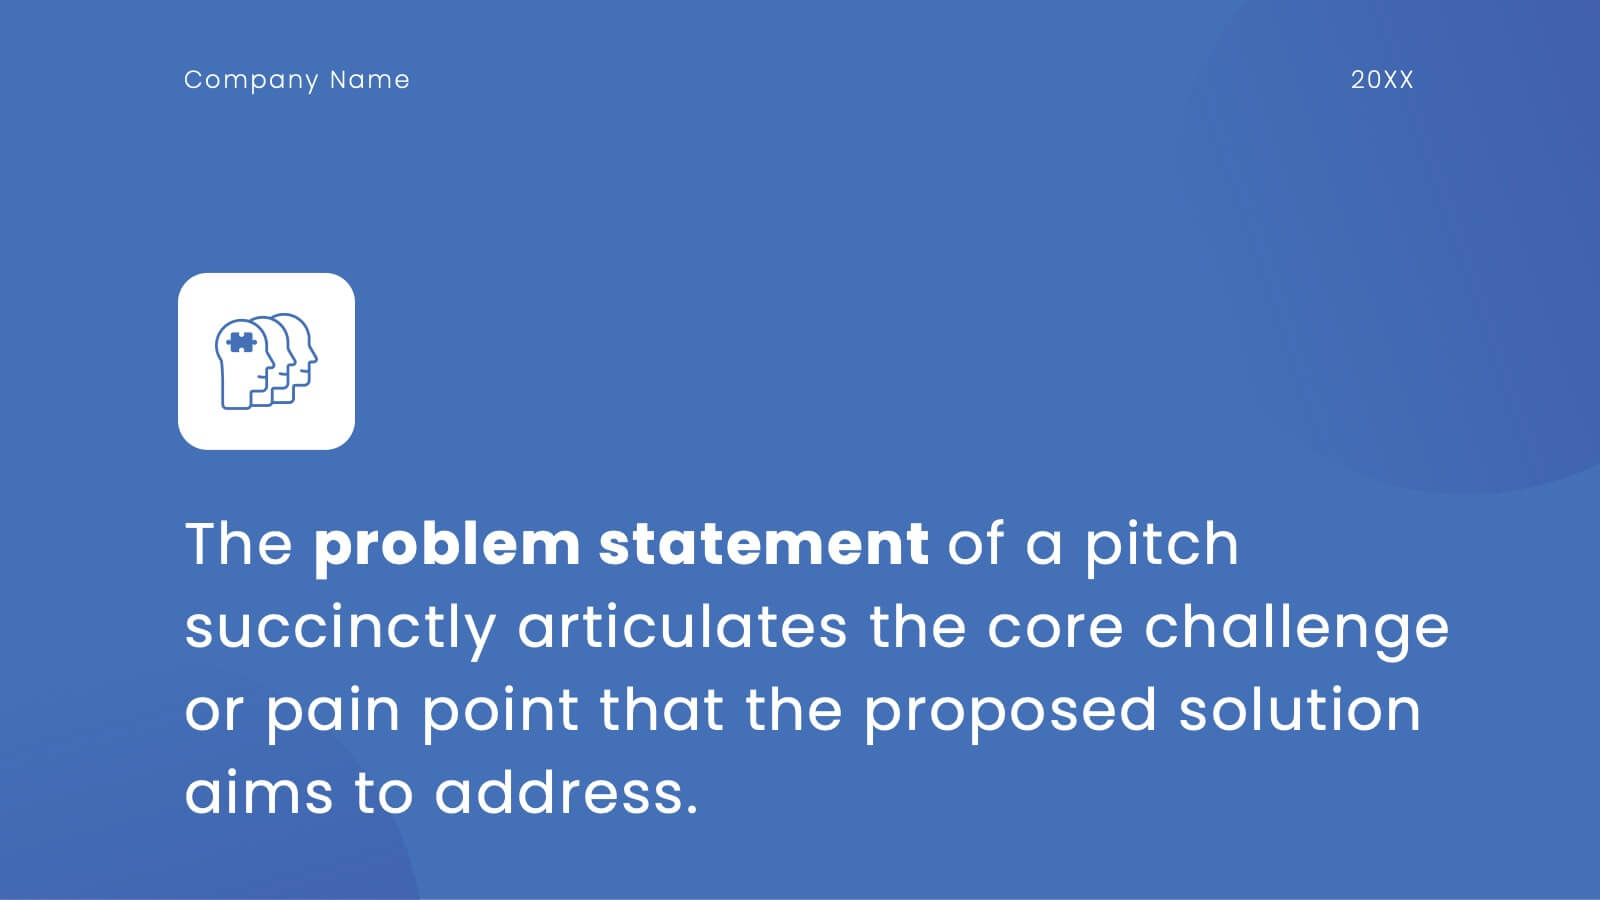
Get ready to impress with the Waterfall Project Proposal template! This visually striking and highly organized template is designed to help you communicate your project plan with clarity and impact. Start with an engaging introduction and company overview, then seamlessly guide your audience through the project summary, problem statement, and your proposed solutions. This template covers all essential aspects, including objectives, goals, scope of work, methodology, and a detailed timeline of milestones. With dedicated sections for pricing structure, team expertise, and client testimonials, you can showcase the strengths and reliability of your proposal. The template also includes slides for risk management, terms and conditions, and a clear next steps action plan. Perfect for any professional setting, this template is fully customizable and compatible with PowerPoint, Keynote, and Google Slides, ensuring that your proposal looks polished and professional every time.


6 diapositivas
5-Year Financial Forecast Slide Presentation
Show your long-term growth with a clean, visual touch that makes numbers easy to follow and goals clear to everyone. This modern layout highlights yearly progress using engaging icons and percentage indicators, perfect for financial reports or investor decks. Fully compatible with PowerPoint, Keynote, and Google Slides for seamless editing.


6 diapositivas
Scrum Team Roles and Sprint Planning Presentation
Visualize your Agile workflow with this Scrum team diagram. Highlight roles, responsibilities, and key sprint planning phases in a clear, circular flow. Ideal for project managers, team leads, or Agile coaches. Fully editable in PowerPoint, Keynote, and Google Slides to support your software development or Agile training presentations.


4 diapositivas
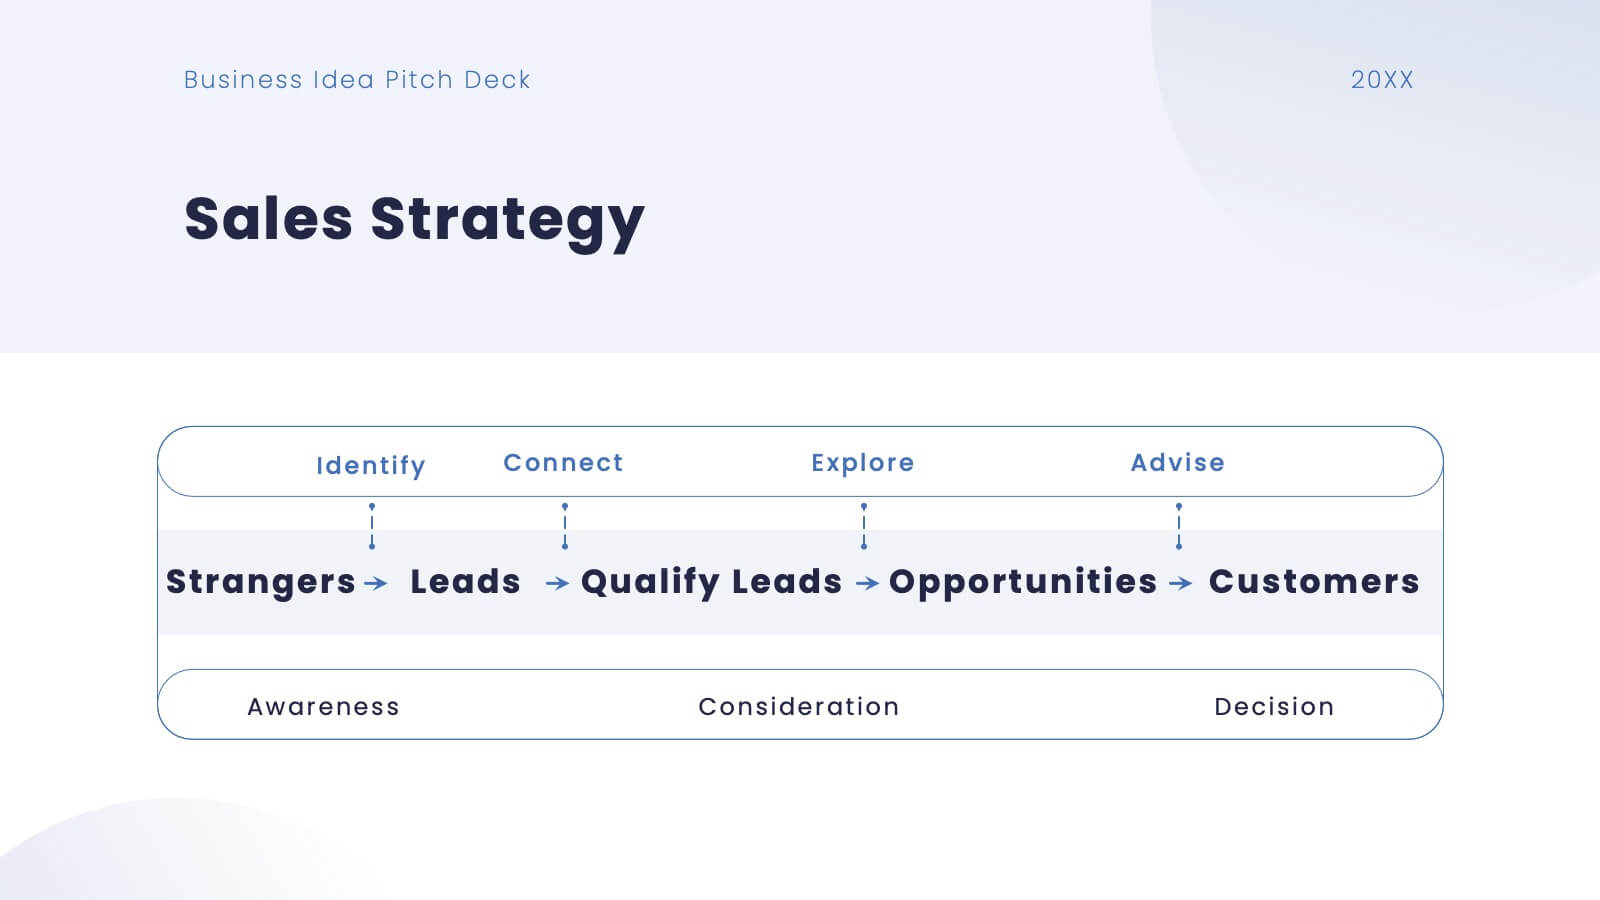
Sales Funnel Data Presentation
Turn your data into a clear story with a visual flow that shows exactly how leads move from one stage to the next. This presentation helps explain conversion steps, highlight drop-off points, and simplify complex marketing insights. It’s easy to customize and fully compatible with PowerPoint, Keynote, and Google Slides.


6 diapositivas
Project Planning and Task Allocation Presentation
Streamline your project timelines with the Project Planning and Task Allocation Presentation. This template uses a clear horizontal flow to map out six key tasks or stages, making it ideal for visualizing schedules, assigning responsibilities, or showcasing milestones. Fully editable in PowerPoint, Google Slides, Keynote, and Canva.


5 diapositivas
Eco Footprint and Sustainability Presentation
Raise awareness and drive impact with this Eco Footprint and Sustainability Presentation. Featuring a modern footprint visual, this slide is perfect for showcasing key environmental metrics, carbon impact, or green initiatives. Ideal for ESG reports, nonprofit campaigns, or corporate responsibility updates. Compatible with PowerPoint, Keynote, and Google Slides.


6 diapositivas
Clear Roadmap and Action Strategy Presentation
Present your strategic roadmap with clarity using this arrow-step diagram. Ideal for visualizing processes, workflows, or goal-driven action plans. The curved sequence highlights five progressive steps with icons and color coding. Fully customizable in PowerPoint, Keynote, or Google Slides—perfect for business strategy meetings, project planning, or milestone tracking.

22 diapositivas
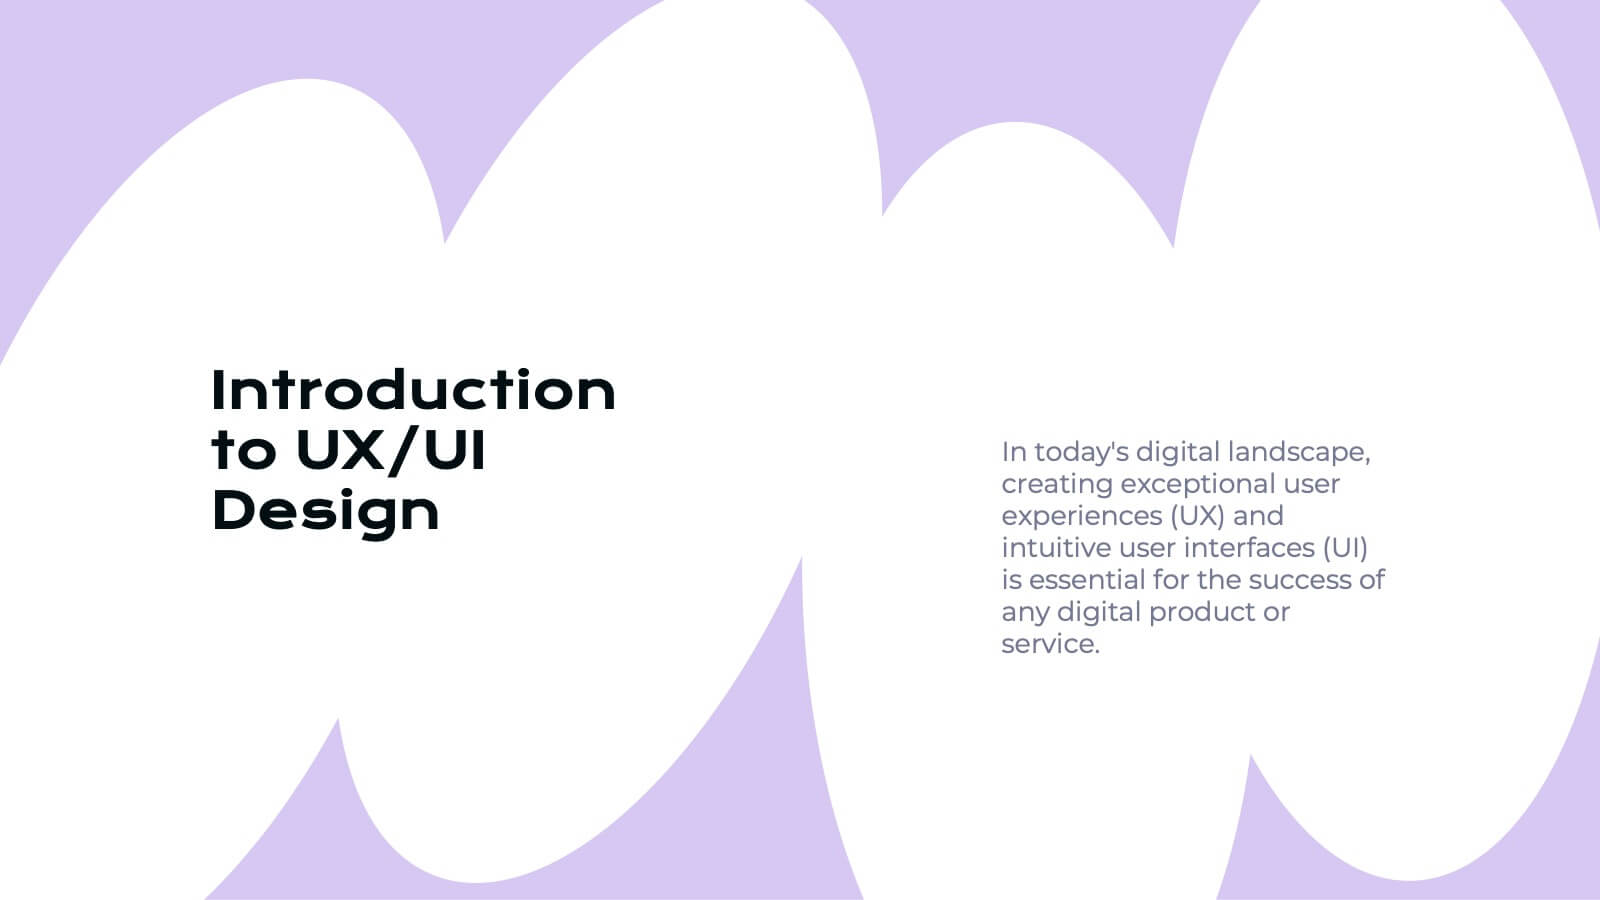
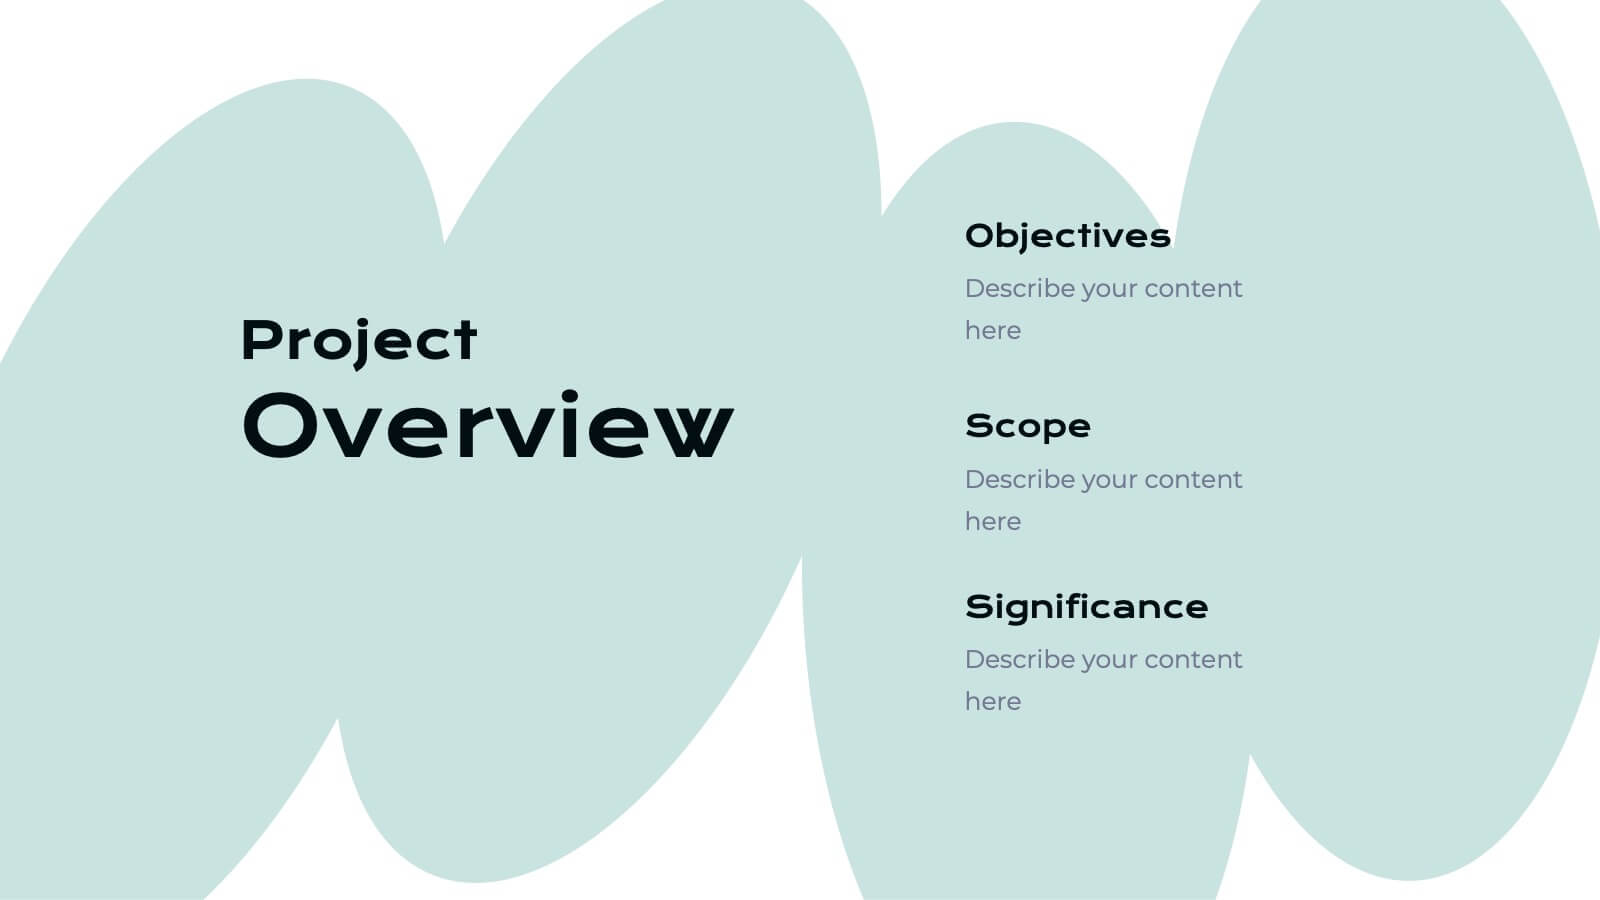
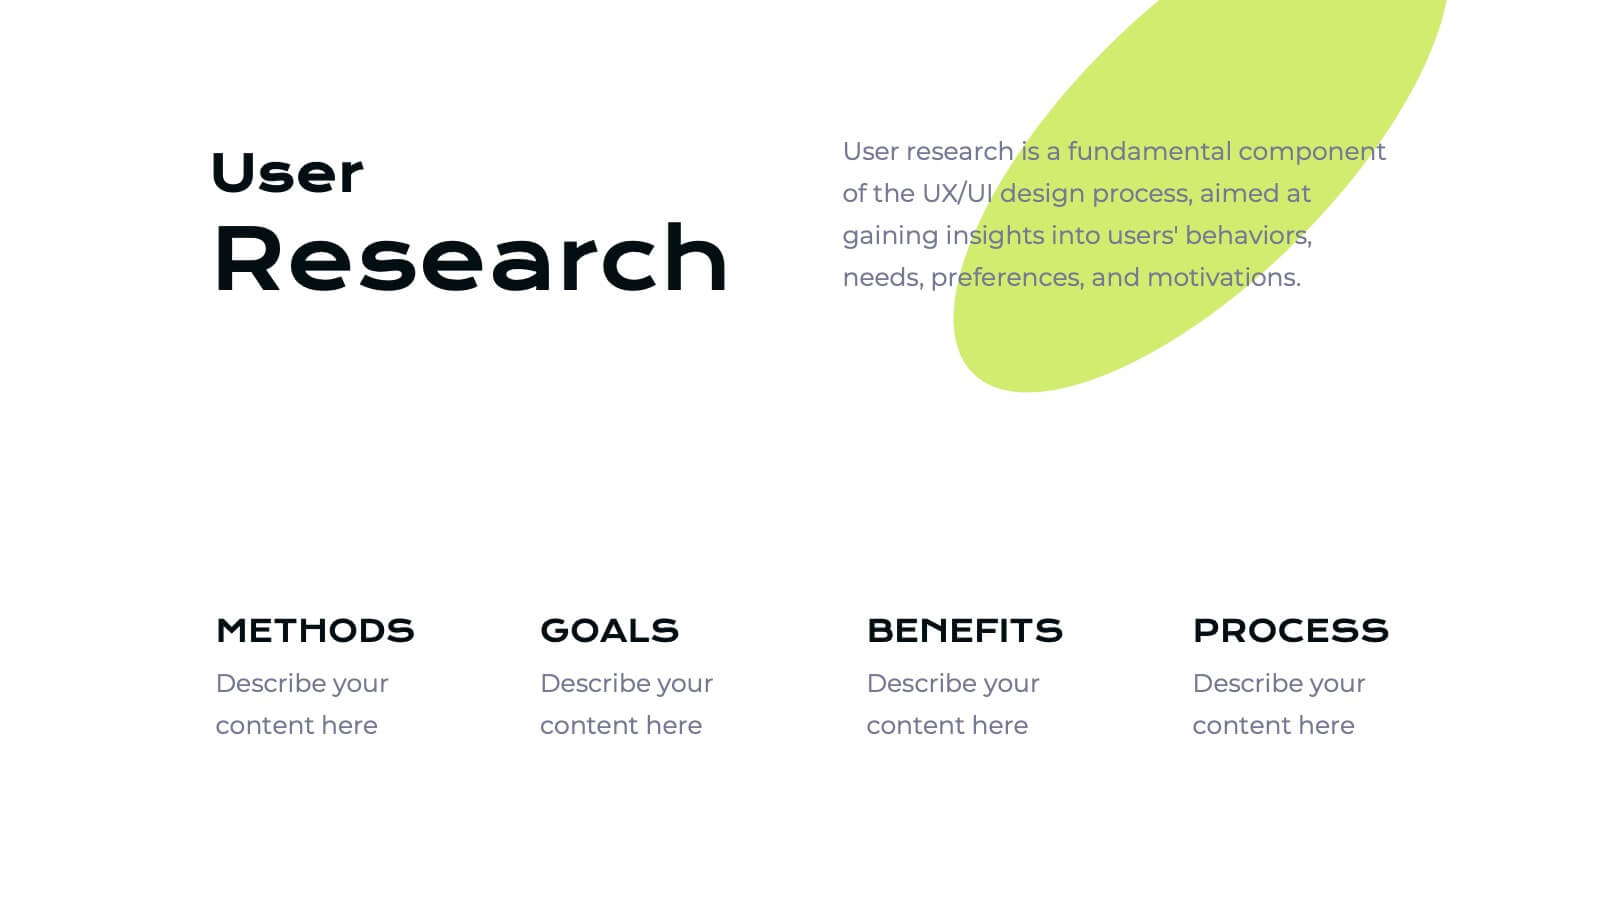
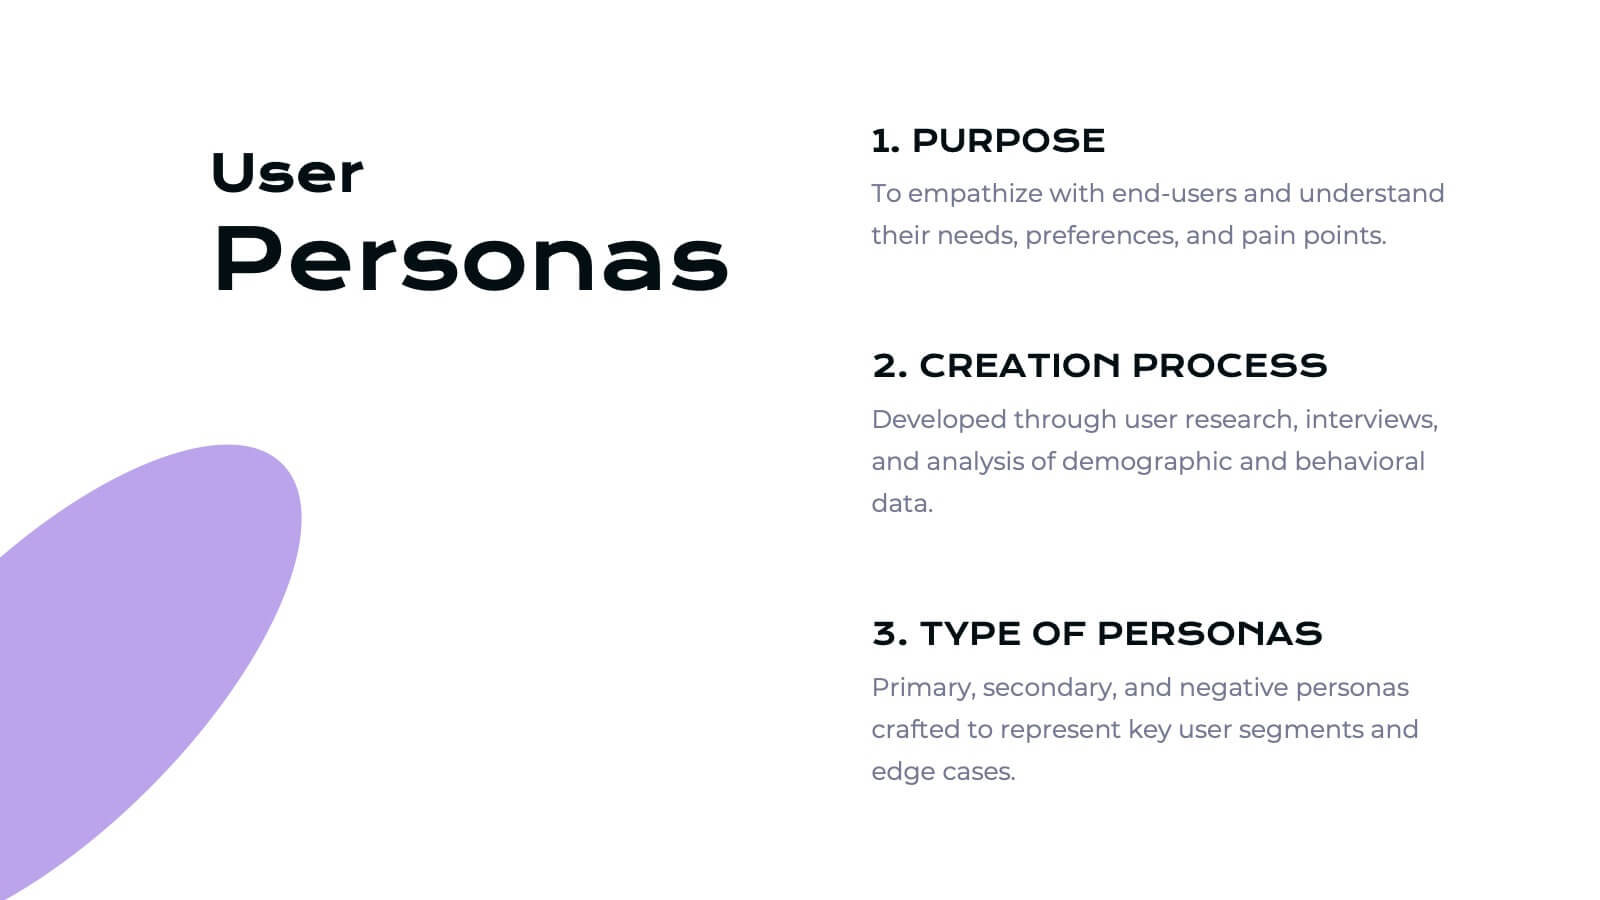
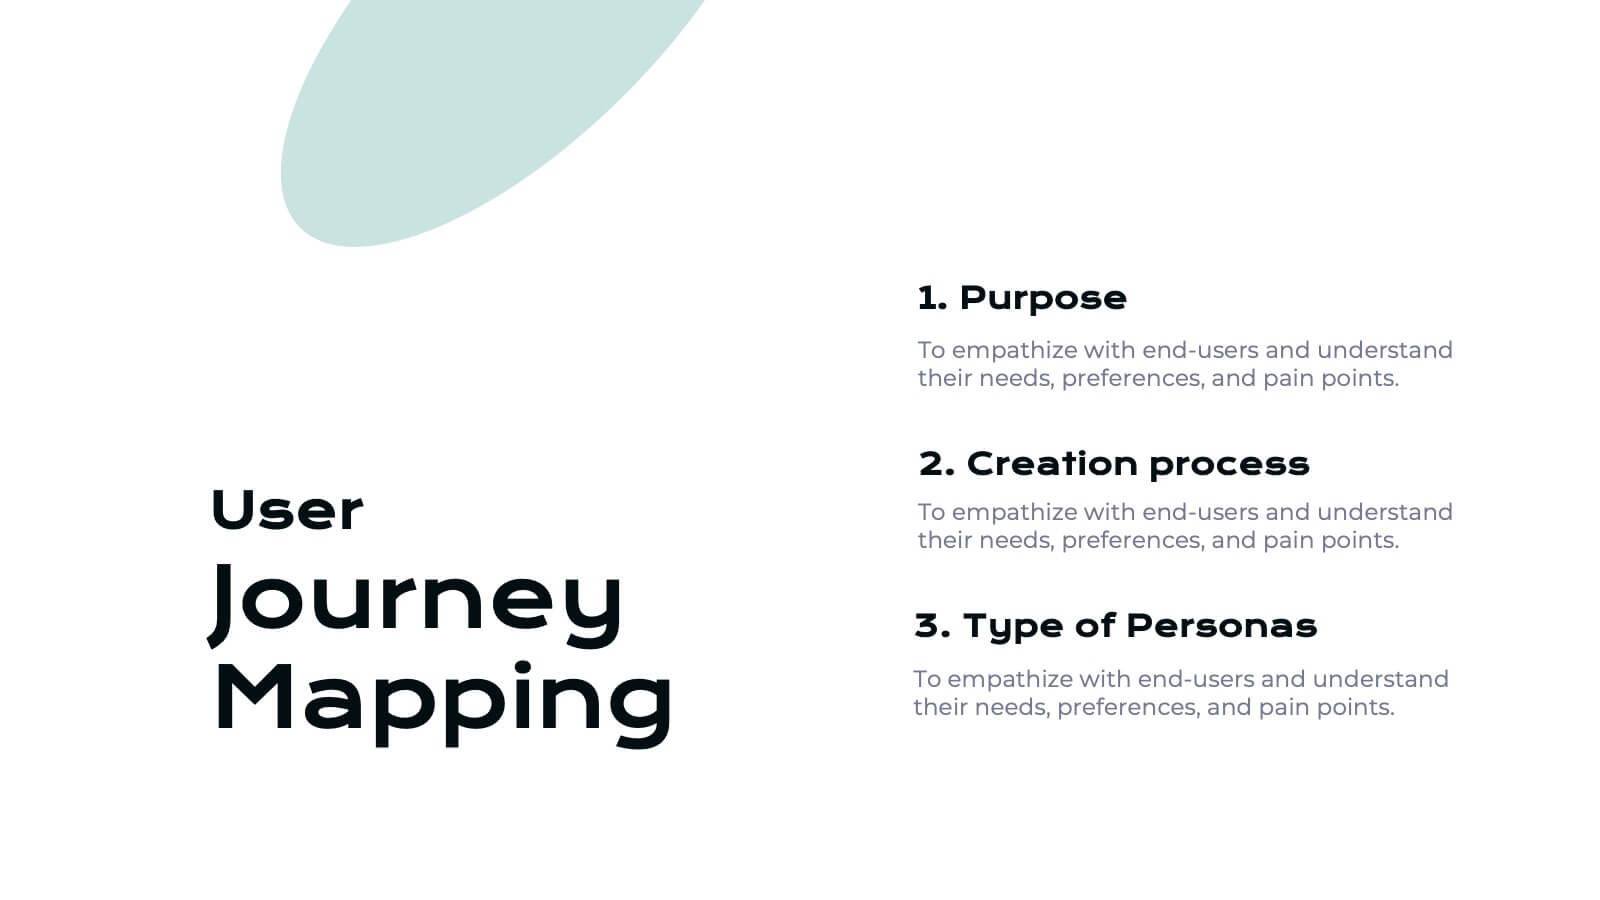
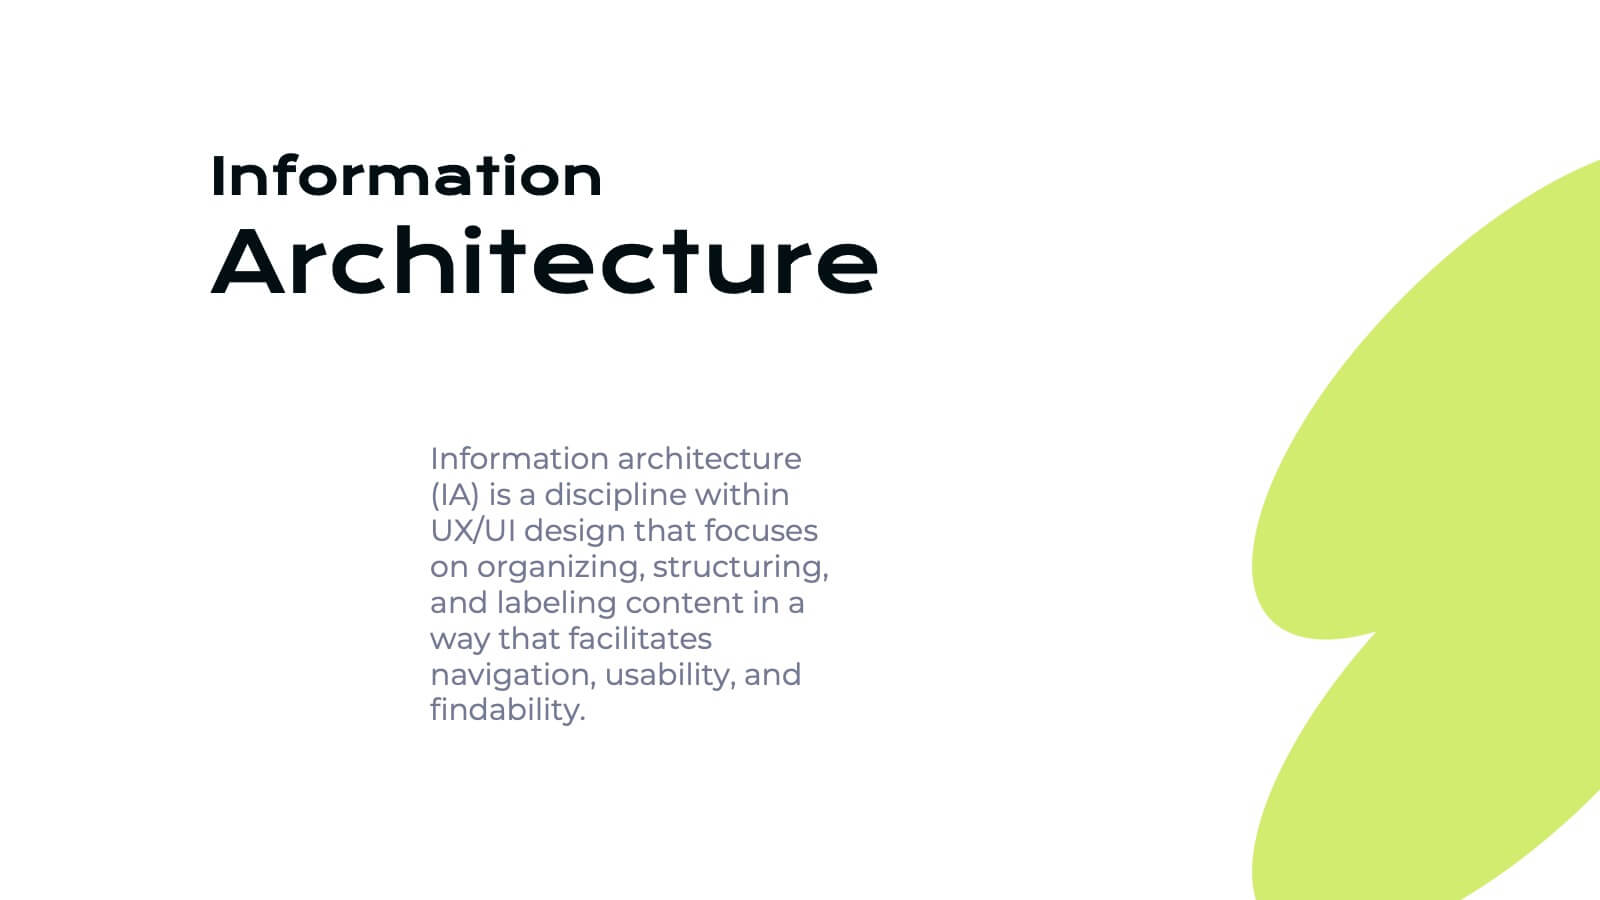
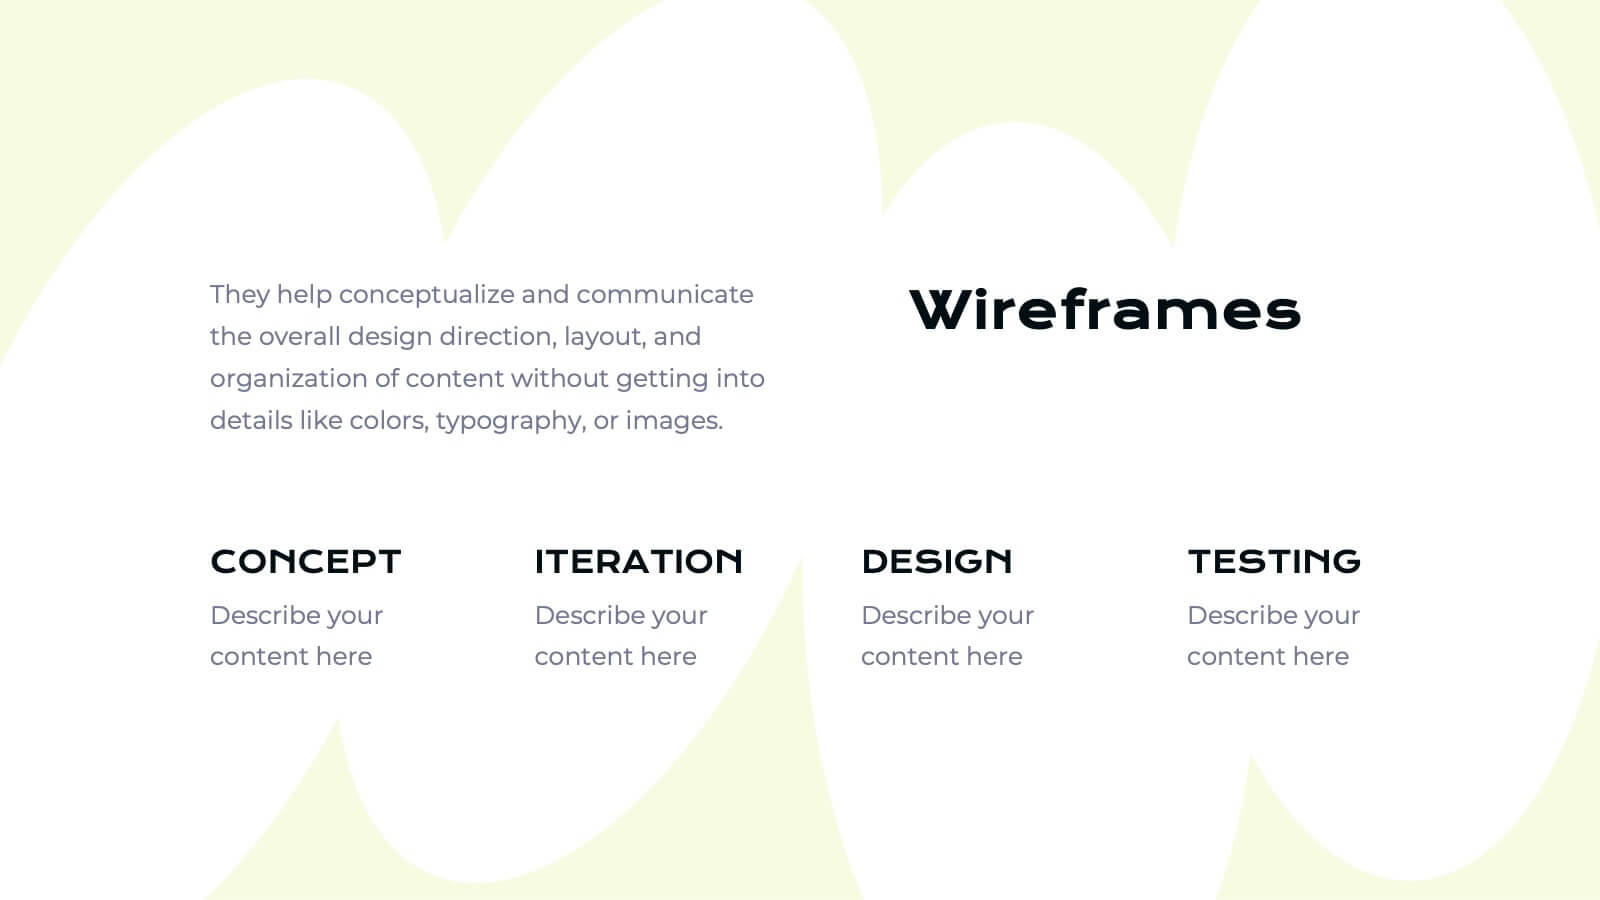
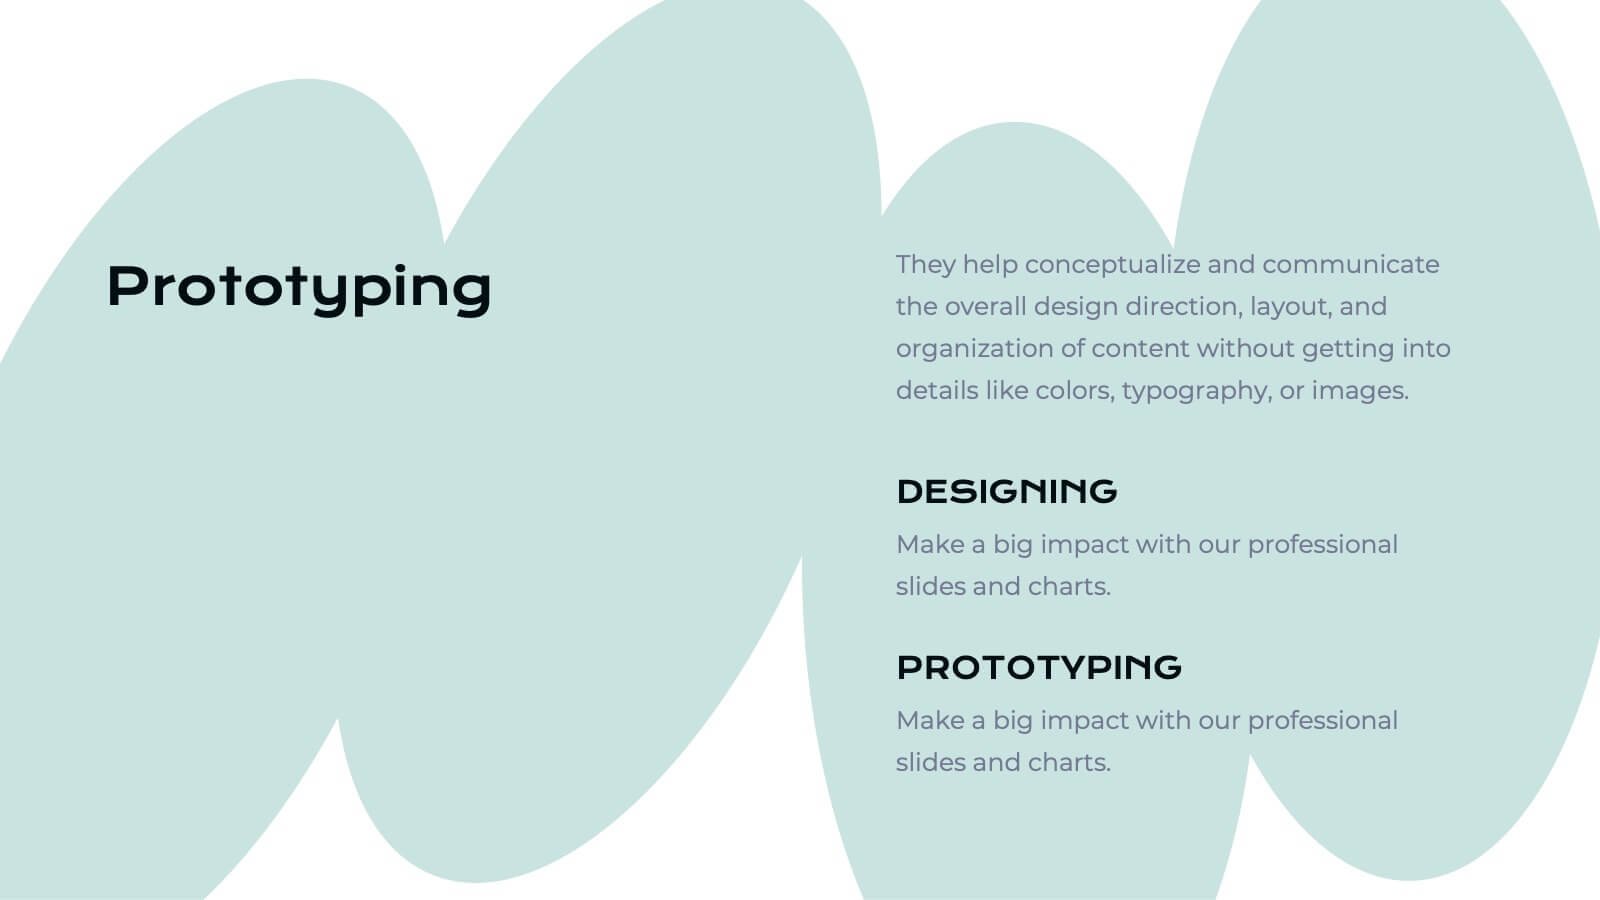
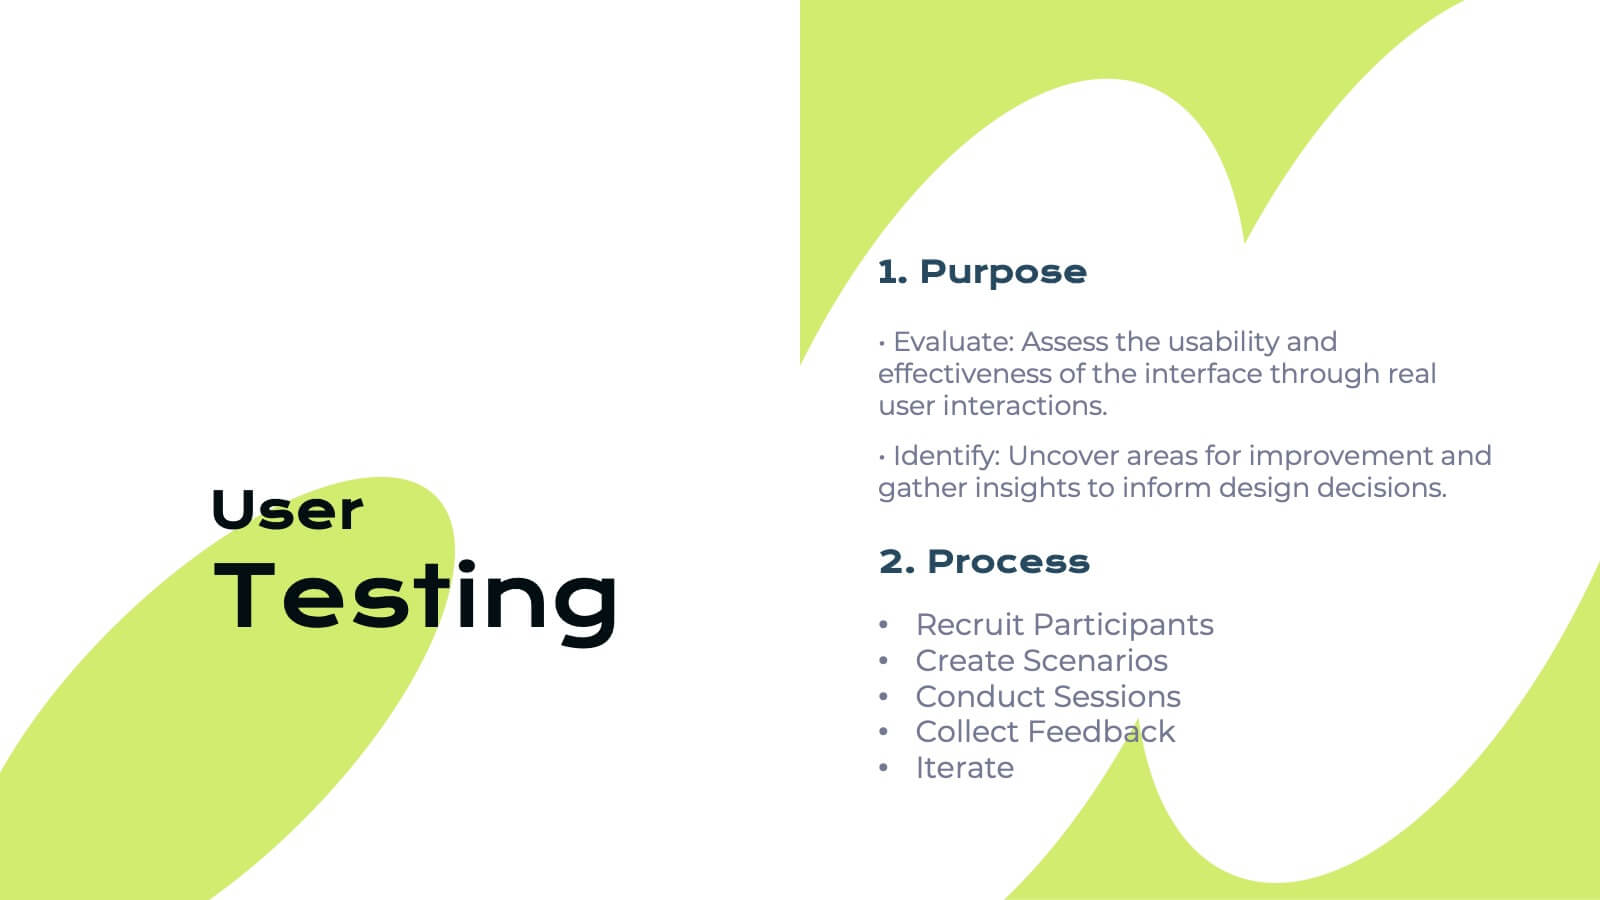
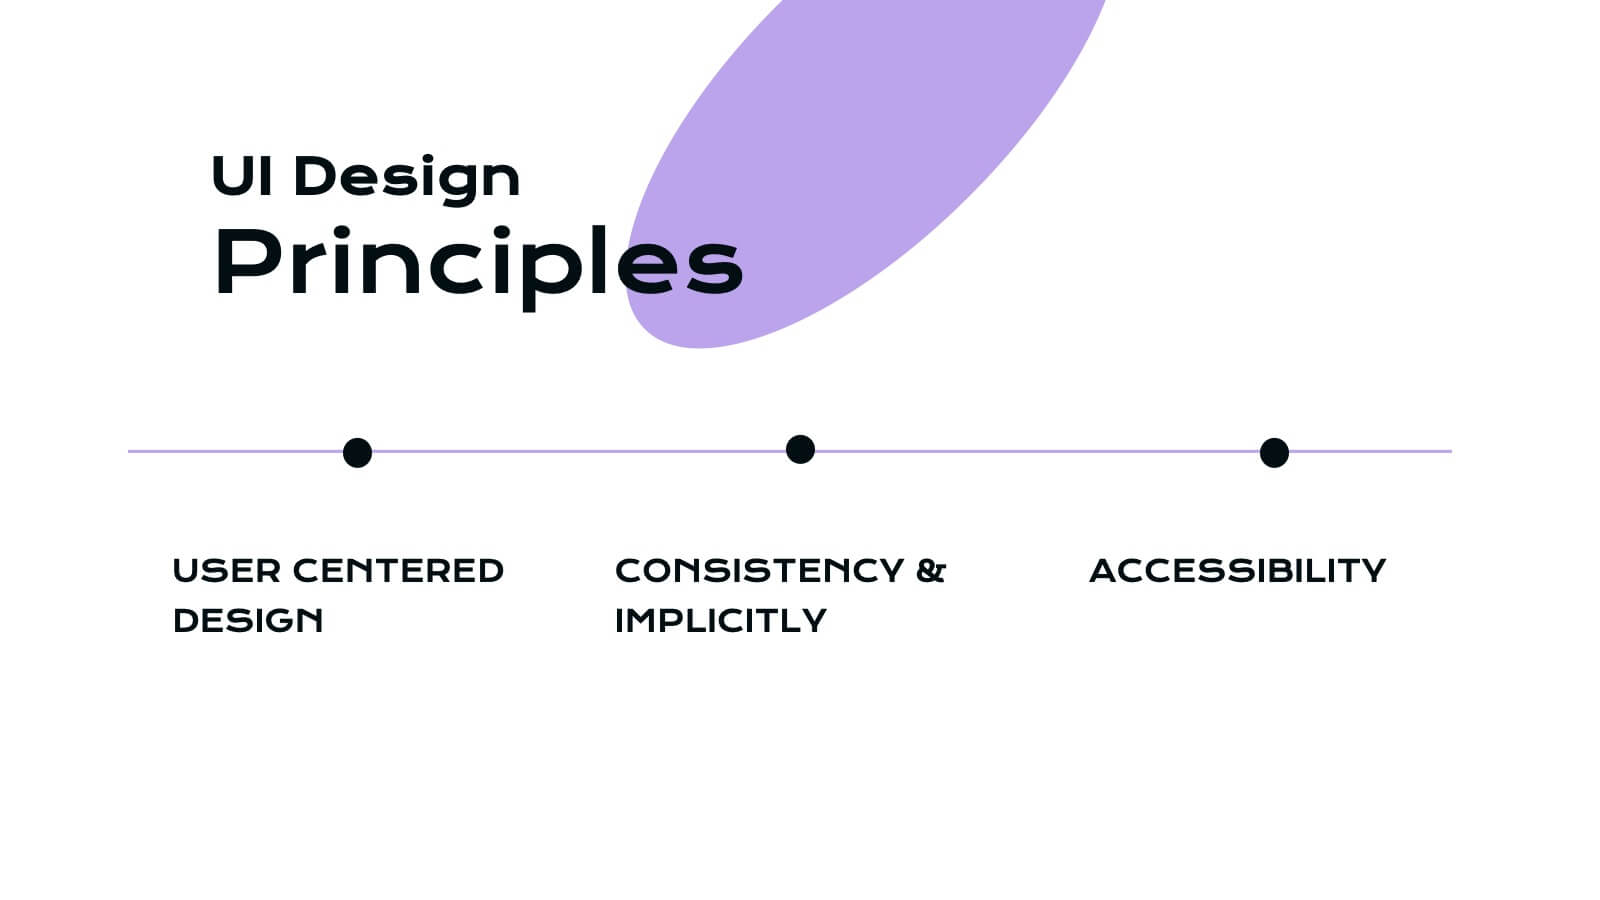
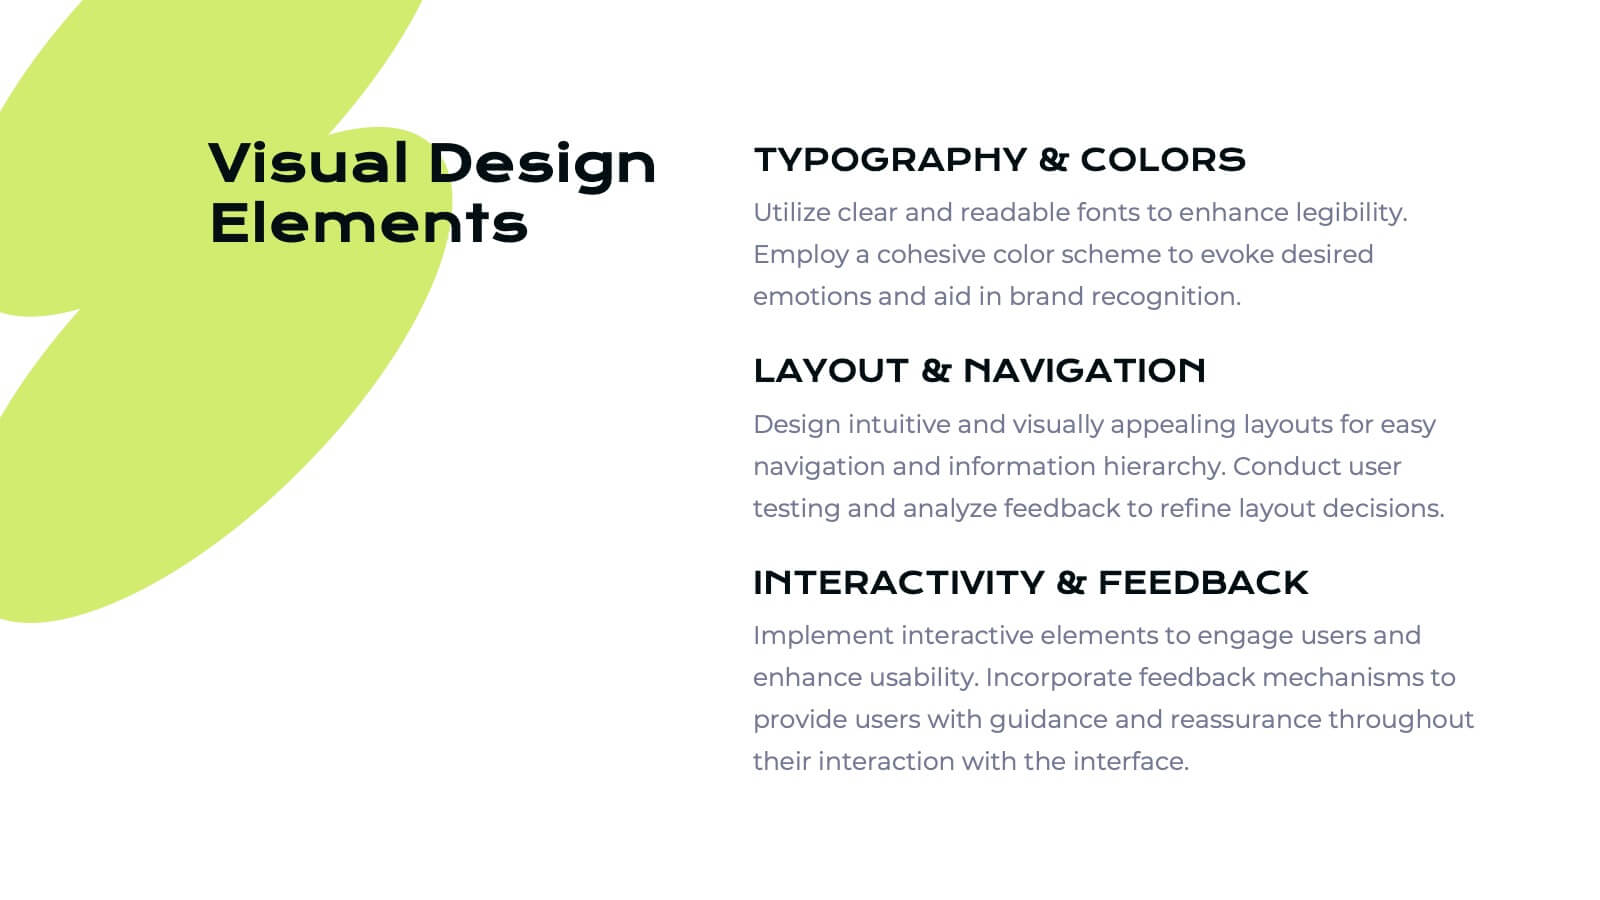
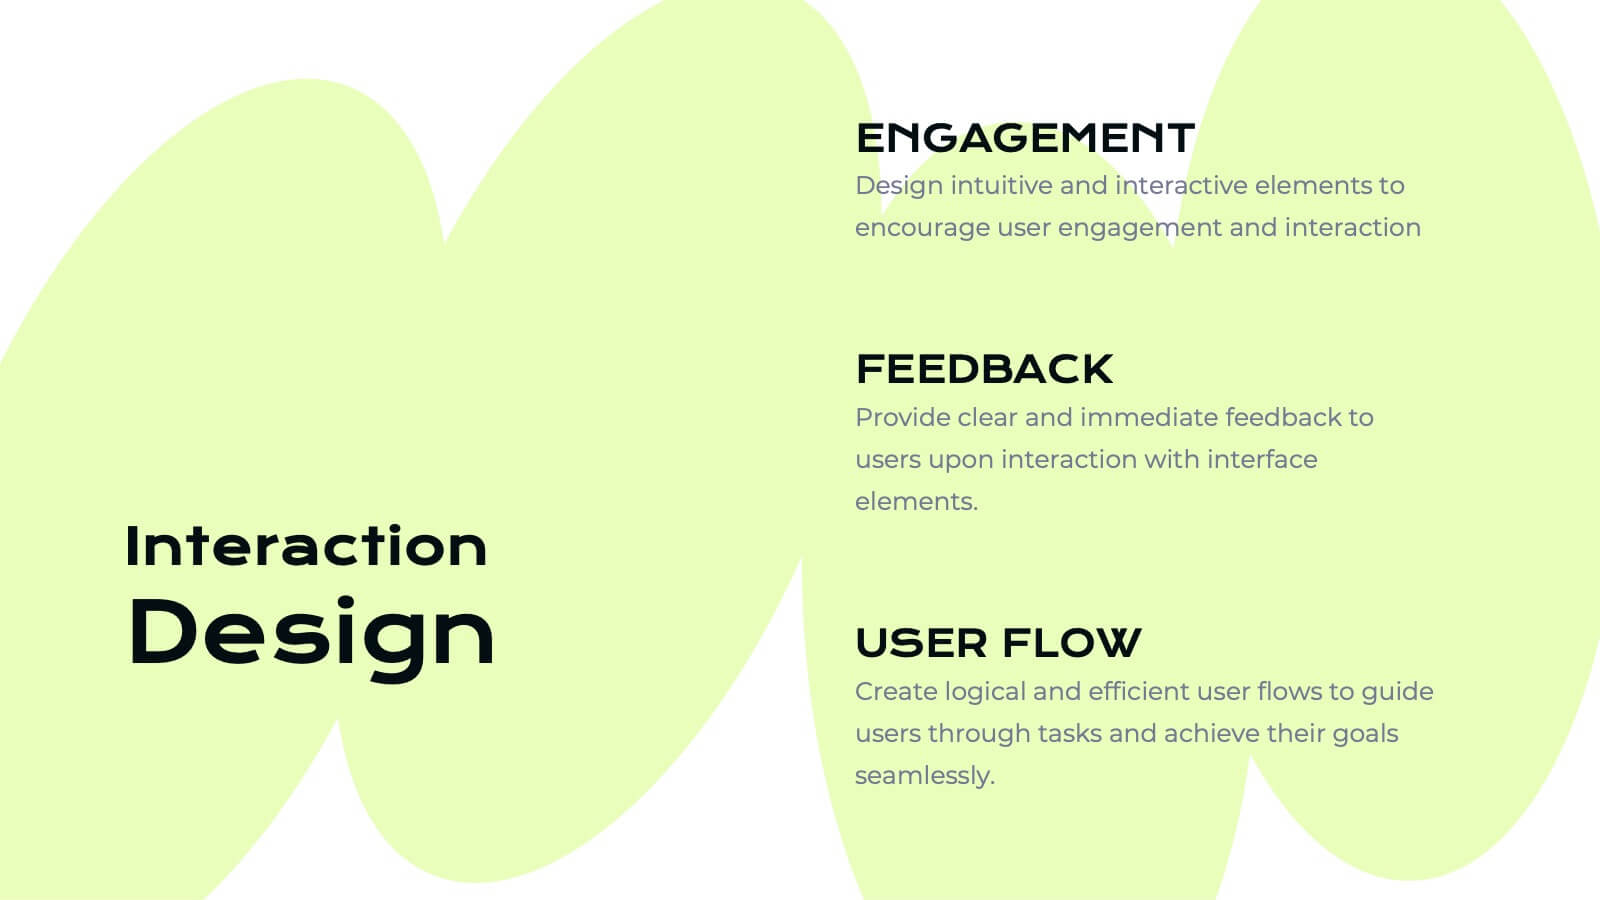
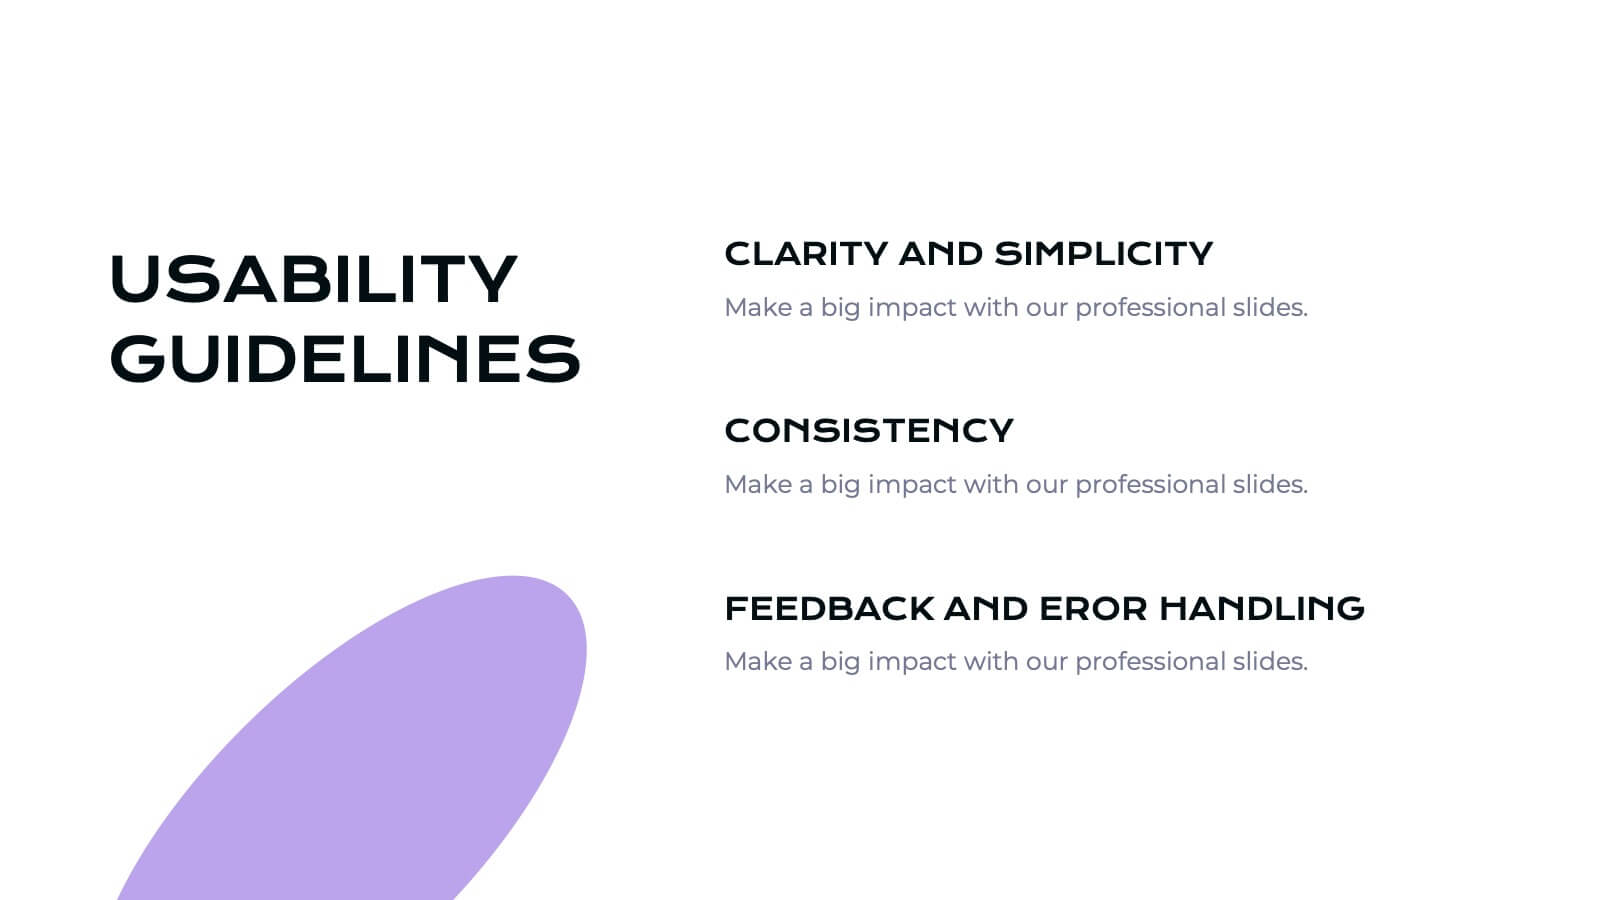
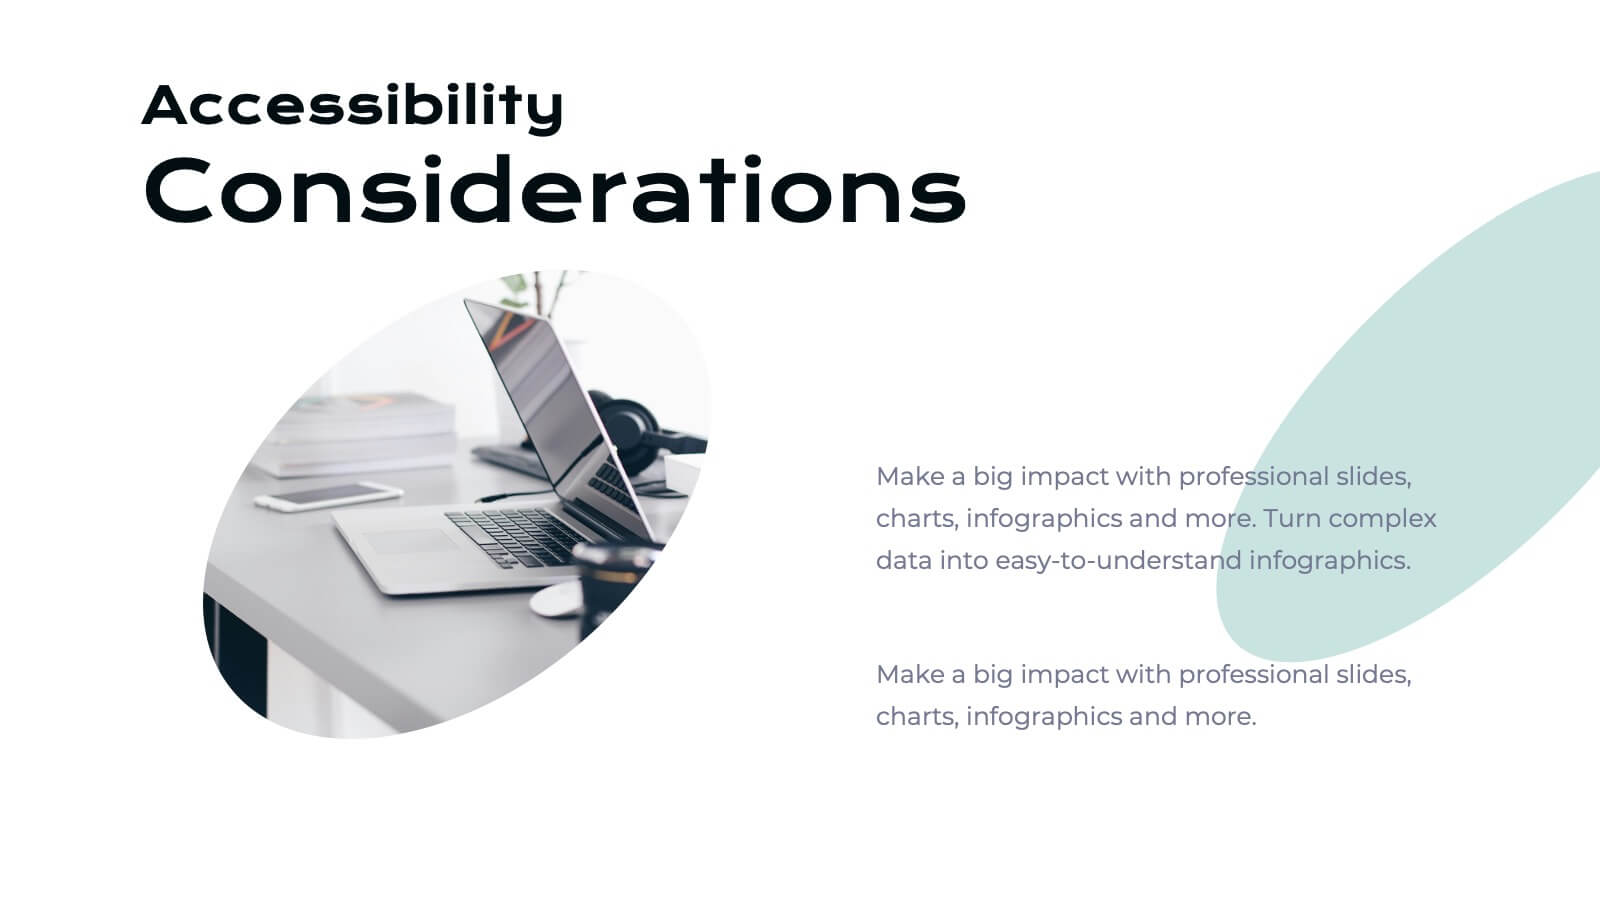
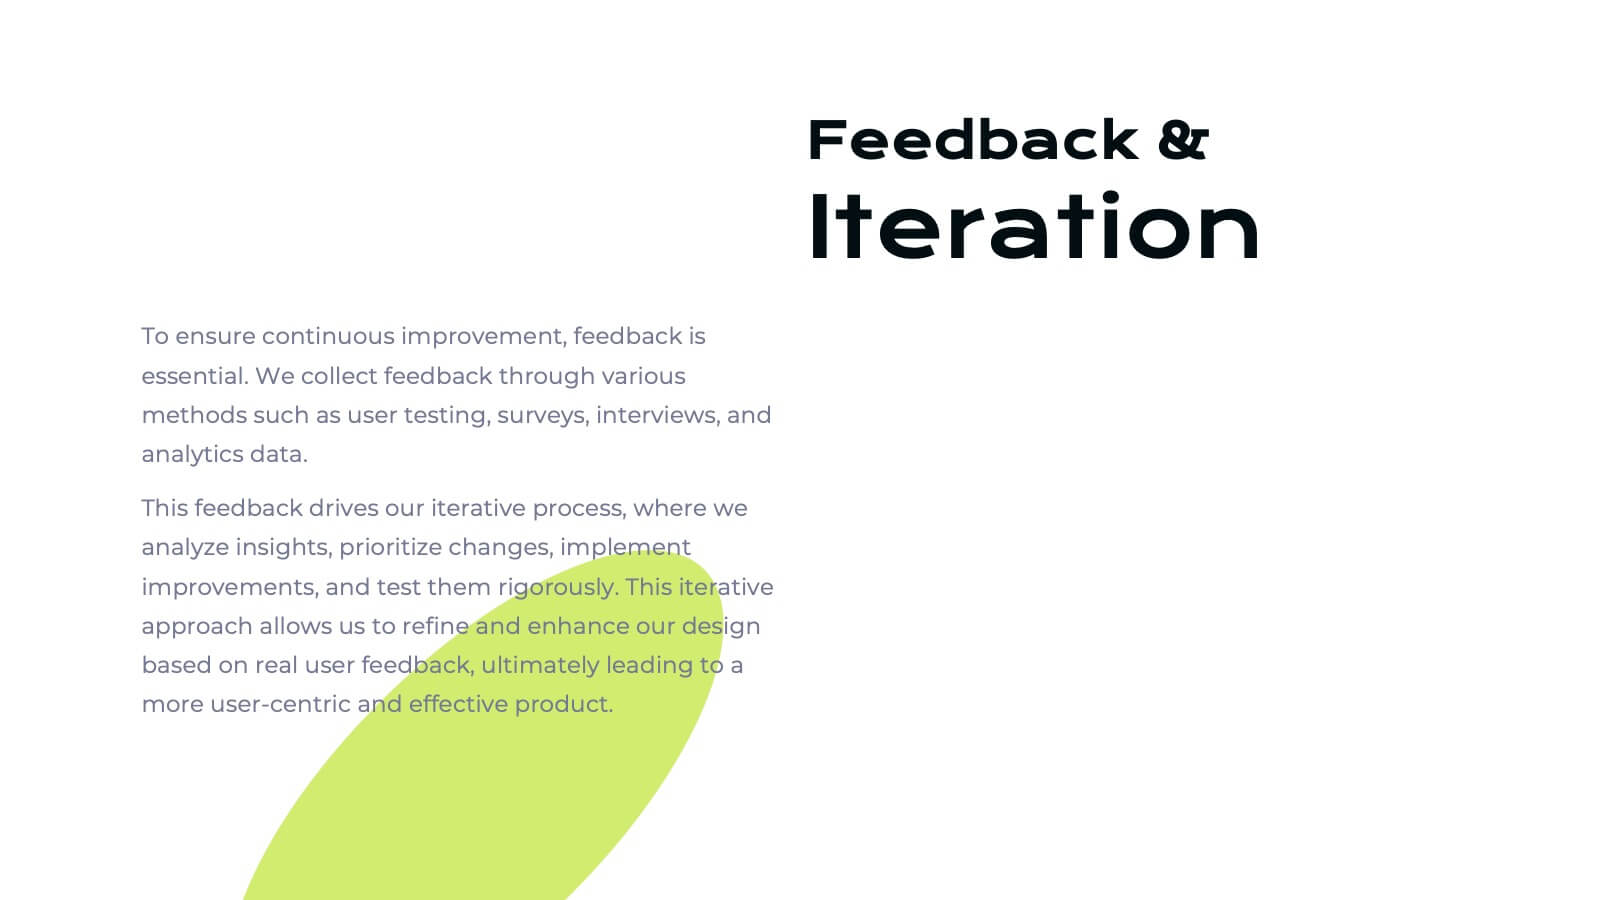
Ifrit User Experience Proposal Presentation
Unleash the power of great design with this fiery Ifrit-inspired presentation, perfect for delivering your user experience proposal! This template lets you showcase your UX strategies, research, and design process in a visually striking and well-organized format. Impress stakeholders with every slide. Compatible with PowerPoint, Keynote, and Google Slides.


4 diapositivas
Task List and To-Do Management Presentation
Boost productivity with this engaging task management template. Designed for clear visualization, it helps organize priorities, track progress, and streamline workflows efficiently. Featuring a structured layout, it's perfect for professionals managing daily to-dos, project timelines, or business strategies. Fully compatible with PowerPoint, Keynote, and Google Slides for seamless use.


28 diapositivas
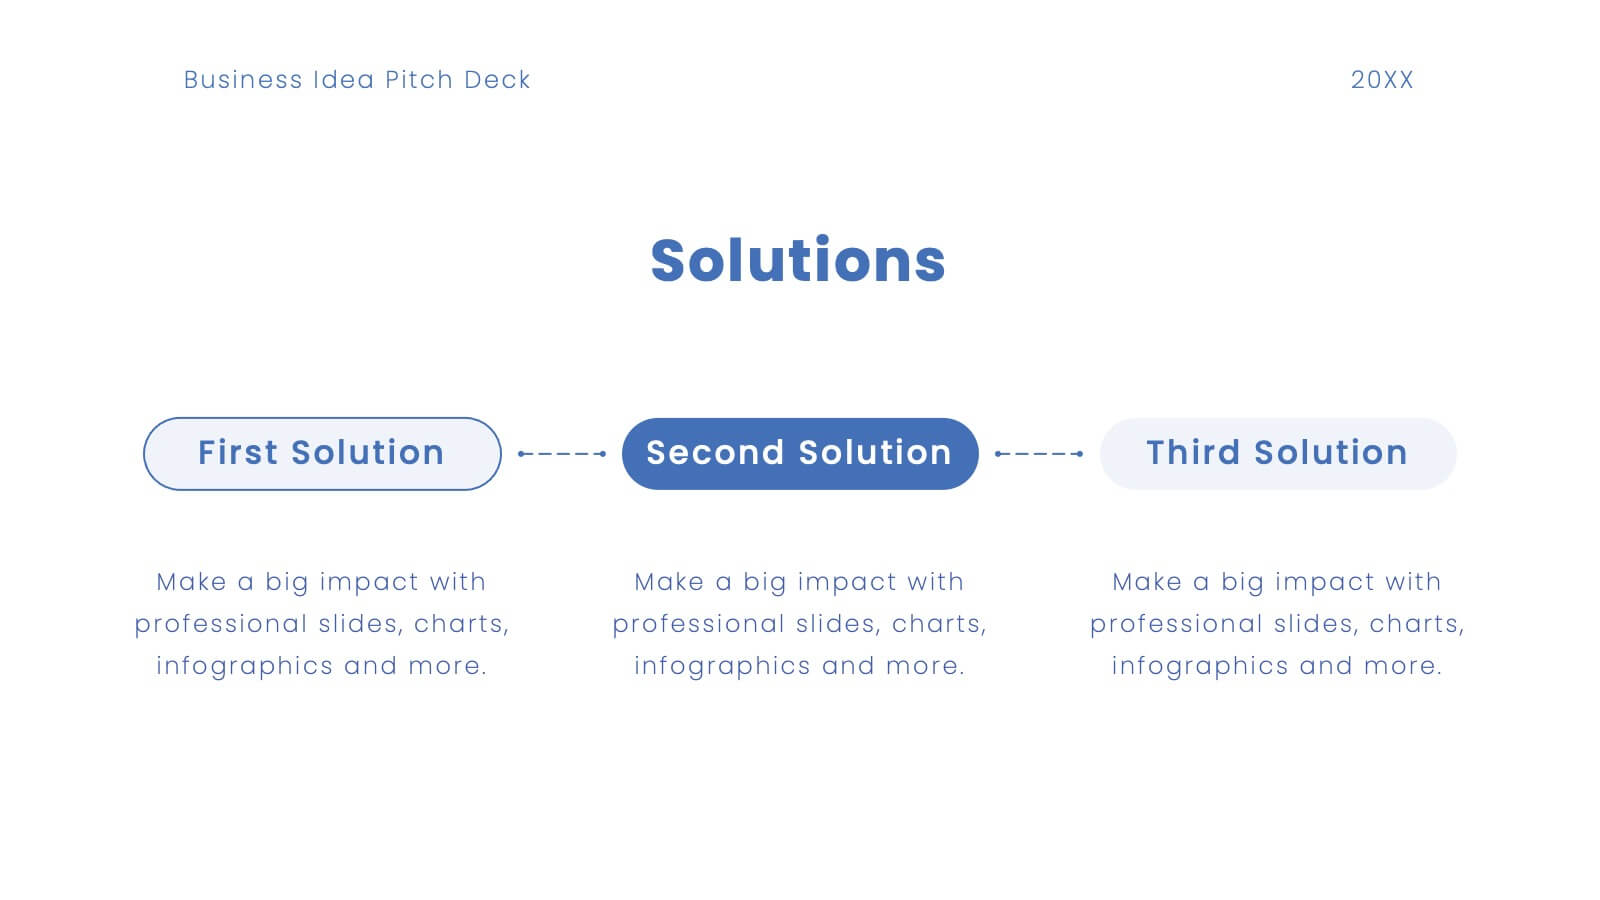
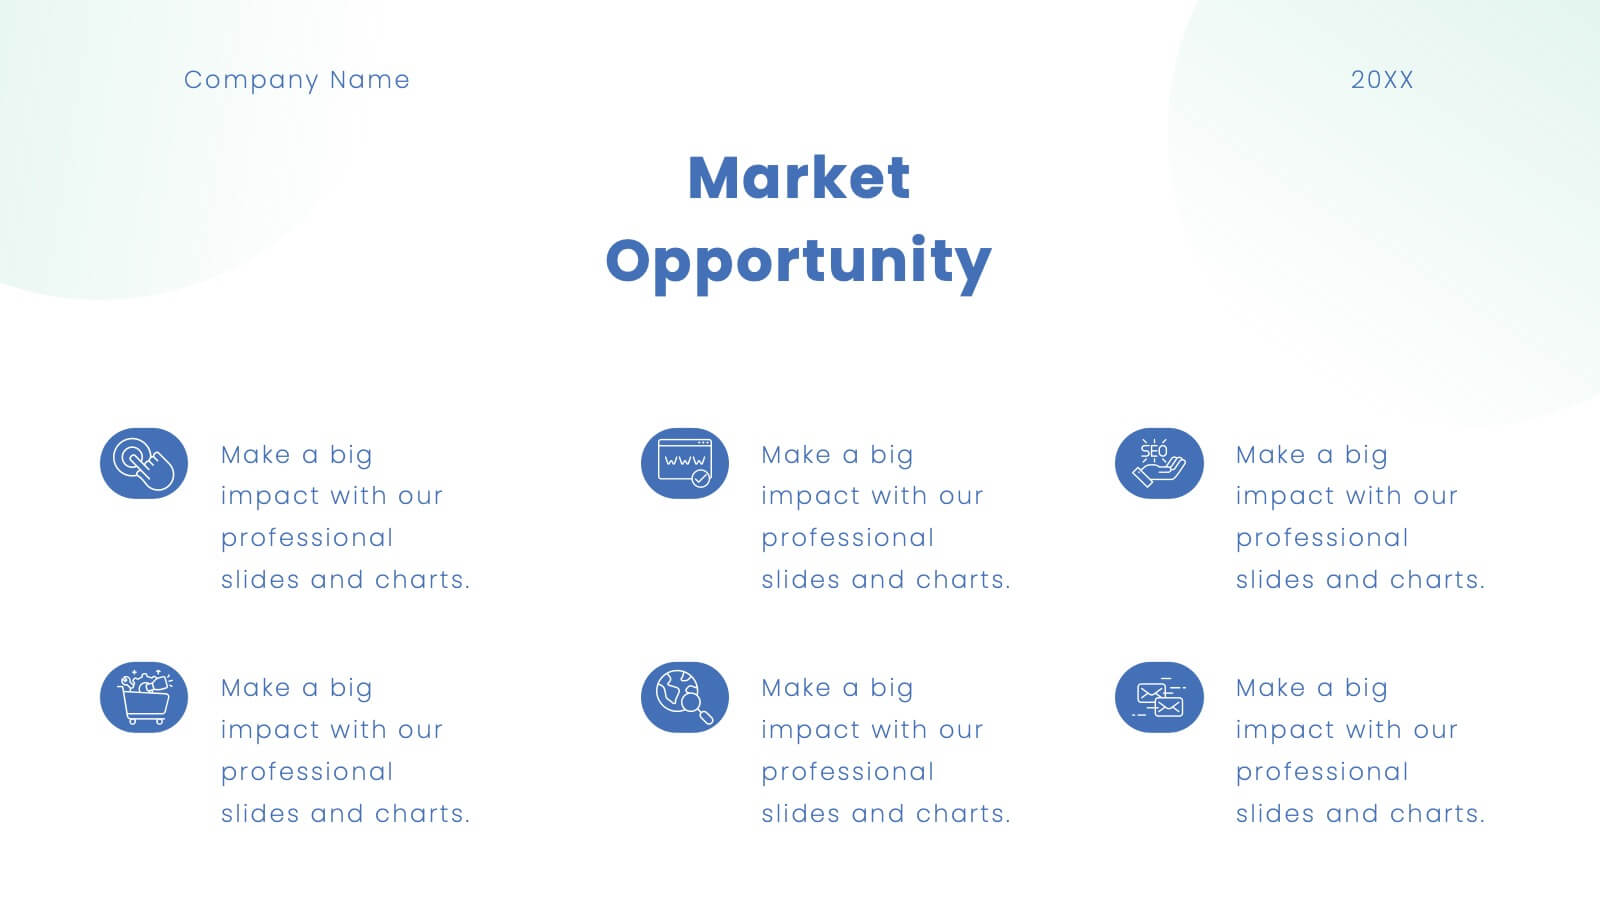
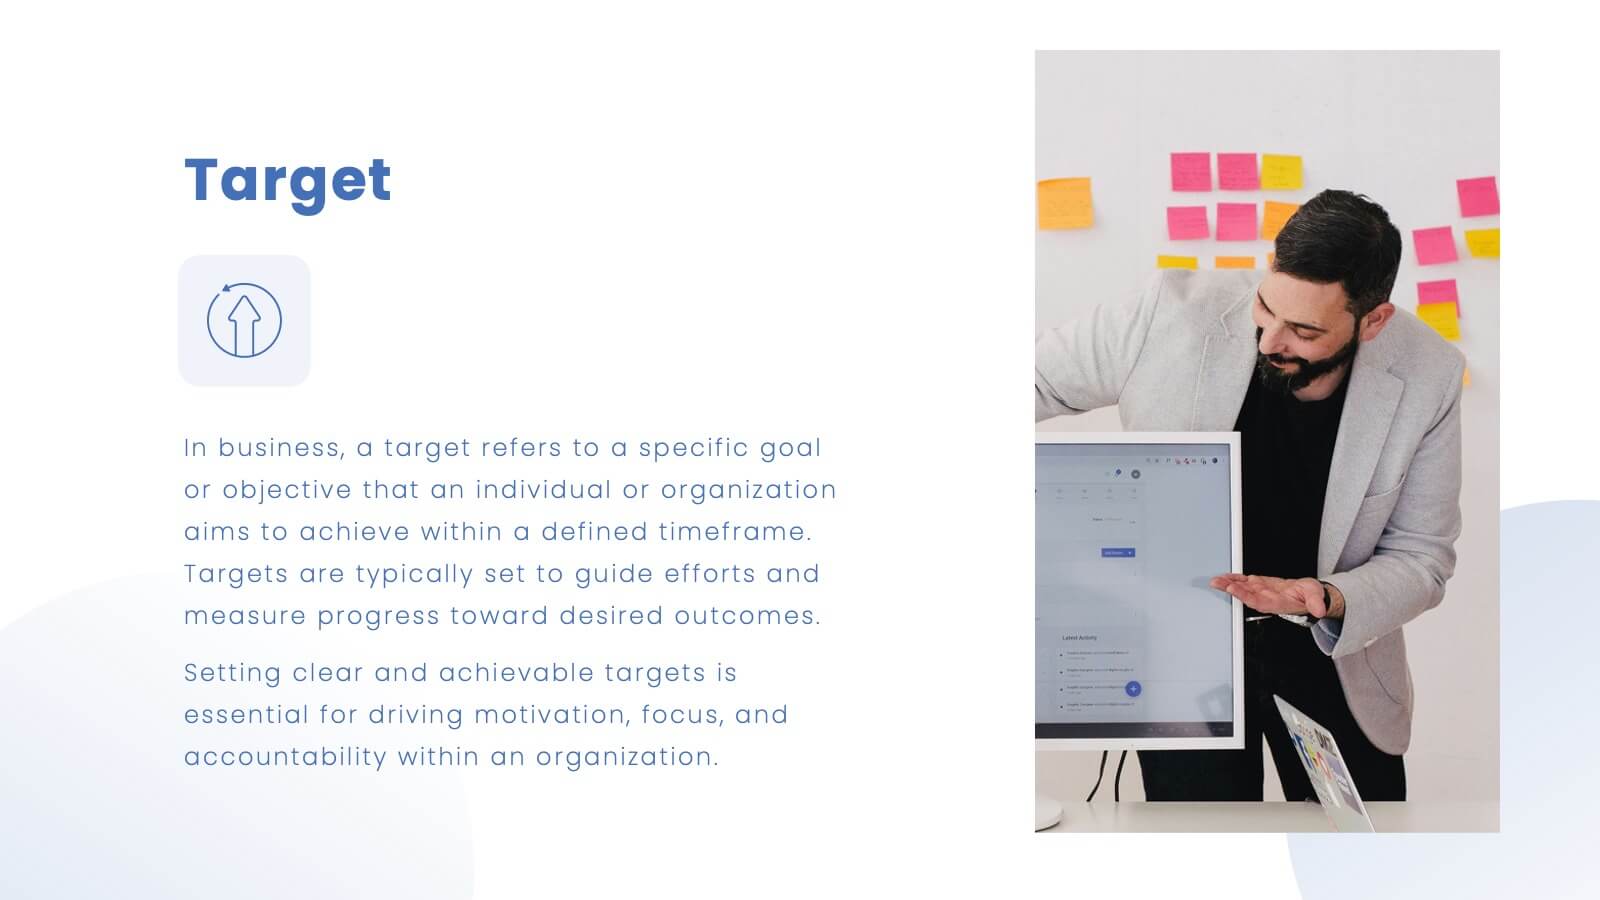
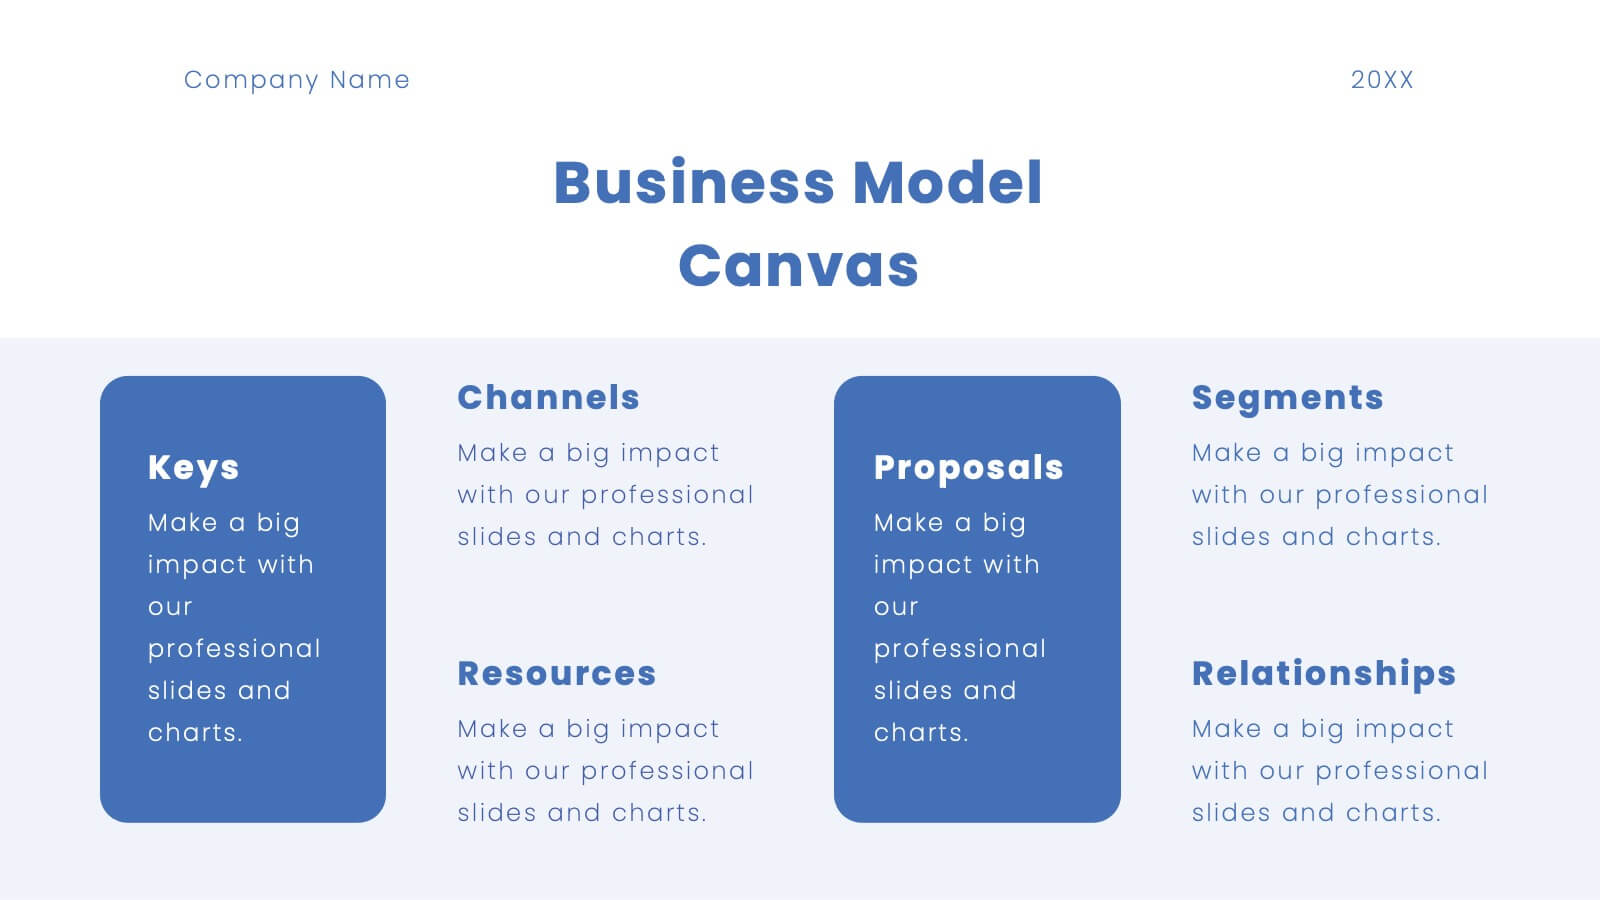
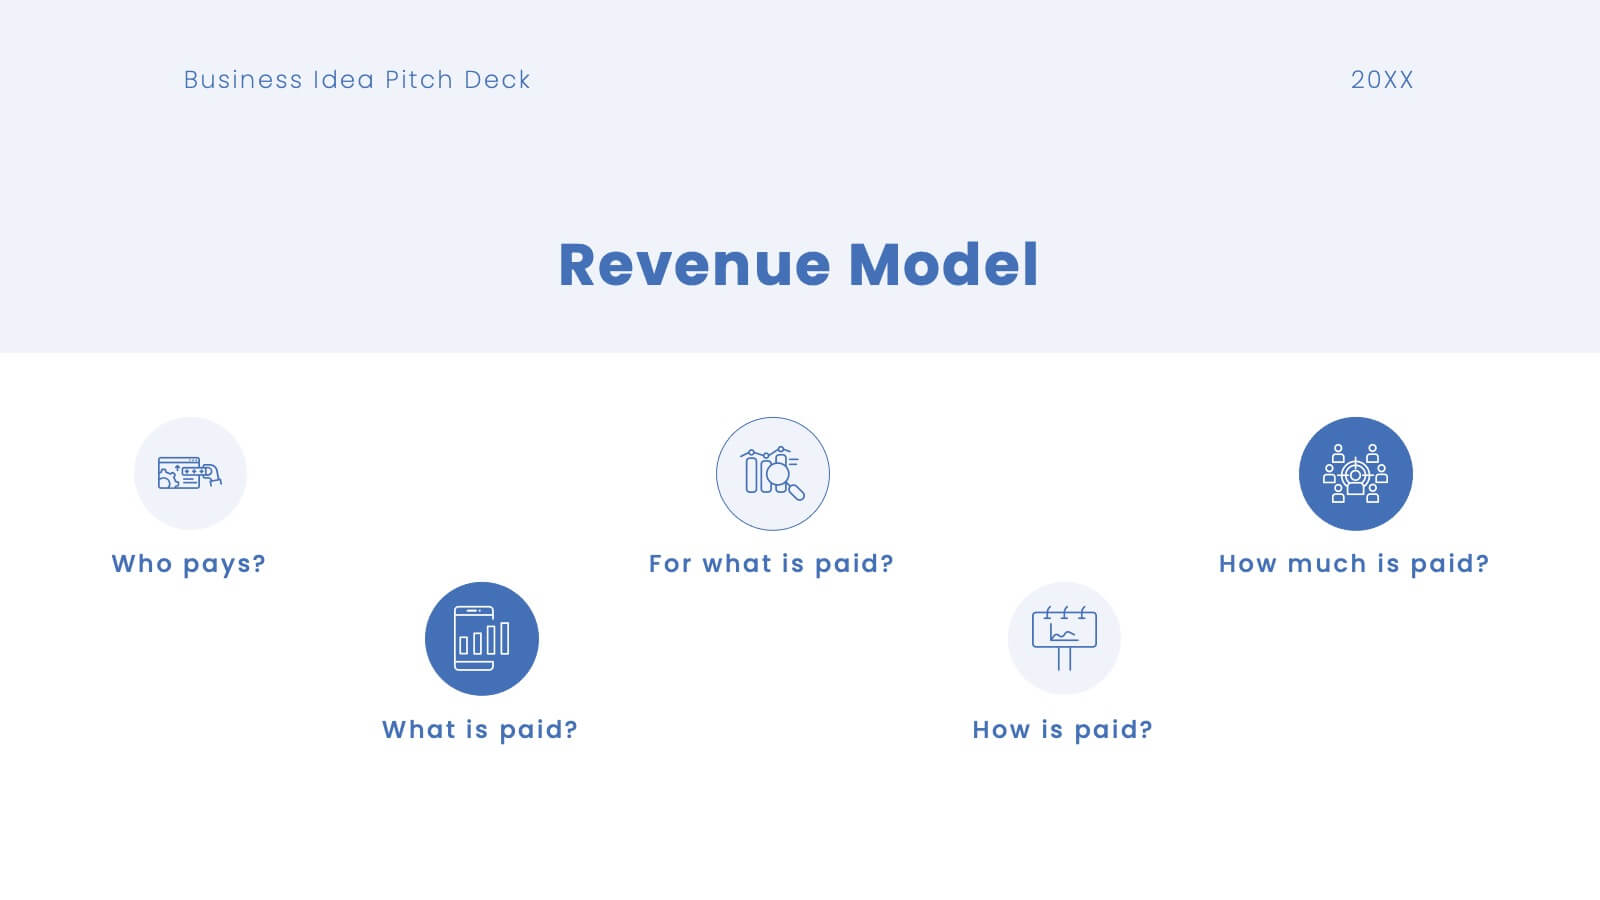
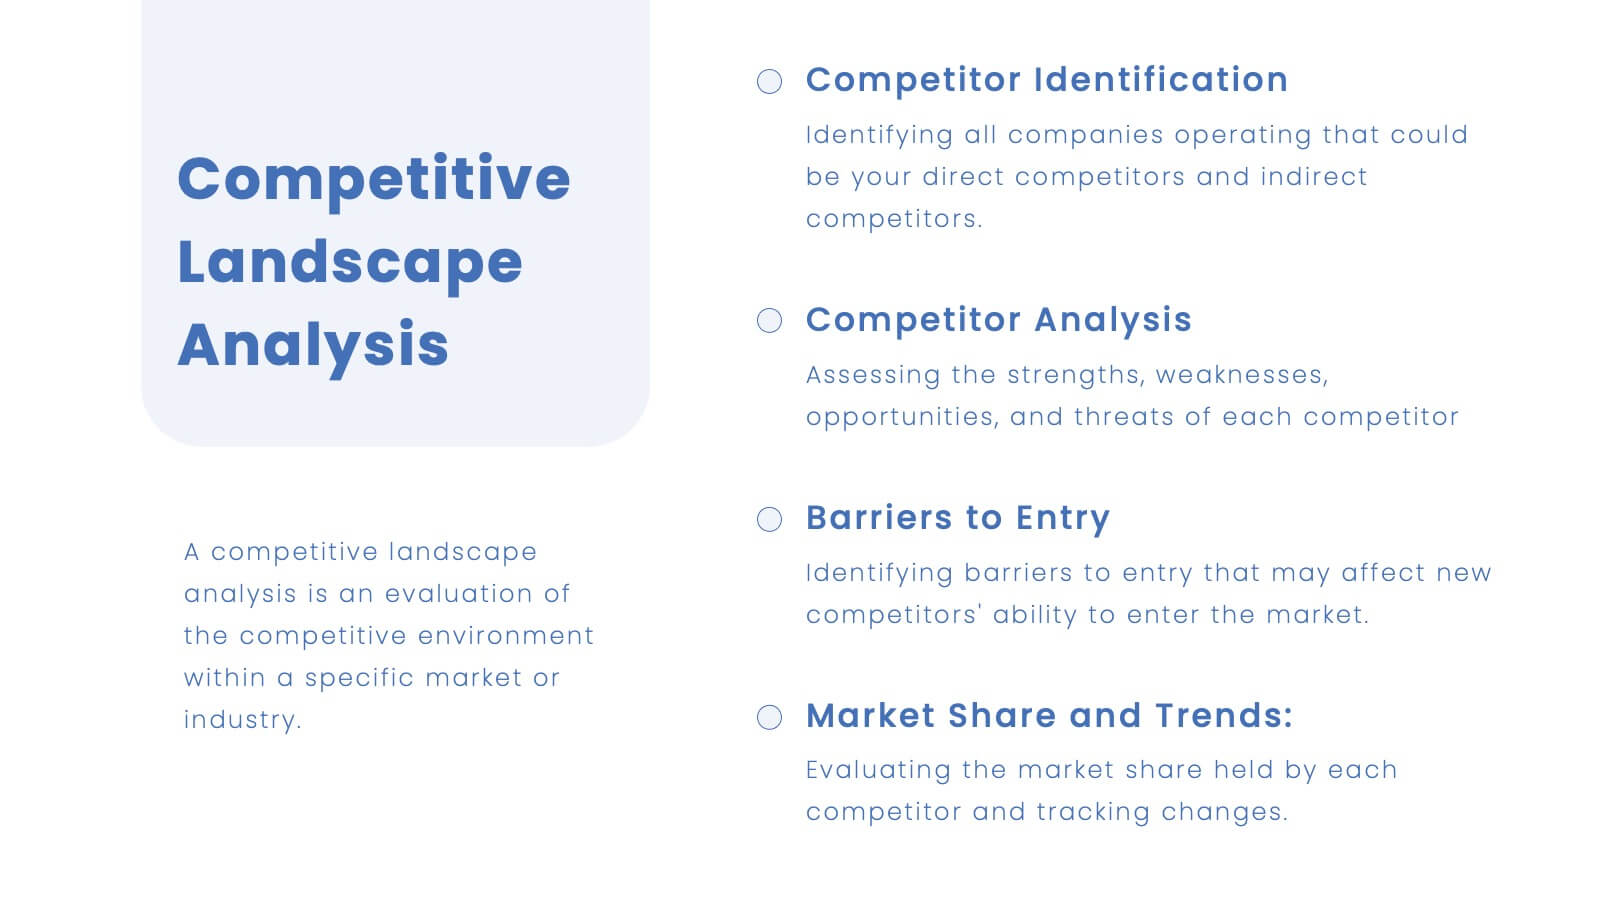
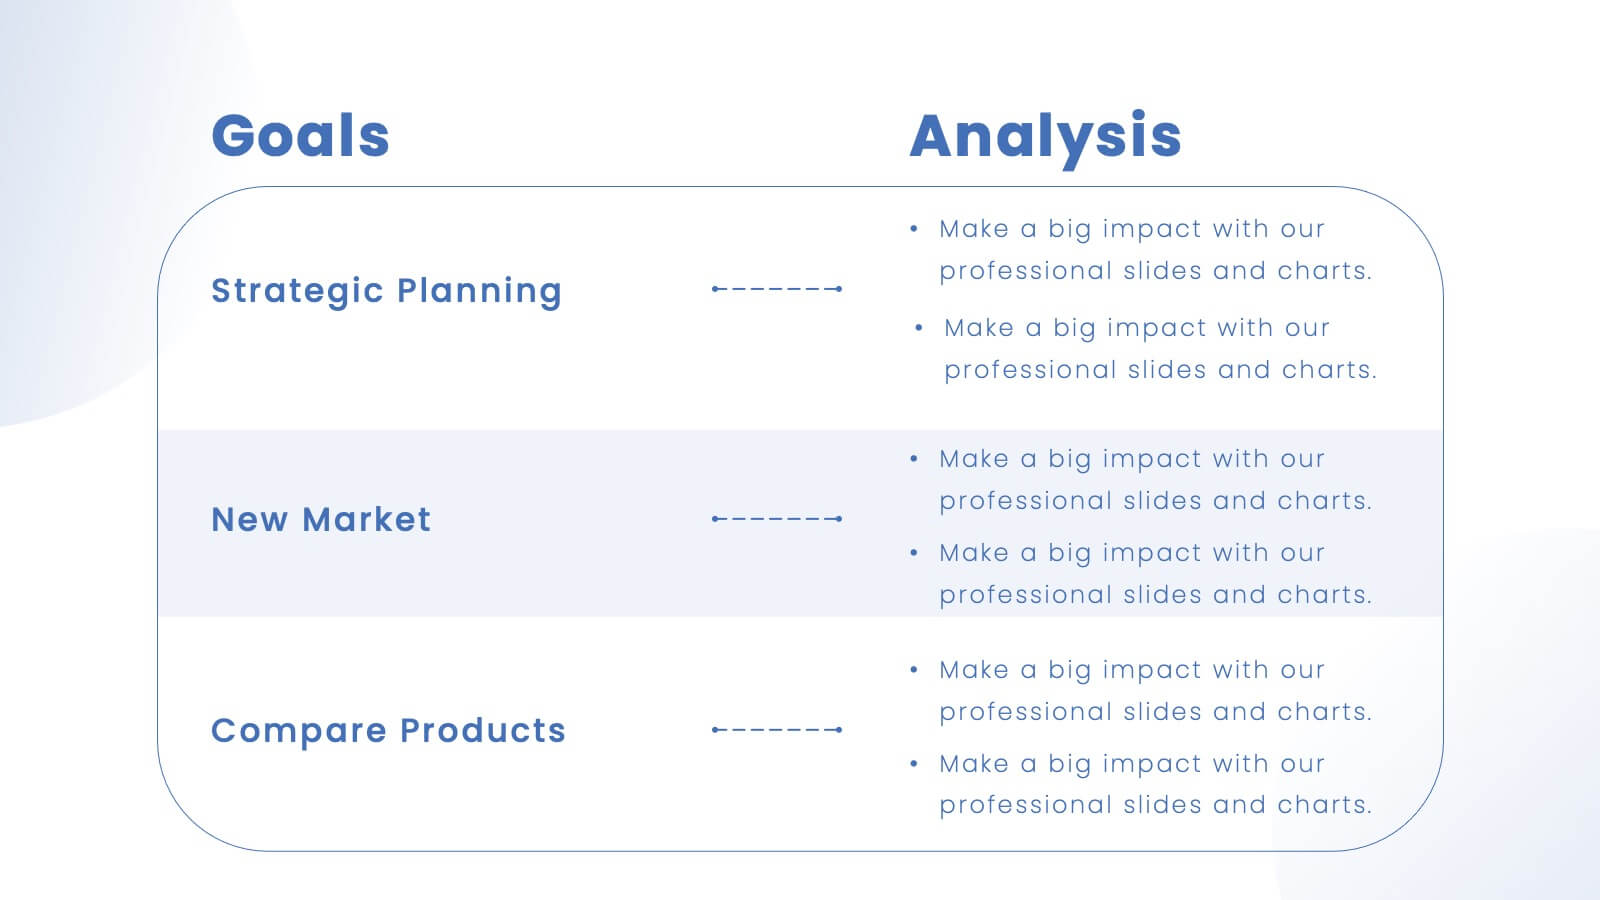
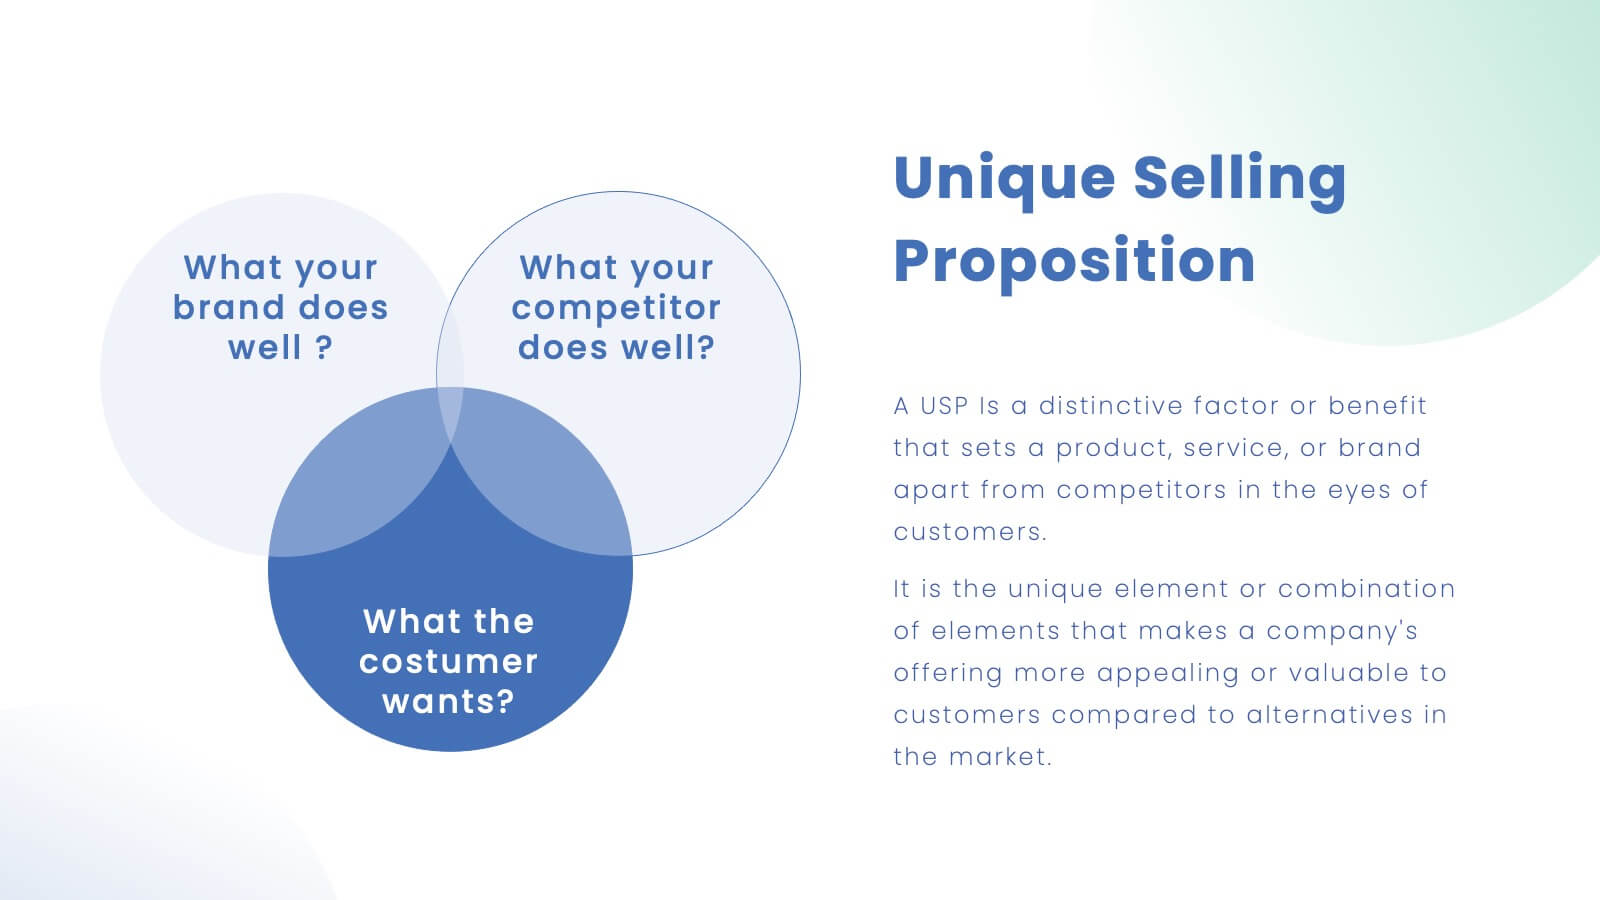
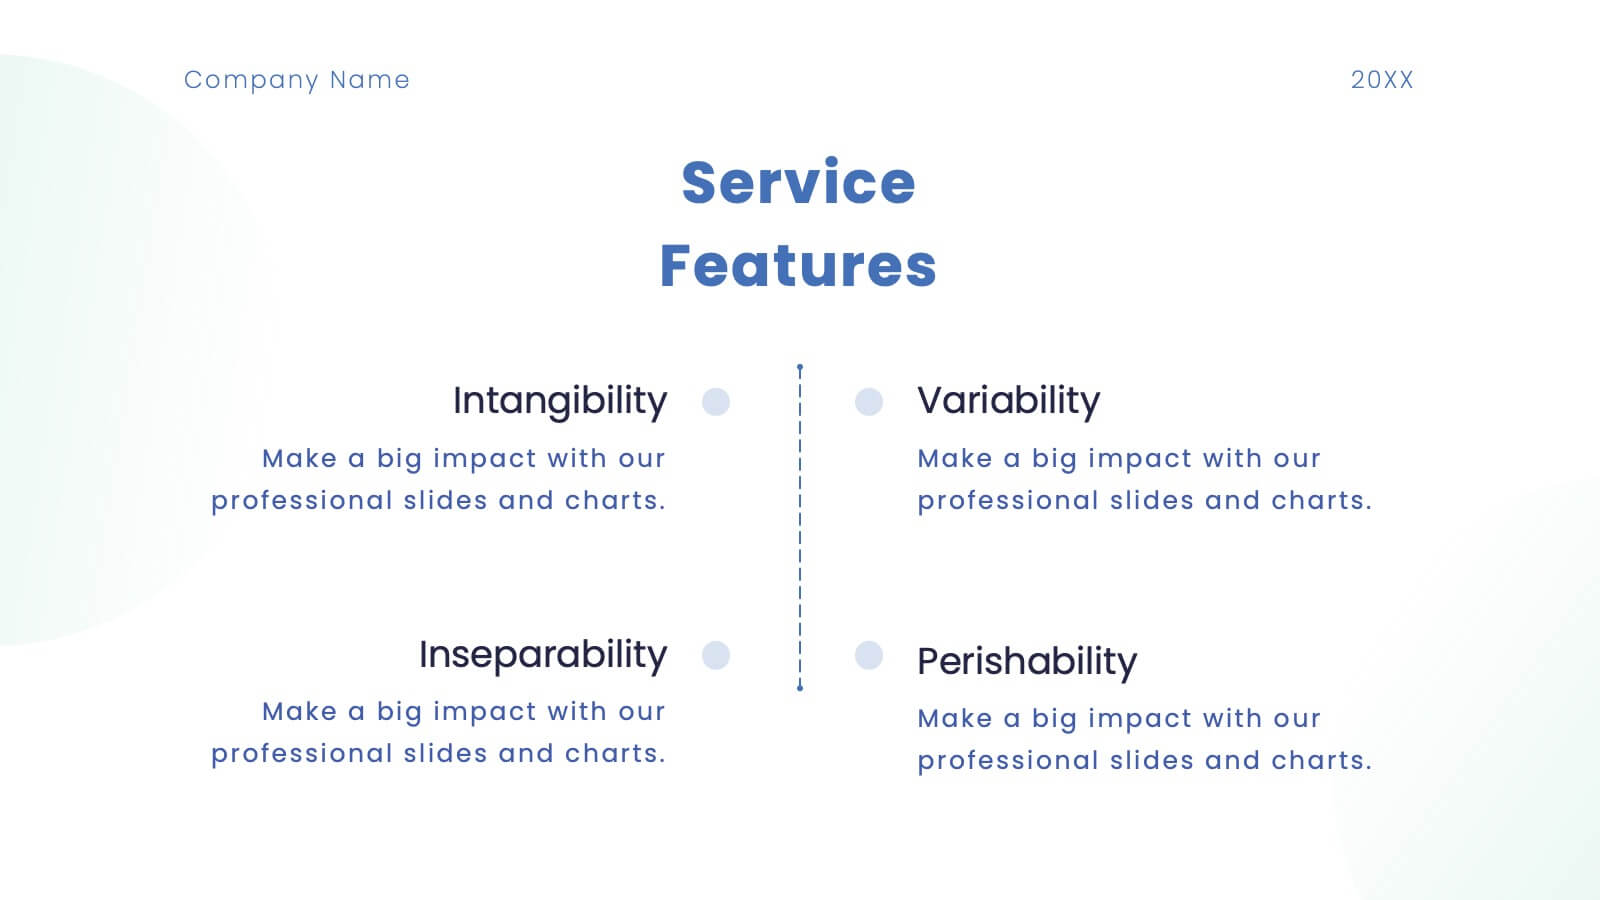
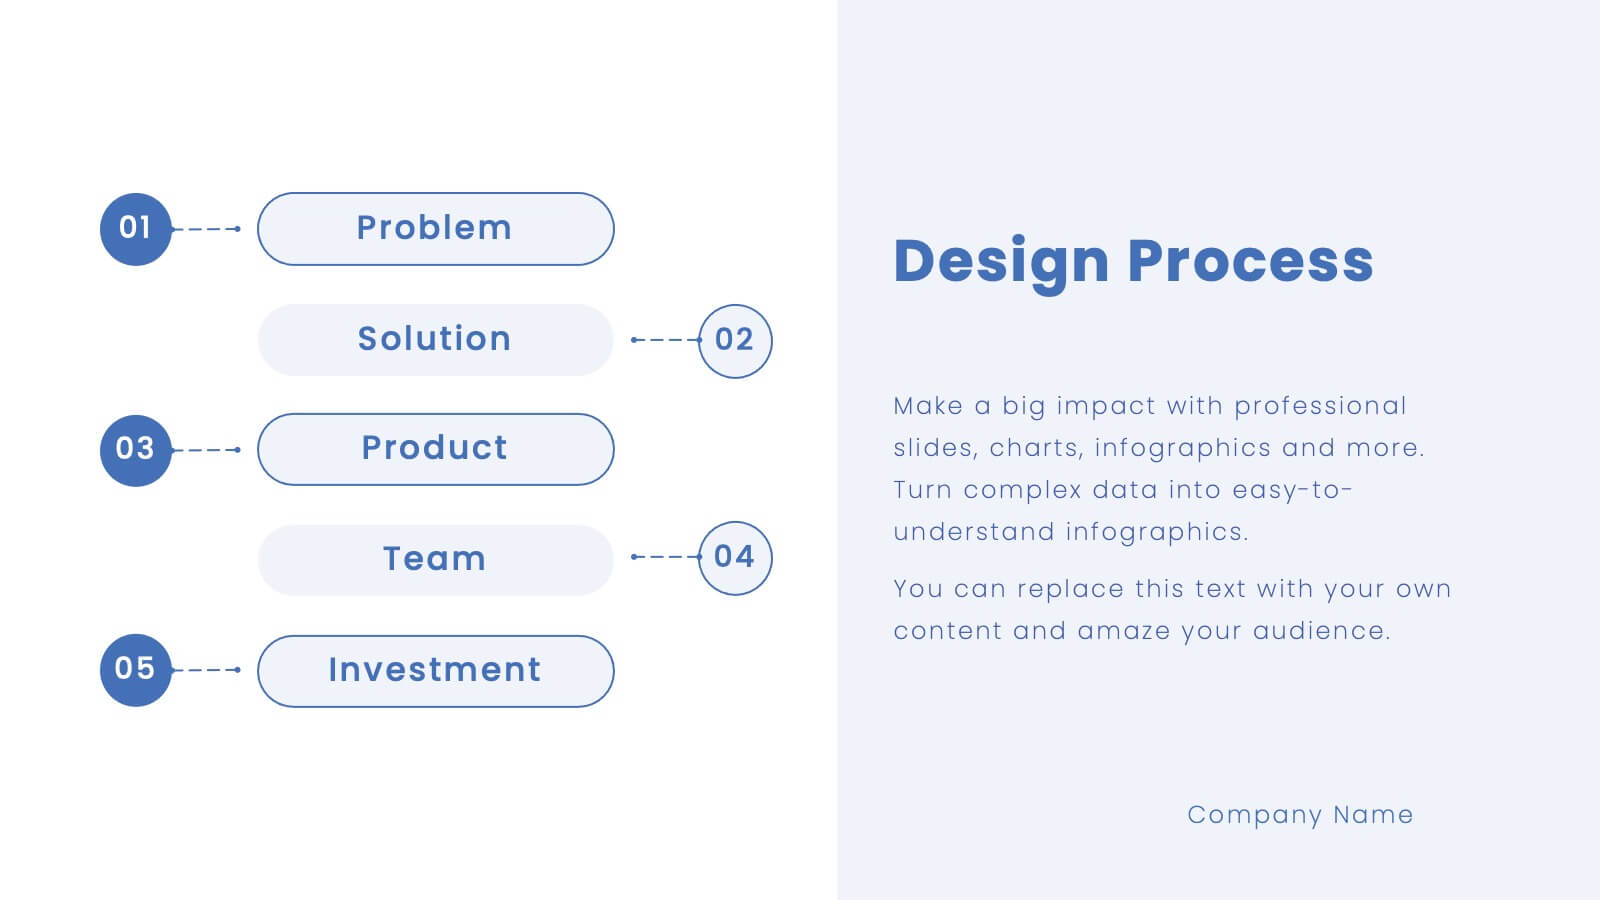
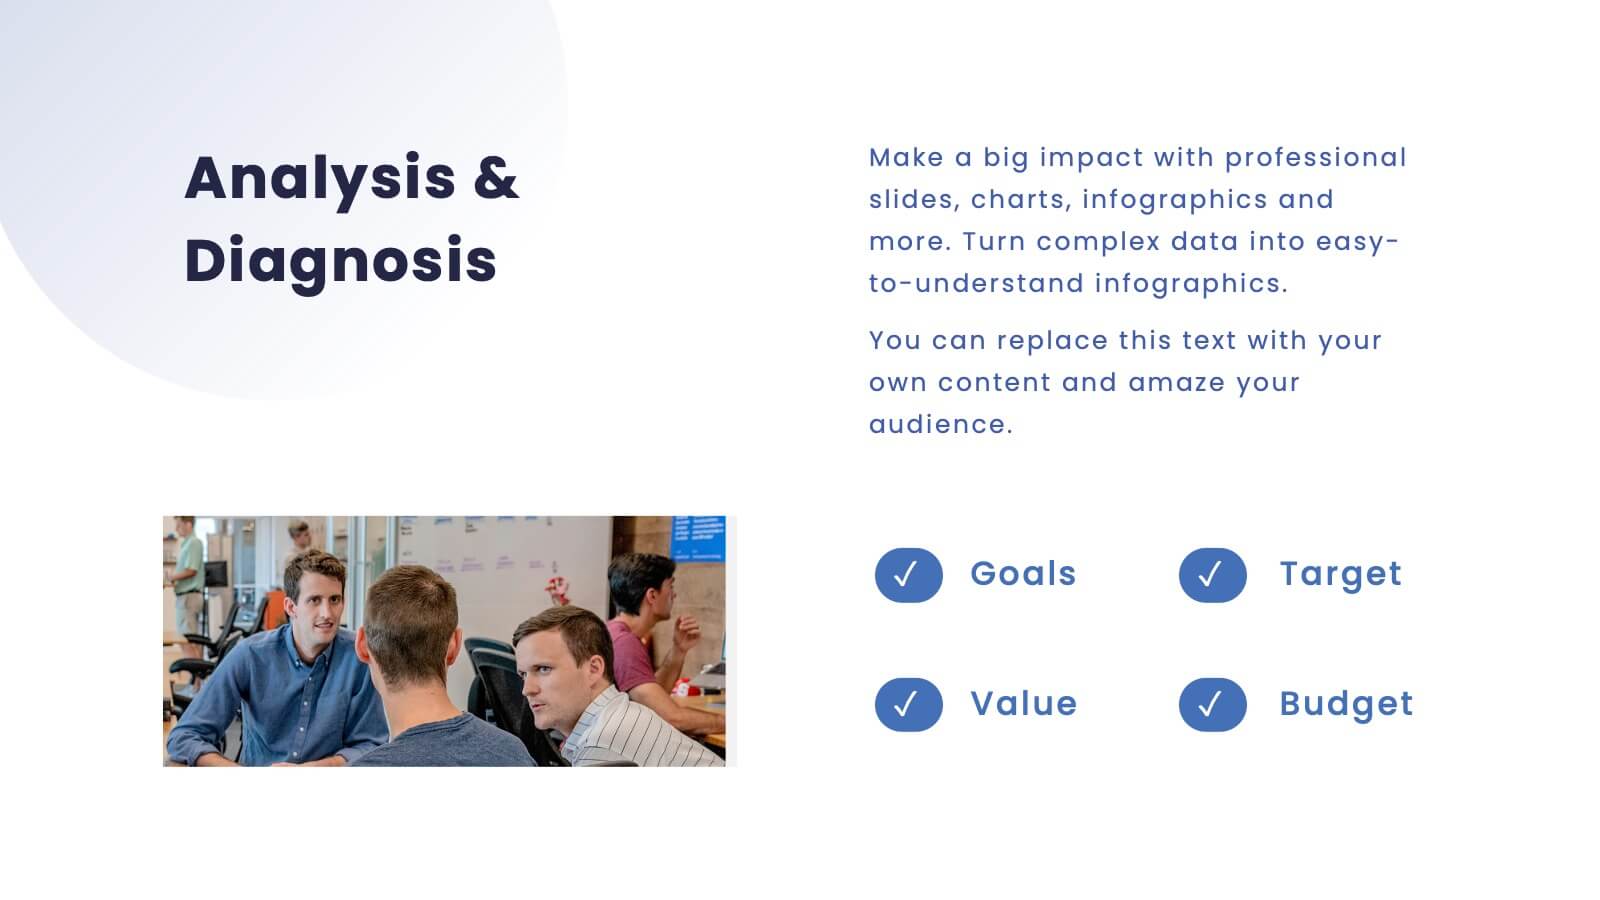
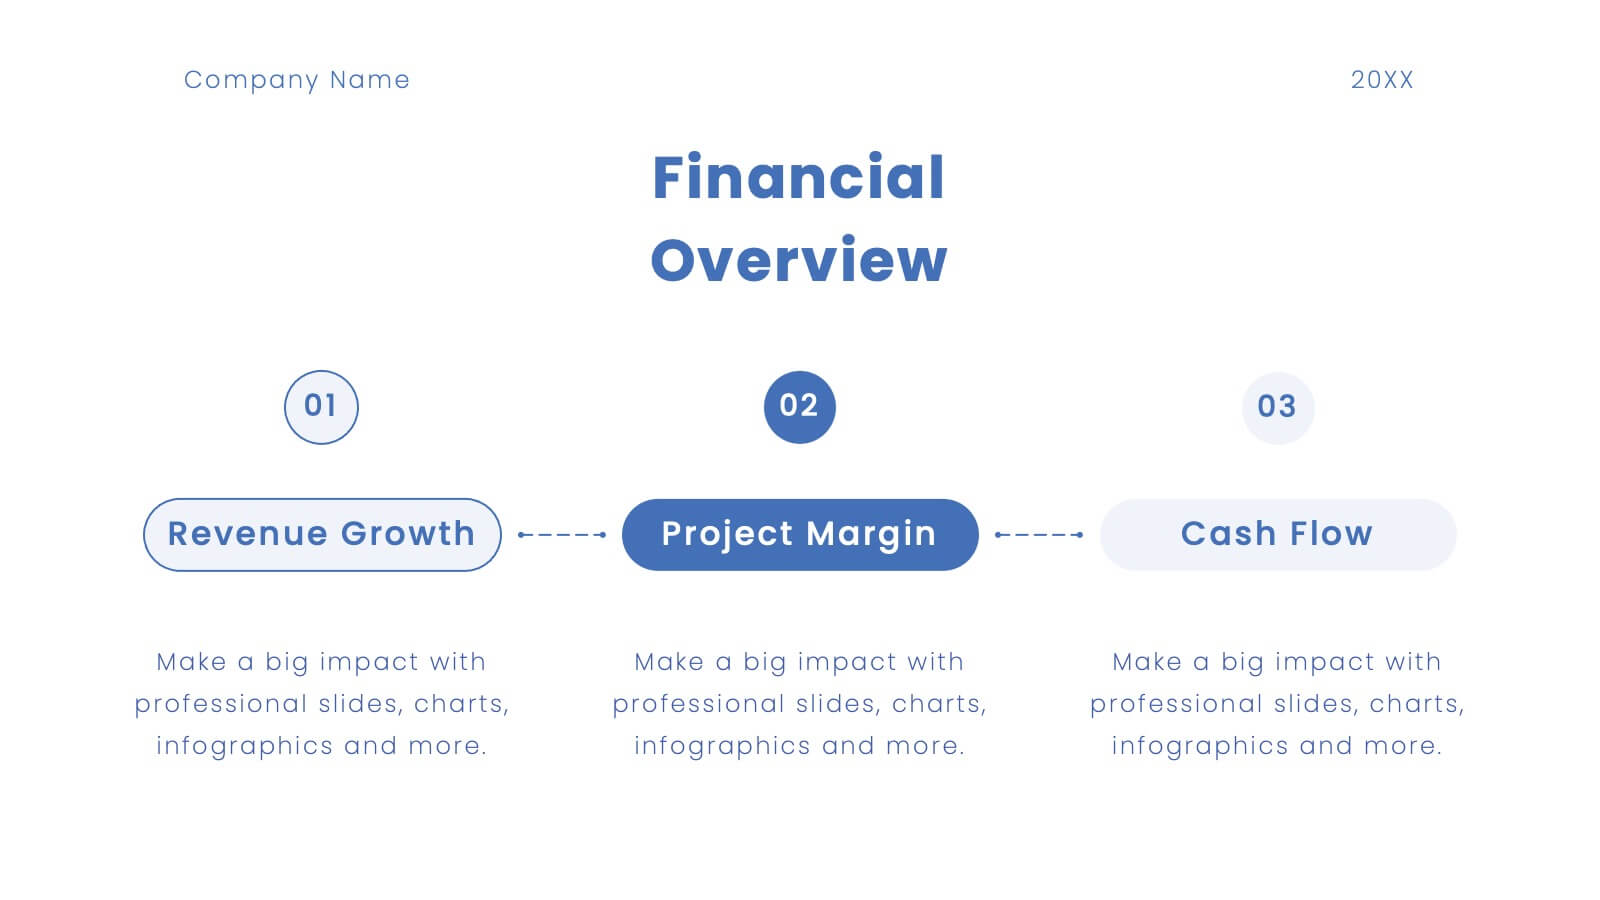
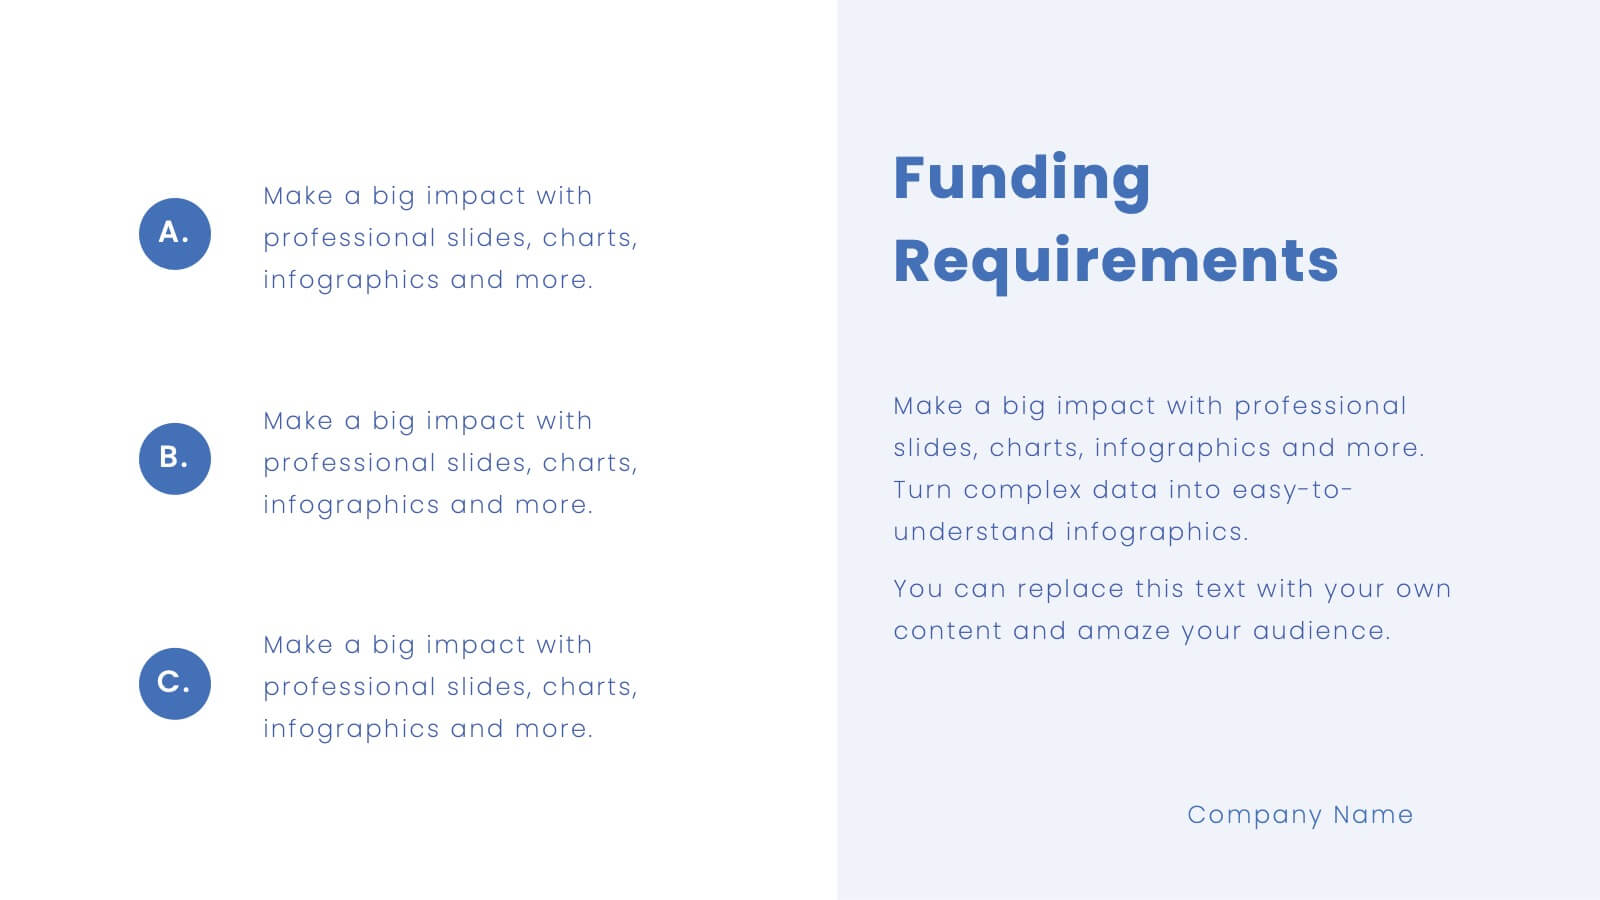
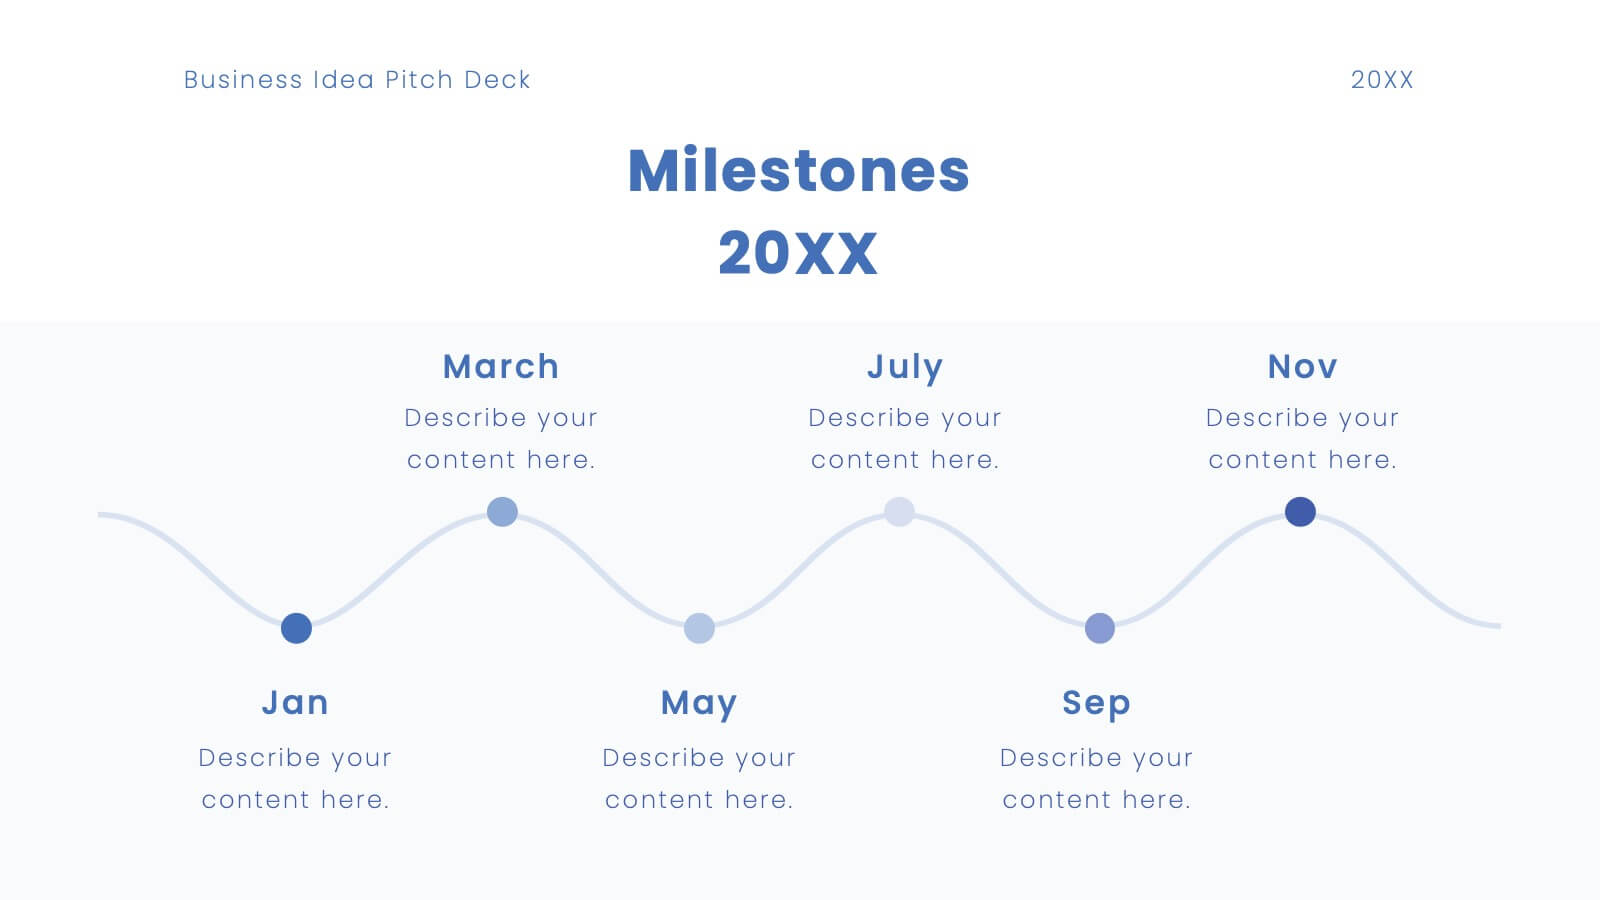
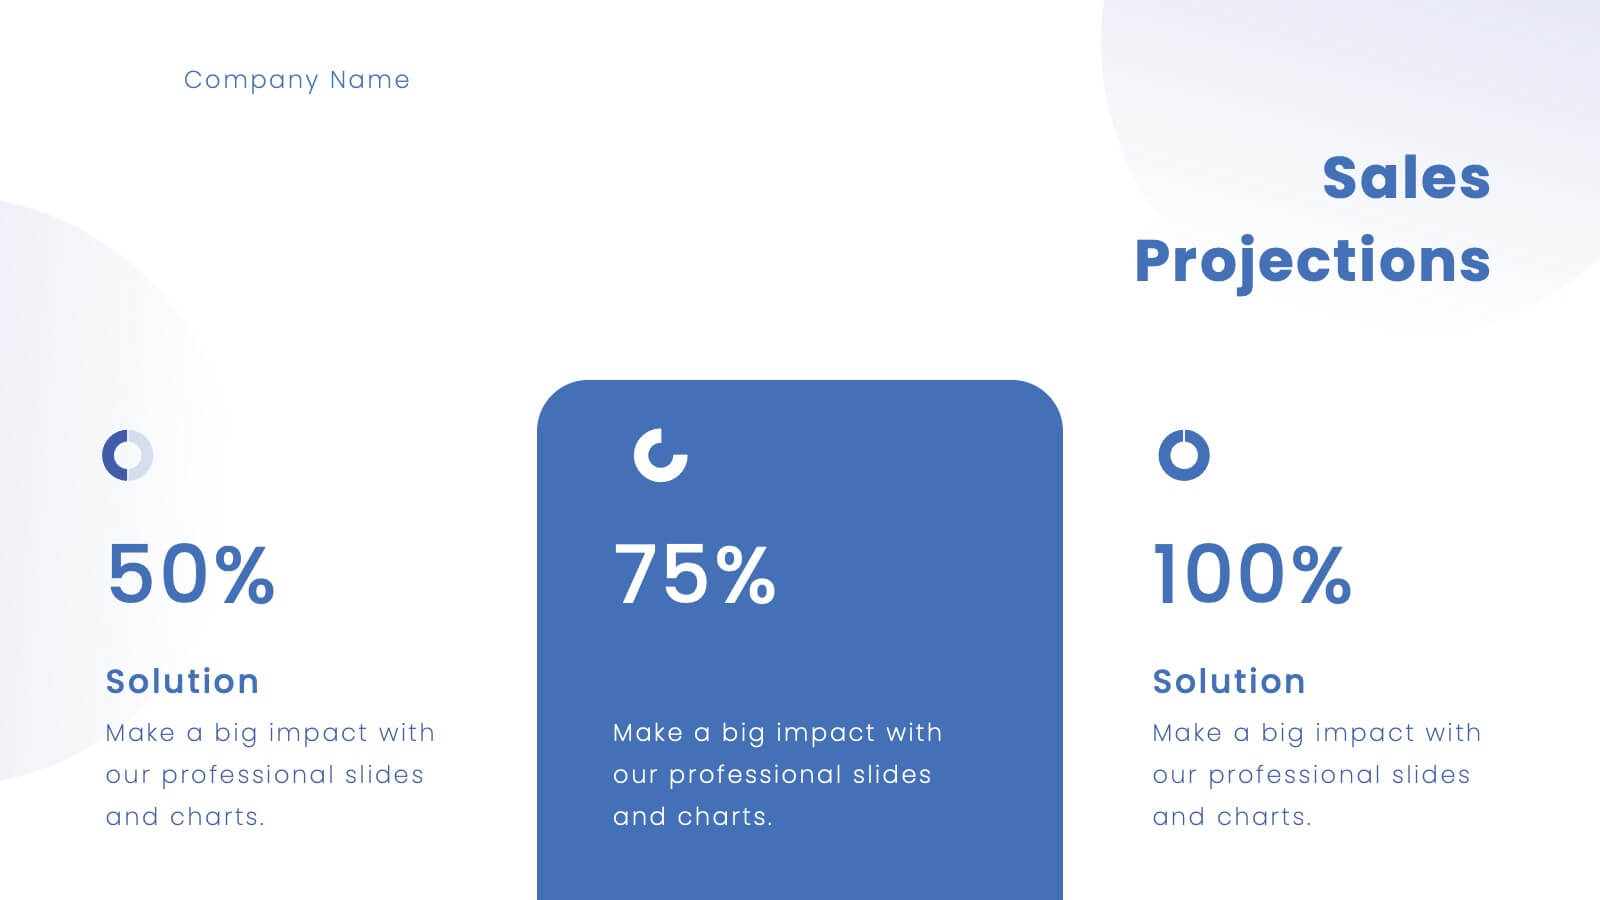
Platinum Business Idea Pitch Deck Presentation
Present your business idea with this sleek and professional pitch deck template! It includes everything from market opportunities to financial projections and sales strategies, providing a comprehensive structure for your pitch. Fully customizable and compatible with PowerPoint, Keynote, and Google Slides, this template is ideal for impressing investors and stakeholders.


6 diapositivas
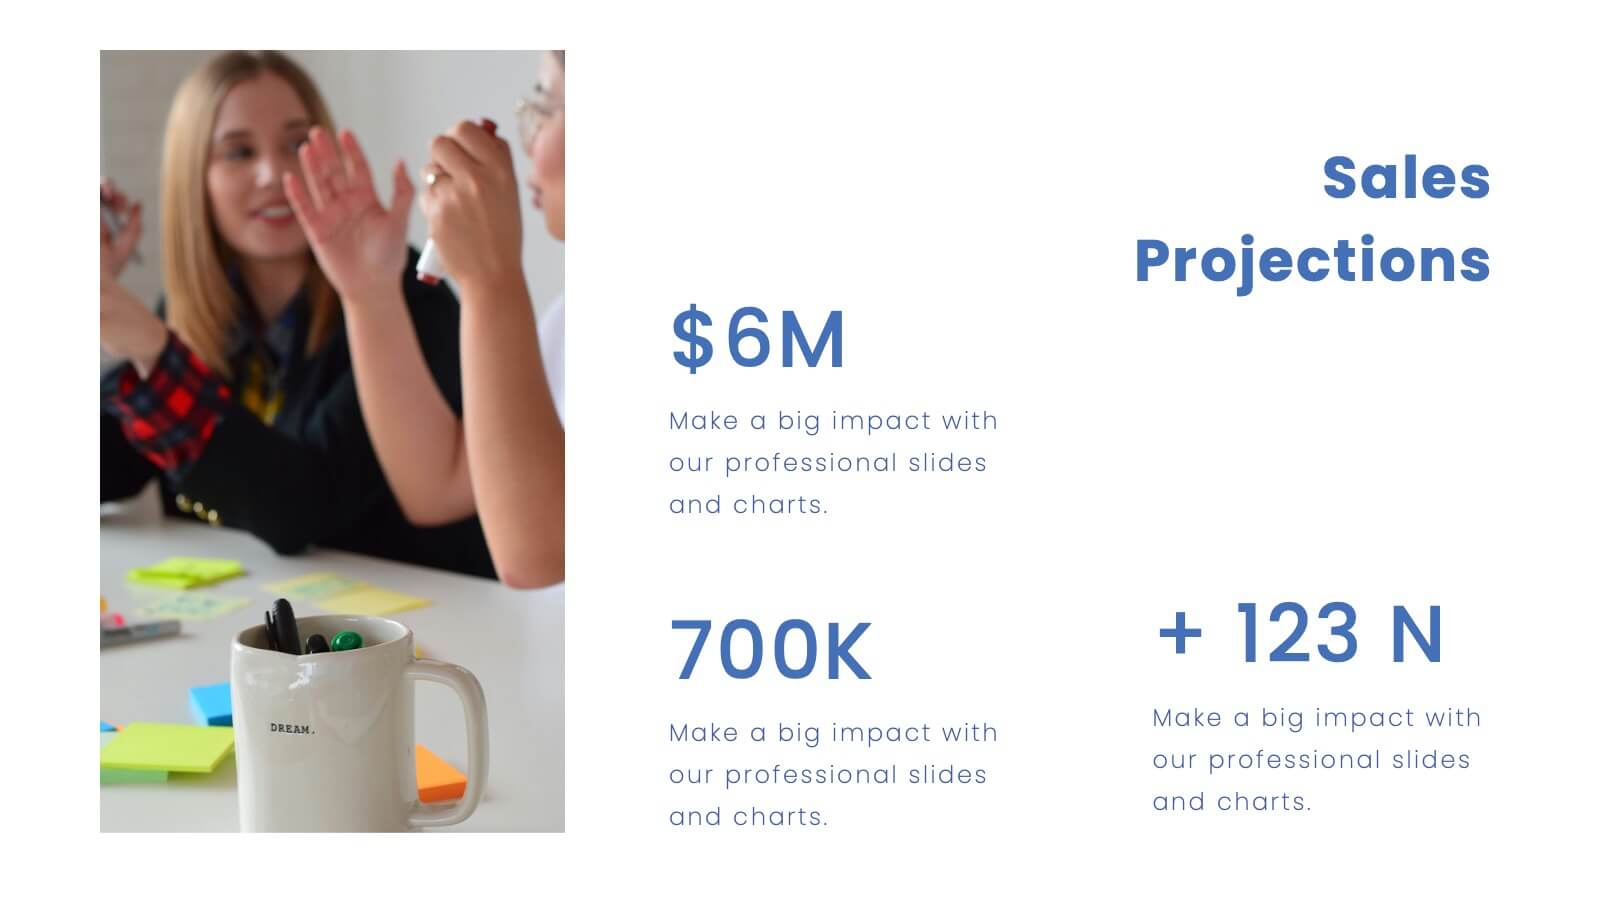
Professional Business Portfolio Presentation
Present your work with confidence using this sleek Professional Business Portfolio presentation. Designed to showcase your project highlights, performance data, and key insights, this layout features a clean two-column structure with space for visuals, icons, and statistics. Perfect for consultants, agencies, or entrepreneurs wanting to highlight business outcomes. Fully customizable and compatible with PowerPoint, Keynote, and Google Slides.


4 diapositivas
Points-Based Membership Program Strategy Presentation
Communicate your rewards system with clarity using the Points-Based Membership Program Strategy presentation. This visual template is ideal for outlining tiered rewards, point accumulation methods, and redemption mechanics through a clean, card-themed layout. Perfect for loyalty teams, marketing strategists, and membership programs. Fully editable in PowerPoint, Keynote, and Google Slides.


6 diapositivas
Effective Team Structure Guide Presentation
Visualize your team's structure with clarity using this team guide presentation. Designed for highlighting roles, connections, and reporting lines, each slide helps communicate responsibilities and hierarchy efficiently. Ideal for HR, managers, and team leads. Fully editable in PowerPoint, Keynote, and Google Slides—customize colors, names, and positions with ease.


5 diapositivas
Responsibility Assignment Using RACI Model Presentation
Visualize role clarity with the Responsibility Assignment Using RACI Model Presentation. This template helps define team responsibilities across four key roles—Responsible, Accountable, Consulted, and Informed—in a simple and clean radial layout. Ideal for aligning teams, assigning tasks, and preventing confusion. Fully customizable in PowerPoint, Canva, and Google Slides.


22 diapositivas
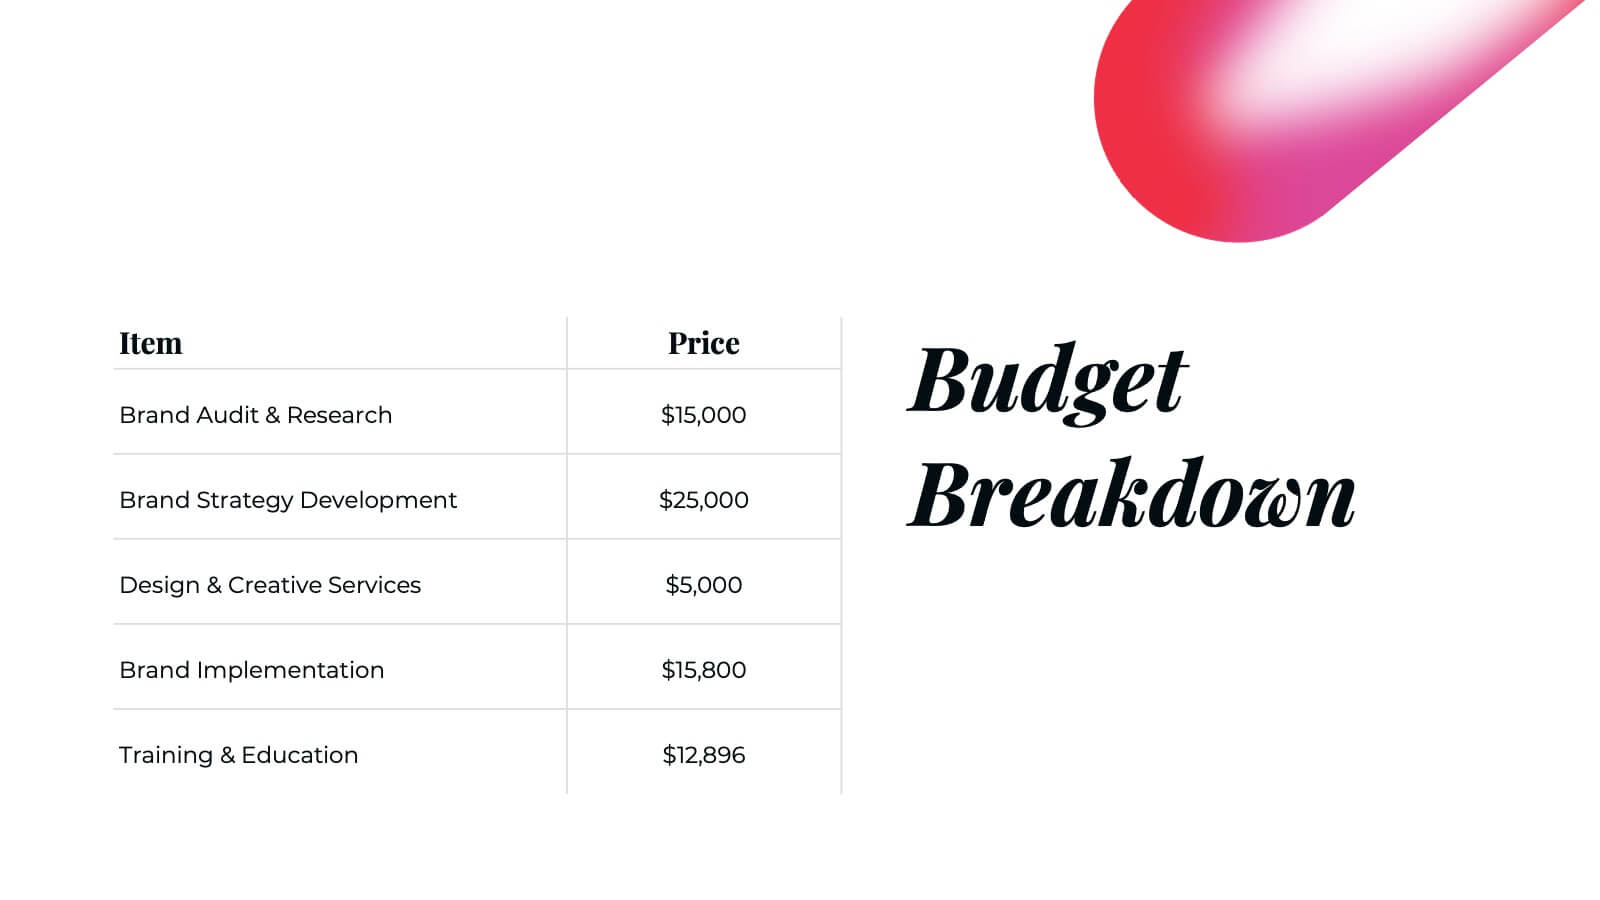
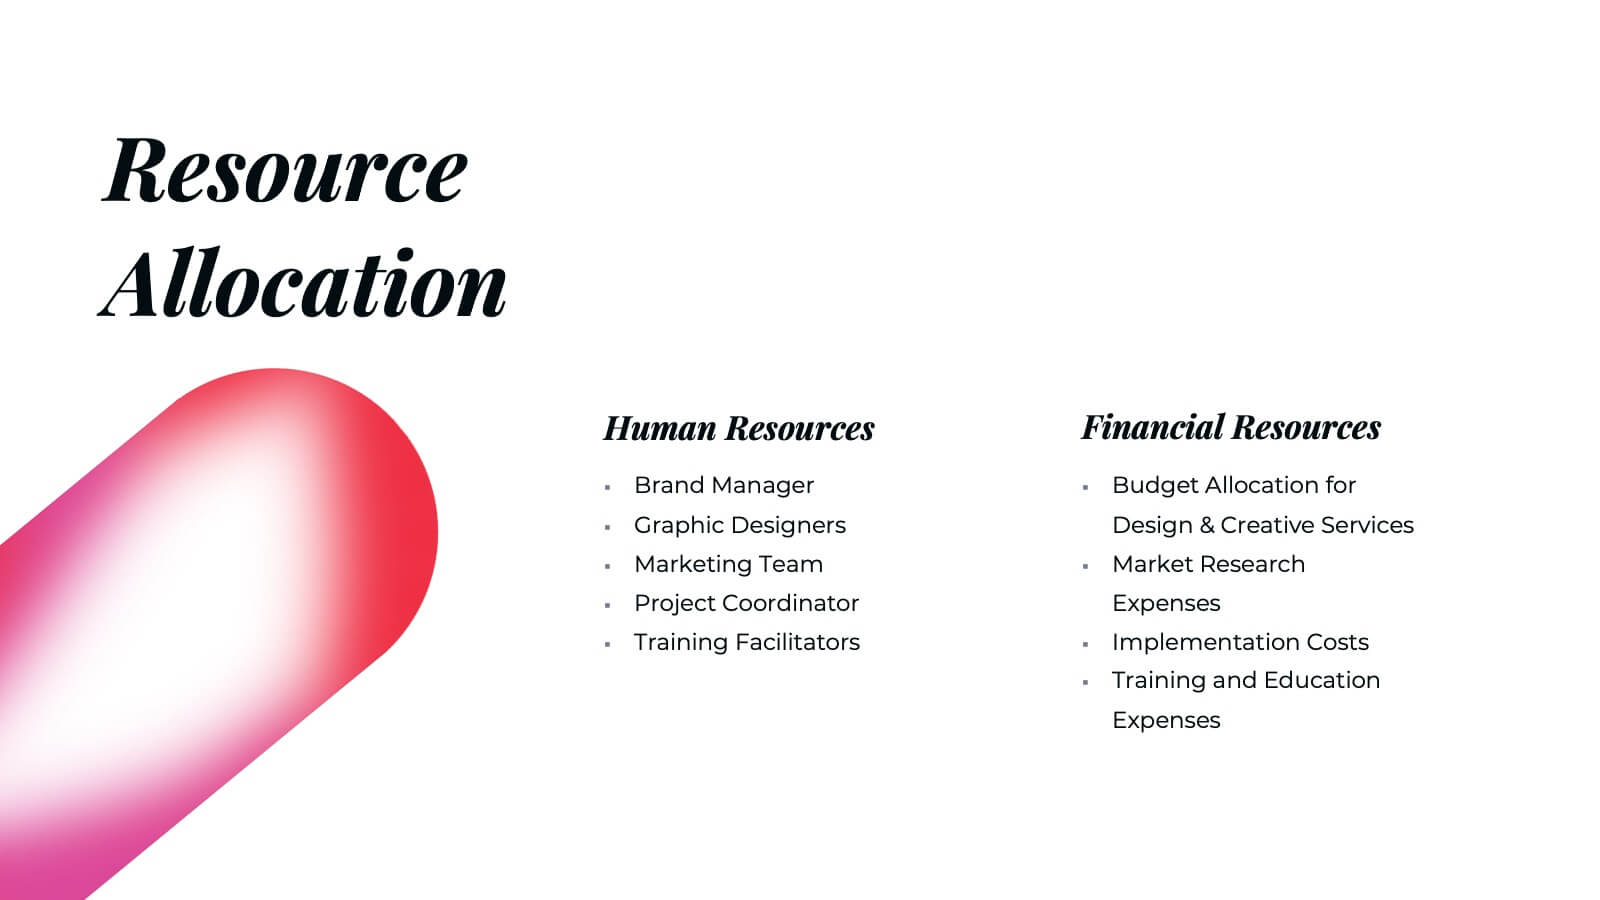
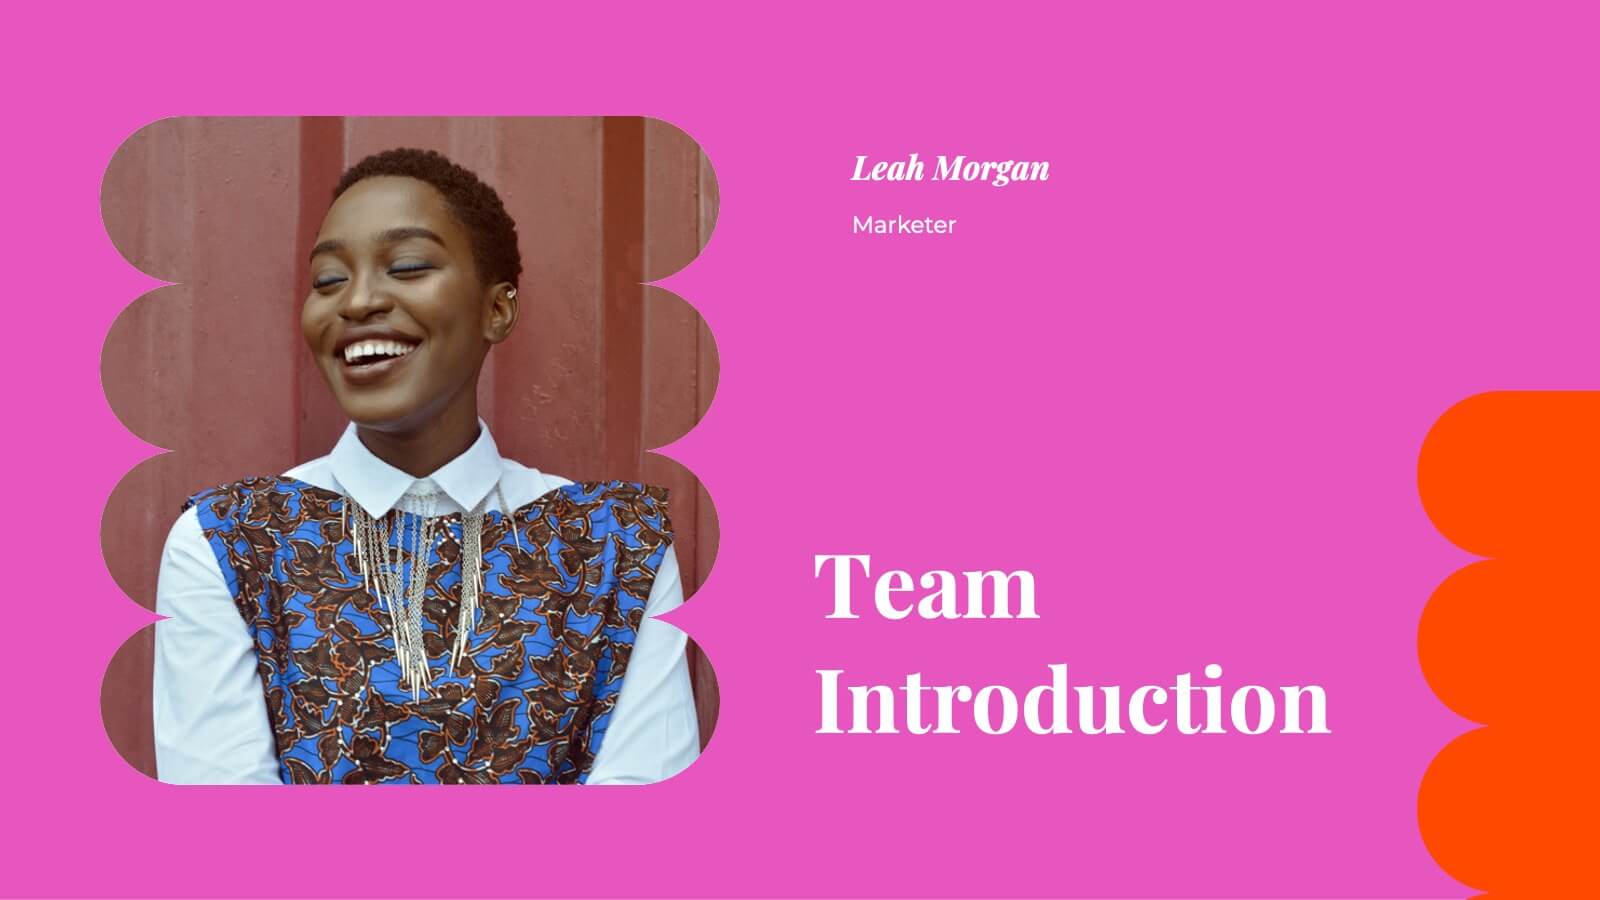
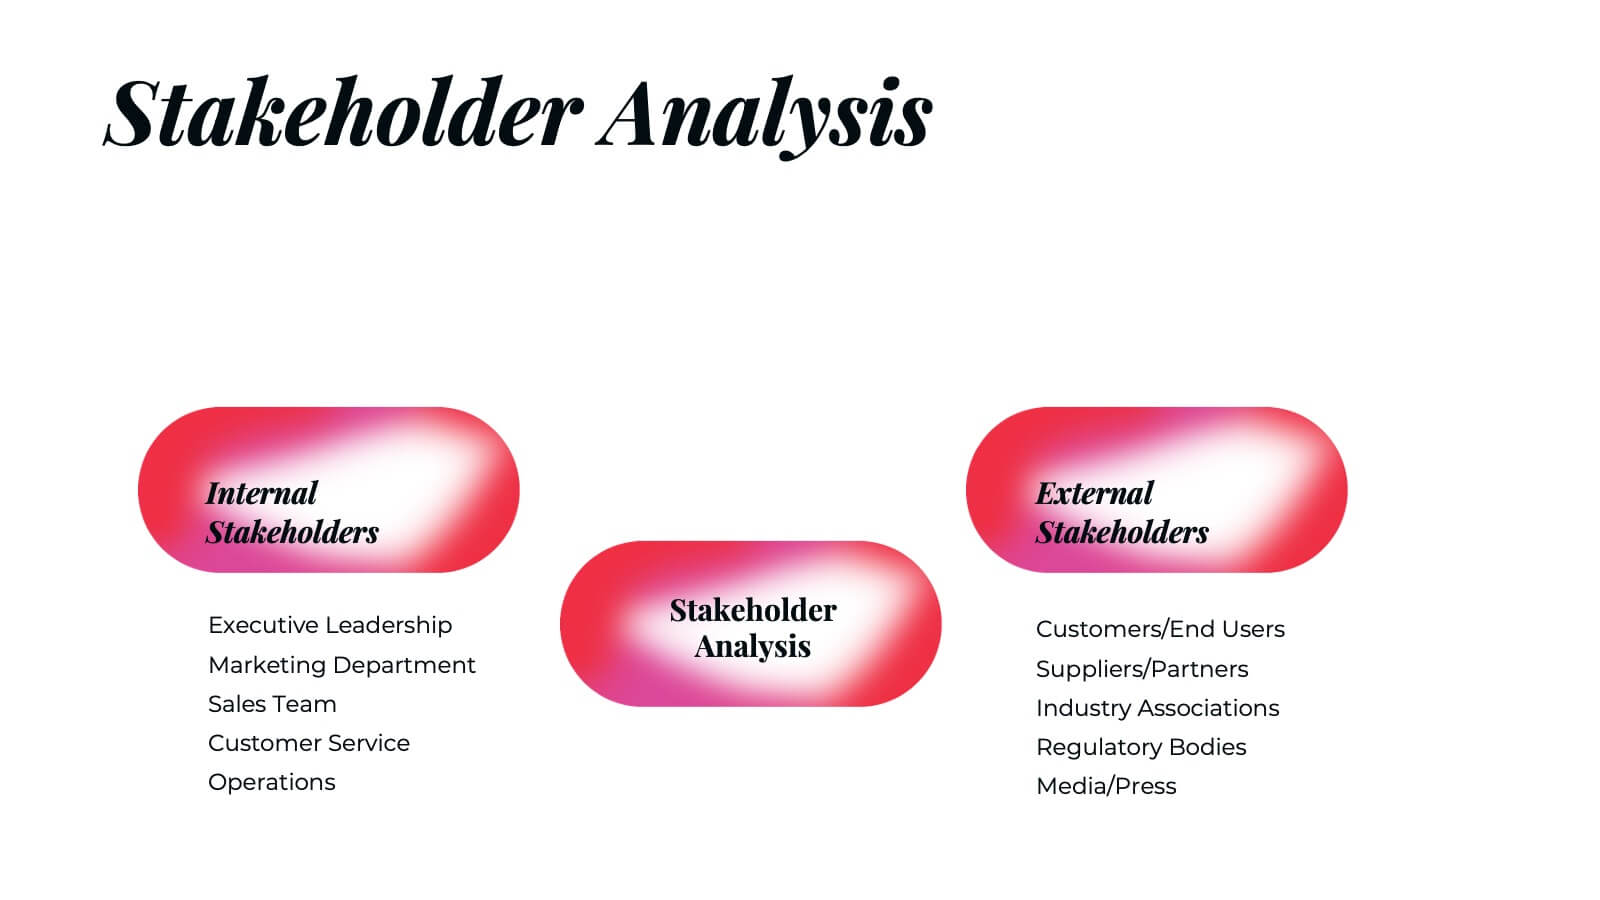
Moonstone Detailed Project Execution Plan Presentation
Create a compelling project execution plan with this vibrant and well-structured presentation template! Covering every key aspect from problem statements and objectives to risk management and quality assurance, this template provides a clear roadmap for your project. It’s perfect for organizing timelines, budget breakdowns, and stakeholder analysis. Compatible with PowerPoint, Keynote, and Google Slides for smooth presentations.