


Características


¿Tienes alguna pregunta?
Recomendar


21 diapositivas
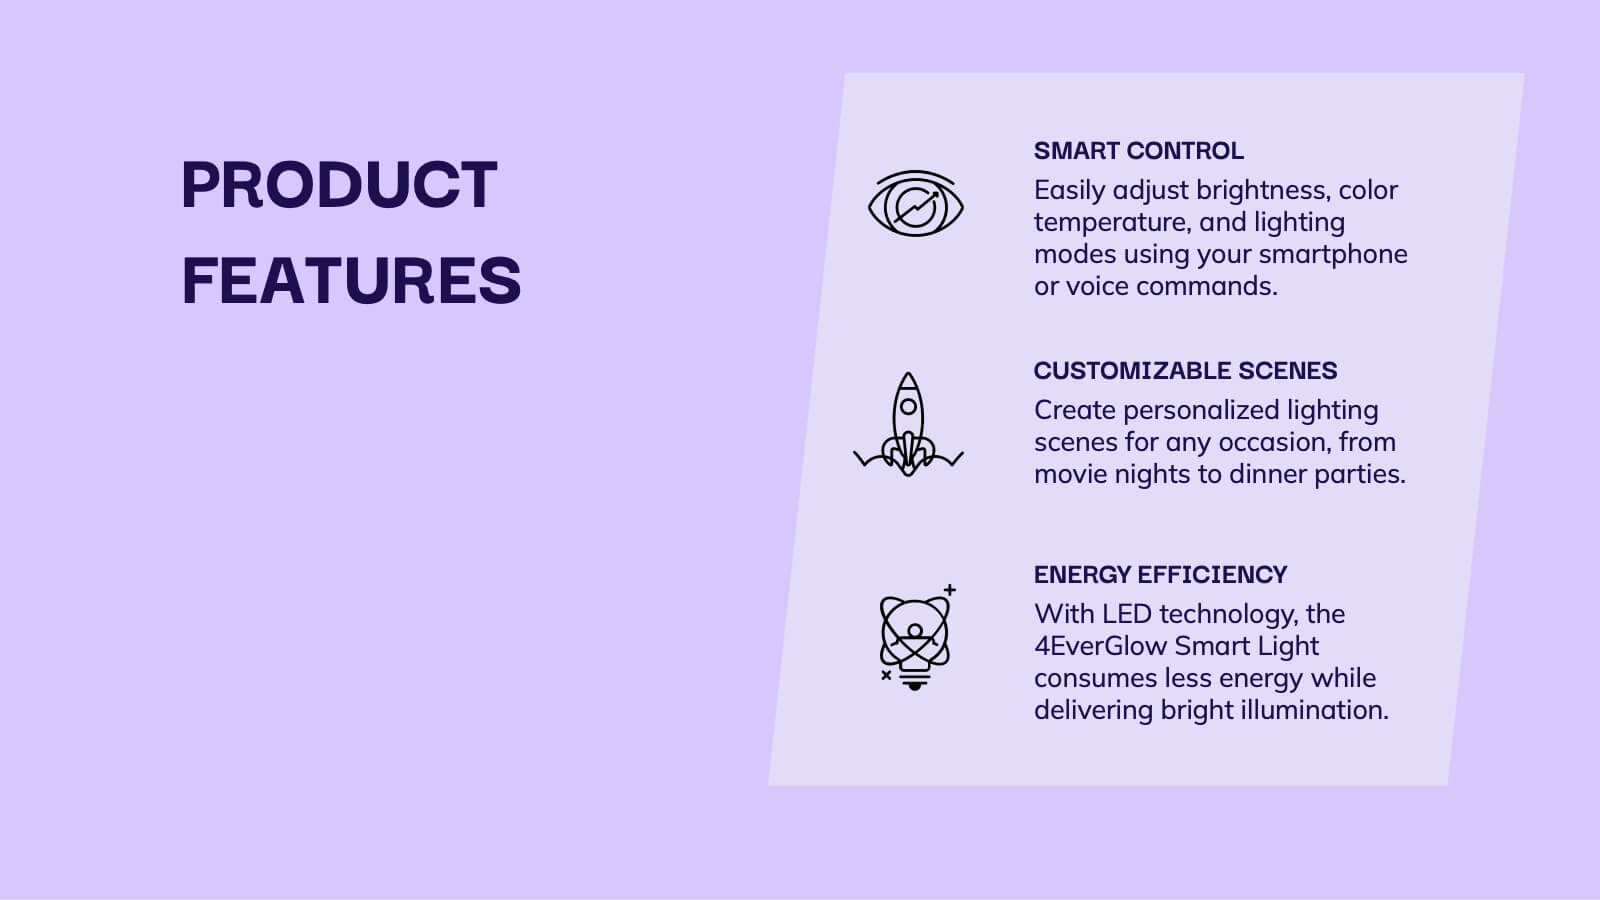
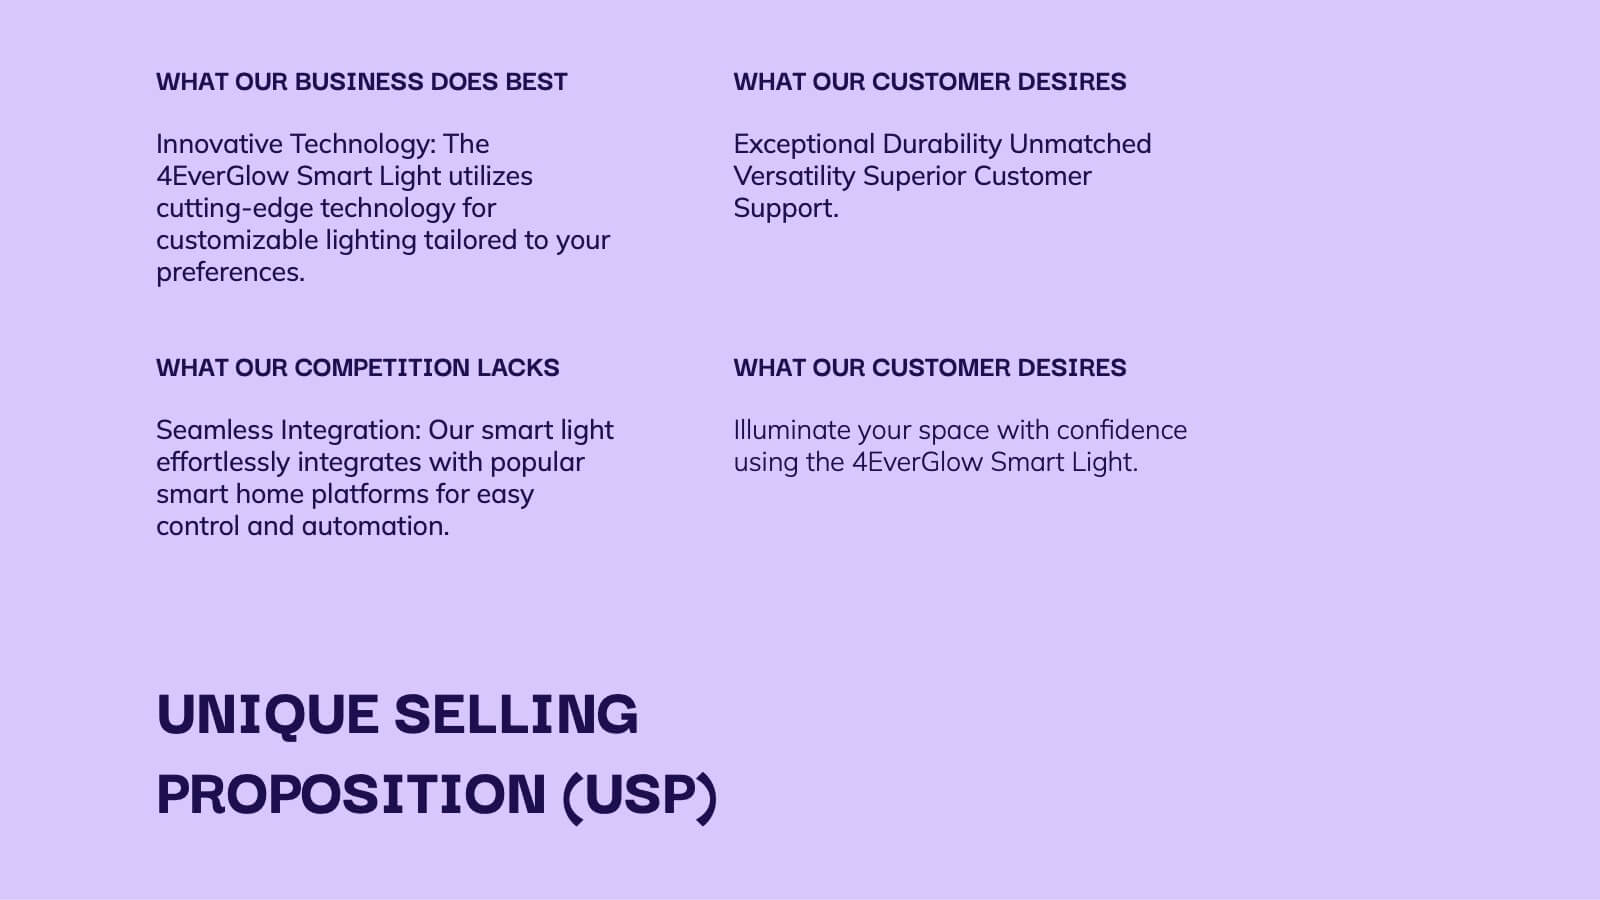
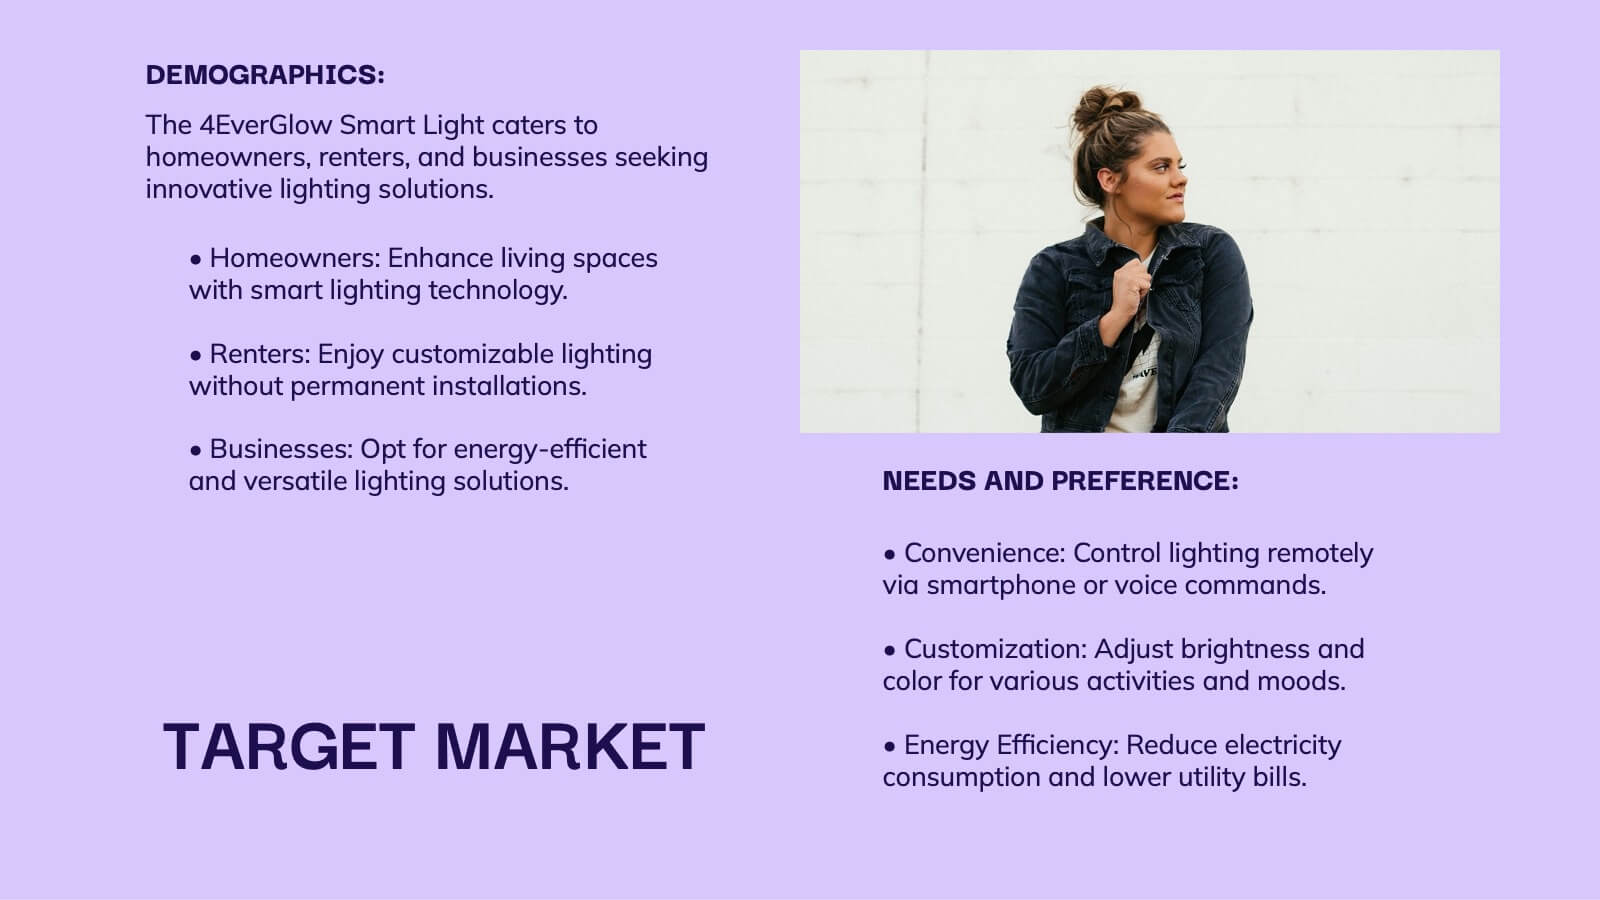
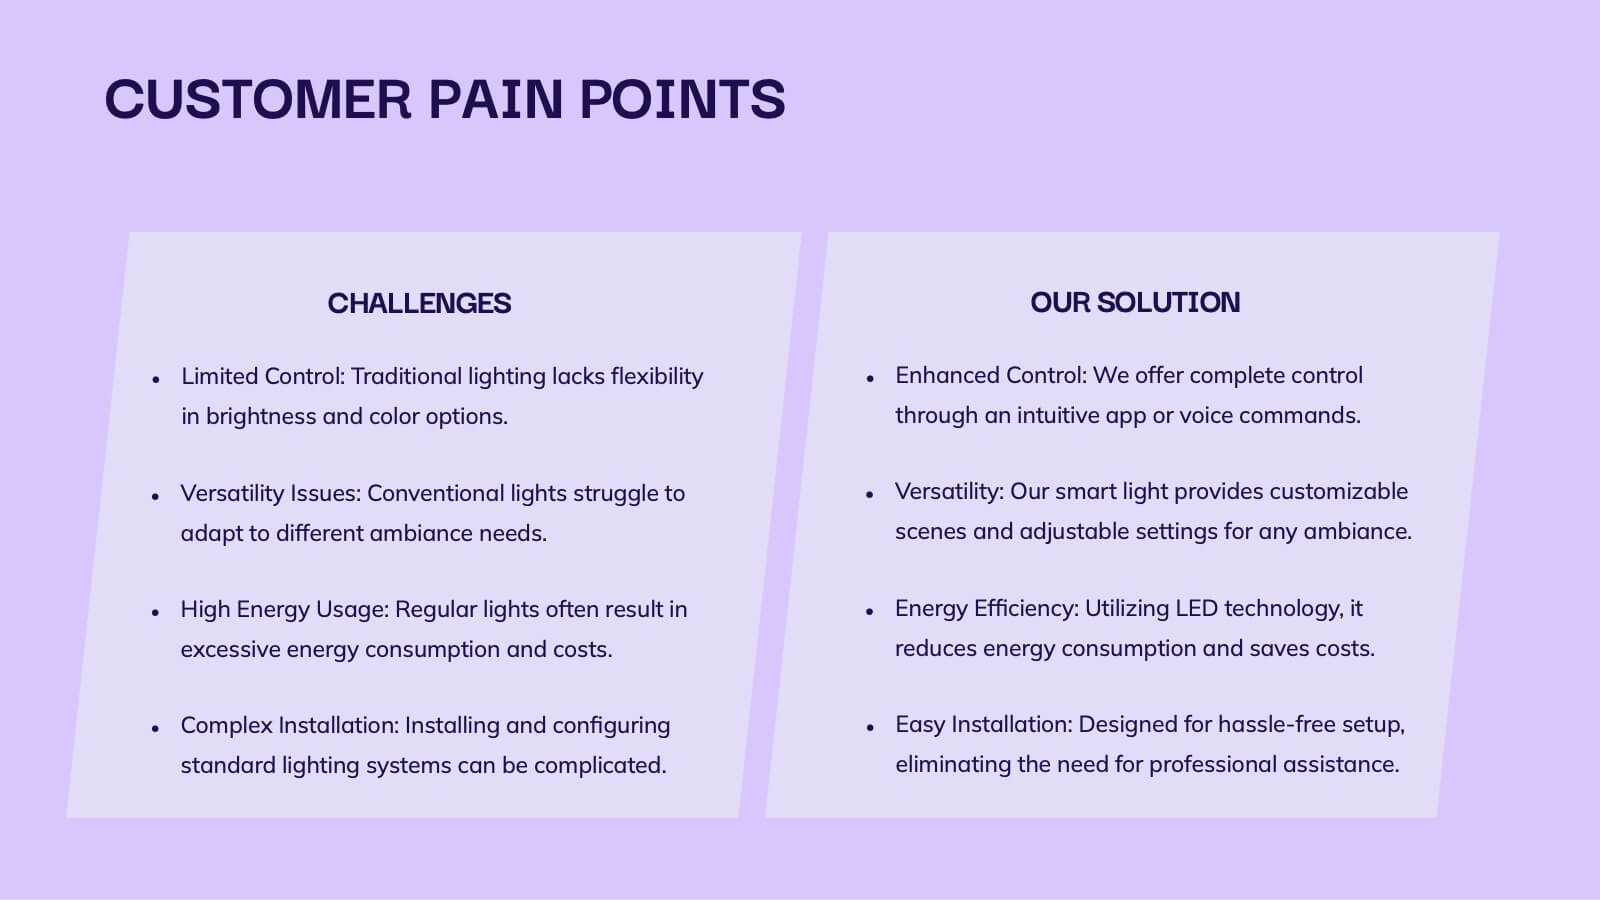
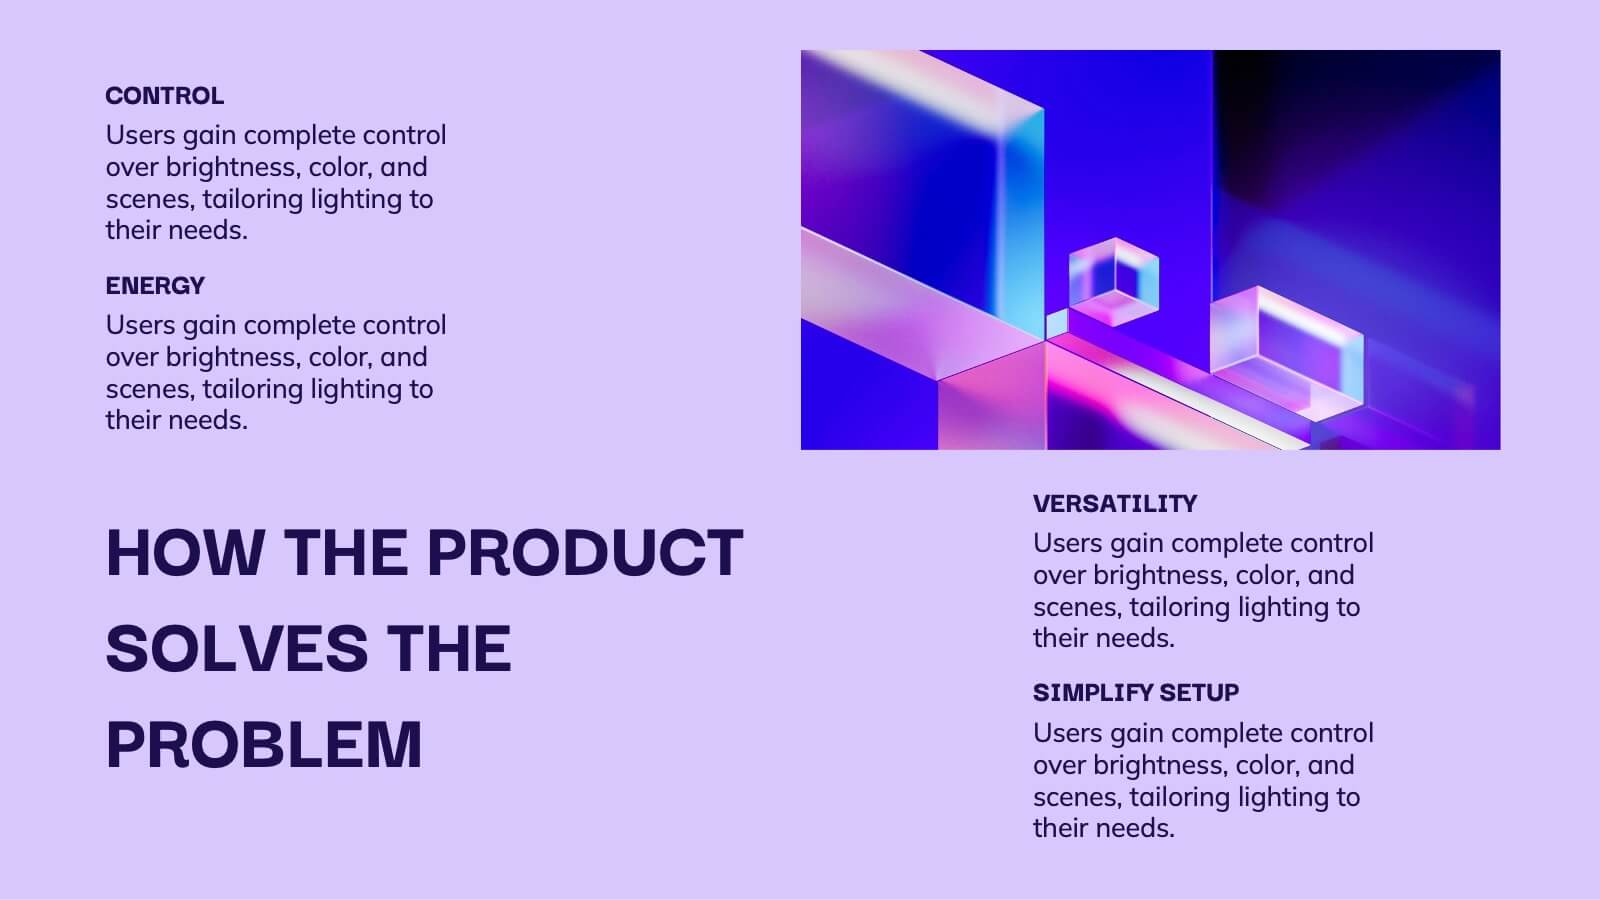
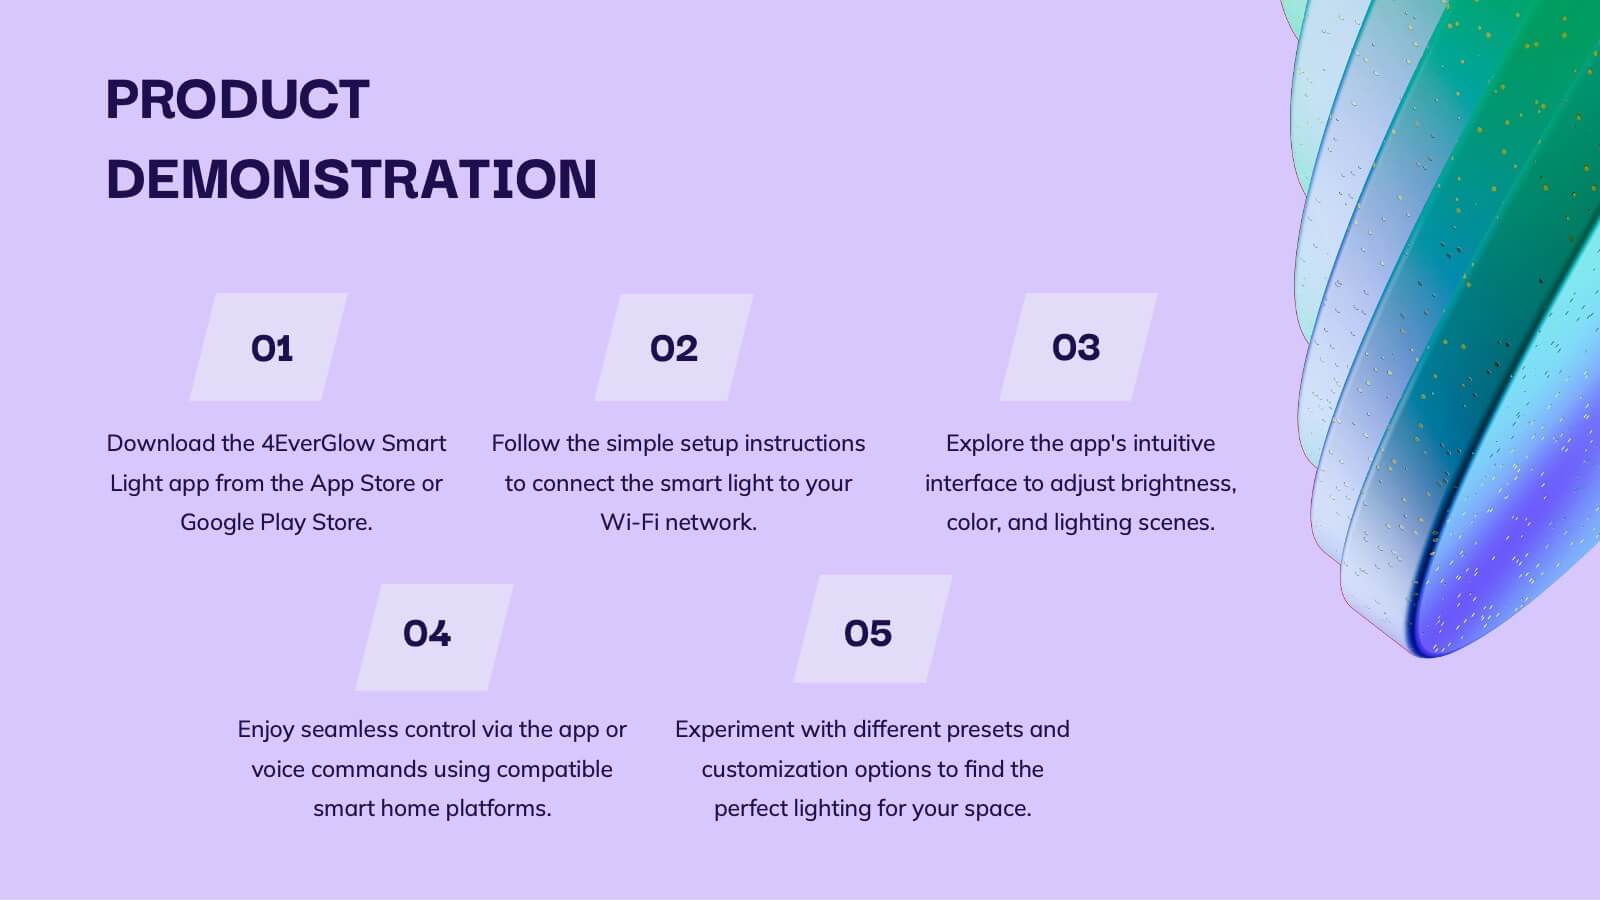
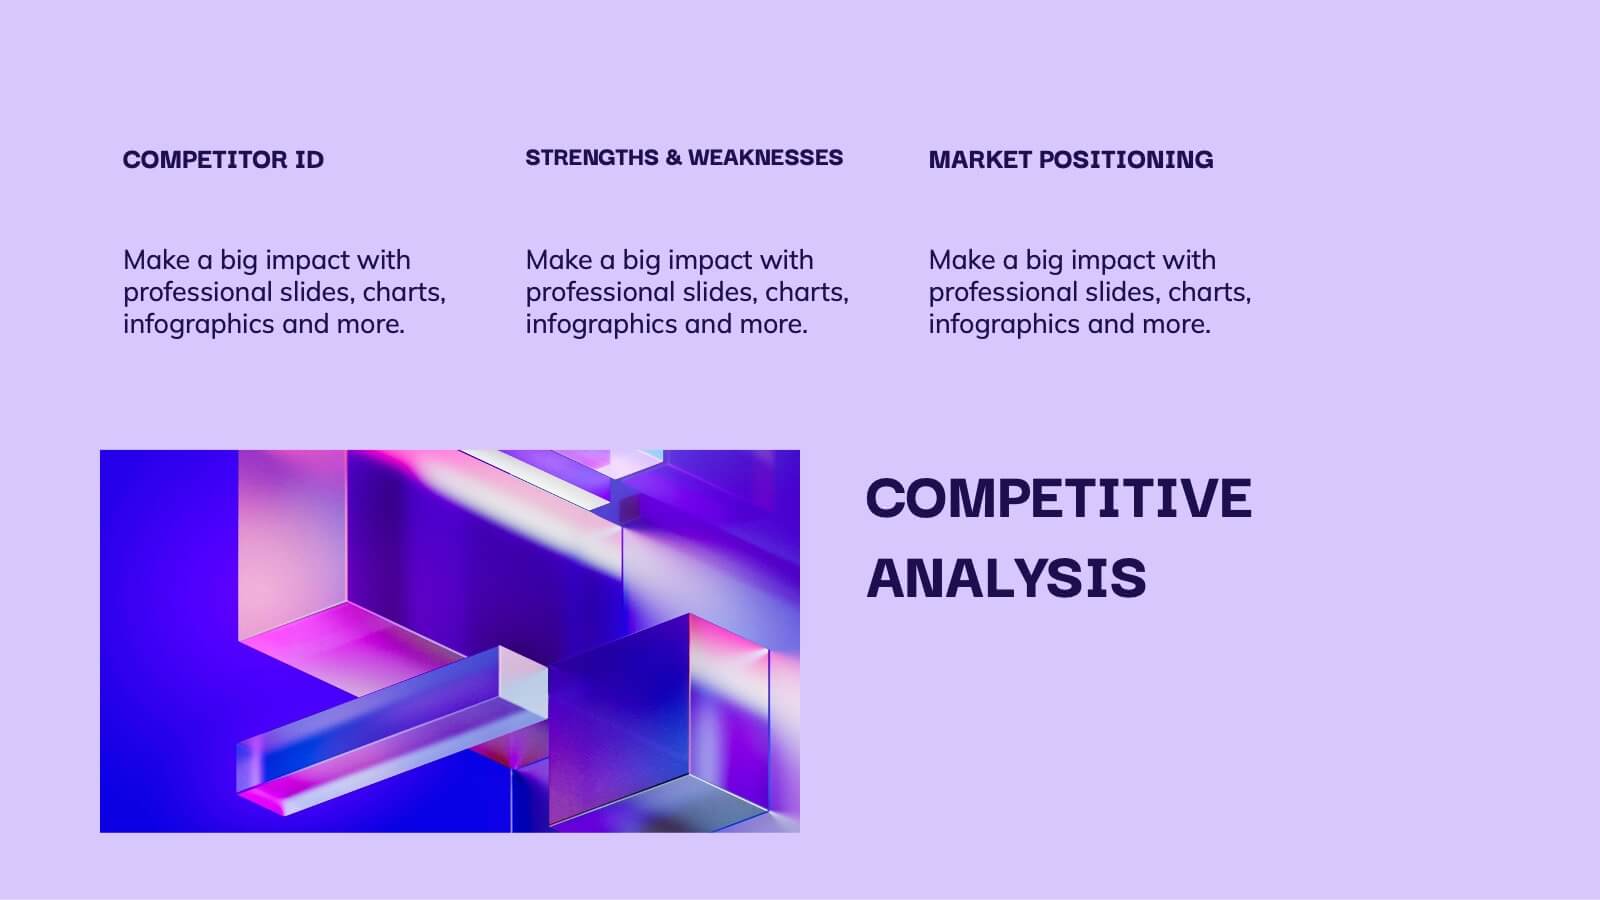
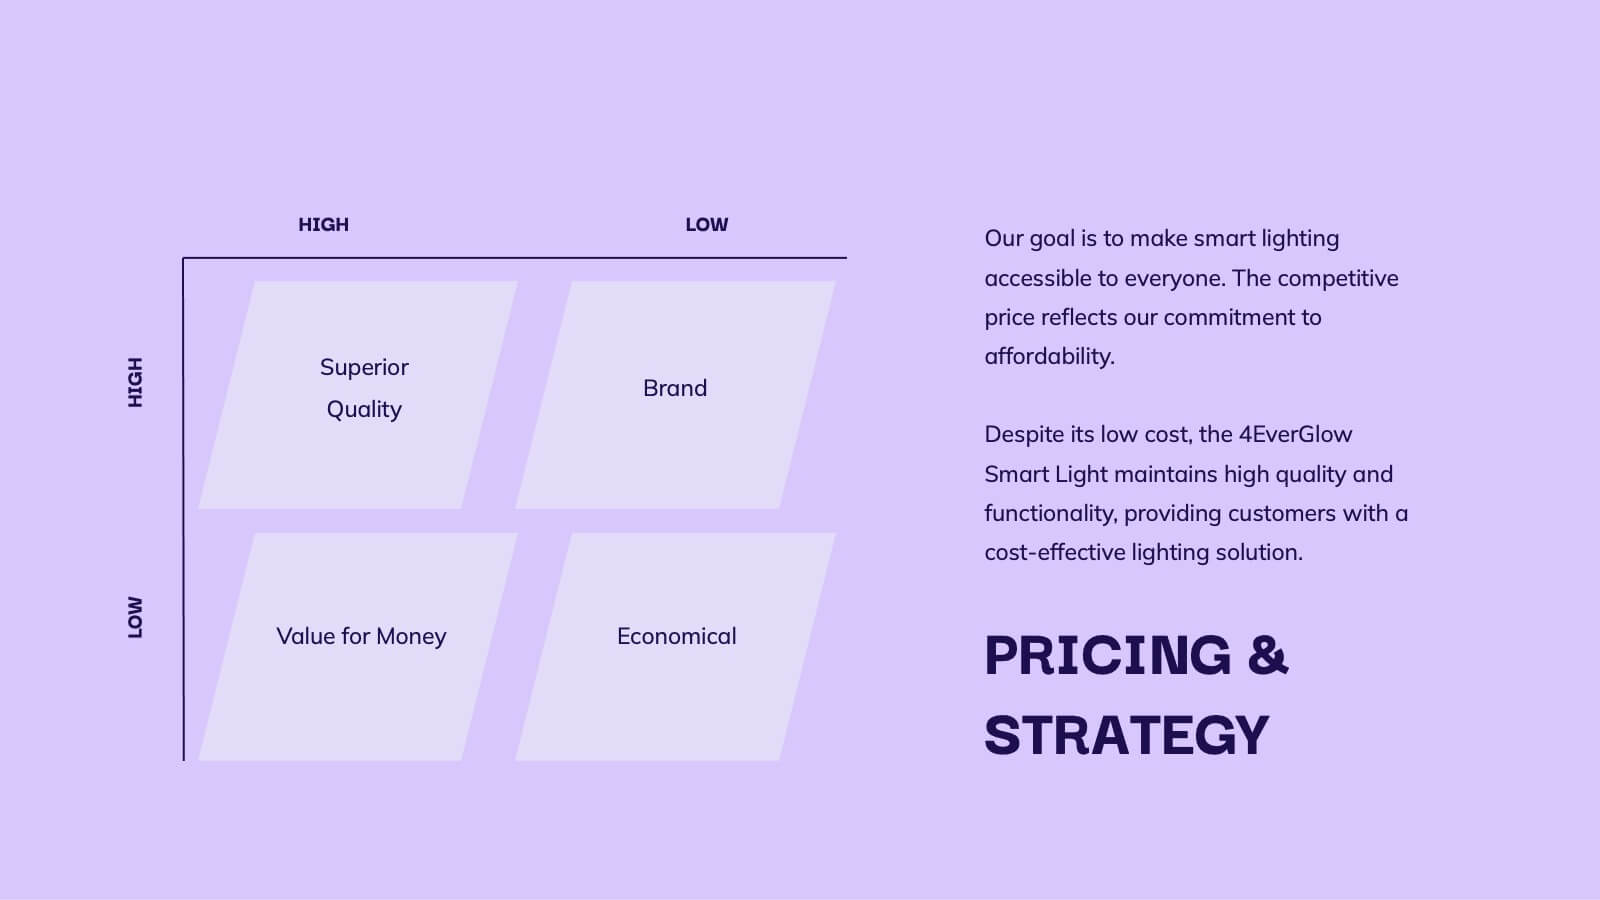
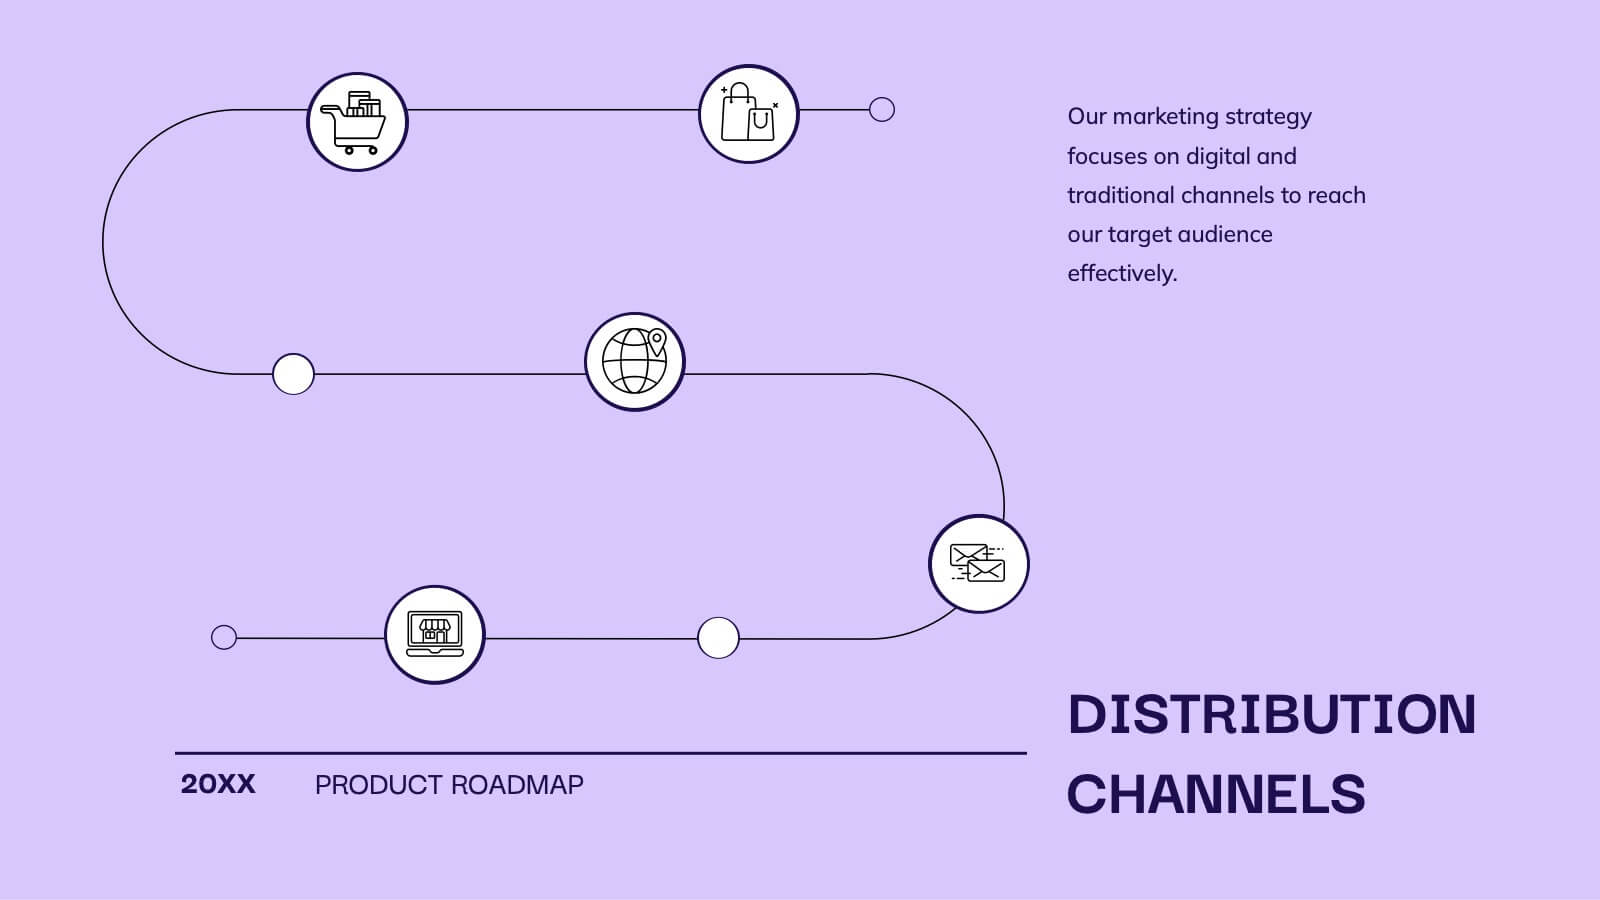
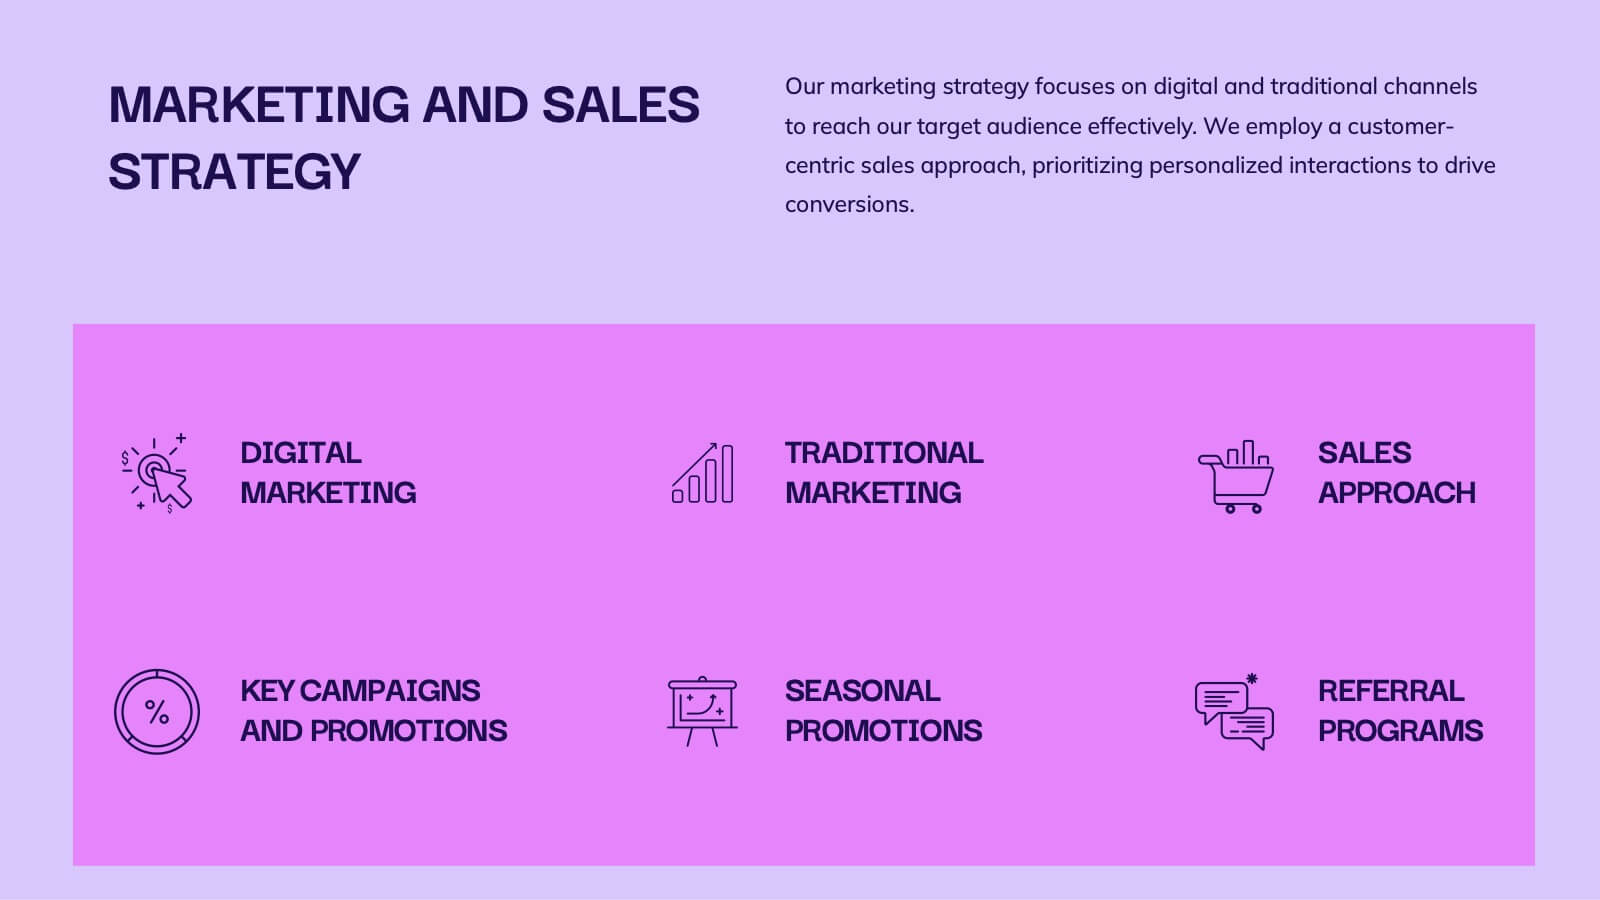
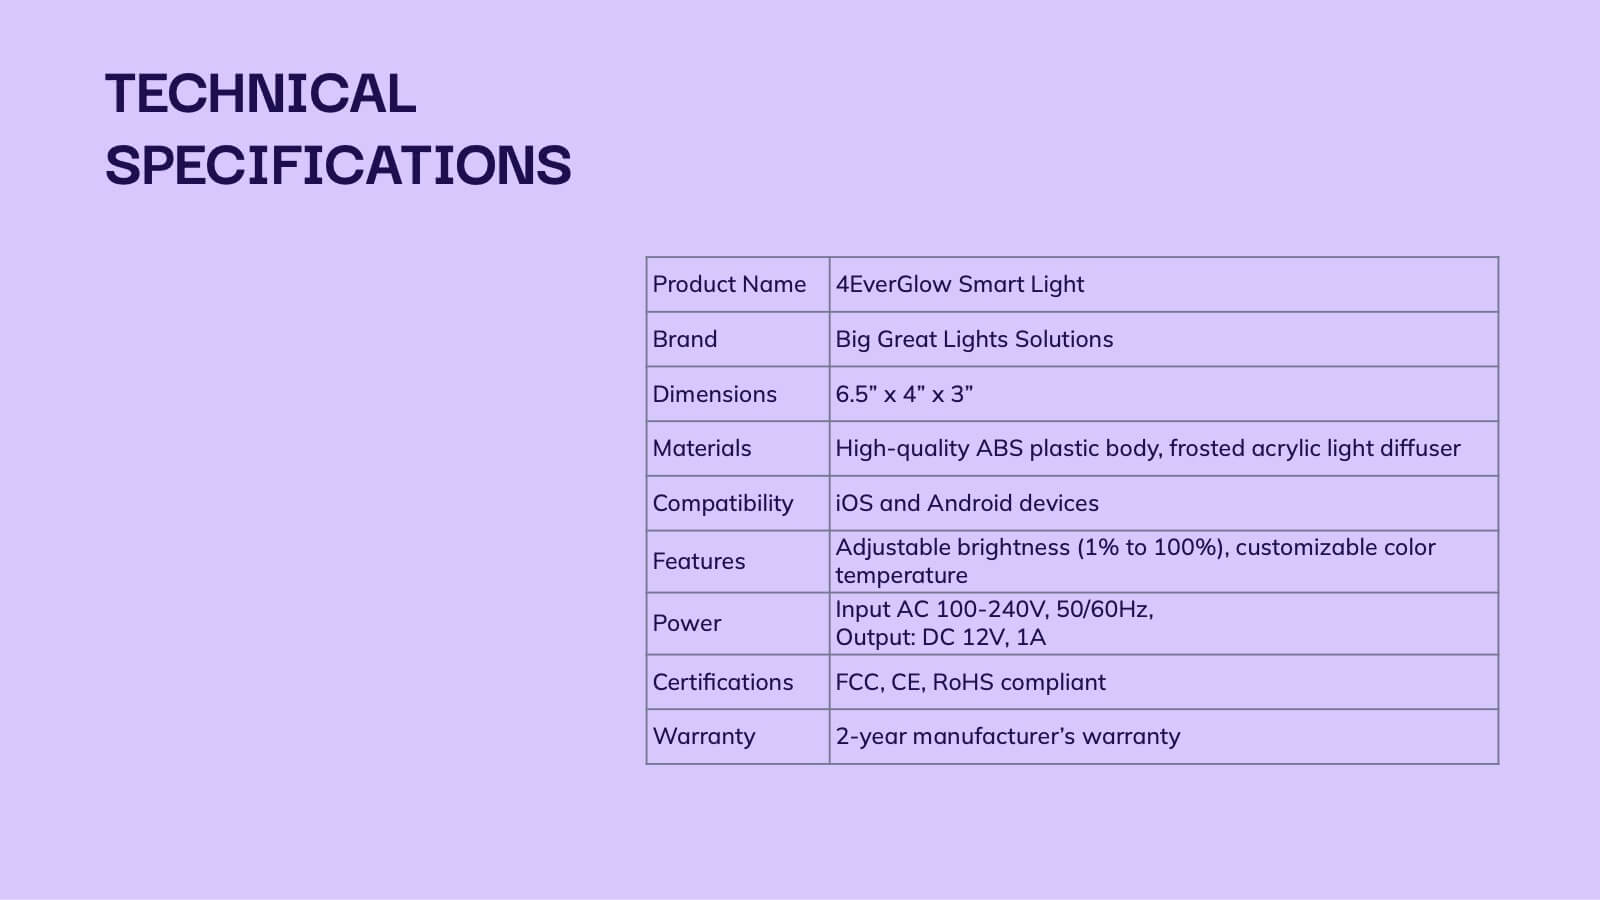
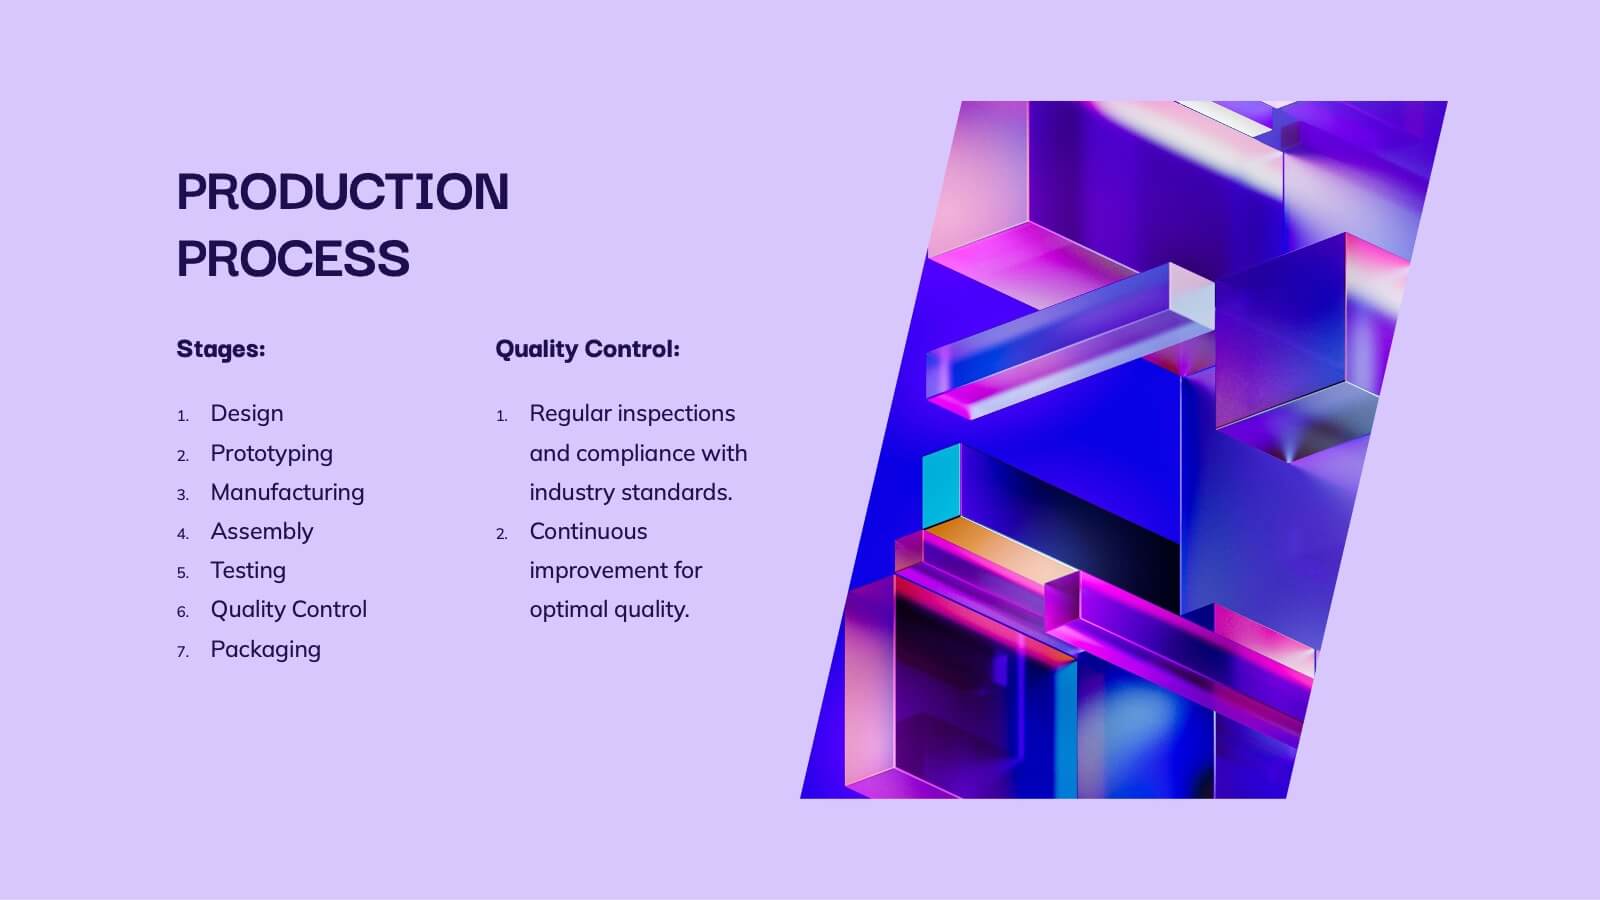
Harpy Product Development Plan Presentation
Present your product development plan with precision using this comprehensive and visually engaging template! It covers essential sections like product features, target market, pricing strategy, competitive analysis, and production process to ensure every aspect is communicated effectively. Perfect for product teams or client pitches, it’s fully compatible with PowerPoint, Keynote, and Google Slides.


6 diapositivas
Task Management Checklist
Stay on top of your workflow with this visually engaging task management checklist slide. Designed to help teams track progress across multiple tasks or project stages, this layout includes six editable sections with icon markers and color-coded completion states. Fully compatible with PowerPoint, Keynote, and Google Slides.


4 diapositivas
Customer Persona Slide Presentation
Bring your audience closer to your ideal customer with this clean, visual layout designed for clarity and storytelling. Perfect for marketing, branding, and strategy presentations, it helps you highlight key traits, motivations, and insights with ease. Fully compatible with PowerPoint, Keynote, and Google Slides for effortless customization.


5 diapositivas
Business Opportunity in Europe Map Presentation
Identify key growth areas across Europe with this clean, data-driven presentation. Highlight business potential using country-based color coding and progress indicators. Perfect for market analysis, investment pitches, or strategic expansion reports. Fully editable and compatible with PowerPoint, Keynote, and Google Slides for effortless customization and professional presentation delivery.


6 diapositivas
Customer Targeting Strategy Overview Presentation
Present your customer approach clearly with this Customer Targeting Strategy Overview presentation. Featuring a central persona with speech bubble-style segments, this layout is perfect for showcasing targeting methods, segmentation insights, or buyer personas. Ideal for marketers and strategists. Fully editable in Canva, PowerPoint, and Google Slides for easy customization.


2 diapositivas
Professional Thank You Slide Presentation
End your presentation with a clean, modern slide that leaves a polished final impression. This layout gives you space to share closing notes, contact details, or key reminders in a clear and visually balanced style. Fully editable and compatible with PowerPoint, Keynote, and Google Slides.


6 diapositivas
School Goals and Administration Presentation
Visualize key academic priorities with this notebook-style layout, perfect for school administrators and teachers. Featuring colorful pushpin markers and a two-page spread, this template is great for outlining goals, responsibilities, or class guidelines. Fully editable in PowerPoint, Keynote, and Google Slides for customized, classroom-ready presentations.


10 diapositivas
Adapting to Business Transformation Presentation
Guide your audience through change with this dynamic, step-by-step layout tailored for showcasing transformation journeys. The slide features a curved flow design with five customizable stages, perfect for visualizing digital shifts, organizational restructuring, or innovation roadmaps. Best for corporate strategists, consultants, and change managers. Fully editable in PowerPoint, Keynote, and Google Slides.


5 diapositivas
Business Development Five-Step Plan Presentation
Accelerate your growth with the Business Development Five-Step Plan presentation. This structured template guides you through key stages of business expansion, from strategy to execution. Designed for entrepreneurs, startups, and corporate teams, this clear and engaging format ensures effective planning and communication. Fully customizable for PowerPoint, Keynote, and Google Slides to fit your specific needs.


21 diapositivas
Glimmer Product Roadmap Presentation
Illuminate your product's future with this vibrant glimmer-themed presentation template! Perfect for outlining your product roadmap, it allows you to present key milestones, features, and timelines in a visually engaging way. Captivate your audience and keep them informed about your exciting journey ahead. Compatible with PowerPoint, Keynote, and Google Slides.


5 diapositivas
5-Level Smile Rating Presentation
Give your audience a fun, visual way to understand sentiment with this colorful rating slide. Perfect for feedback summaries, project reviews, or performance insights, it displays five clear emotion levels in a simple, engaging format. Easy to customize and fully compatible with PowerPoint, Keynote, and Google Slides.


6 diapositivas
Mission and Values Overview Presentation
Your company's purpose deserves a visually stunning story! This infographic presentation template helps you clearly outline core values and mission statements with an engaging, structured design. Ideal for business strategy meetings, corporate presentations, and branding discussions, it keeps your content professional and impactful. Fully customizable and compatible with PowerPoint, Keynote, and Google Slides.


6 diapositivas
E-learning Tools for Modern Classrooms Presentation
Present digital learning strategies with this engaging, education-themed template. Ideal for teachers, trainers, or tech coordinators introducing e-learning tools. Includes labeled sections for highlighting key features and software benefits. Fully customizable and compatible with PowerPoint, Keynote, and Google Slides—perfect for virtual classrooms, workshops, or academic tech presentations.


4 diapositivas
KPI and Business Performance Dashboard
Drive strategic insights with this sleek KPI and business dashboard template. Highlight key metrics, trends, and performance results using easy-to-read graphs and organized data sections. Perfect for management reports, executive summaries, and project tracking. Fully editable in PowerPoint, Keynote, and Google Slides.


6 diapositivas
Hexagonal Grid for Process Mapping Presentation
Visualize your workflow with structure using the Hexagonal Grid for Process Mapping Presentation. This clean, geometric layout guides viewers through each phase of your process with clarity and consistency. Ideal for outlining steps, stages, or interconnected tasks in a modern format. Fully editable in Canva, PowerPoint, Keynote, and Google Slides.


20 diapositivas
Unity New Product Proposal Presentation
Unveil your product strategy with this modern, comprehensive template! Highlight your company overview, product features, and unique selling proposition. Perfect for presenting market analysis, pricing strategy, and technical specifications. Ideal for product managers and developers. Compatible with PowerPoint, Keynote, and Google Slides.


7 diapositivas
Strategic Business Execution Playbook Presentation
Streamline your execution roadmap with this Strategic Business Execution Playbook. Featuring a sleek, step-by-step layout, it’s ideal for showcasing business stages, workflows, or strategic planning phases. Easy to customize in PowerPoint, Keynote, and Google Slides, this template helps teams visualize priorities and align goals with precision and clarity.