


Características


¿Tienes alguna pregunta?
Recomendar


4 diapositivas
Highlighting Key Business Benefits Presentation
Unlock your brand's value with the Highlighting Key Business Benefits Presentation. This modern slide layout uses a visual key concept to emphasize four essential advantages, helping your audience quickly grasp your core offerings. Ideal for sales pitches, service overviews, or value proposition discussions. Fully editable and compatible with PowerPoint, Keynote, and Google Slides.


6 diapositivas
Circular Motion Business Wheel Diagram Presentation
Showcase continuous processes or interconnected strategies with the Circular Motion Business Wheel Diagram Presentation. This visually engaging template features a six-part circular layout, ideal for illustrating business cycles, project workflows, or recurring tasks. Each segment includes customizable titles, icons, and content areas to support clarity and impact. Fully compatible with PowerPoint, Keynote, and Google Slides.


26 diapositivas
Company Profile and Accomplishments Presentation
A company profile is a document that provides an overview of a business entity. This template serves as a company introduction, presenting essential information about company history, products or services, achievements, goals, and other relevant details. This template showcases the milestones and capabilities of a company. This presentation is perfect for businesses, startups, or organizations looking to highlight their success, growth, and overall expertise in their industry. The clean layout, engaging visuals, and comprehensive information, will help your presentation leave a lasting impression on your audience and enhance your company's reputation.


5 diapositivas
Healthcare Industry Report Presentation
Present healthcare insights effectively with the Healthcare Industry Report Presentation template. This structured and professional layout allows you to showcase key industry trends, innovations, and data with clarity. The visually engaging circular design emphasizes interconnected healthcare elements, making it perfect for industry professionals, analysts, and policymakers. Fully customizable and compatible with PowerPoint, Keynote, and Google Slides for a seamless presentation experience.


10 diapositivas
Cryptocurrency Market Trends
Highlight key movements in the crypto space with this 5-step 3D bar chart layout. Ideal for financial analysts, fintech startups, and blockchain professionals. Fully editable in PowerPoint, Keynote, or Google Slides—customize colors, text, and data to reflect your insights with precision.


7 diapositivas
International Finance Infographic
International finance is a branch of economics and financial studies that deals with monetary interactions that occur between two or more countries. Dive into the intricate world of finance with our visually captivating international finance infographic. This template is your passport to understanding the complexities and opportunities in the global financial landscape. With this template you will be able to analyze the dynamics of exchange rates, foreign investment, and how these factors influence global economics. This infographic is crafted to provide a holistic view of the world of finance.


21 diapositivas
Mythspire Market Research Presentation
This market research template offers a clean design for presenting objectives, data collection, analysis, and findings. Perfect for showcasing research methodologies, visualizations, and actionable recommendations. Fully customizable and ideal for business or academic presentations. Compatible with PowerPoint, Keynote, and Google Slides.


6 diapositivas
AI-Driven Innovation in Business Presentation
Bring your ideas to life with a burst of tech brilliance—this bold, modern layout captures the synergy between artificial intelligence and business innovation. Use it to explore automation, data-driven insights, and future-focused strategies. Fully editable and compatible with PowerPoint, Keynote, and Google Slides for seamless presentation design.


6 diapositivas
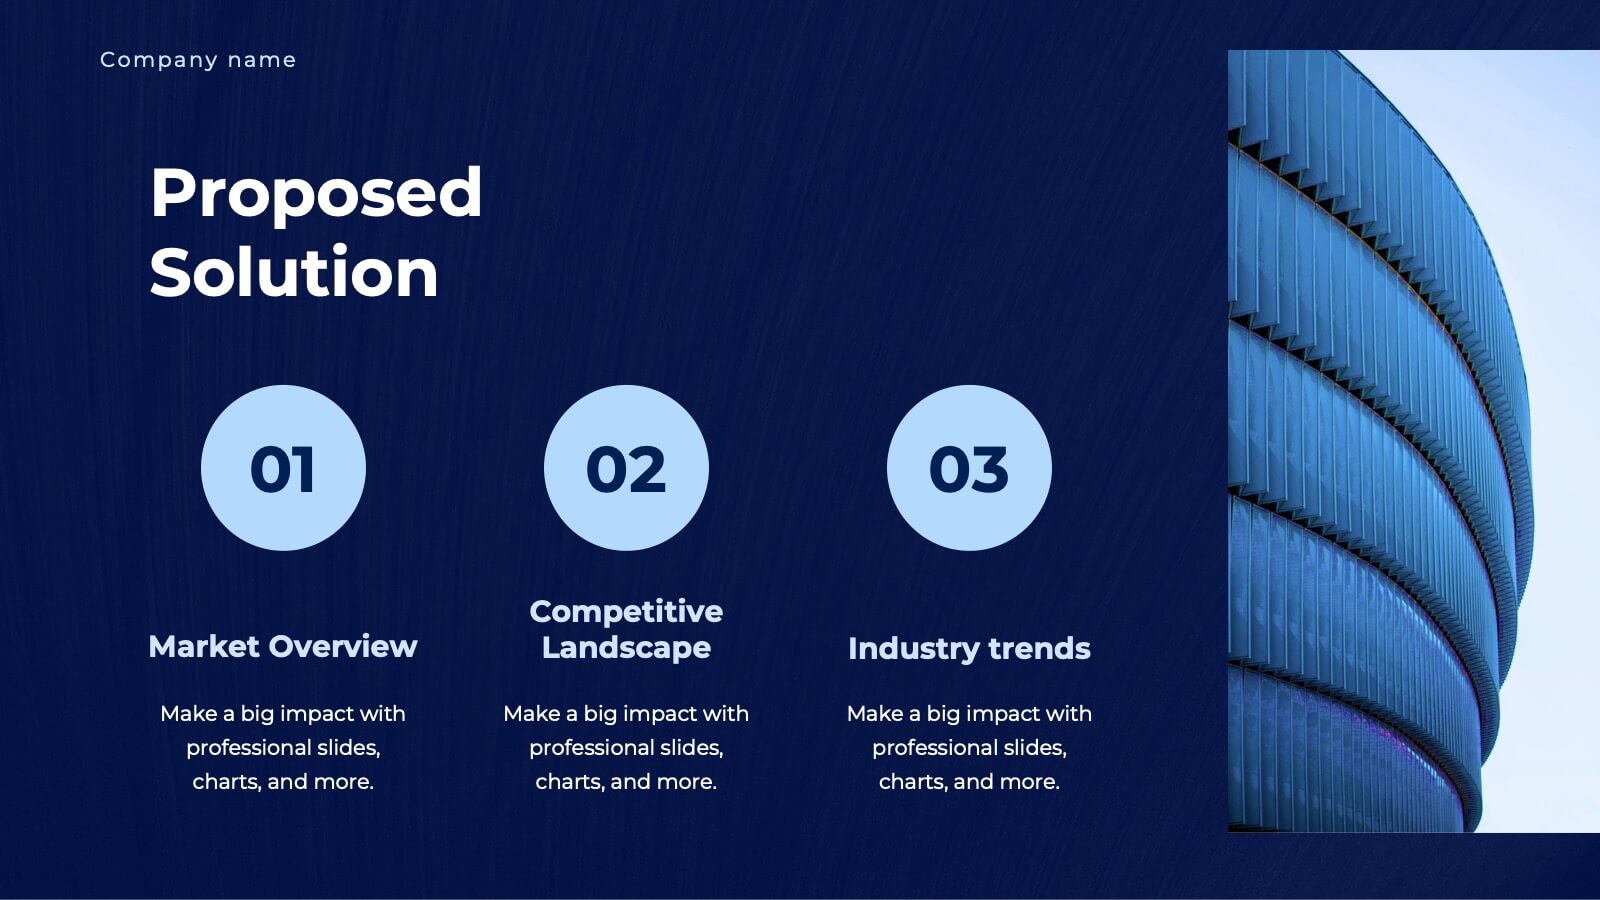
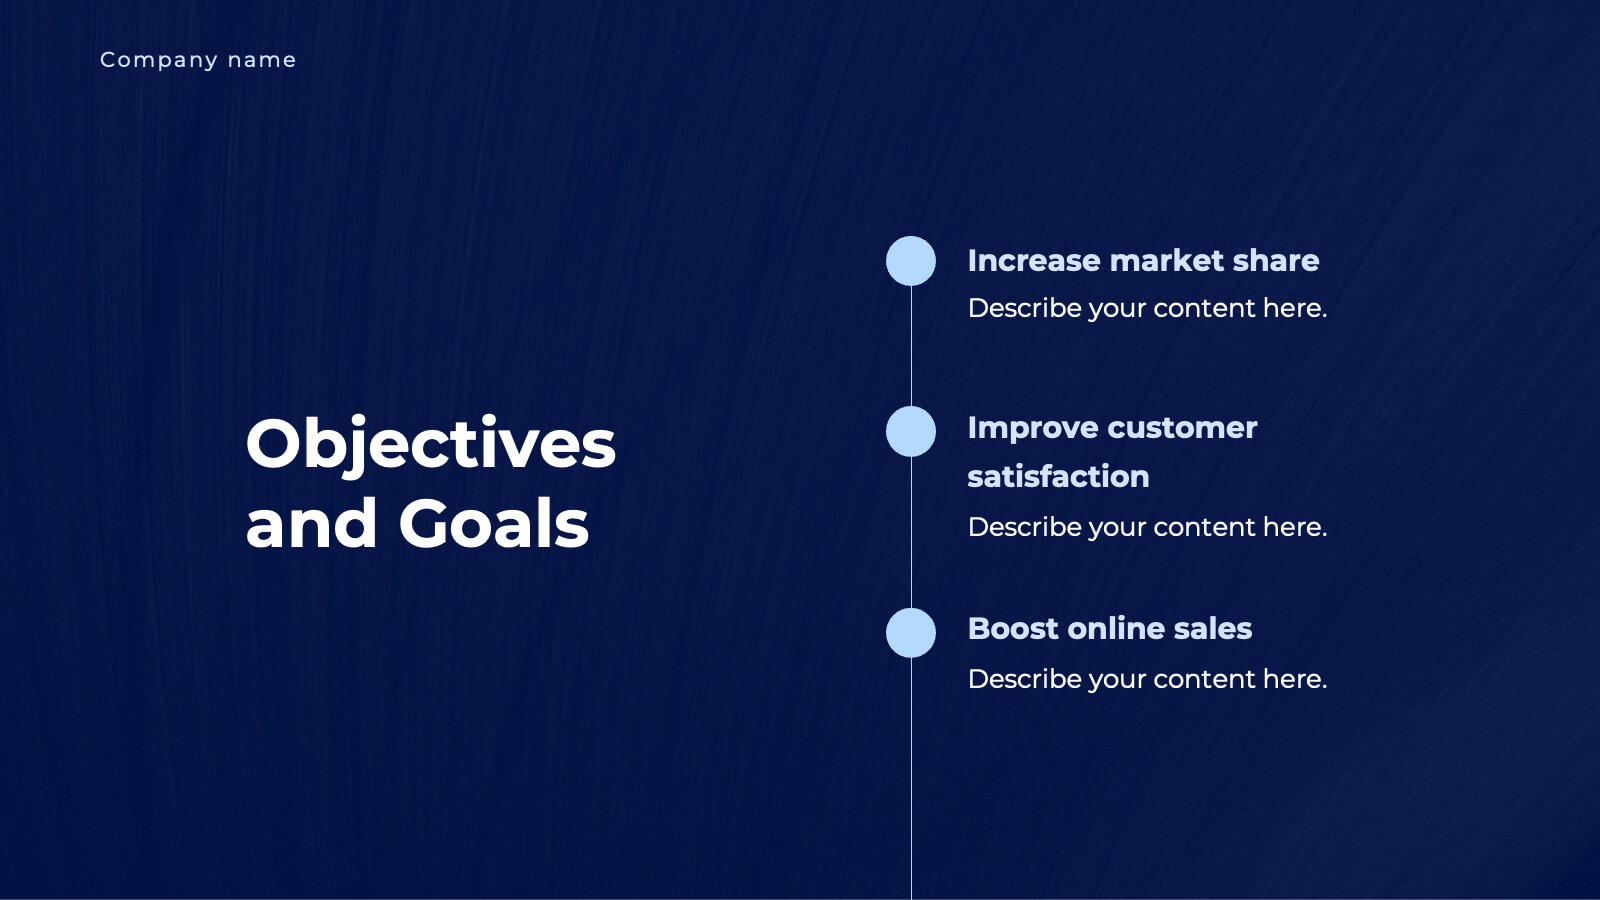
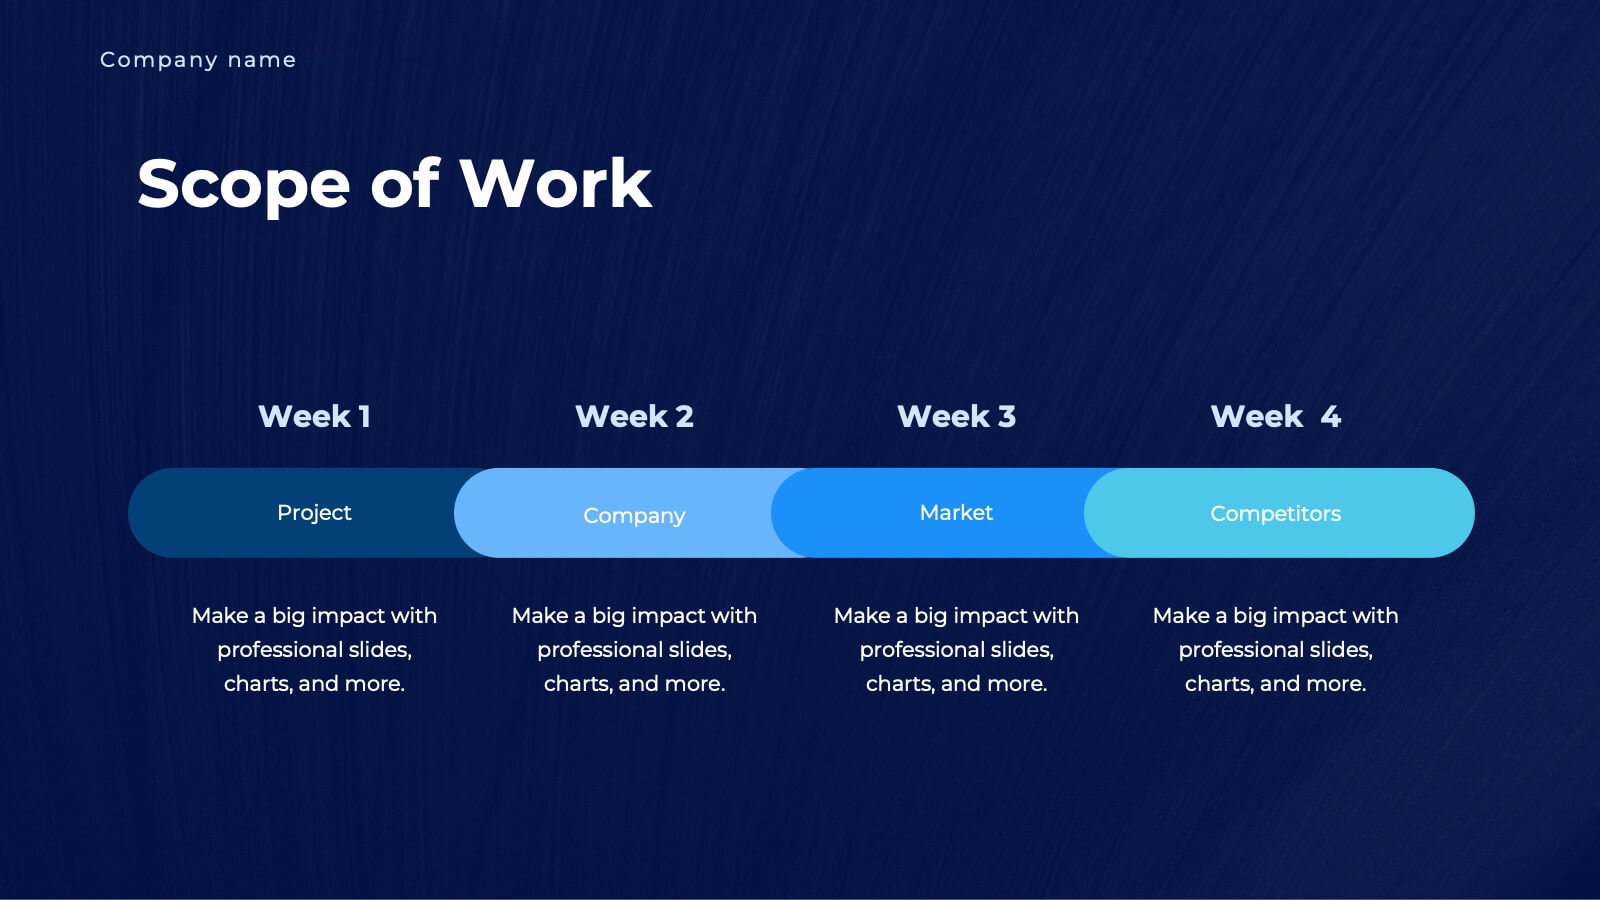
Project Proposal Goals Infographic
Maximize the impact of your project proposals with this professional collection of templates, designed to outline your project goals and strategies with precision. Each template facilitates clear communication of project objectives, timelines, and the desired outcomes, making them essential for project managers, consultants, and business analysts. These slides are crafted with a clean, corporate design that uses a harmonious blend of blue tones, engaging charts, and concise content layouts. This ensures that key points are easily digestible and effectively conveyed to stakeholders. The structured format of these templates is ideal for detailing the scope of work, expected milestones, and resource allocation, supporting a comprehensive overview of your project plan. Customize these templates to align with your organization's branding and project specifics, enhancing your presentation and strengthening the proposal's persuasive power. Whether for internal briefings or external pitches, these slides are tailored to help you present a coherent and compelling case for your projects.


5 diapositivas
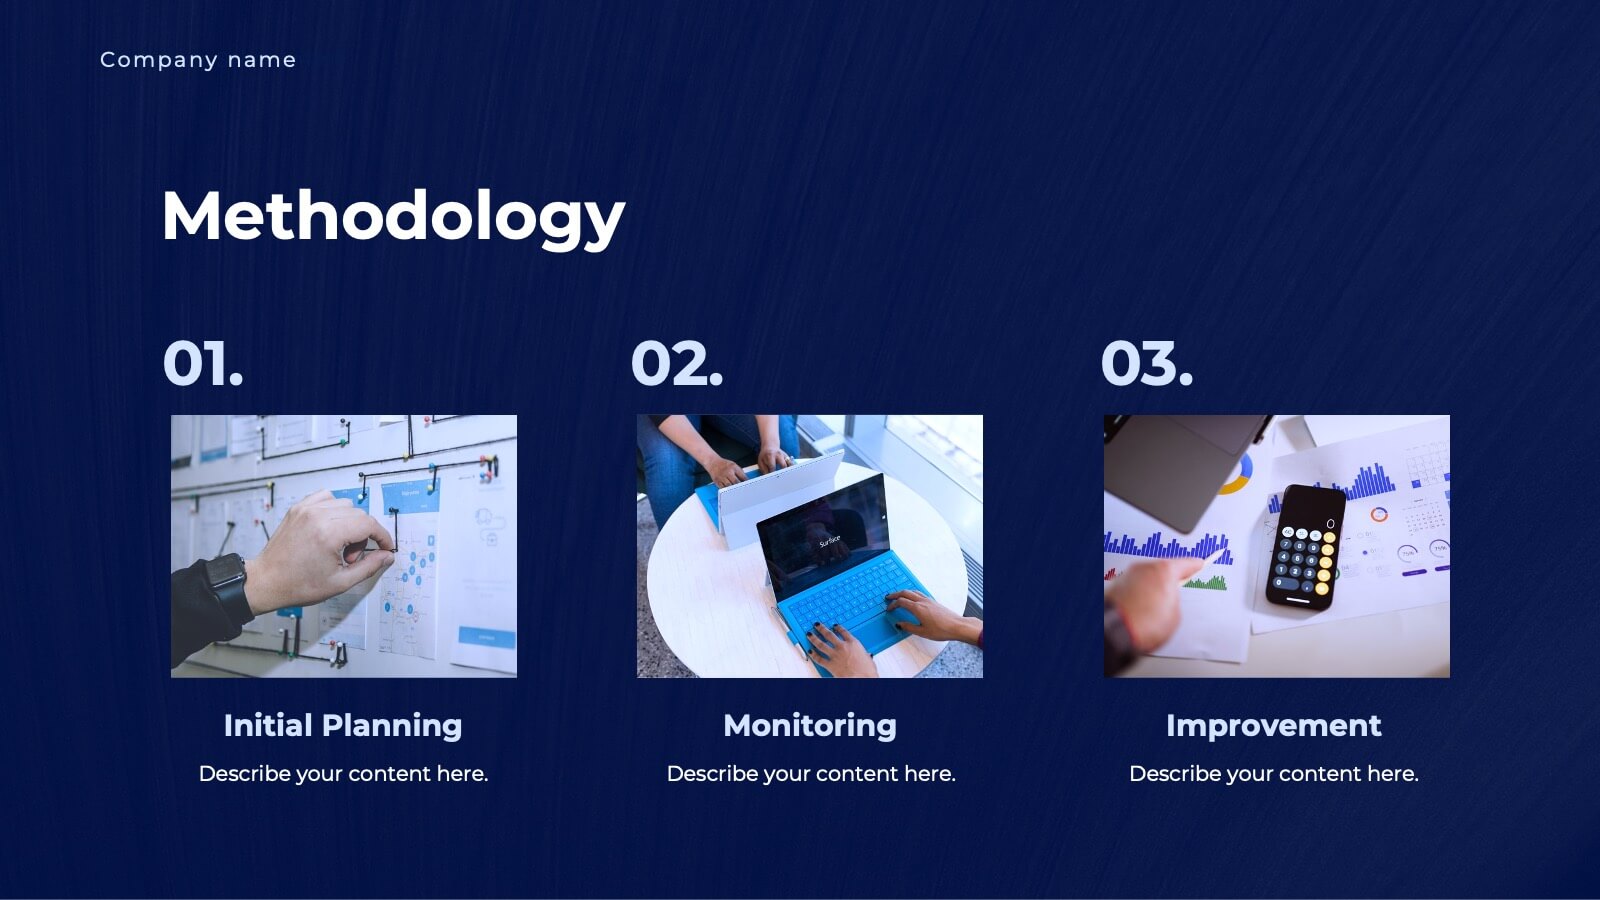
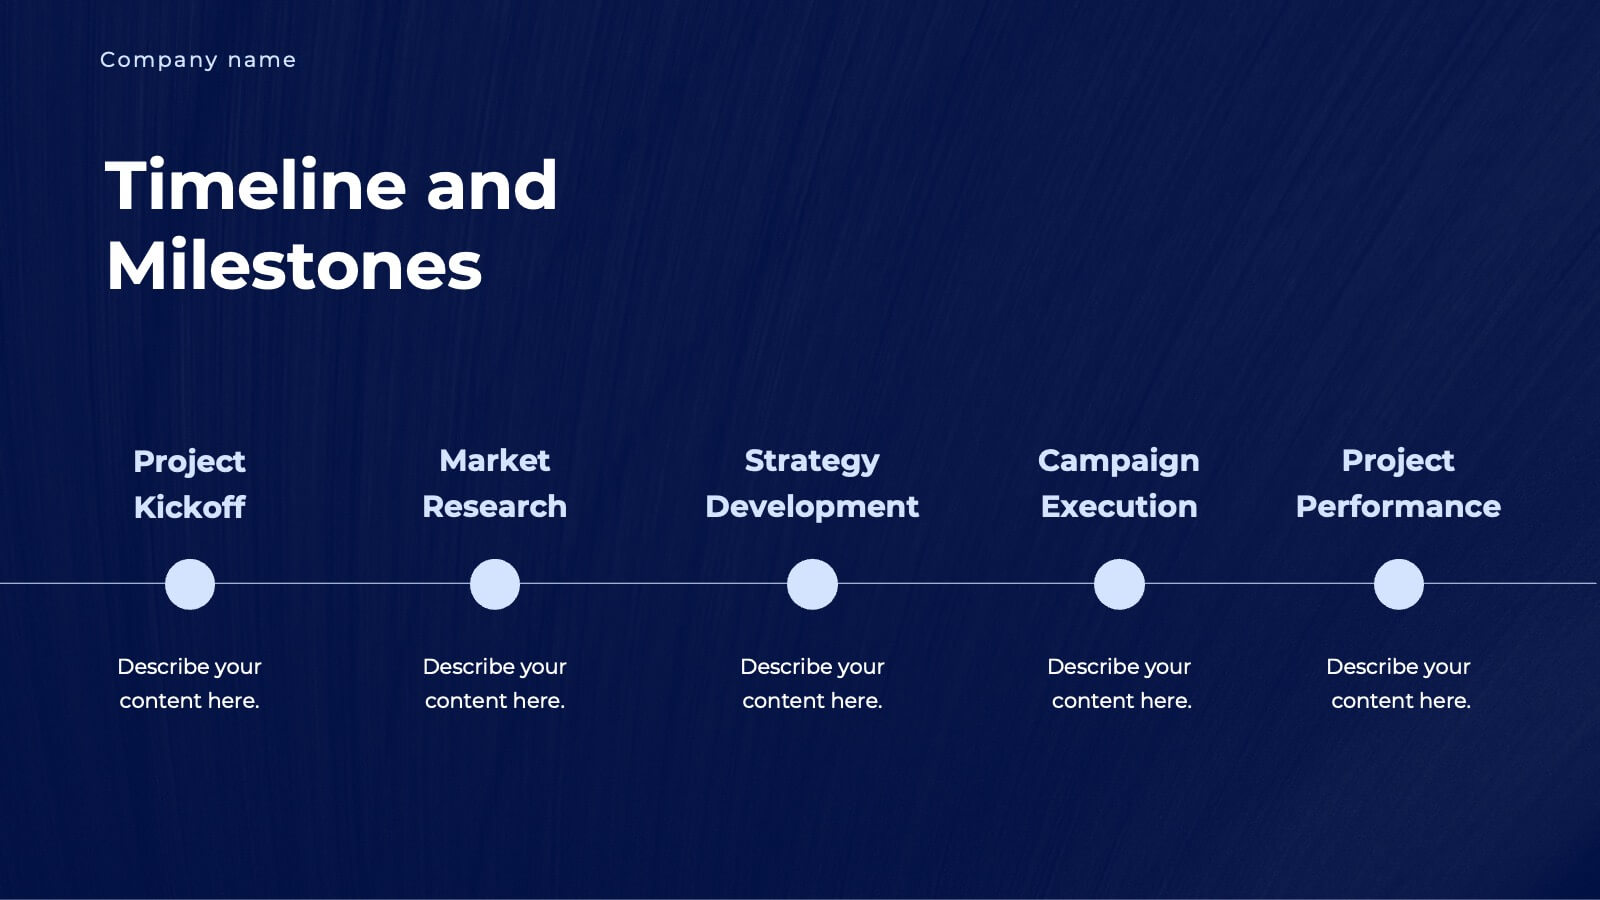
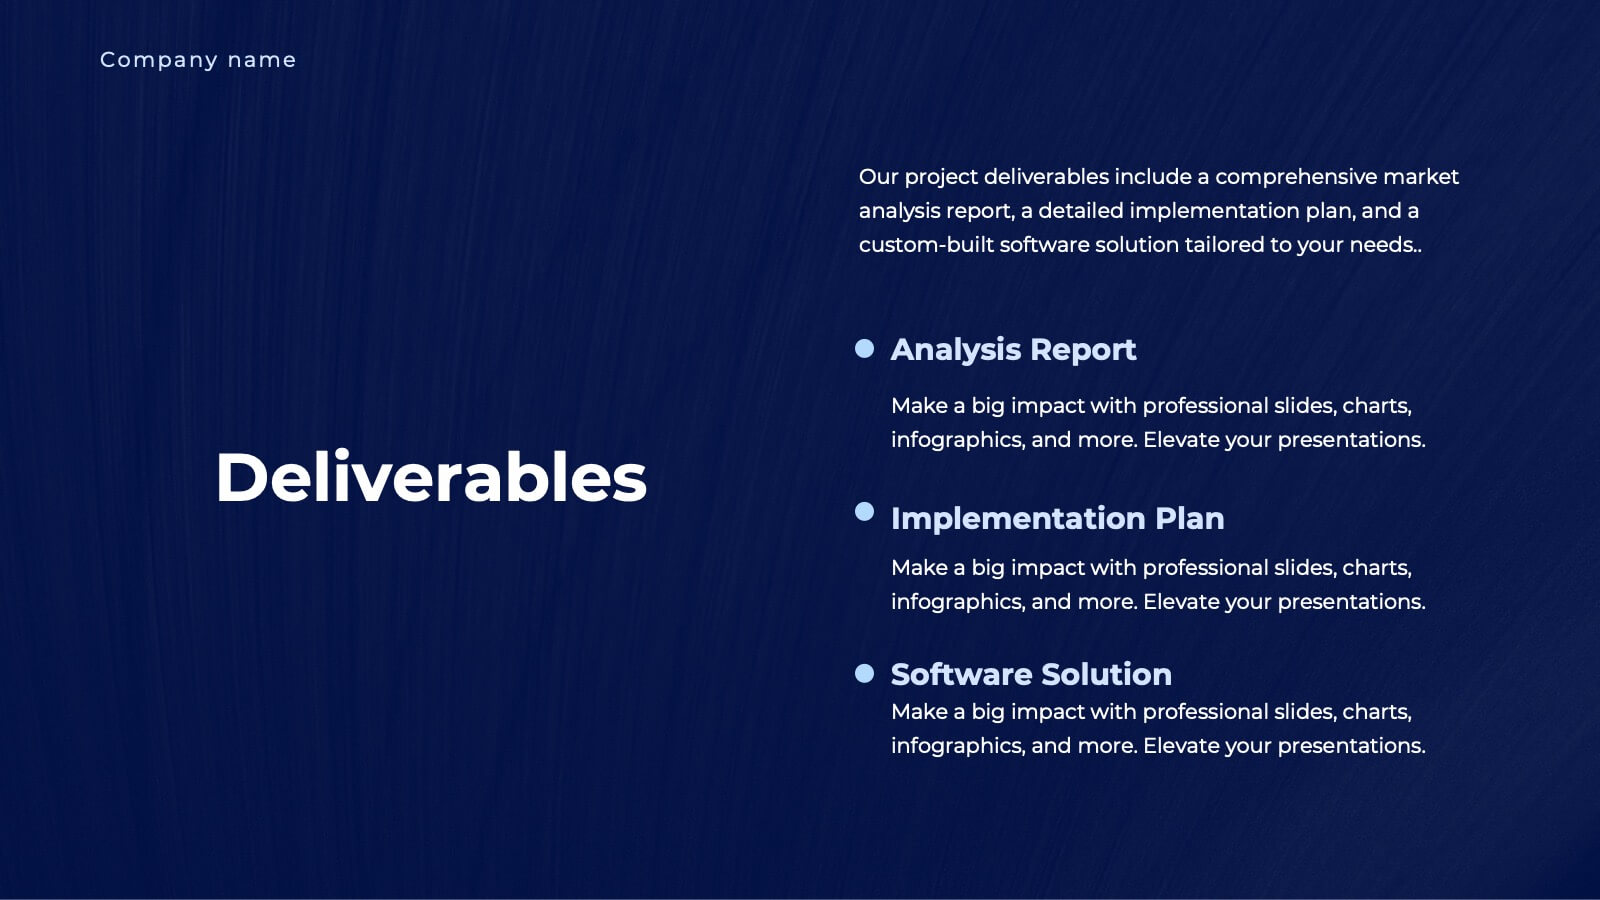
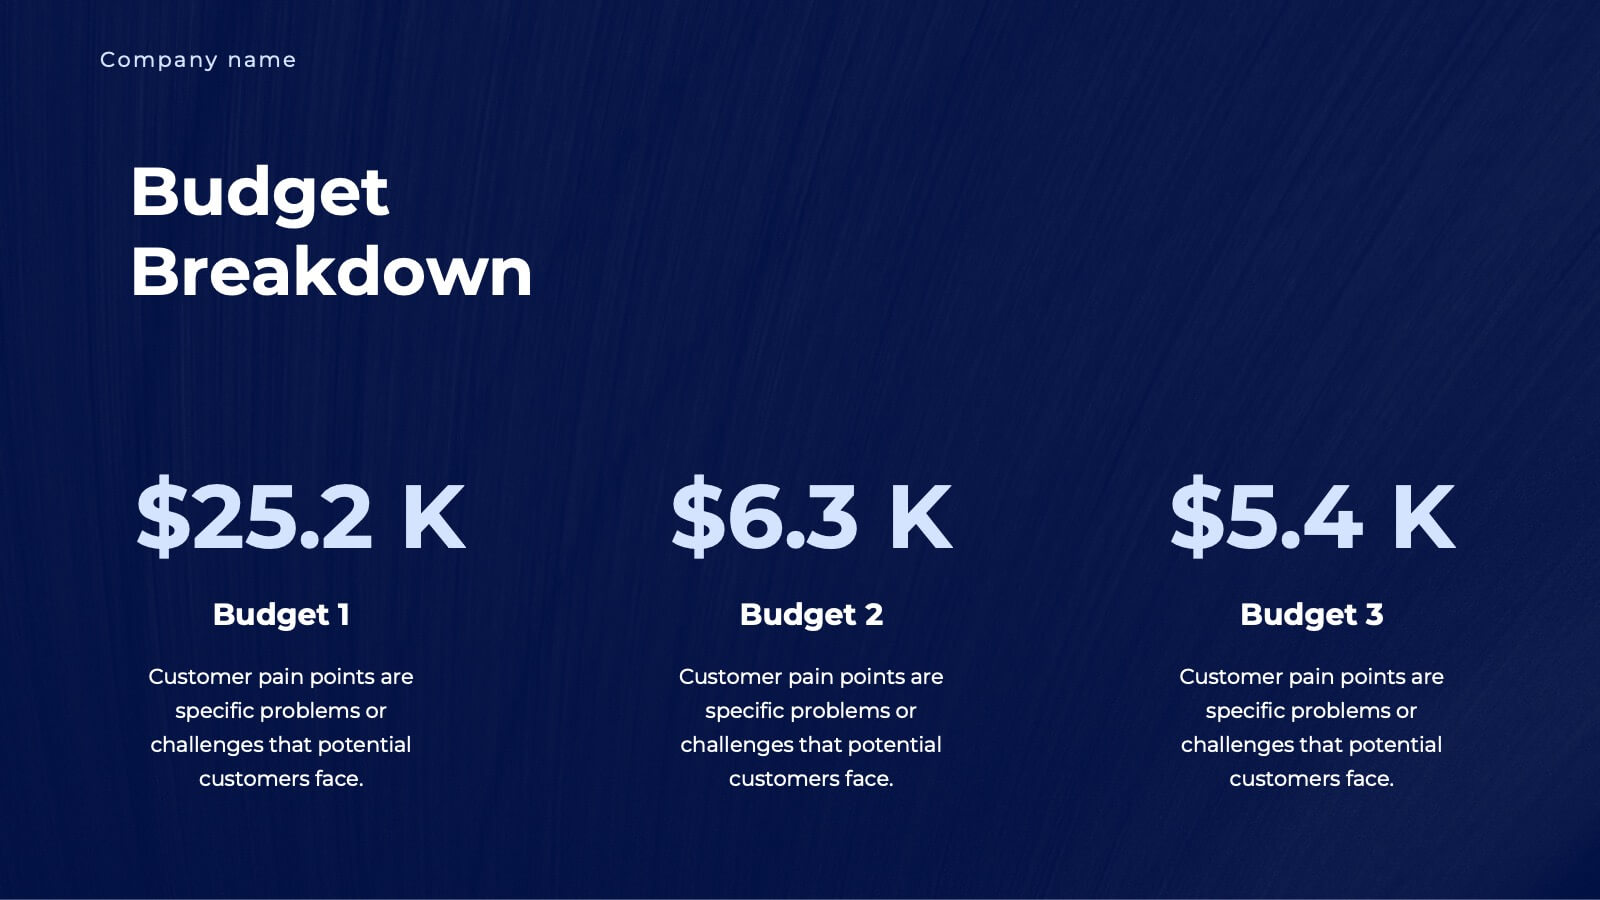
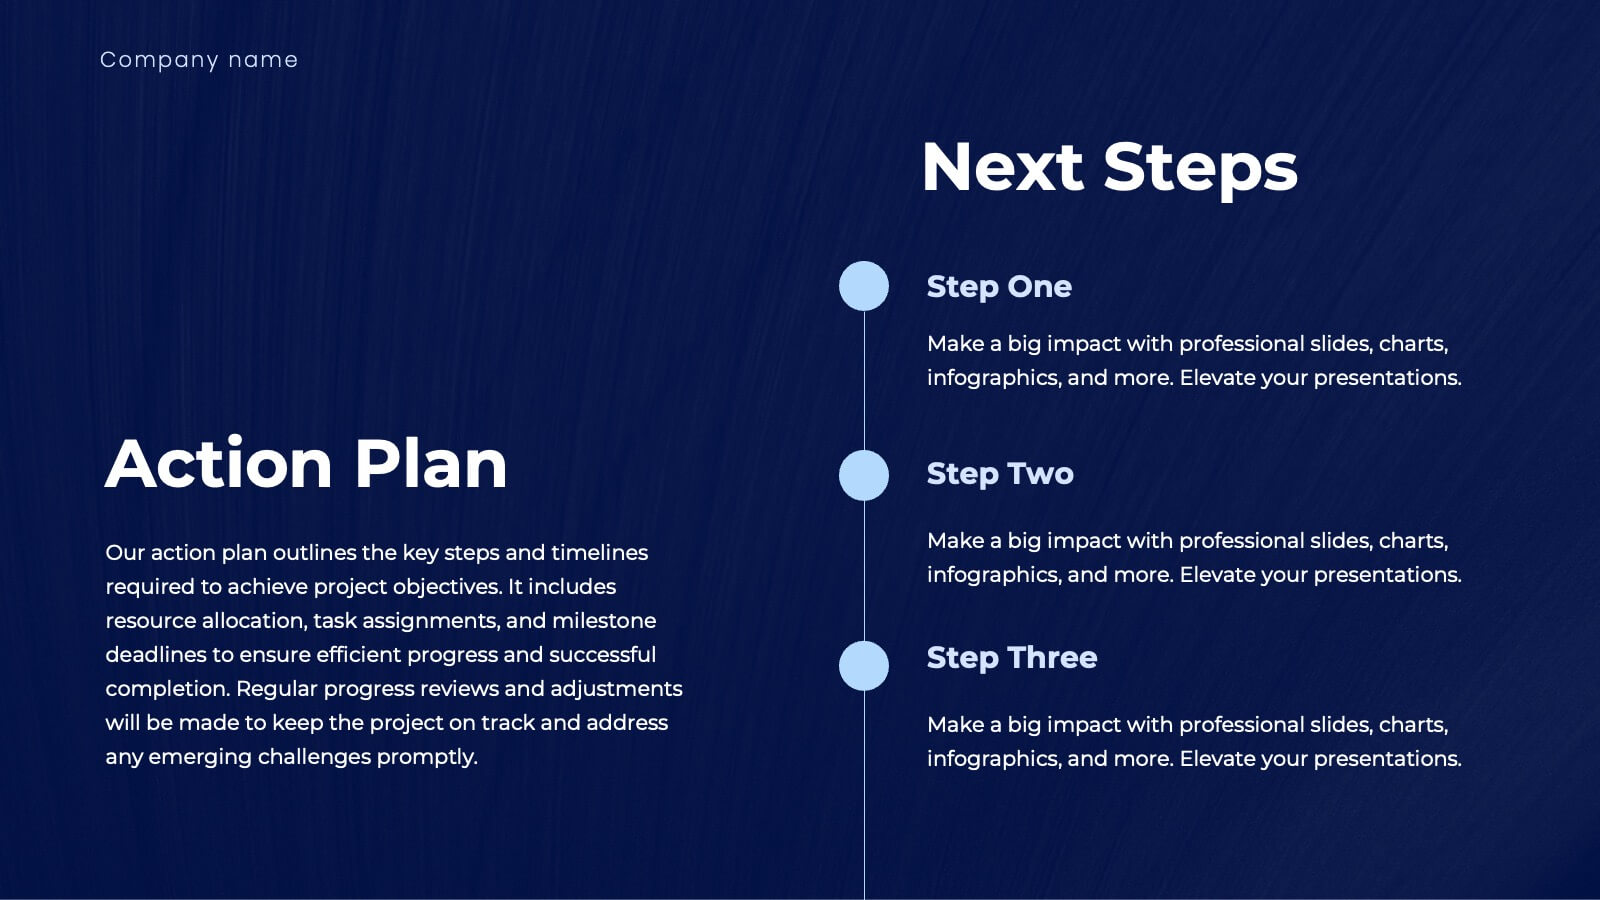
Detailed Project Scope Definition Presentation
Bring structure and clarity to your planning process with a layout designed to define every stage of your project. Perfect for outlining goals, deliverables, and timelines, this presentation keeps information clear and organized. Fully compatible with PowerPoint, Keynote, and Google Slides for easy customization and professional results.


4 diapositivas
SEO Keyword Planning and Ranking Goals Presentation
Stand out in the crowded digital space with bold visuals that simplify complex strategies! This infographic presentation helps you break down SEO keyword planning and ranking goals into clear, layered steps using a funnel format that’s intuitive and professional. Perfect for SEO agencies, marketers, and digital strategists aiming to communicate data-driven insights effectively. Compatible with PowerPoint, Keynote, and Google Slides.


6 diapositivas
Organizational Structure Overview Presentation
Map out your team’s structure with clarity using this simple organizational chart template. Ideal for showcasing departments, reporting lines, or team roles, it helps stakeholders quickly understand who’s who and how responsibilities are divided. Perfect for internal meetings, onboarding decks, or company overviews. Works with PowerPoint, Keynote, and Google Slides.


6 diapositivas
12-Month Calendar Overview Presentation
Kick off your planning with a clean, colorful layout that makes every month easy to visualize at a glance. This presentation helps you map timelines, milestones, and deadlines in a structured format ideal for yearly planning. Fully editable and compatible with PowerPoint, Keynote, and Google Slides.


4 diapositivas
30 60 90 Day Plan Goals Presentation
Set your roadmap in motion with a clean, visual timeline that makes each milestone easy to follow and present with confidence. This presentation helps you outline priorities, track progress, and communicate clear goals for the first three months. Fully editable and compatible with PowerPoint, Keynote, and Google Slides.


6 diapositivas
Startup Investment Infographics
The "Startup Investment" infographic template is a sleek and persuasive tool, perfectly crafted for PowerPoint, Keynote, and Google Slides. This template is a crucial asset for entrepreneurs, investors, and business consultants who are keen on presenting the essentials of startup financing, investment strategies, and growth opportunities in an impactful way. This template efficiently encapsulates the startup investment landscape, highlighting key areas like funding stages, investor types, valuation methods, and return on investment. It's designed to articulate the dynamics of startup funding, making it an invaluable tool for pitch presentations, investor meetings, and financial planning discussions. The design is as dynamic as the startup ecosystem itself, with a color scheme that is both vibrant and professional. This not only makes the presentation visually compelling but also signifies the energy, innovation, and potential associated with startup investments. Whether used in a boardroom, a startup incubator, or an investment seminar, this template ensures that your insights into "Startup Investment" are communicated with clarity, confidence, and visual appeal.

20 diapositivas
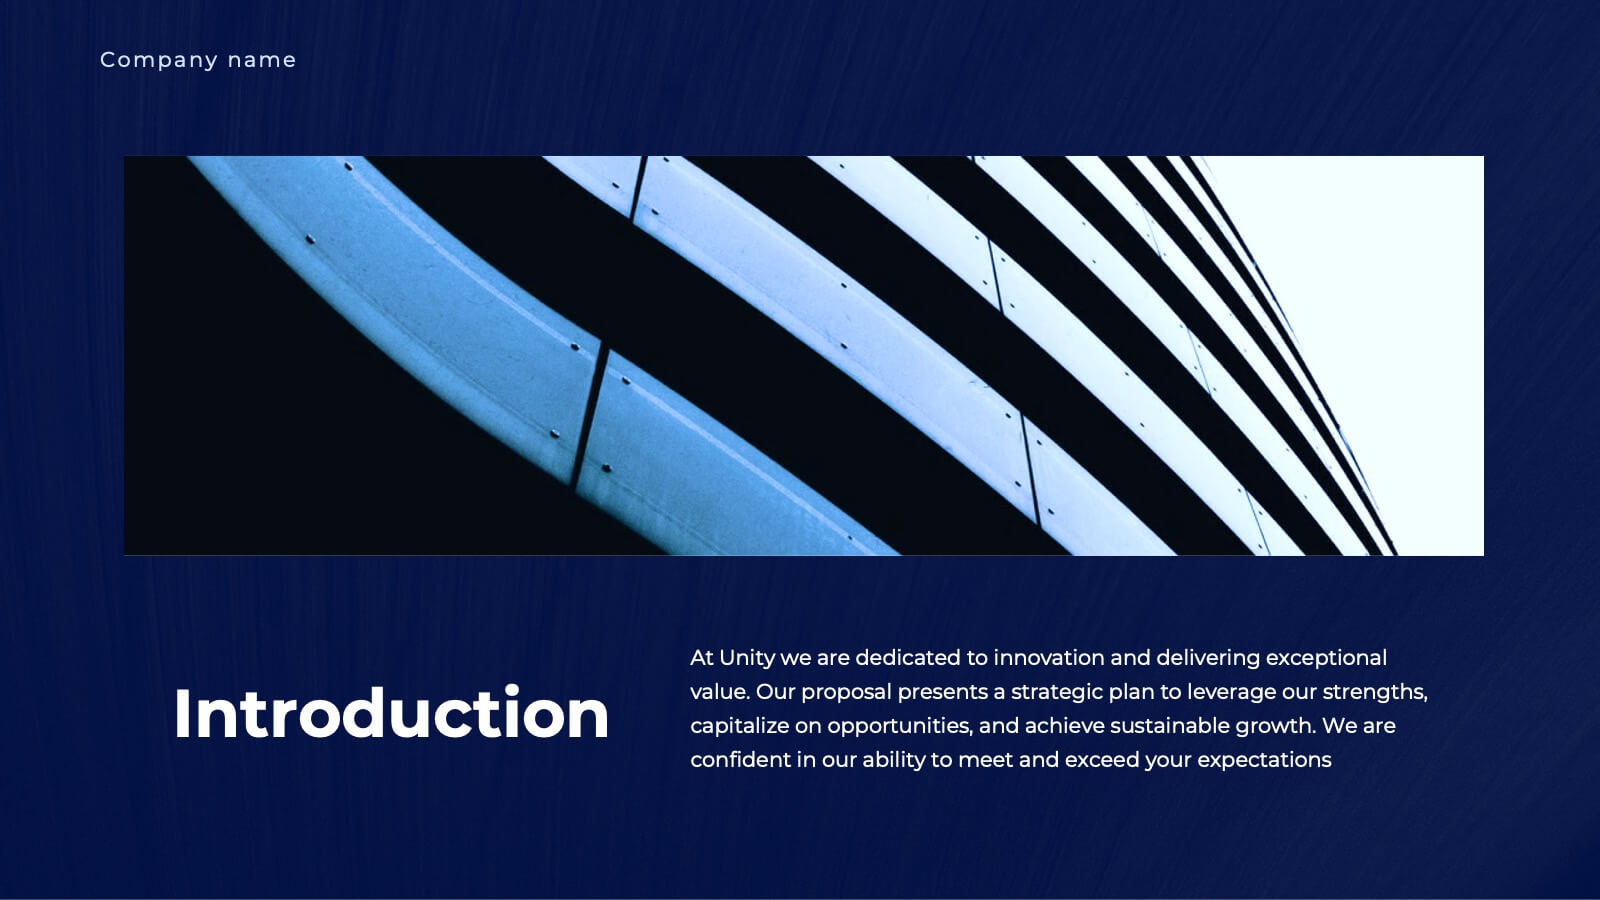
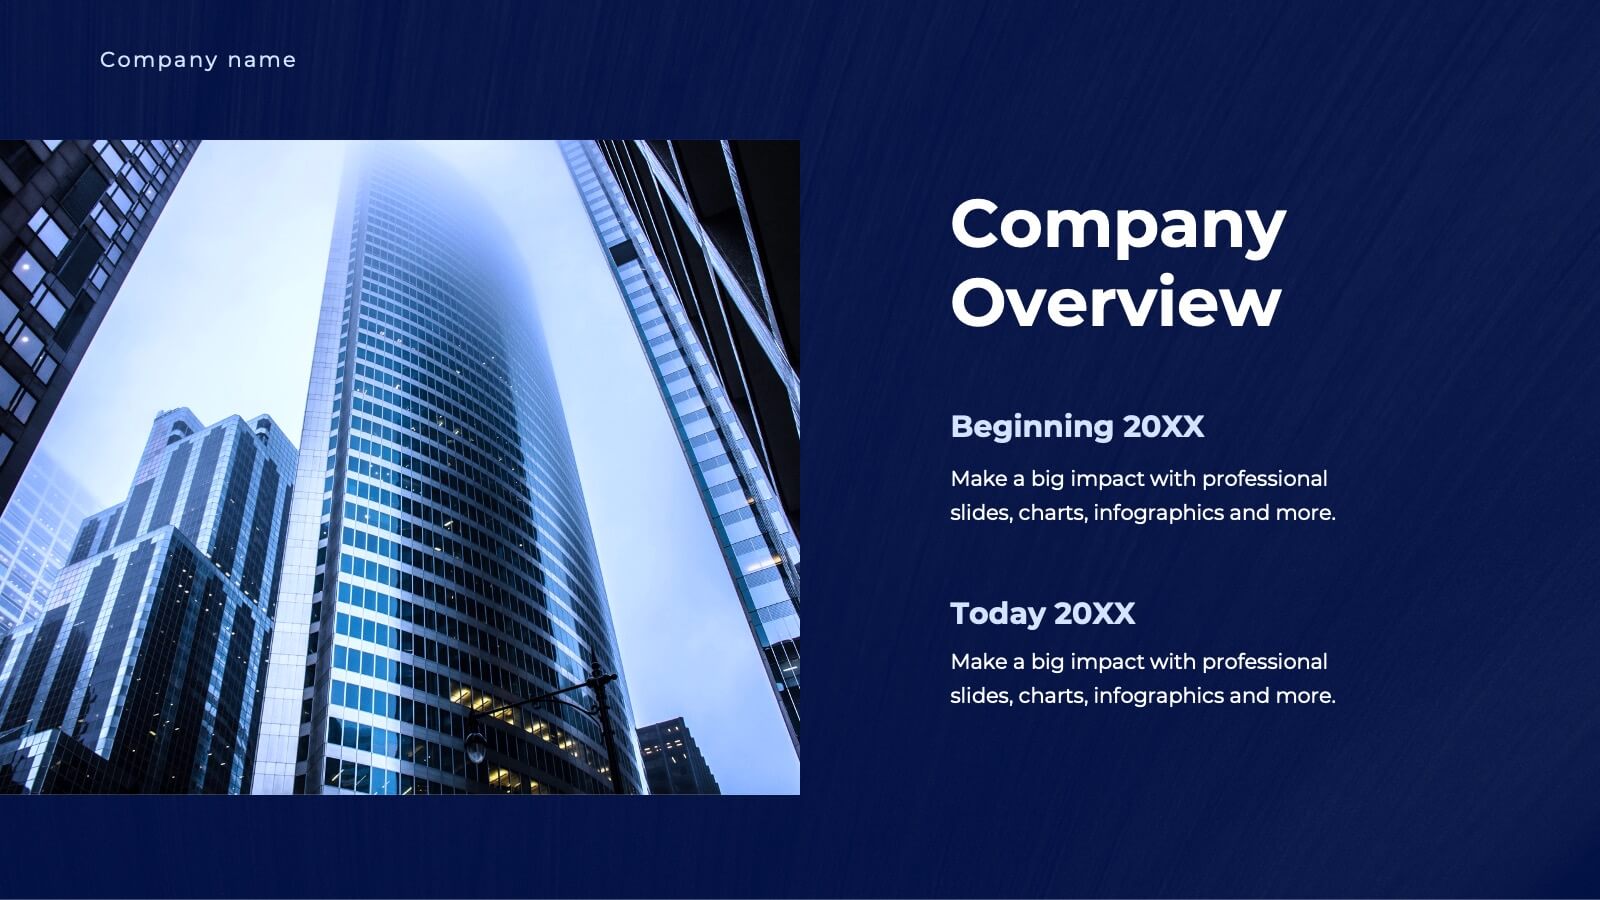
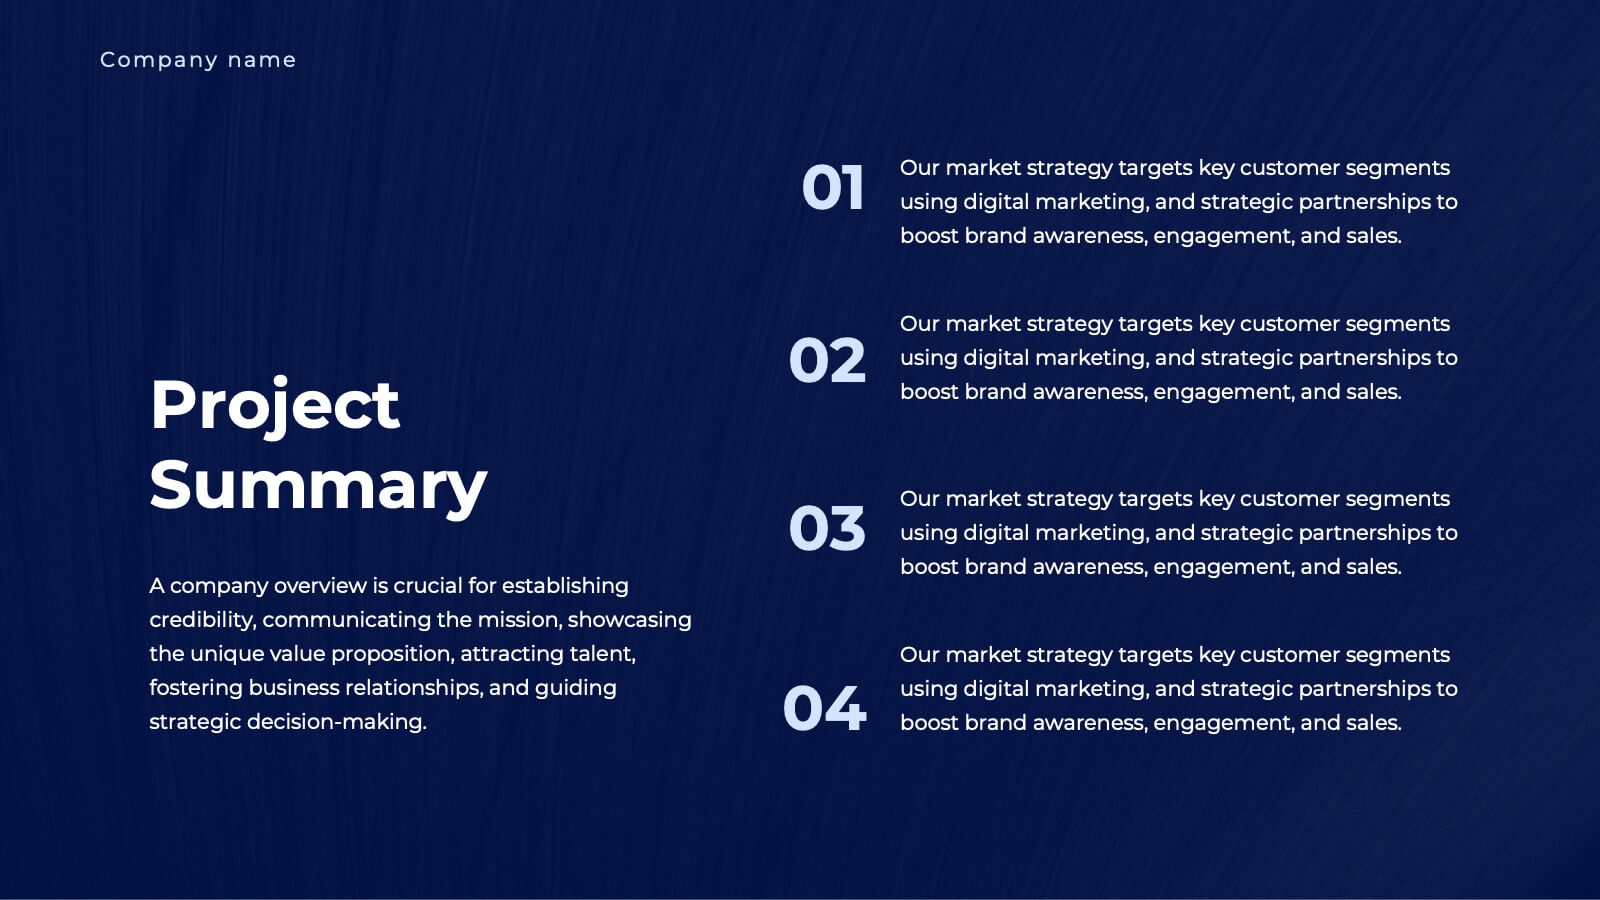
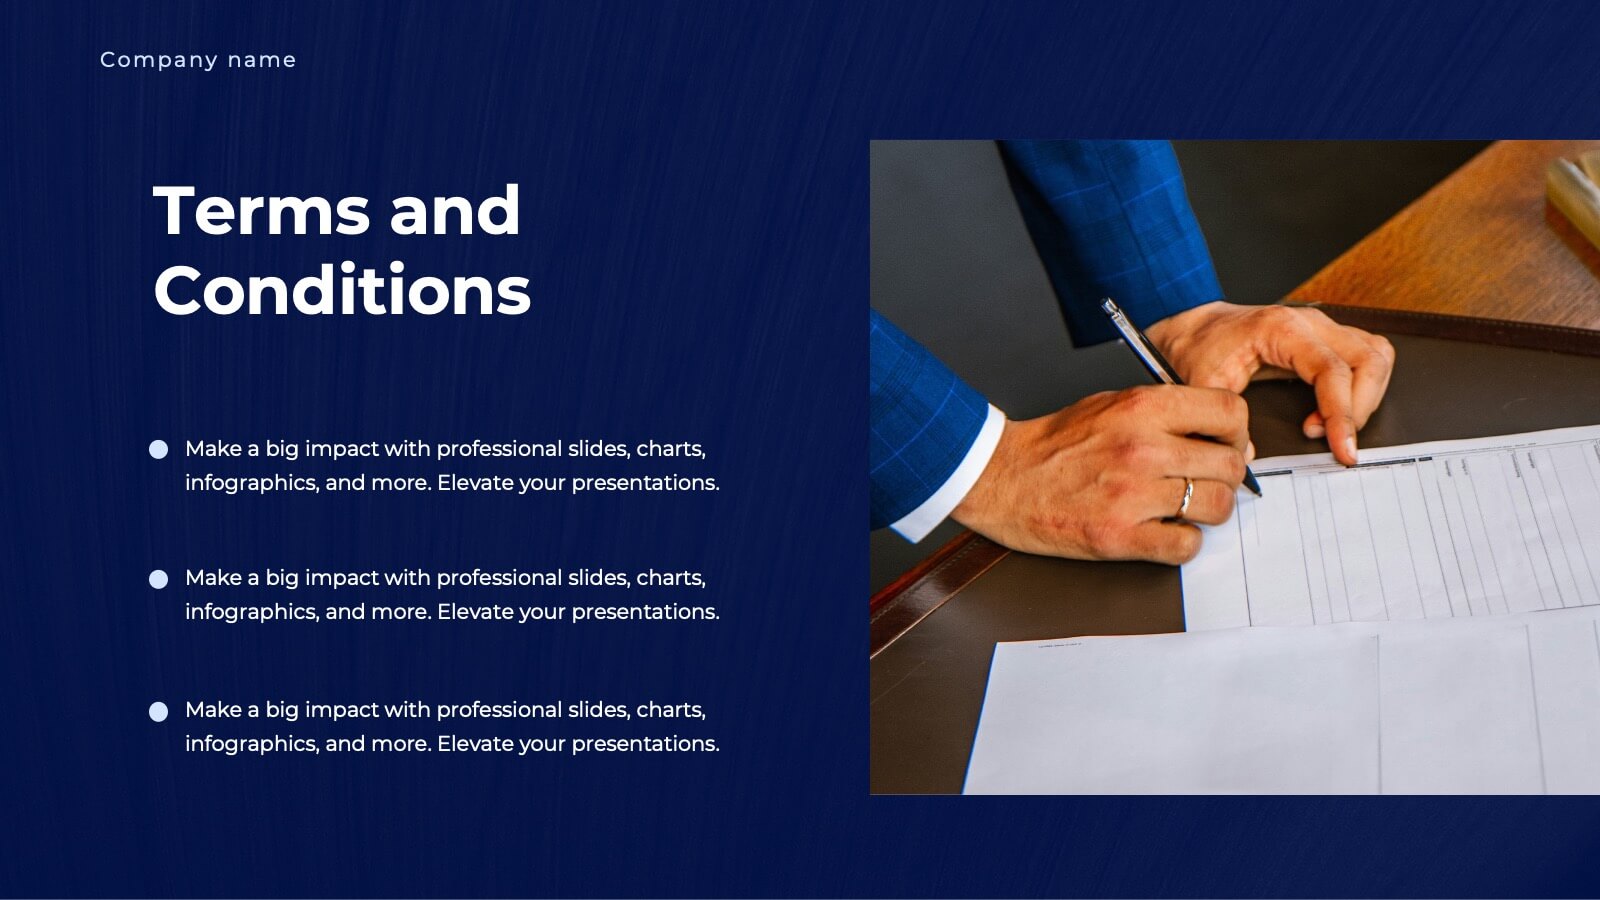
Unity Business Proposal Presentation
Take your business proposals to the next level with this elegant and comprehensive template! Perfect for presenting company overviews, project summaries, and detailed solutions. Ideal for business professionals looking to impress clients and stakeholders. Compatible with PowerPoint, Keynote, and Google Slides, this template ensures your proposals are impactful and professional.


6 diapositivas
Business Growth with TAM SAM SOM Framework
Fuel your next big idea with a clear, structured breakdown of market potential. This easy-to-follow visual helps explain the TAM, SAM, and SOM layers of business growth—ideal for investors, strategy teams, or product managers. Fully editable in PowerPoint, Keynote, and Google Slides for fast, seamless presentation design.