


Características


¿Tienes alguna pregunta?
Recomendar


4 diapositivas
Governance Practices for Risk Mitigation Presentation
Break down your risk strategy with the Governance Practices for Risk Mitigation Presentation. This slide features a step-stair 3D block visual, ideal for illustrating layered compliance initiatives, control measures, and escalation paths. Perfect for corporate governance teams, compliance officers, and strategic risk planners. Fully editable in PowerPoint, Keynote, and Google Slides.


22 diapositivas
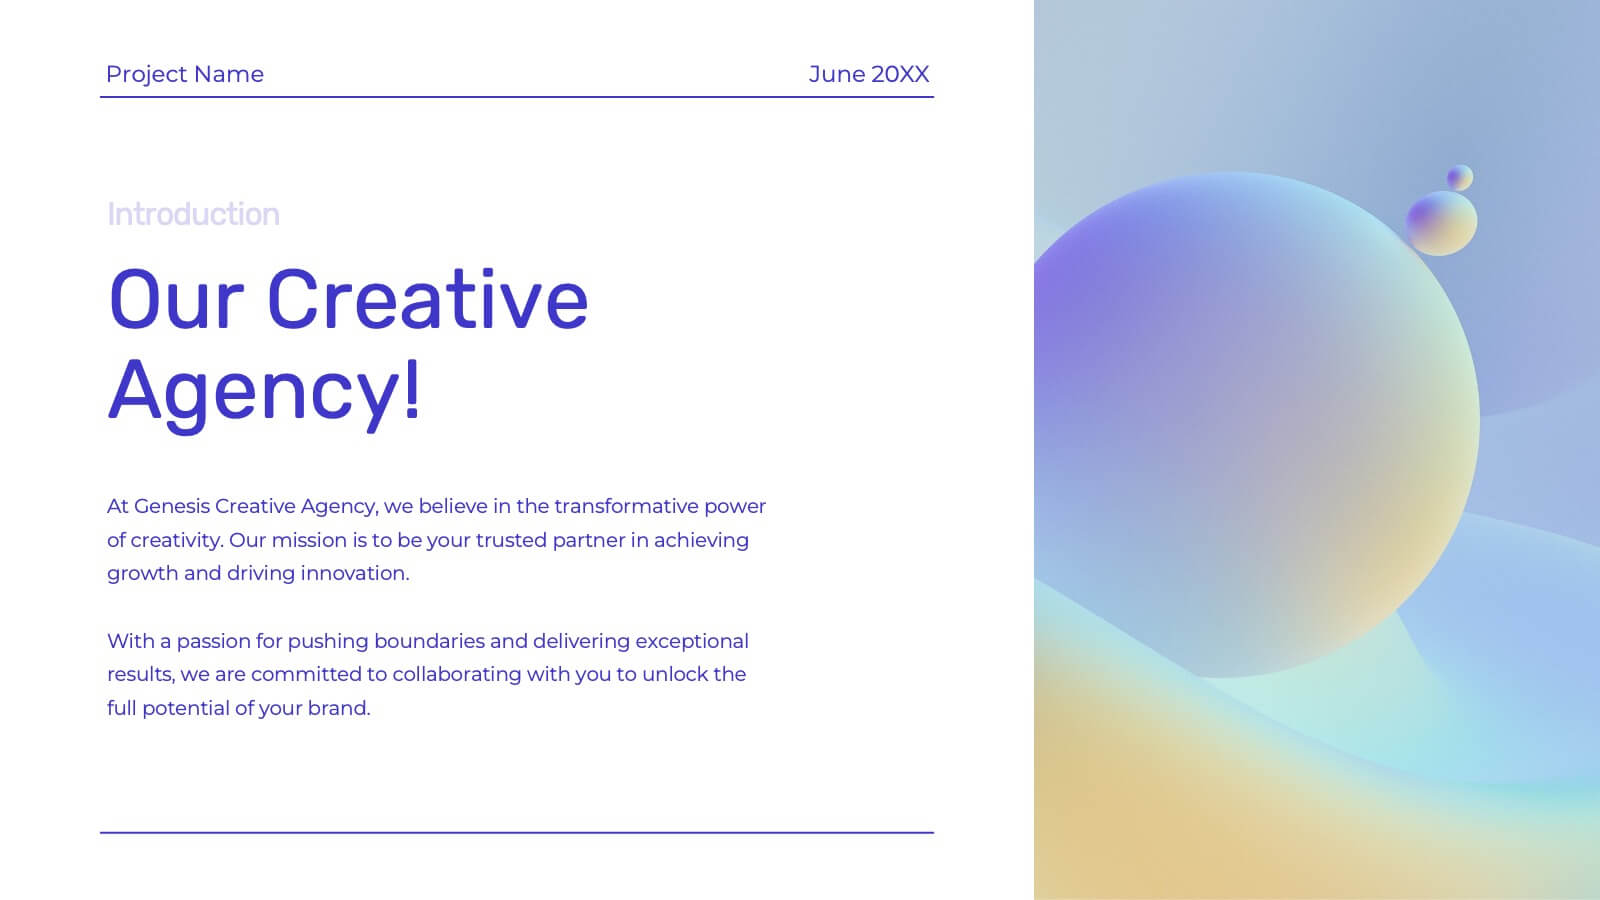
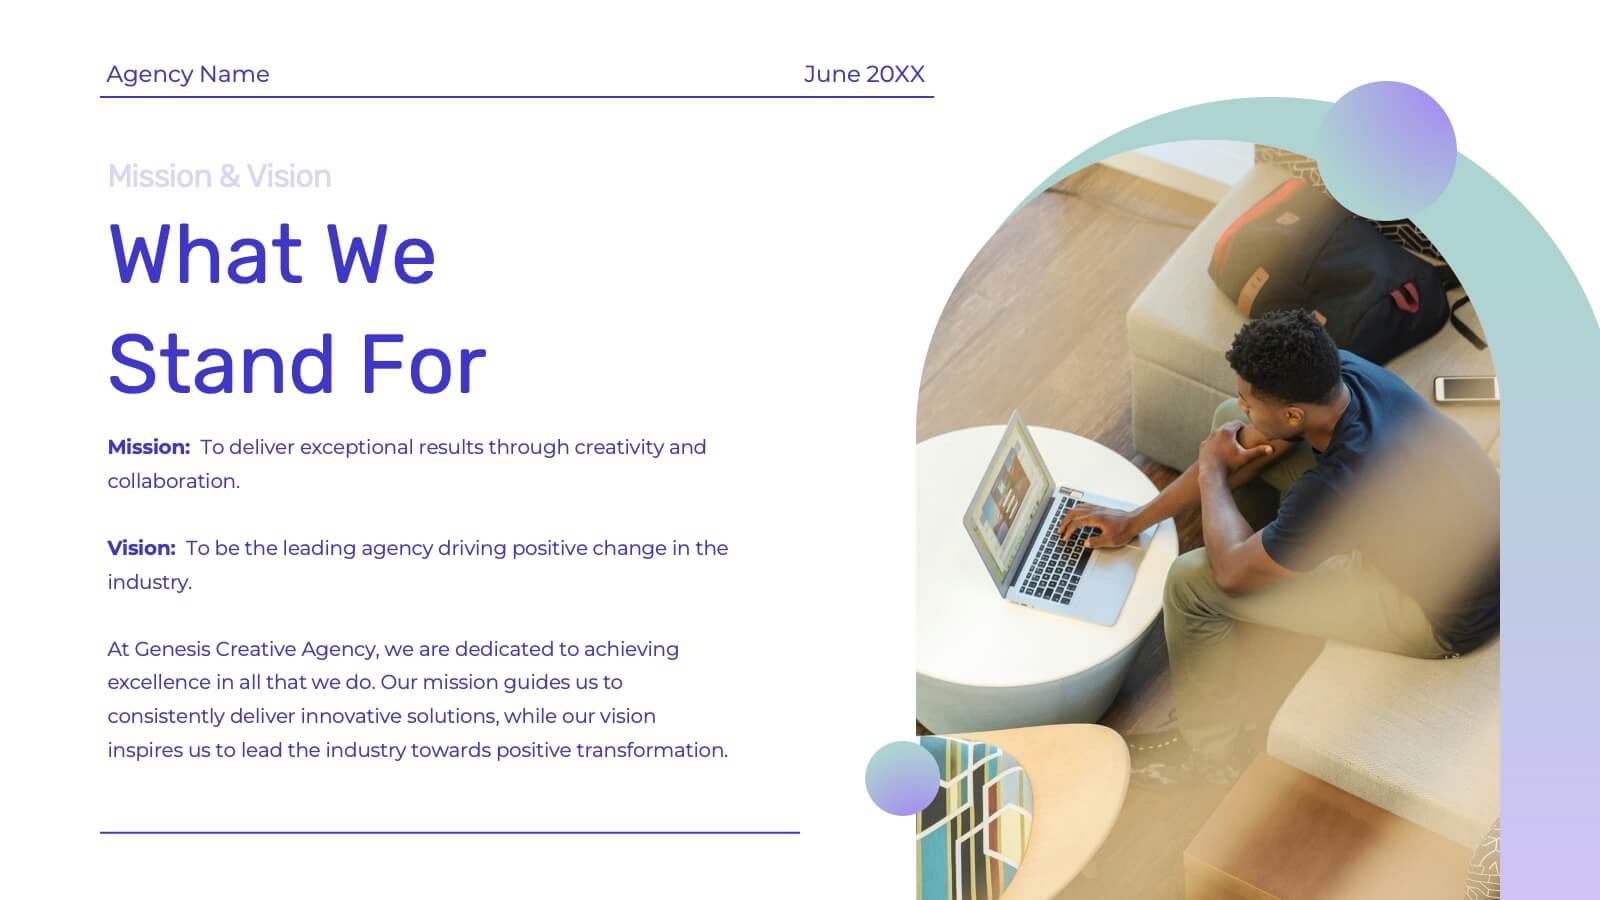
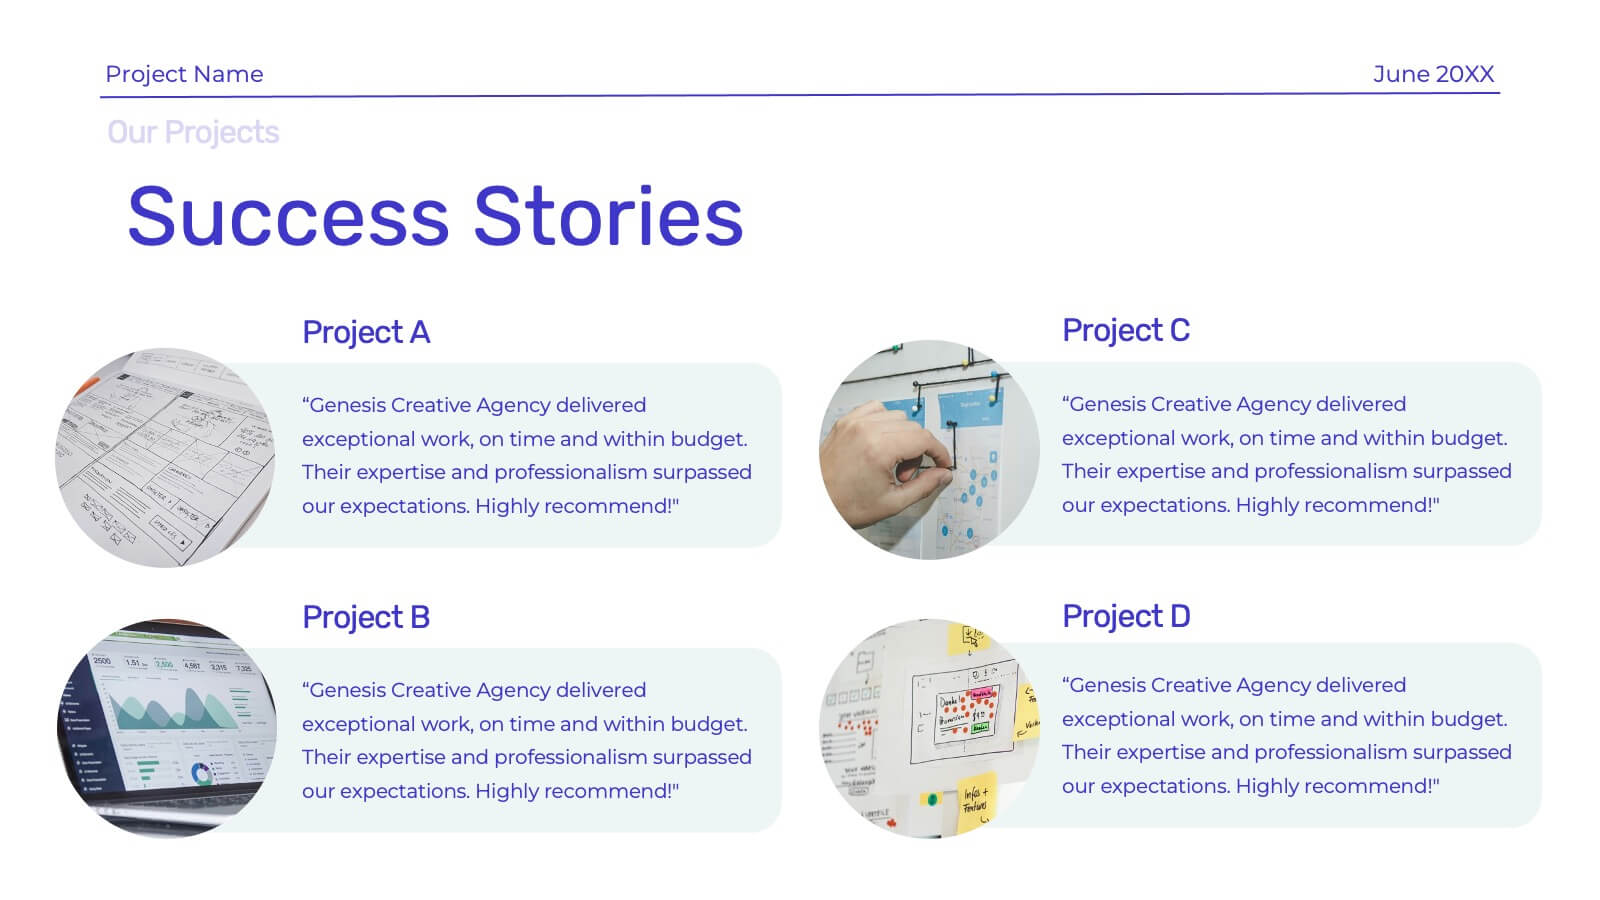
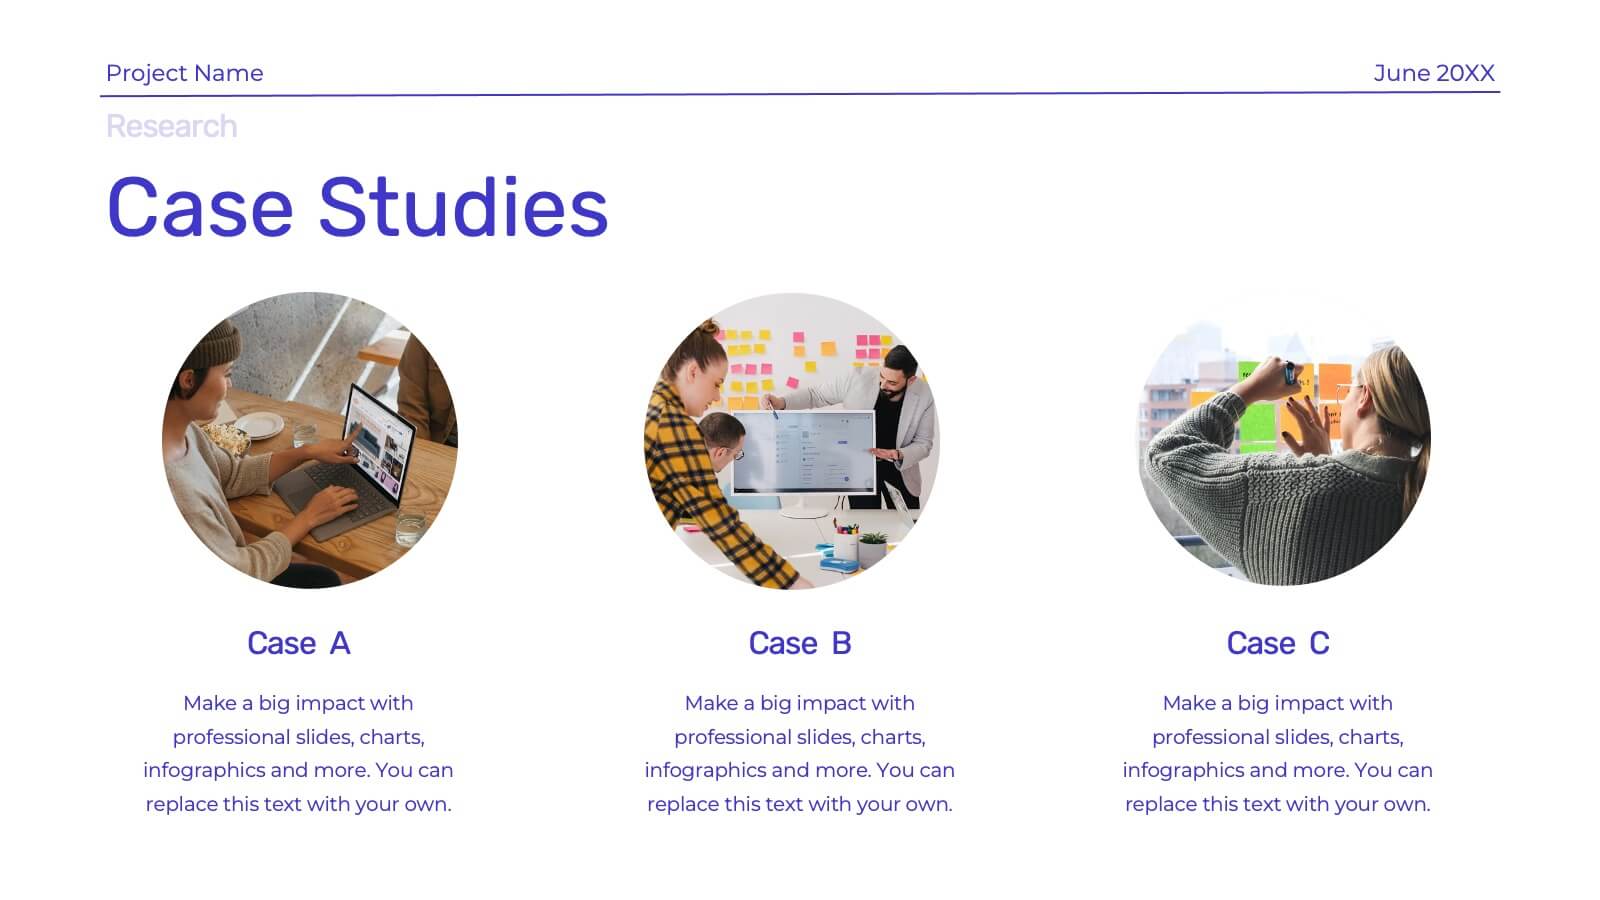
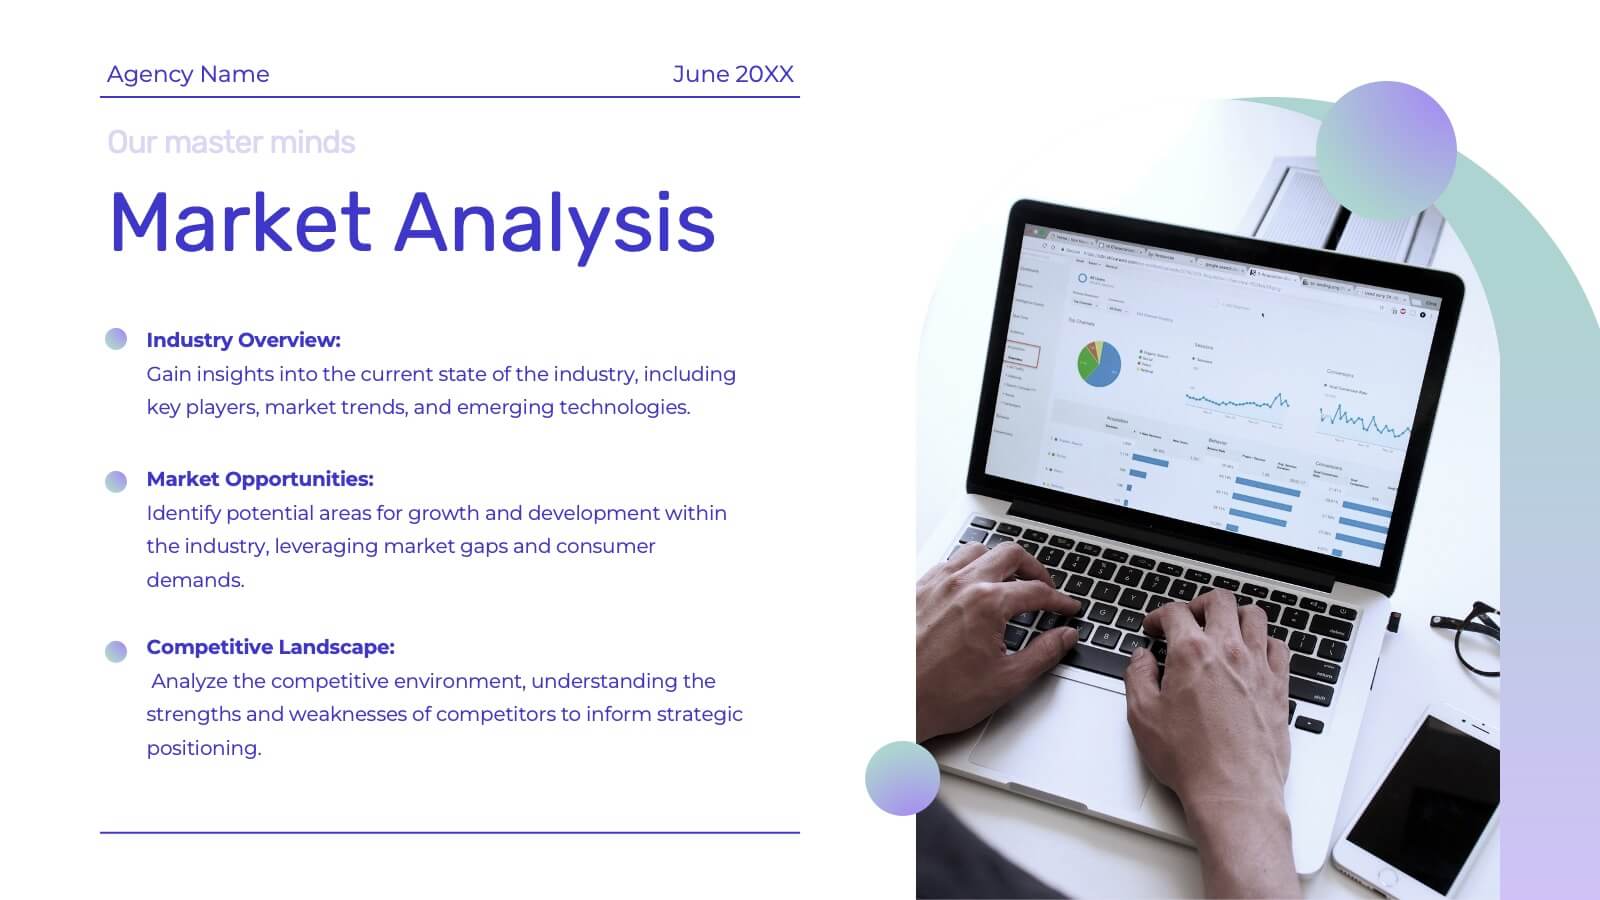
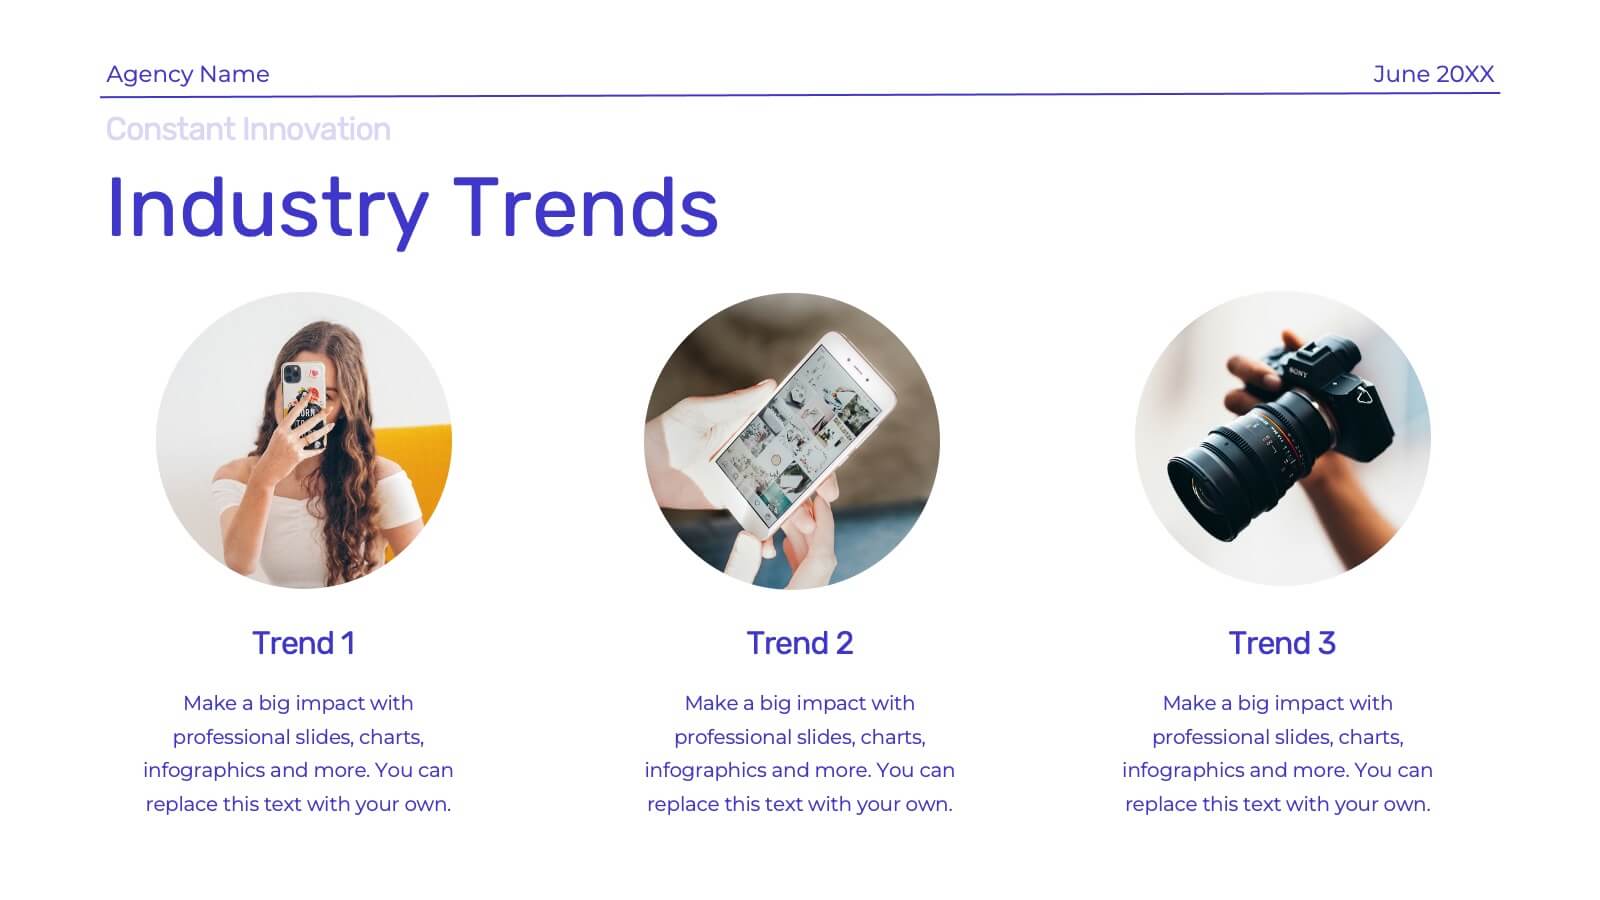
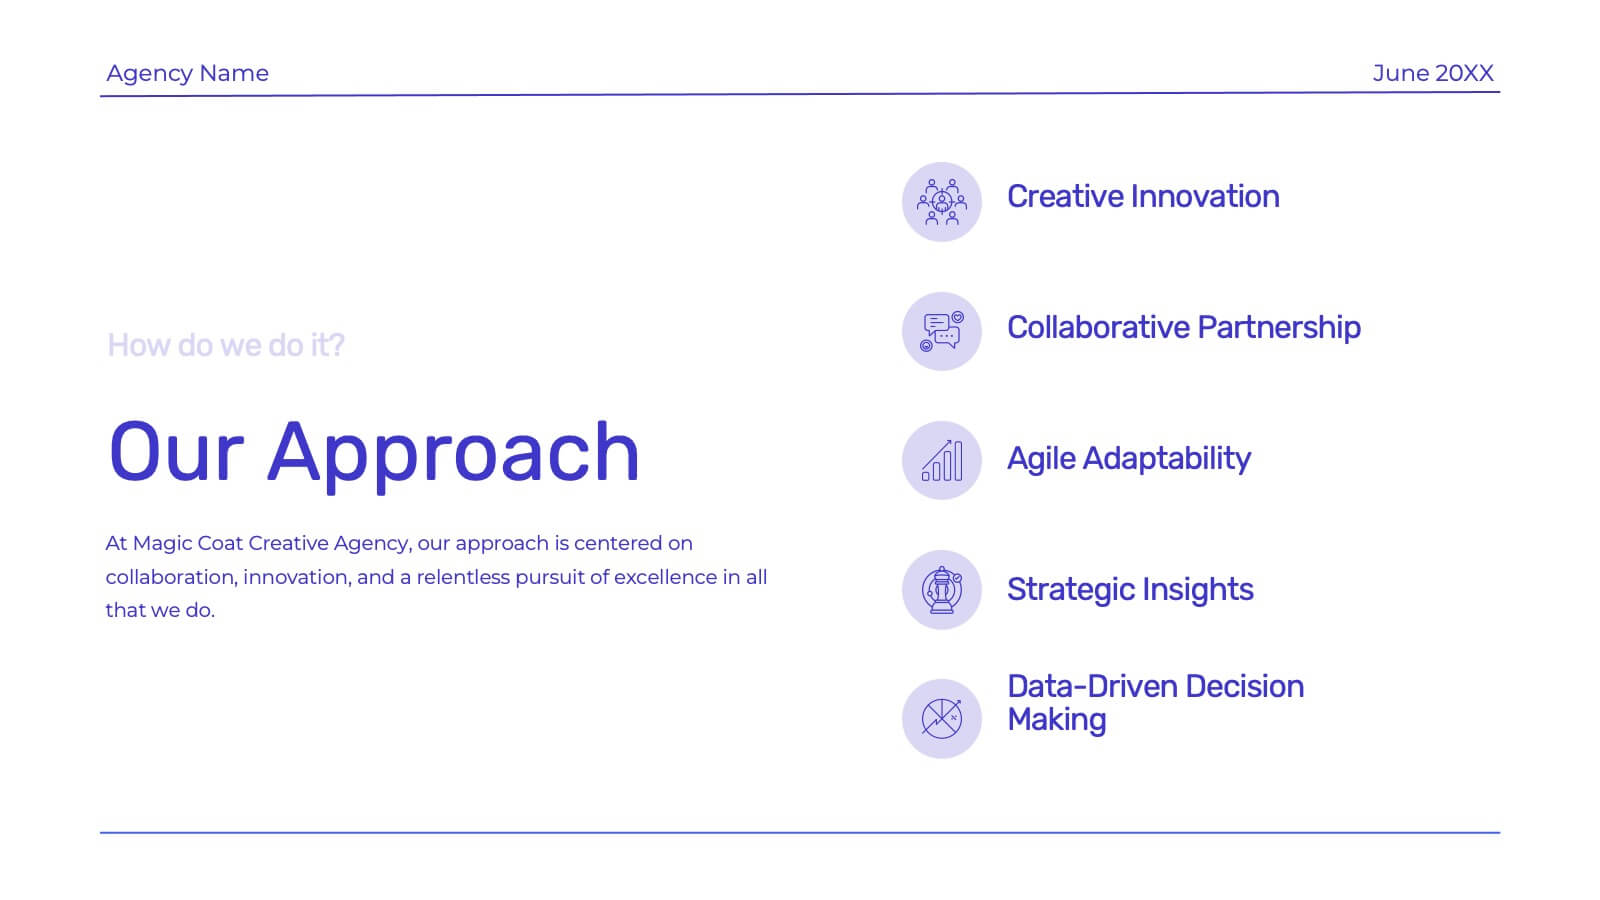
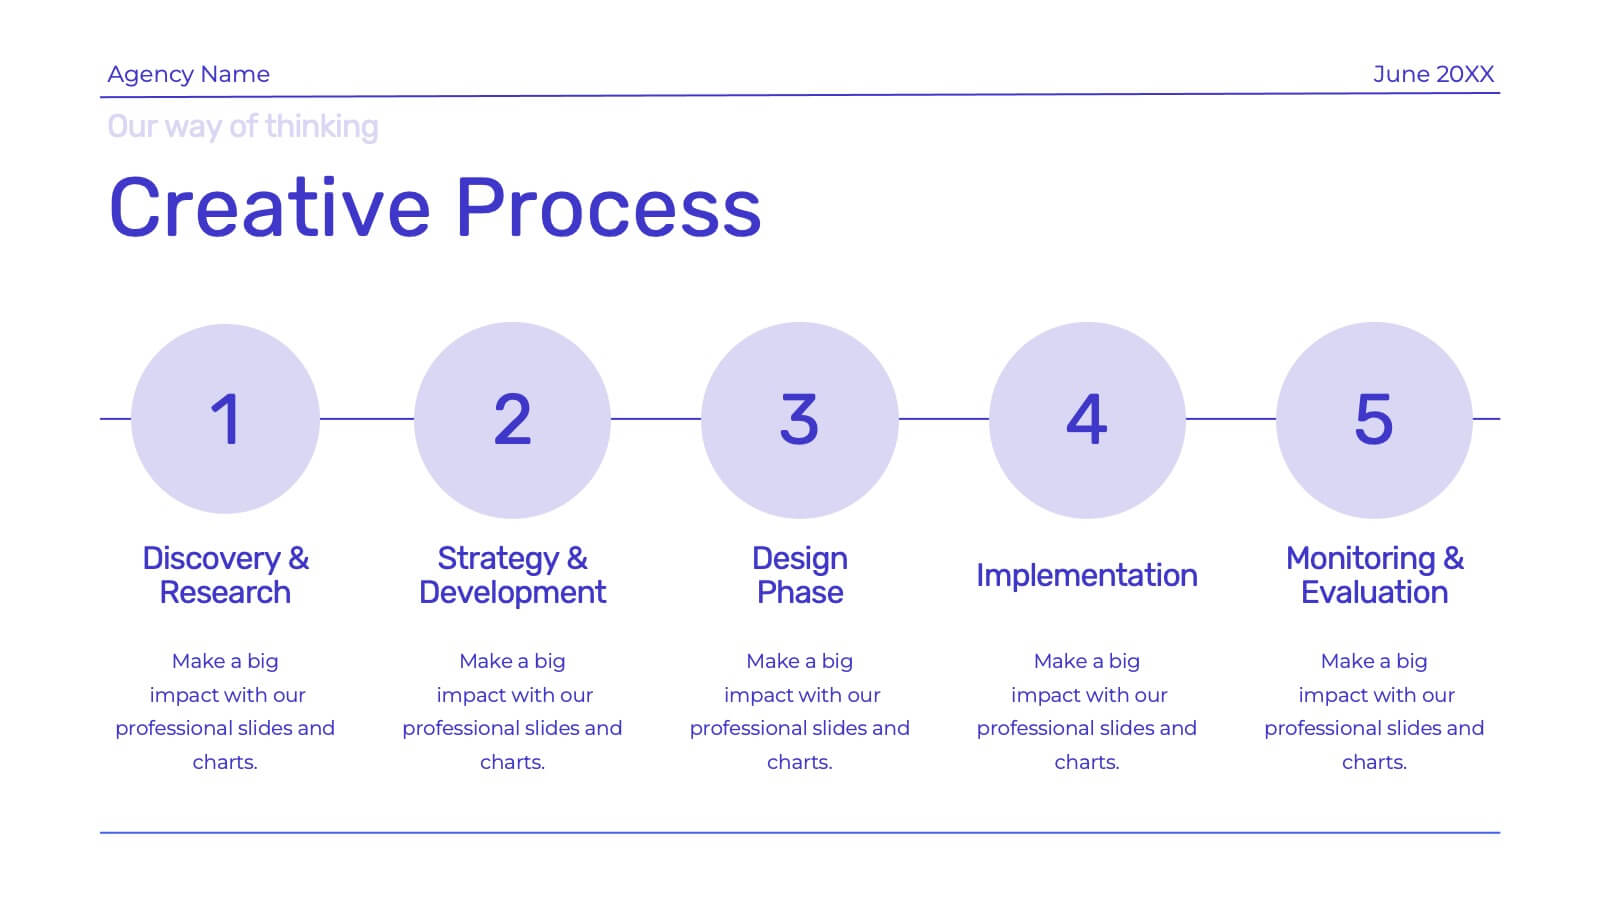
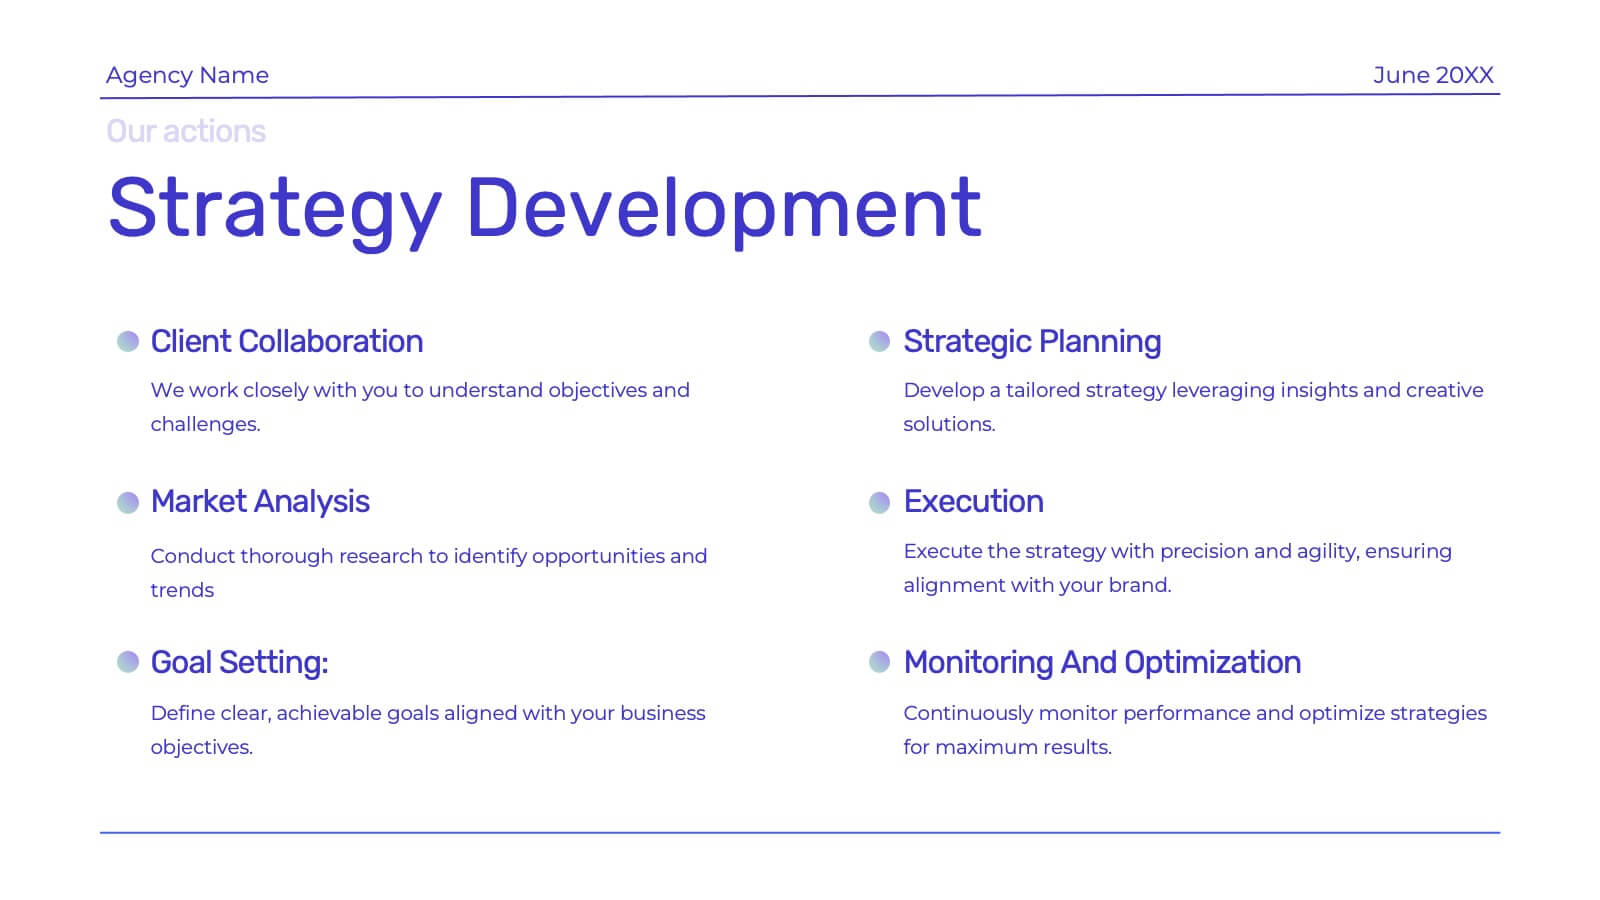
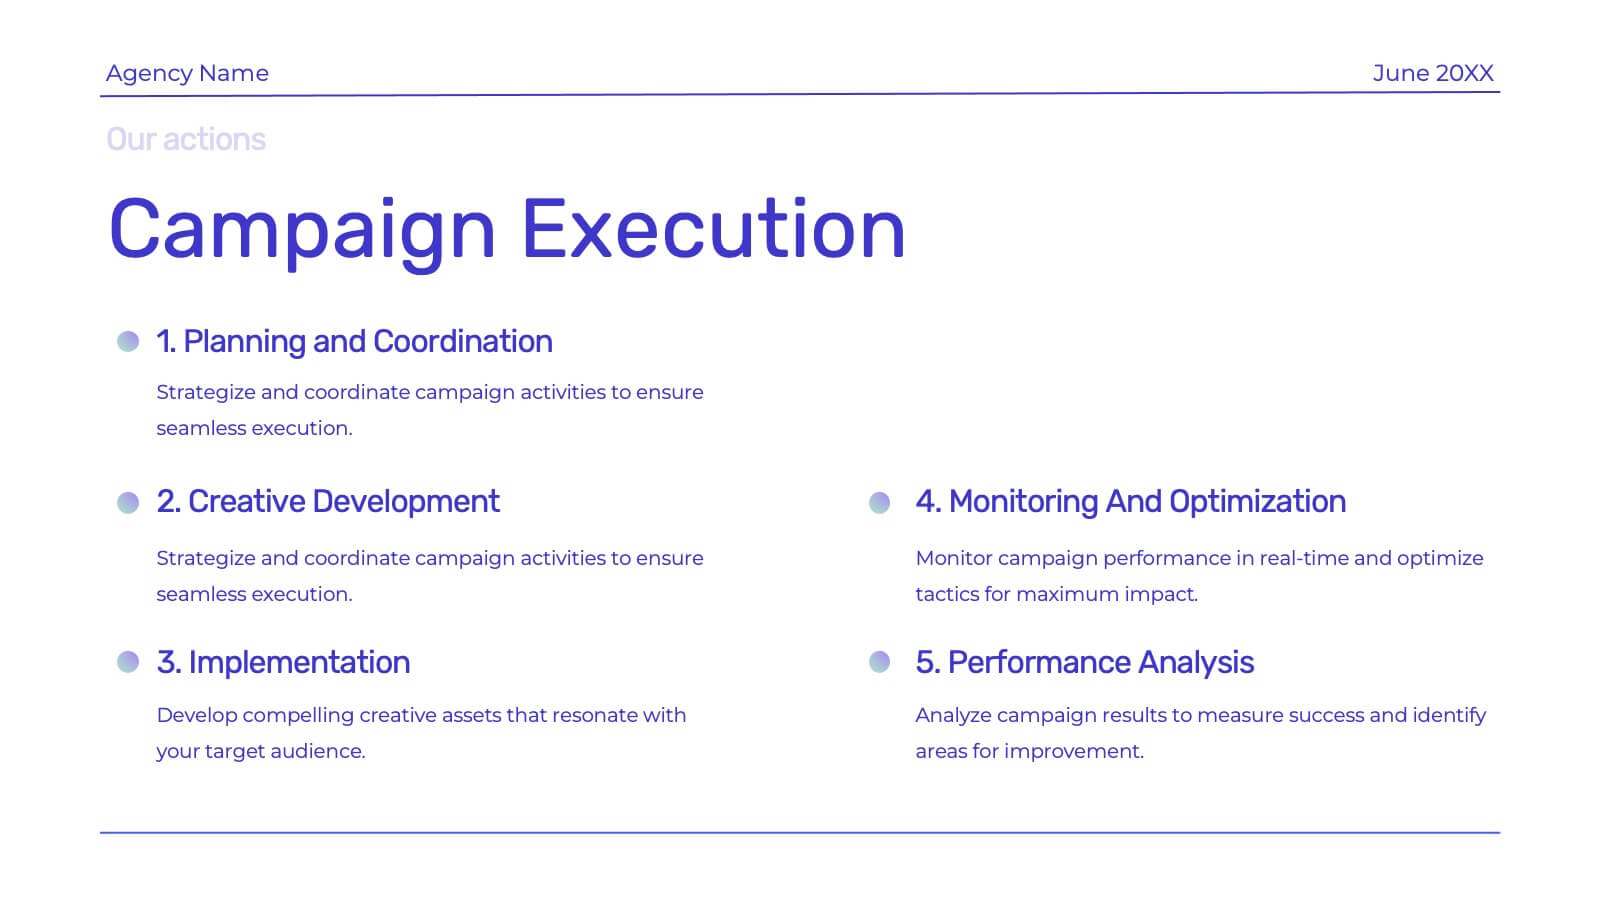
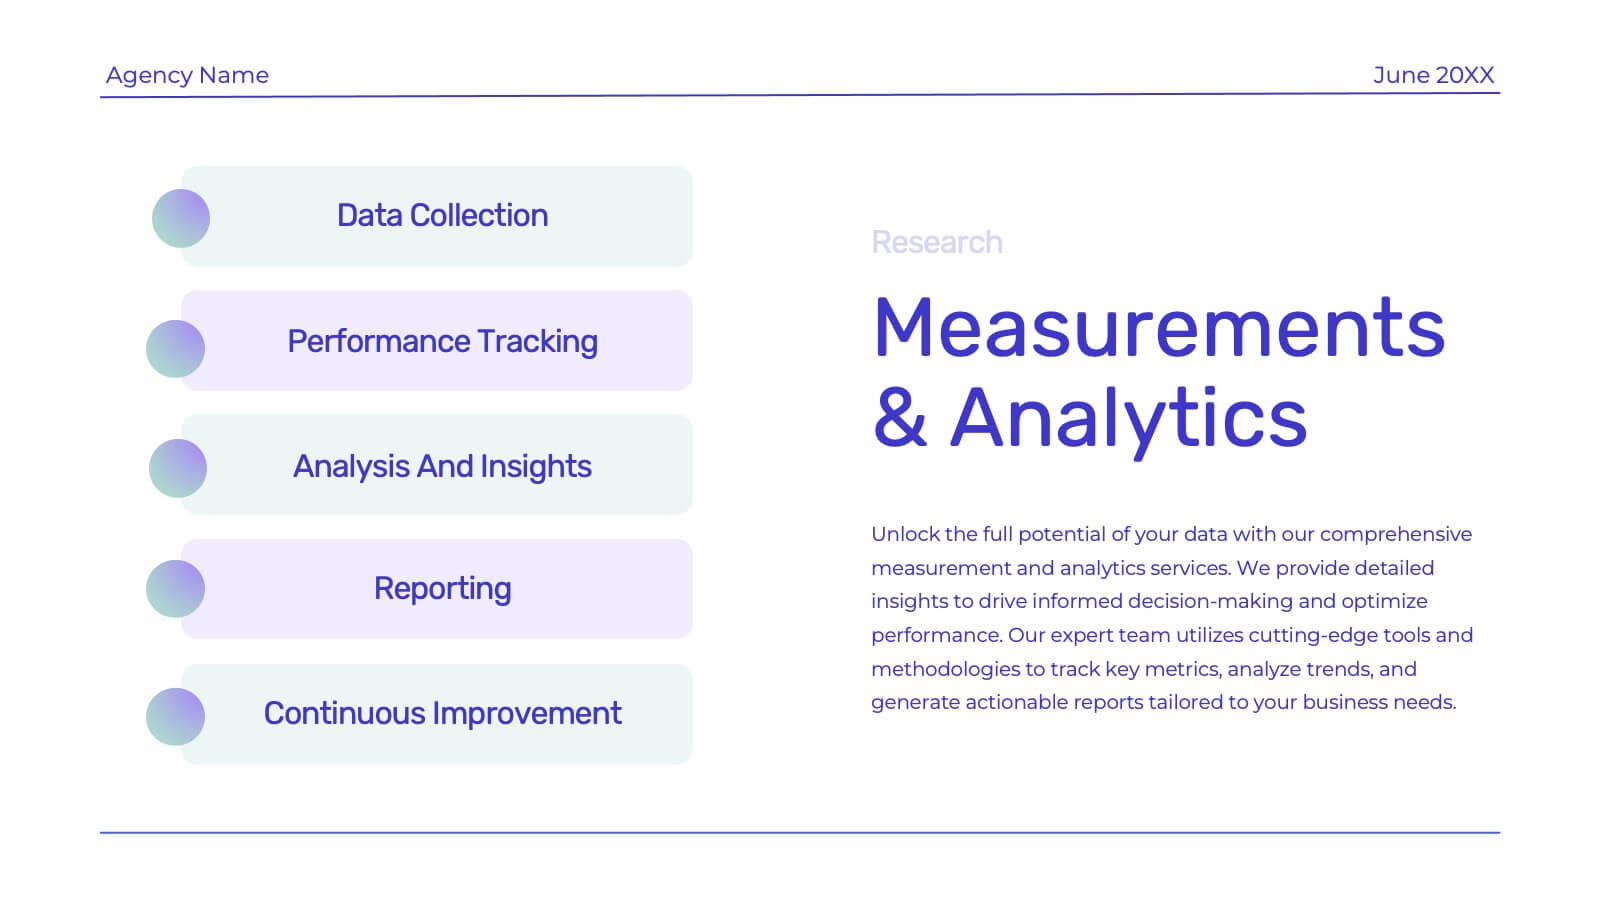
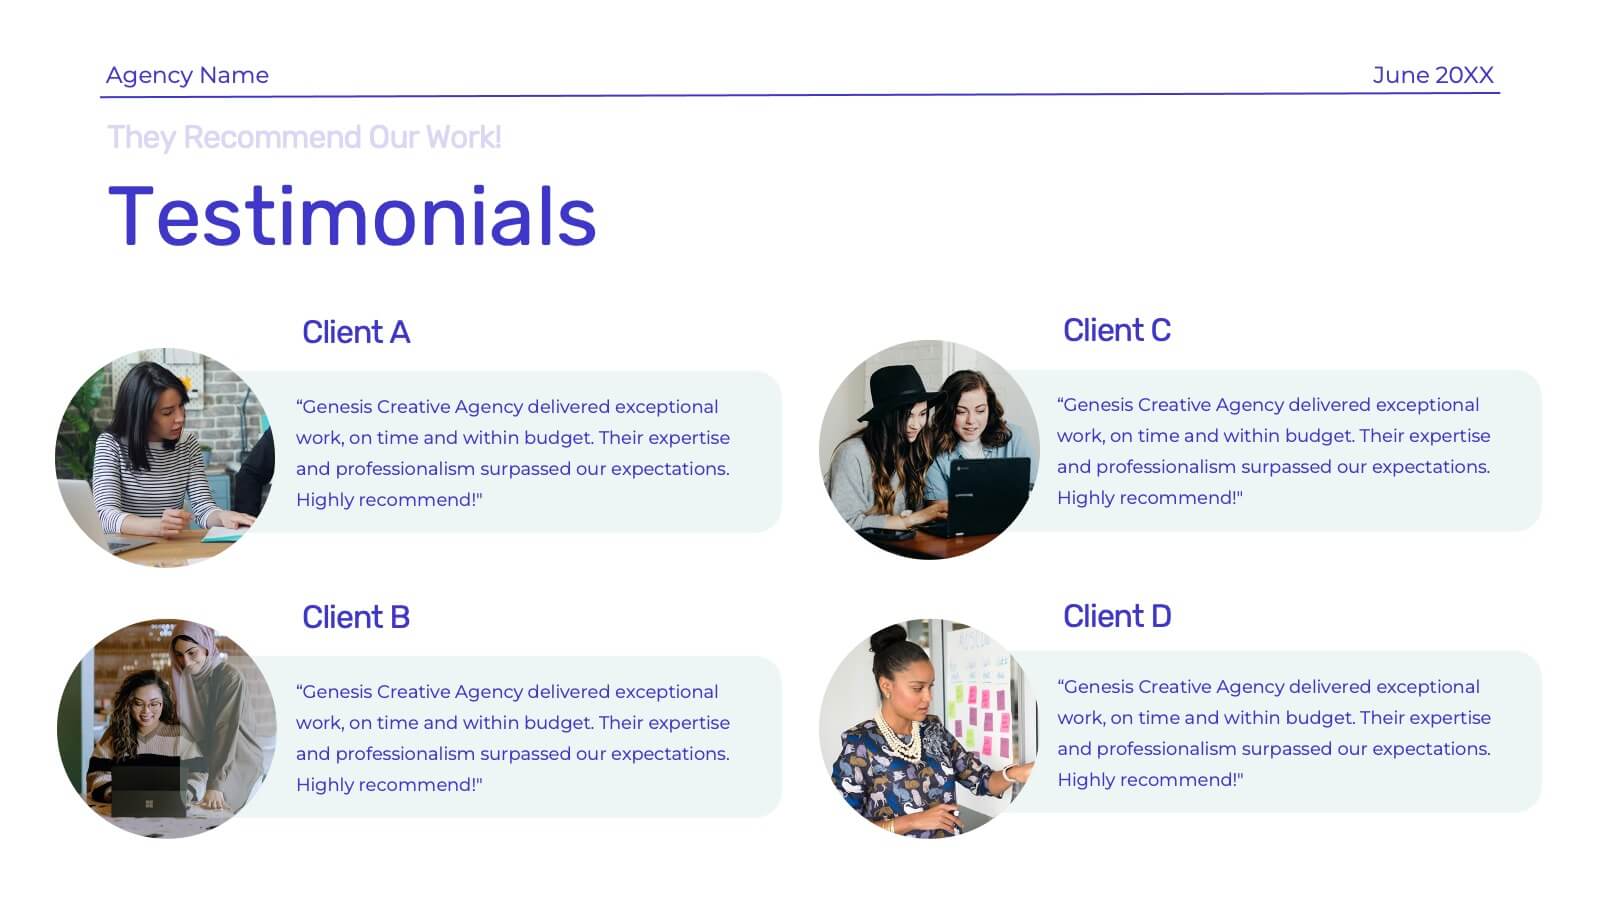
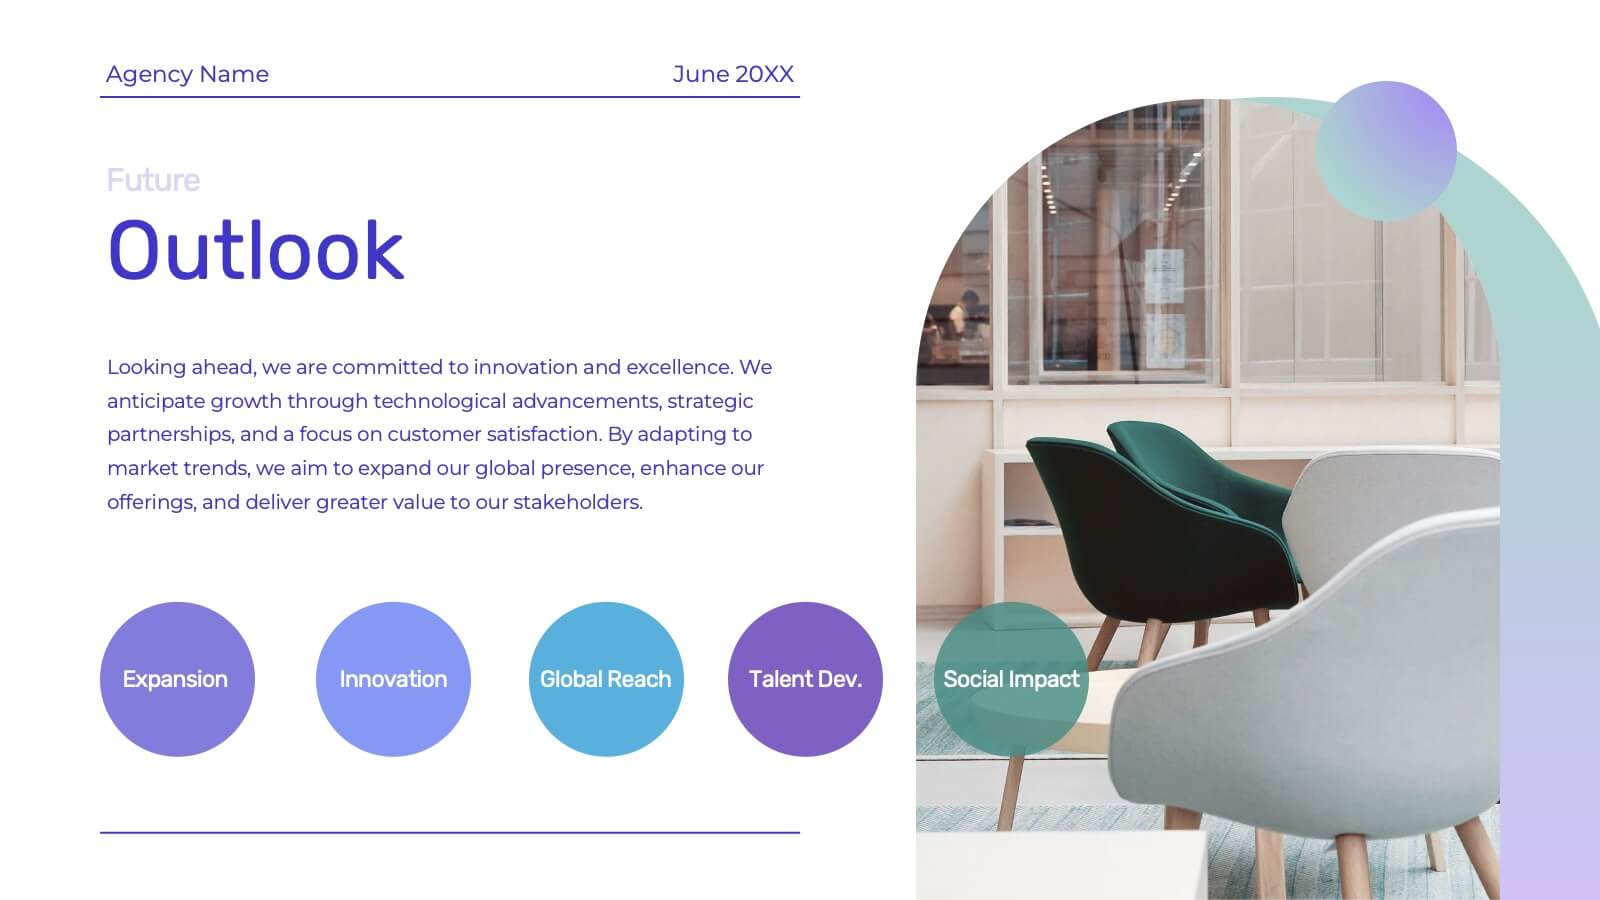
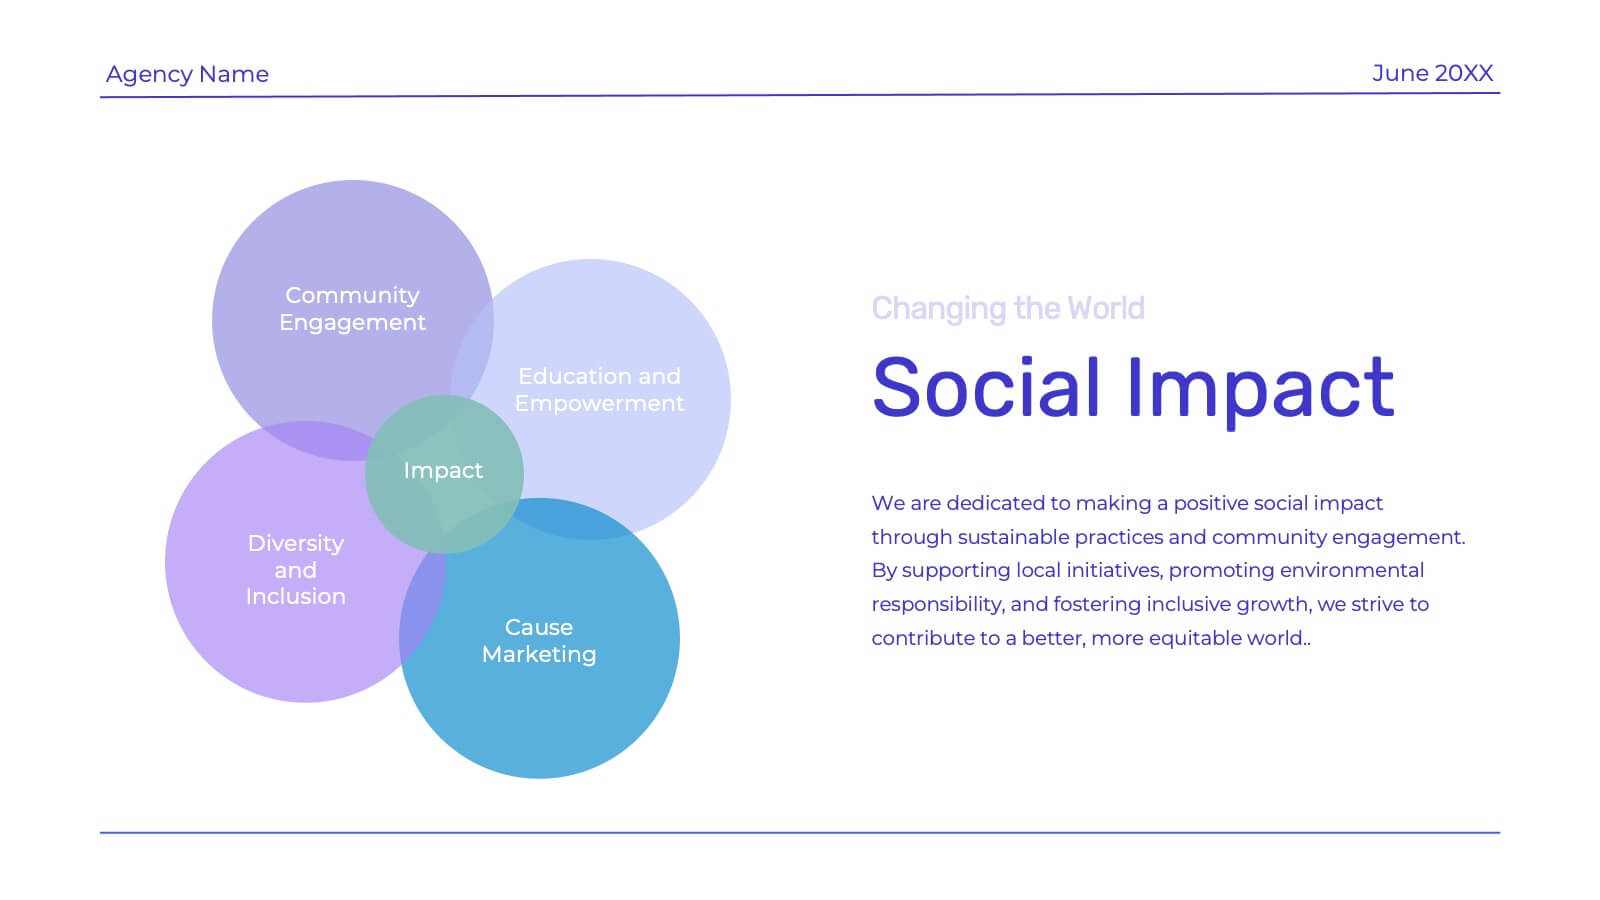
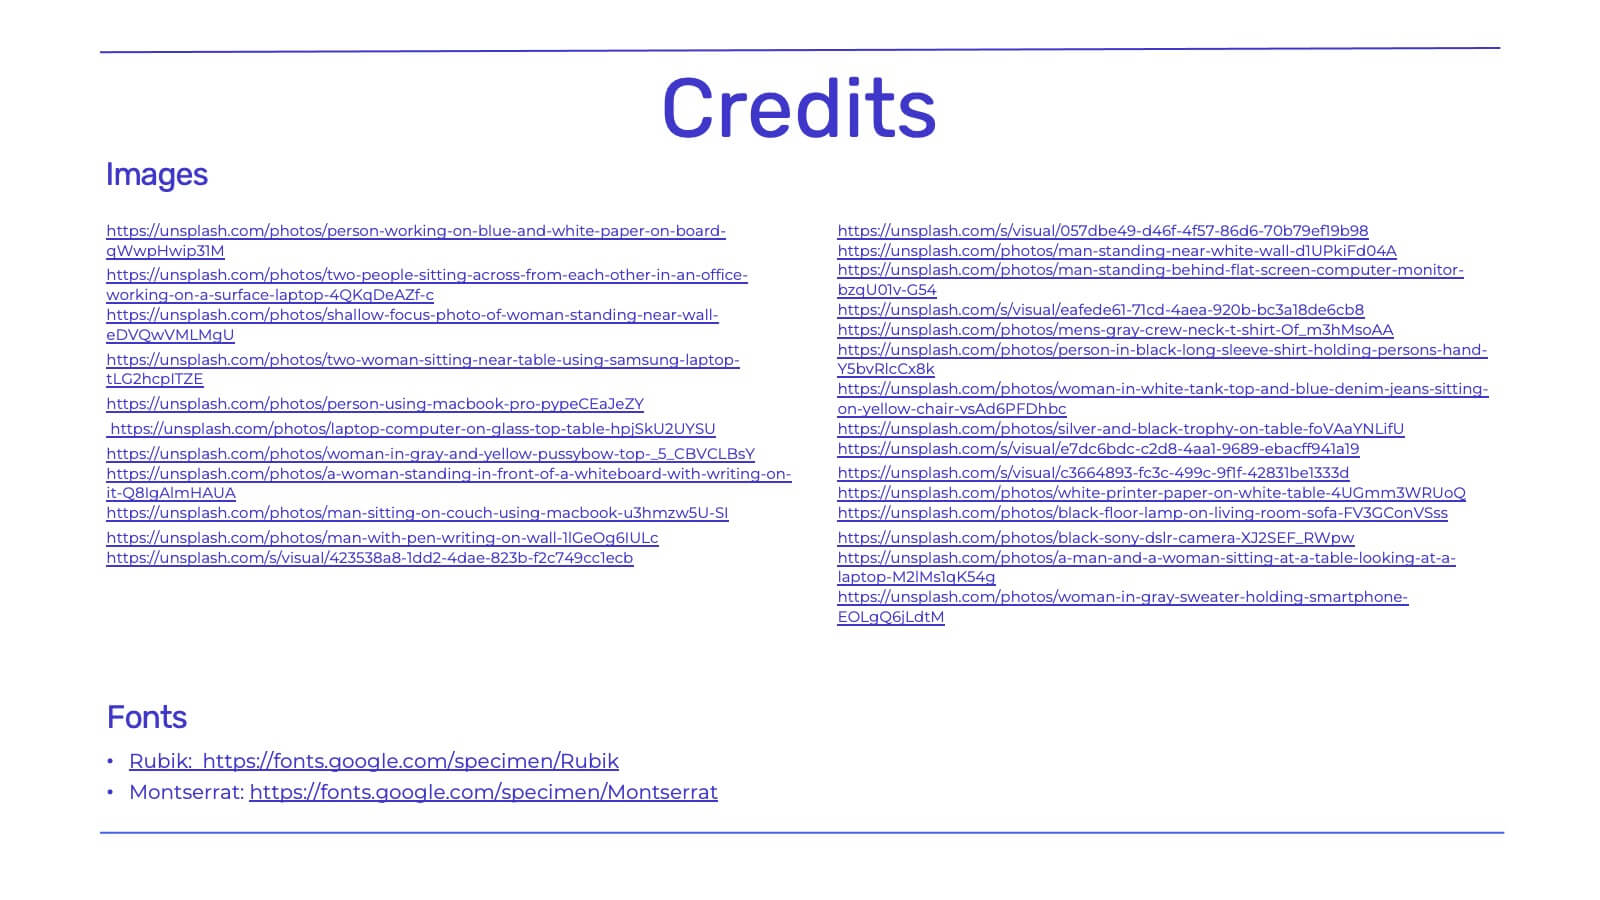
Genesis Creative Agency Pitch Deck Presentation
Showcase your creative agency’s strengths with this vibrant template. Highlight your team, services, success stories, and unique approach. Ideal for case studies, market analysis, and campaign execution. Fully compatible with PowerPoint, Keynote, and Google Slides.


4 diapositivas
Problem-Solving Strategy Presentation
Navigate challenges with confidence using this problem-solving strategy template! Designed to break down complex issues into manageable steps, this structured layout helps teams identify solutions effectively. Perfect for business leaders, project managers, and strategists aiming for clarity and action. Fully customizable and compatible with PowerPoint, Keynote, and Google Slides.


8 diapositivas
Social Media Strategy Presentation
The "Social Media Strategy Presentation" template is designed to outline effective social media strategies using a clear, visually appealing layout. This template segments essential components of a social media plan into categorized blocks, each designated for a specific platform or strategy component such as Facebook, Instagram, Twitter, and TikTok. The design includes icons that visually represent each platform, enhancing readability and engagement. This layout is ideal for digital marketers, social media managers, or businesses presenting their social media plans internally or in client meetings, ensuring each segment of their strategy is communicated clearly and effectively.


8 diapositivas
Asia Geographics and Business Analysis Map Presentation
Visualize regional insights with this Asia map template. Highlight business data, performance indicators, or strategic regions using callouts and color-coded zones. Perfect for market analysis, logistics, or geographic reporting. Fully customizable in PowerPoint, Keynote, or Google Slides to match your branding and presentation goals with clear, location-based storytelling.


4 diapositivas
IT Network Infrastructure Presentation
Optimize your IT infrastructure with this IT Network Infrastructure template. Designed with a cloud-based network architecture layout, this slide helps illustrate data flow, system components, and key IT connections in a structured format. Perfect for IT professionals, network engineers, and tech strategists, this fully customizable slide works seamlessly with PowerPoint, Keynote, and Google Slides.


8 diapositivas
Project Timeline and Schedule Presentation
Keep your projects on track with this clear and professional timeline layout. This presentation is designed to help you outline tasks, milestones, and deadlines week by week. Easily visualize the flow of work, allocate resources efficiently, and ensure everyone stays aligned on the project schedule. Perfect for business meetings, project proposals, team updates, and academic planning. Fully editable and compatible with PowerPoint, Keynote, and Google Slides.


6 diapositivas
Corporate Governance Strategy
Present your company’s leadership structure with clarity using this corporate governance strategy slide. This hexagonal framework highlights key areas such as vision, objectives, and strategy—surrounded by six supporting pillars. Each section includes editable icons and text for board responsibilities, ethics, oversight, and more. Ideal for executive updates, policy reviews, and stakeholder reports. Fully customizable in PowerPoint, Keynote, and Google Slides.


6 diapositivas
Market Structure Infographics
Explore market structure effectively with our Market Structure infographic template. This template is fully compatible with popular presentation software like PowerPoint, Keynote, and Google Slides, allowing you to easily customize it to illustrate and communicate various aspects of market structures. The Market Structure infographic template offers a visually engaging platform to explain different types of market structures, including perfect competition, monopolistic competition, oligopoly, and monopoly. Whether you're a student, economist, business professional, or anyone interested in economics and market dynamics, this template provides a user-friendly canvas to create informative presentations and educational materials. Deepen your understanding of market structure with this SEO-optimized infographic template, thoughtfully designed for clarity and ease of use. Customize it to showcase the characteristics, examples, and implications of each market structure, ensuring that your audience gains valuable insights into how markets function. Start crafting your personalized infographic today to explore the world of market structure in economics.


6 diapositivas
Platform-Specific Social Strategy Presentation
Break down your marketing approach by channel using this clear, platform-focused timeline. Highlight strategies for TikTok, Facebook, Instagram, X, and email in a linear, easy-to-read format. Ideal for digital marketers, content teams, and social media managers. Fully editable in PowerPoint, Keynote, and Google Slides to match your brand and strategy.


10 diapositivas
Crafting a Strong Business Mission Statement Presentation
Elevate your company’s identity with this modern, vertical infographic slide focused on mission development. Featuring five clearly stacked sections with iconography and text areas, this layout helps communicate core values, goals, and strategic intentions. Ideal for brand storytelling, startup pitches, and leadership decks. Fully editable in PowerPoint, Keynote, and Google Slides.


5 diapositivas
Puzzle-Based Team Alignment Strategy Presentation
Bring collaboration to the forefront with the Puzzle-Based Team Alignment Strategy Presentation. This creative layout uses interlocking puzzle pieces to represent interconnected team roles, milestones, or initiatives—perfect for showcasing synergy and strategic cohesion. Each section is color-coded and icon-enhanced for quick visual recognition, making it ideal for team briefings, onboarding, or workflow planning. Fully editable in PowerPoint, Keynote, and Google Slides.


5 diapositivas
Medical Services Infographics
Navigate the complexities of healthcare information with our medical services infographics. Rendered in a life-affirming palette of blue and red, these infographics elucidate various facets of medical services. The template serves as a lifeline for healthcare professionals, and public health advocates by providing a clear, visual narrative of services, processes, and advancements in the medical field. Compatible with Powerpoint, Keynote, and Google Slides. Its creative yet informative style, enhanced with relevant graphics and icons, ensure that critical information catches the eye, improves understanding, and encourages engagement.


7 diapositivas
Frequently Asked Question (FAQ) Guide Infographic
Unravel the art of answers with our "FAQ Guide" Infographic Template—your next step in revolutionizing how you communicate with curious customers. With its bold, eye-catching design, this template turns the routine task of answering questions into an engaging experience. Dive into a layout that blends vibrant visuals and crisp, clear typography to ensure your answers not only catch the eye but also stick in the mind. Whether you're in tech, retail, or any service-oriented industry, our template flexes to fit your brand’s unique flair. Customize with your colors, integrate your style, and transform your customer service into an impressive visual journey. Perfect for websites, marketing materials, or quick training sessions, this template makes information fun and accessible. Equip your team with the tools to engage, enlighten, and excite with every FAQ presented. Compatible with all leading graphic design software, it's ready to go whenever you are.


5 diapositivas
US State-by-State Sales Breakdown Presentation
Visualize regional performance with the US State-by-State Sales Breakdown Presentation. This slide uses a clean U.S. map layout to highlight state-specific sales metrics alongside color-coded legends and icons. Ideal for showcasing key market insights, regional trends, or territory growth. Fully editable in Canva, PowerPoint, and Google Slides.


12 diapositivas
Understanding Digital Currencies Presentation
Simplify the complexity of crypto ecosystems with the Understanding Digital Currencies presentation template. Designed around a wallet-style visual, this layout highlights key features of various cryptocurrencies using six labeled touchpoints. Perfect for introducing Bitcoin, Ethereum, altcoins, and digital wallets in educational, financial, or blockchain-related presentations. Ideal for crypto educators, fintech startups, and investment analysts. Compatible with PowerPoint, Keynote, and Google Slides.


4 diapositivas
Communication Model and Channels Presentation
Illustrate how your messages move through various channels using this clean, visual communication model slide. Ideal for team briefings, marketing workflows, or internal training, it simplifies how information is shared across platforms. Fully editable in Canva, PowerPoint, and Google Slides for seamless customization to match your branding and messaging goals.