


Características


¿Tienes alguna pregunta?
Recomendar


7 diapositivas
Venn Diagram Infographic Presentation Template
A Venn diagram is a type of chart that uses circles to show the similarities and differences between two or more sets of items. The circles overlap in the areas where the items have something in common, and the non-overlapping areas show the items that are unique to each set. This template is perfect for showing how different things are alike and different. This template includes lots of diagrams with circles that you can customize to show all the similarities between your different information. You can also add pictures and charts to make it look more appealing with your personal data.


6 diapositivas
Managing Product Maturity and Decline Presentation
Explore the critical phases of 'Managing Product Maturity and Decline' with this detailed presentation template. It's designed for professionals in product management, illustrating strategies to handle product lifecycle stages effectively. This template is a must-have for seminars and workshops focusing on prolonging product lifespan and maximizing returns.


6 diapositivas
Optimizing Business Through Value Chain Presentation
Improve operational efficiency and gain competitive advantage with the Optimizing Business Through Value Chain Presentation. This template breaks down each segment of your business activities—from inbound logistics to service delivery—using a modern chain-style visual layout. Perfect for strategy meetings, operational planning, or business model analysis. Fully editable in PowerPoint, Keynote, Canva, and Google Slides.


6 diapositivas
Business Growth and Progress Metrics Presentation
Showcase milestones, trends, and business wins with this sleek bar chart and line graph combo. Designed to illustrate upward momentum, each slide highlights progress using a trophy peak icon, 5 key steps, and editable labels. Ideal for quarterly reviews, growth tracking, and strategic updates. Fully compatible with PowerPoint, Keynote, and Google Slides.


7 diapositivas
SWOT Table Infographic
A SWOT table is a strategic planning tool that helps organizations identify and analyze their internal strengths and weaknesses, as well as external opportunities and threats. This infographic template is a strategic planning tool used by businesses to identify internal and external factors that can impact their performance and competitiveness. This template consists of four quadrants, each representing one of the four components: strengths, weaknesses, opportunities, and threats. The table is organized in a grid format with rows and columns. This template is completely customizable and compatible with Powerpoint, Keynote, and Google Slides.


3 diapositivas
Stock Market Investment Analysis Presentation
Unlock the secrets of the stock market with our "Stock Market Investment Analysis" presentation templates. Ideal for financial analysts and investors, these templates provide a clear framework for analyzing trends and making informed decisions. With easy-to-edit elements and professional design, they are perfect for delivering compelling investment insights. Compatible with PowerPoint, Keynote, and Google Slides, they ensure your analysis looks sharp and persuasive across all platforms.


12 diapositivas
Corporate Growth Strategy Steps Presentation
Showcase your expansion roadmap with this Corporate Growth Strategy Steps Presentation. Designed as a five-step vertical ladder, this layout is perfect for illustrating progressive stages like market entry, development, scaling, innovation, and leadership. Each level includes editable icons and text placeholders for clarity and customization. Fully compatible with PowerPoint, Keynote, and Google Slides.


6 diapositivas
6-Step Circular Process Diagram Presentation
Bring your workflow to life with a clean circular layout that makes every phase feel connected and easy to follow. This presentation breaks complex processes into six intuitive steps, ideal for strategy, planning, or operations. Fully compatible with PowerPoint, Keynote, and Google Slides.


20 diapositivas
Egeria Artist Portfolio Presentation
Showcase your artistry with this vibrant portfolio template, featuring sections for project displays, creative process, awards, and testimonials. Perfect for artists seeking a polished presentation of their work. Customizable and suitable for PowerPoint, Keynote, and Google Slides, this template highlights your unique style and professional journey.


6 diapositivas
Financial Report Summary Presentation
Showcase key financial highlights with the Financial Report Summary slide. Featuring a central moneybag icon surrounded by currency symbols, this layout is ideal for presenting up to five critical financial insights or revenue sources. Each label is paired with editable titles and descriptions to keep your content clear and relevant. Fully compatible with PowerPoint, Keynote, and Google Slides for effortless customization.

20 diapositivas
Valor Creative Portfolio Presentation
Step into creativity with this stunning portfolio template! Showcase your projects, design philosophy, and client testimonials with style and flair. Ideal for designers, artists, and creatives wanting to impress. Compatible with PowerPoint, Keynote, and Google Slides, this template elevates every portfolio to new heights. Perfect for making a lasting impact.


26 diapositivas
Remote Work Best Practices Creative Presentation
Navigate the world of telecommuting with our Remote Work Best Practices presentation template, available for Powerpoint, Google Slides, and Keynote. This template is specially designed for the modern remote work environment, incorporating a blend of professional and engaging visuals that reflect the flexibility and innovation of working from home. The template features customizable slides for outlining communication tools, scheduling, and mental health tips. Whether you're onboarding new staff or refining your company's remote policies, this template will help you present a comprehensive guide to succeeding in the remote work landscape.


7 diapositivas
Relationship Connectivity Infographic
The Relationship Connectivity Infographic provides a structured visualization to represent the interconnectedness of various elements within a system or project. This graphic organizes components into a cohesive layout that highlights how each part is related to and impacts the others. Ideal for demonstrating the complex synergy between different departments, phases of a project, or any scenario requiring a clear display of relationships, this infographic serves as an essential tool for planners, educators, and managers. It is designed to be user-friendly and is compatible with a range of platforms, including PowerPoint, Google Slides, and Keynote, making it easily customizable.


6 diapositivas
Breast Cancer Effects Infographic
Breast Cancer Awareness Month, is an annual international health campaign organized by various organizations to raise awareness about breast cancer, highlight the importance of early detection and treatment, and provide support for those affected by the disease. This infographic template is a visual representation that provides information about the various effects and impacts of breast cancer on individuals' health, well-being, and daily lives. This infographic can be used to raise awareness, educate, and support individuals who are affected by breast cancer, as well as their families and communities.


7 diapositivas
Geometric Infographic Presentation Template
Our Geometric Infographic template will help you quickly create an original, beautiful and professional presentation with charts and diagrams of any kind. The template includes fully editable slides with a number of built-in shapes, as well as transitions. You can use the template for any kind of presentation involving geometrics. It’s ideal for product presentations and market analysis, but you can also use it to showcase your business case. This geometric Infographic template is a great way to present a large amount of information to an audience and features a clean and modern design!

24 diapositivas
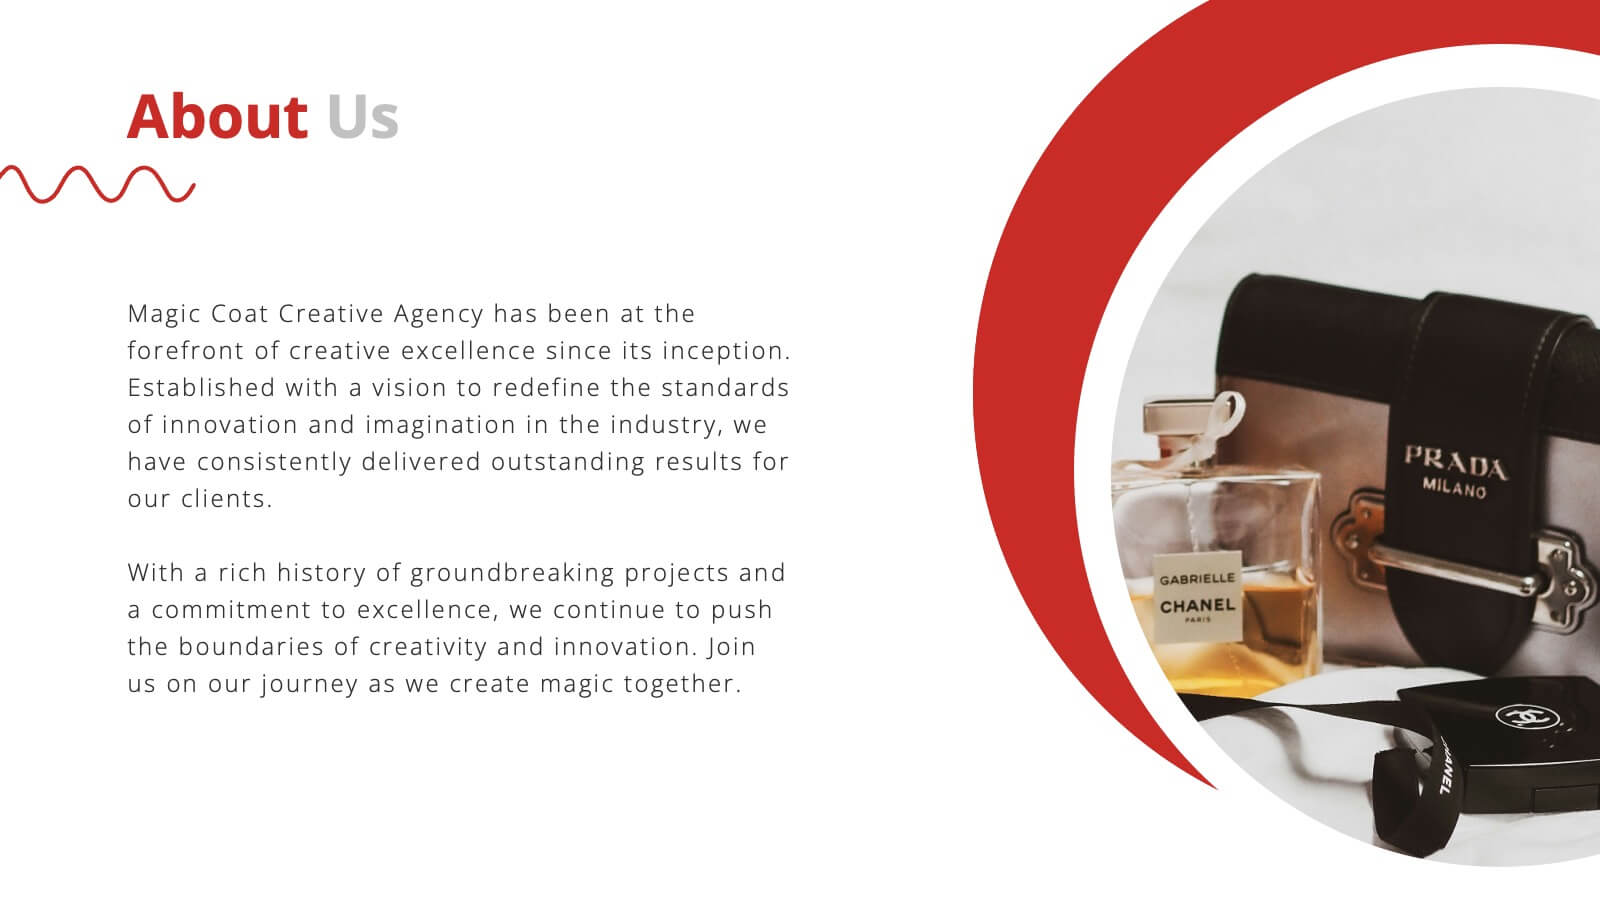
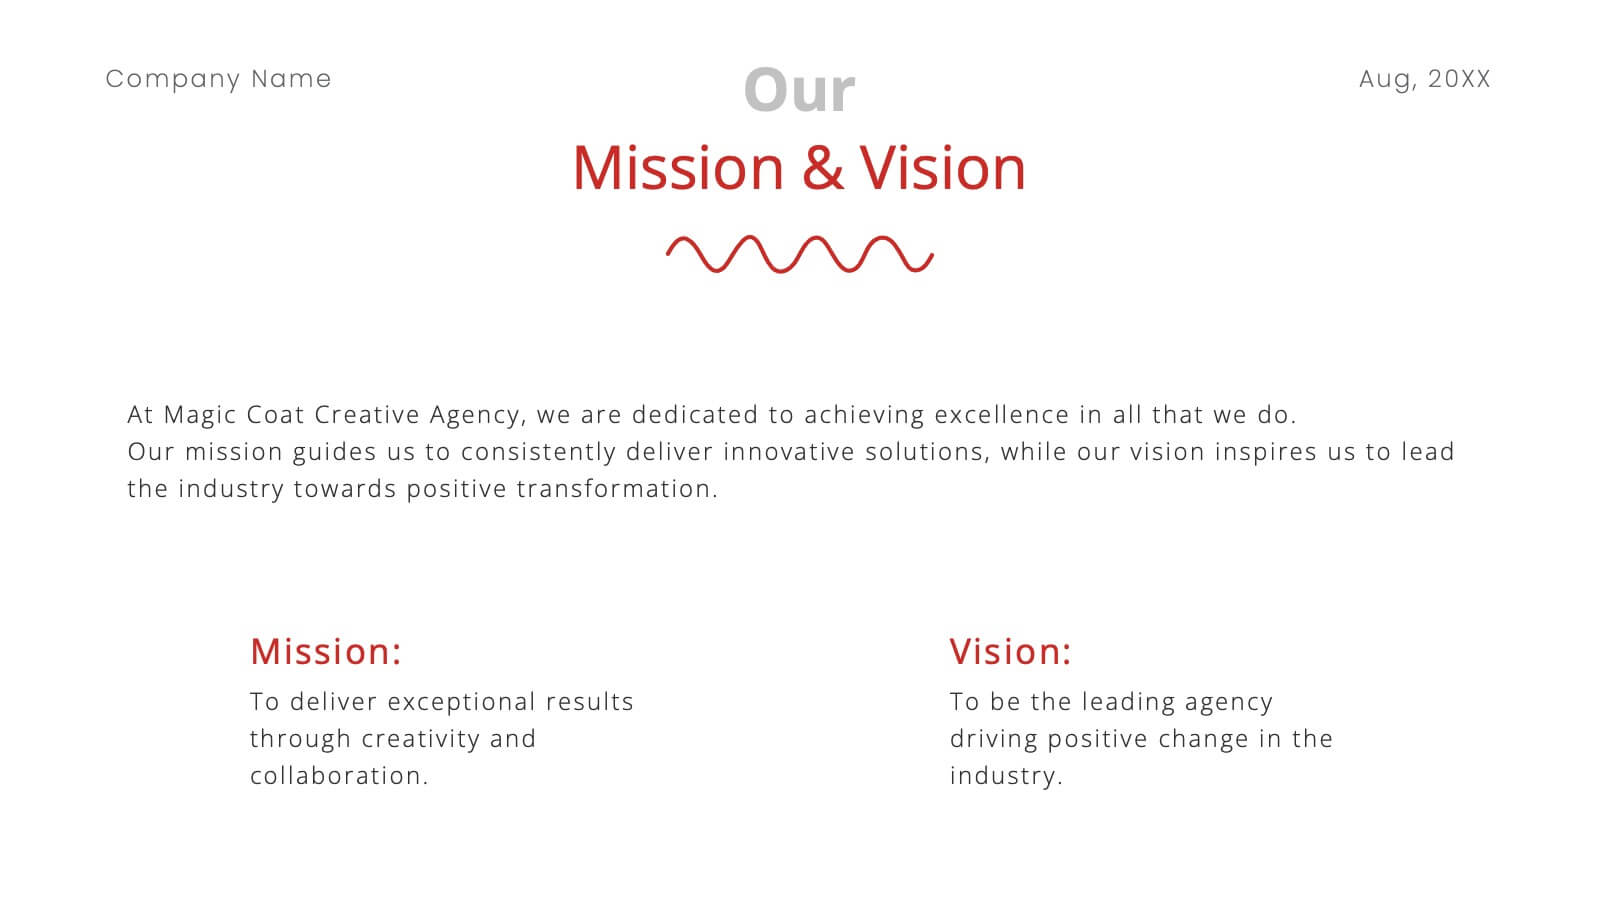
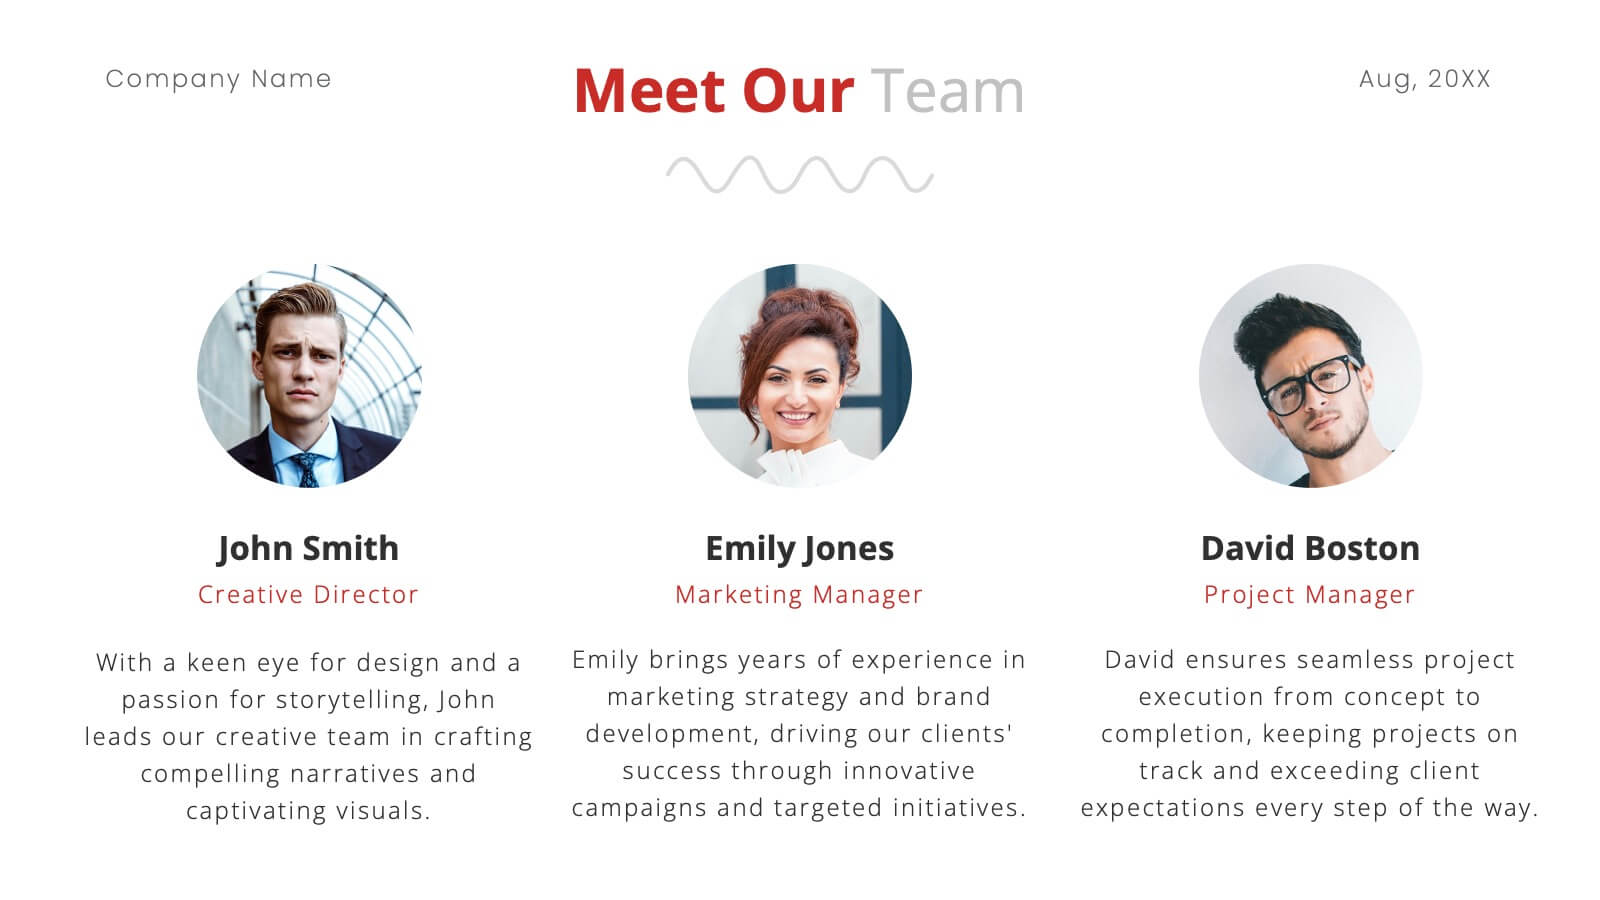
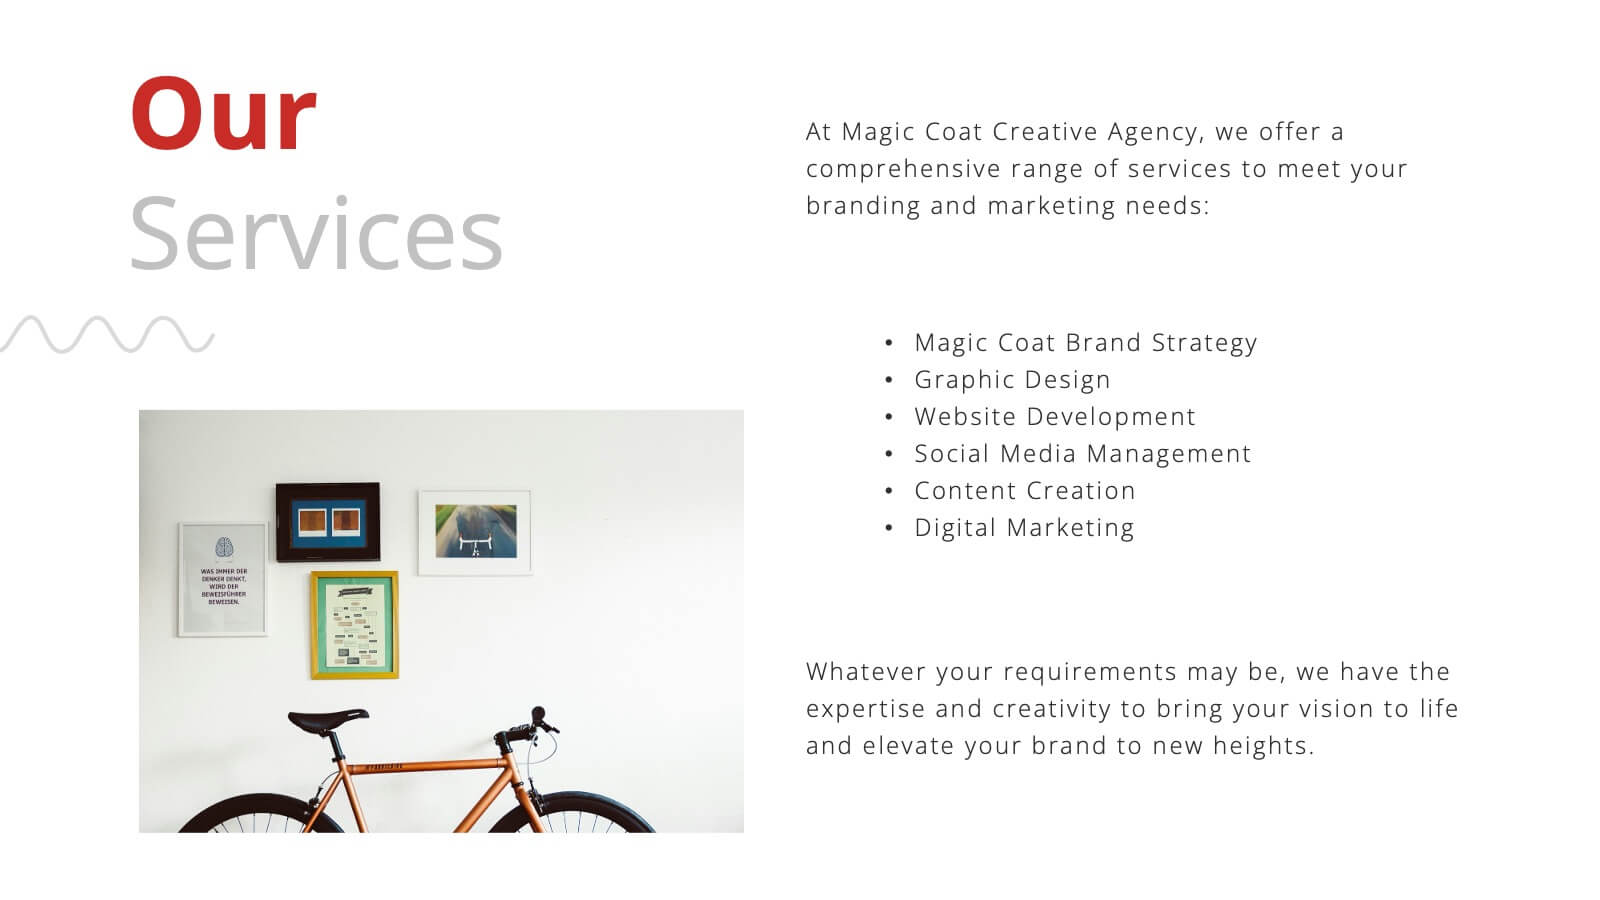
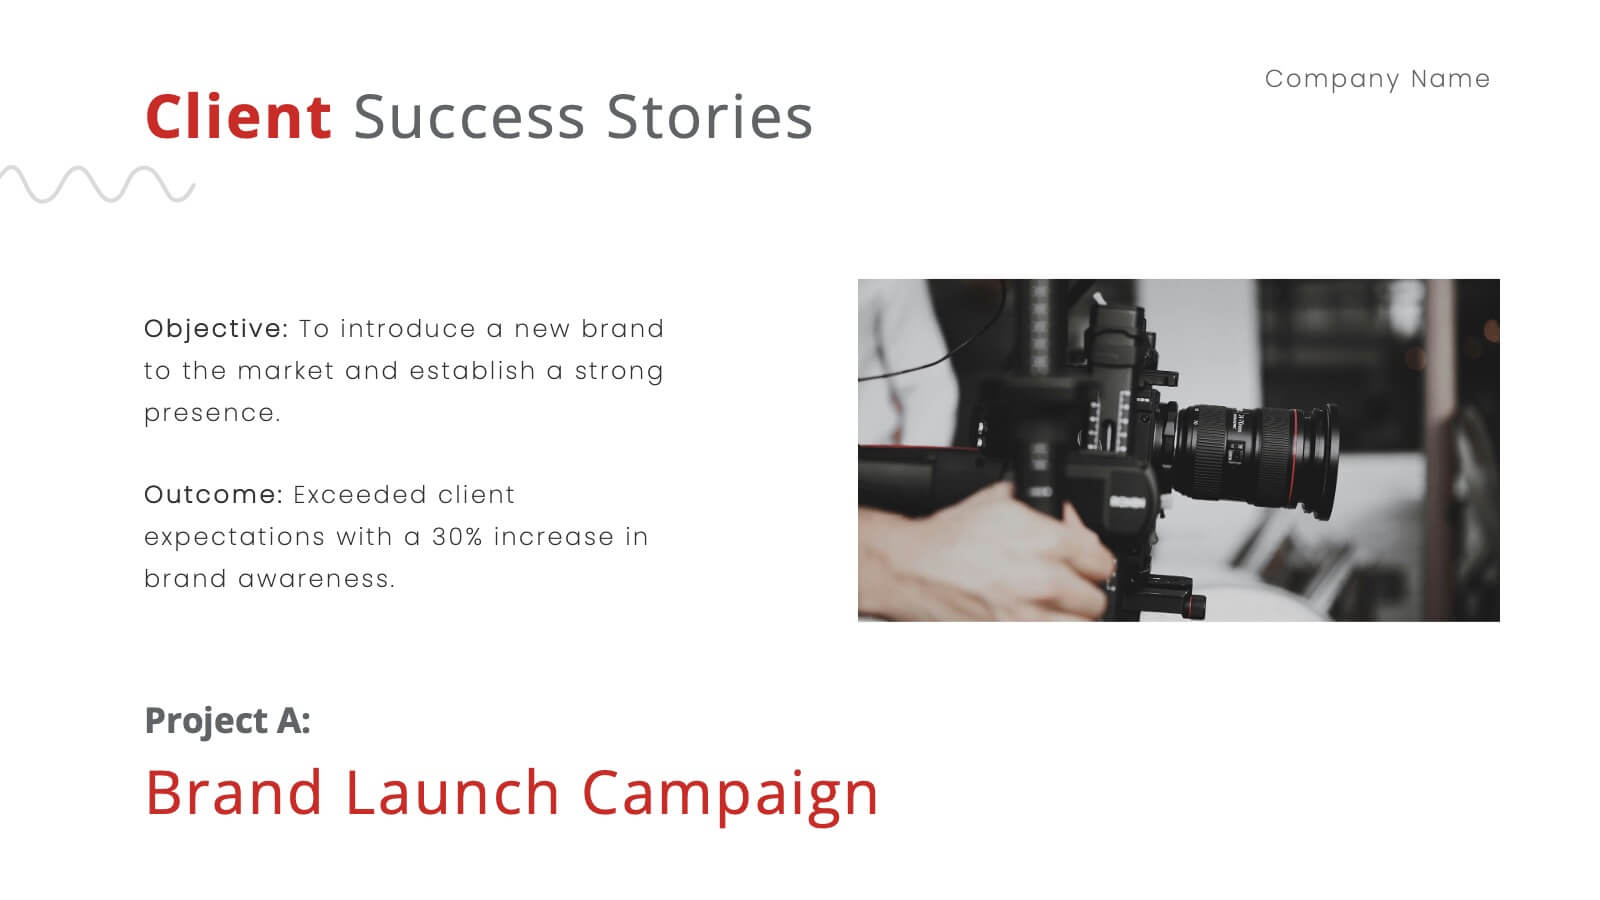
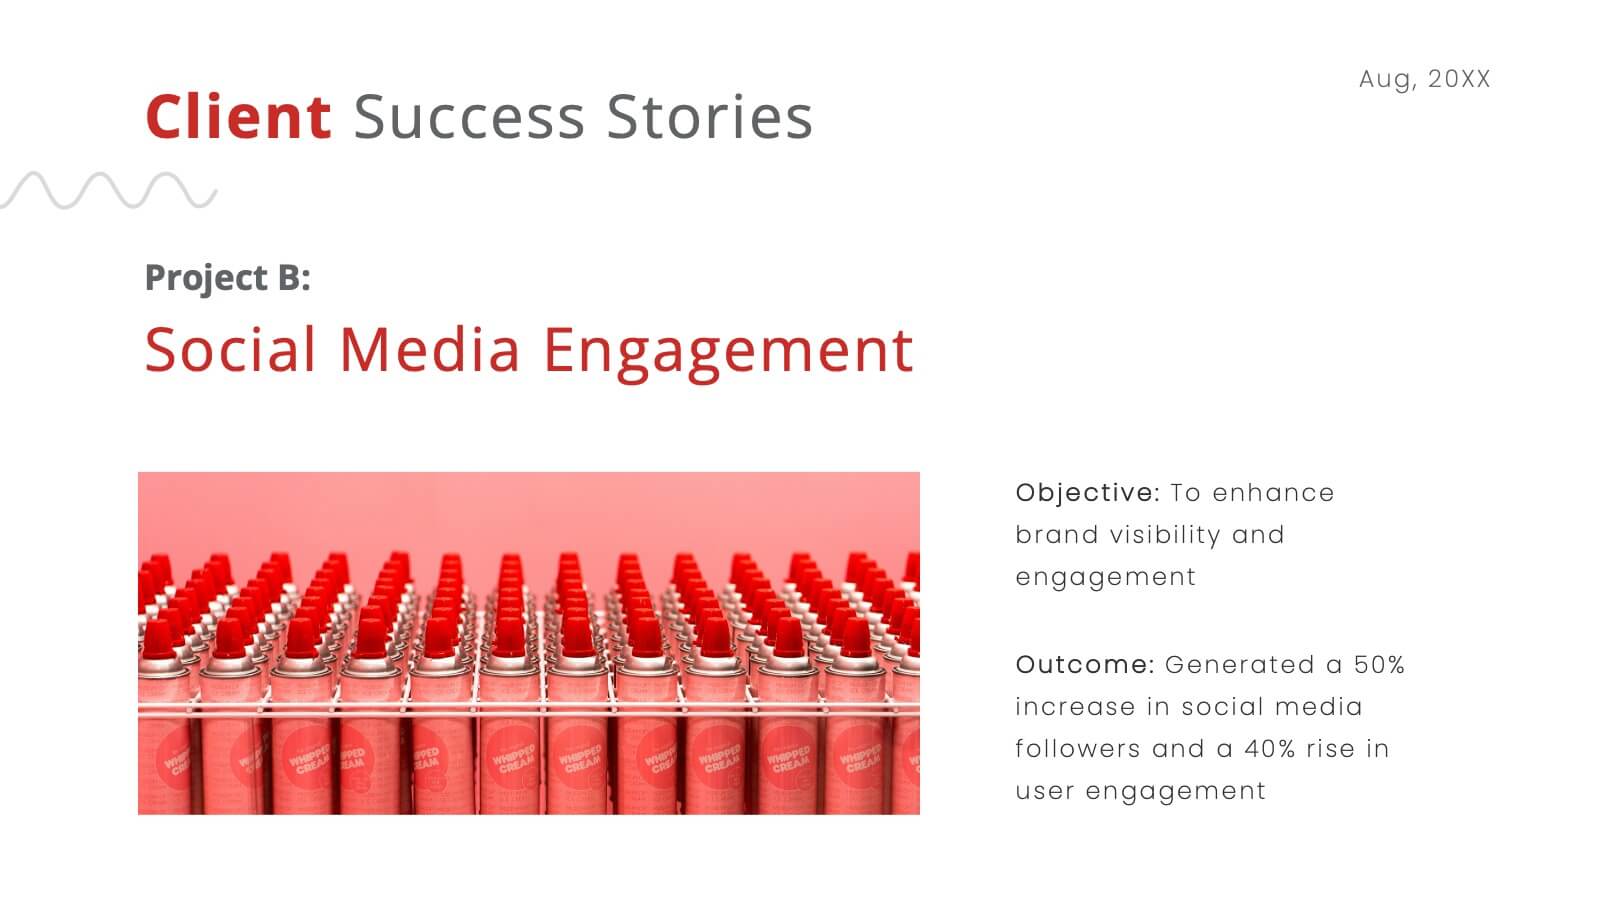
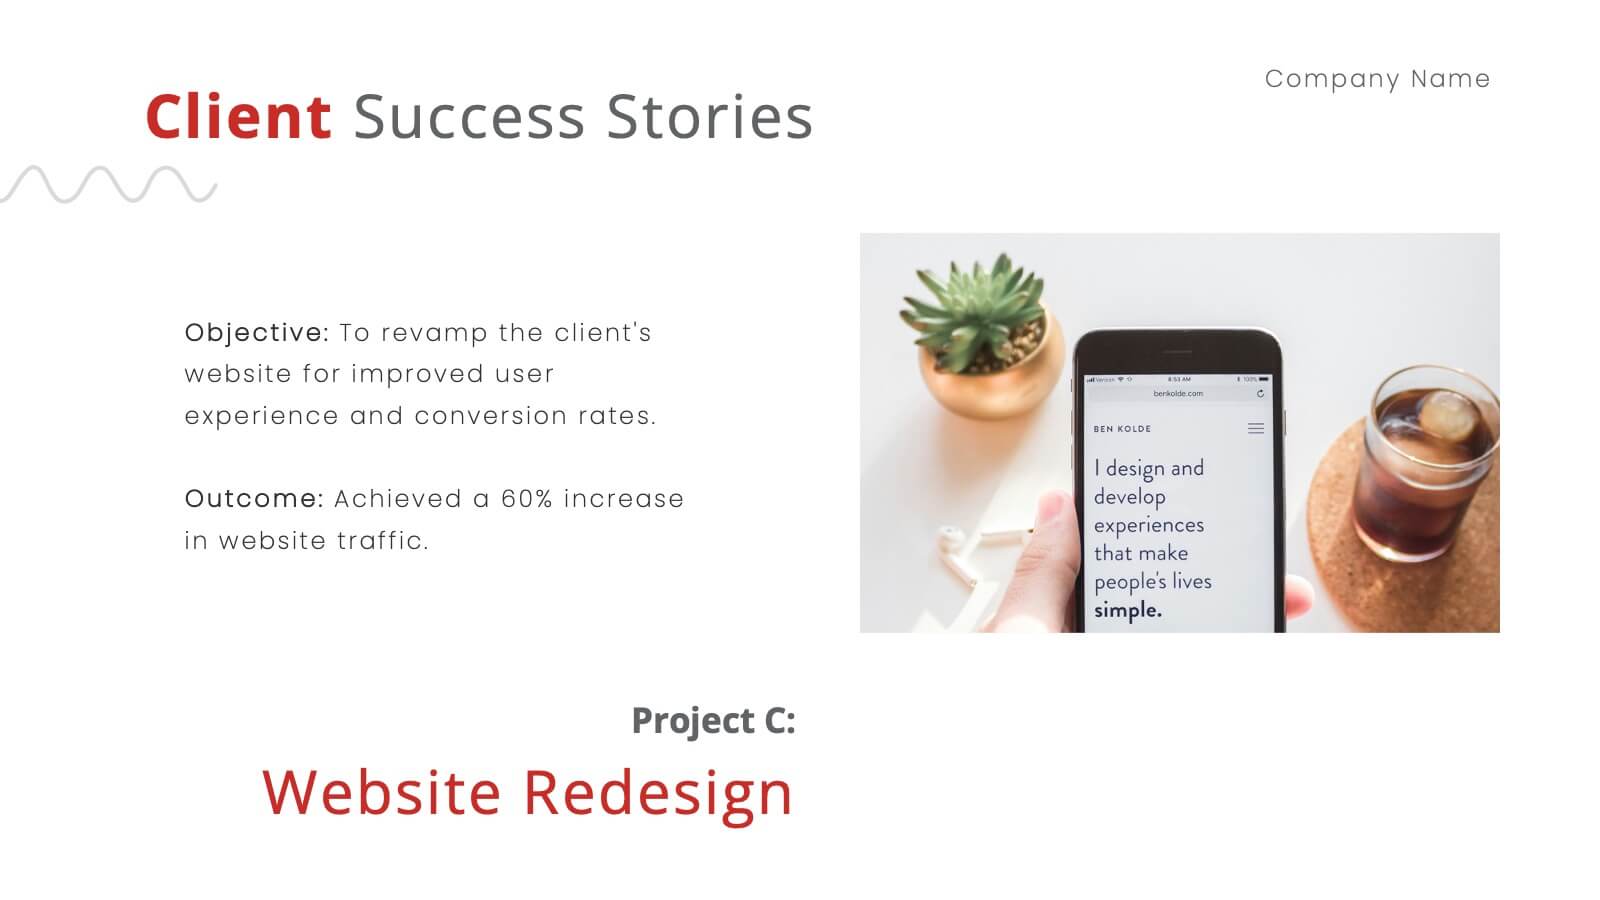
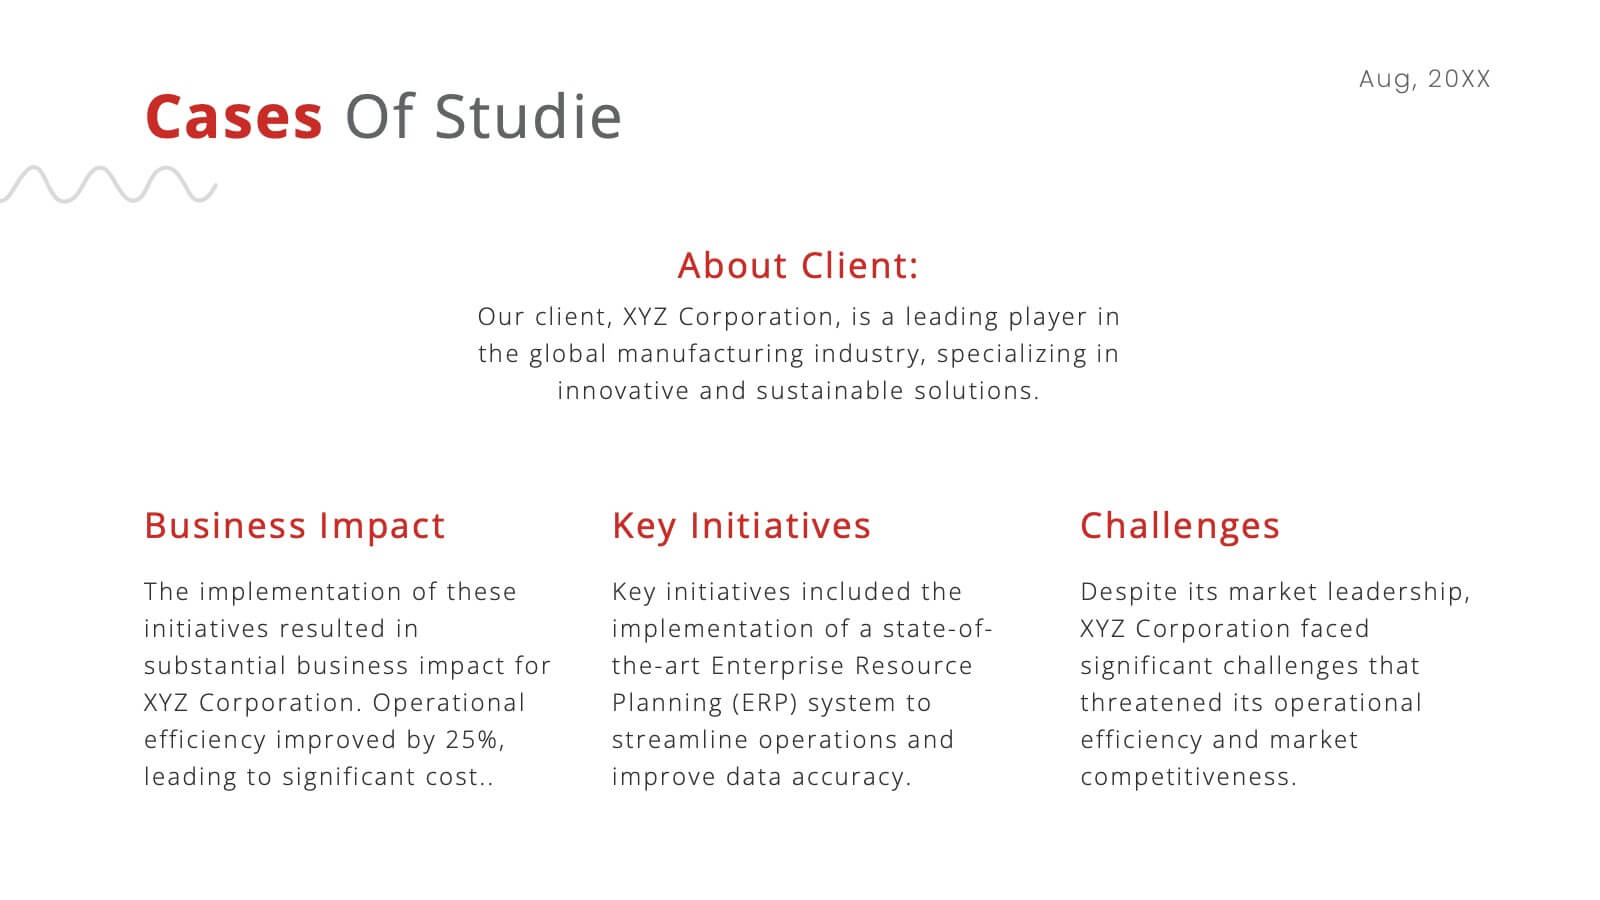
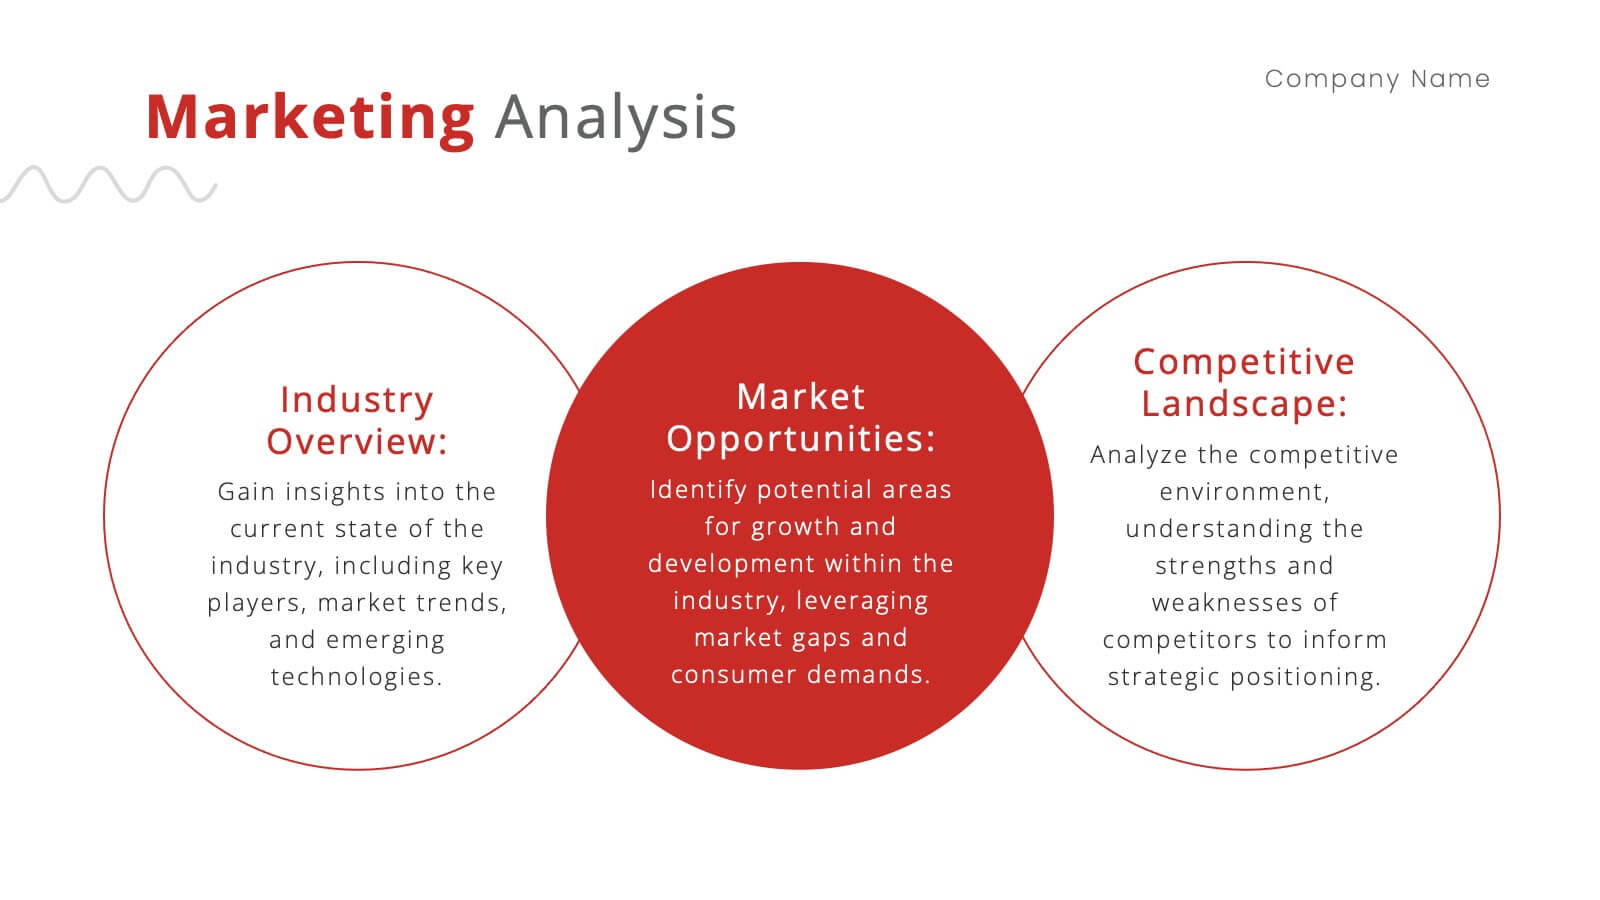
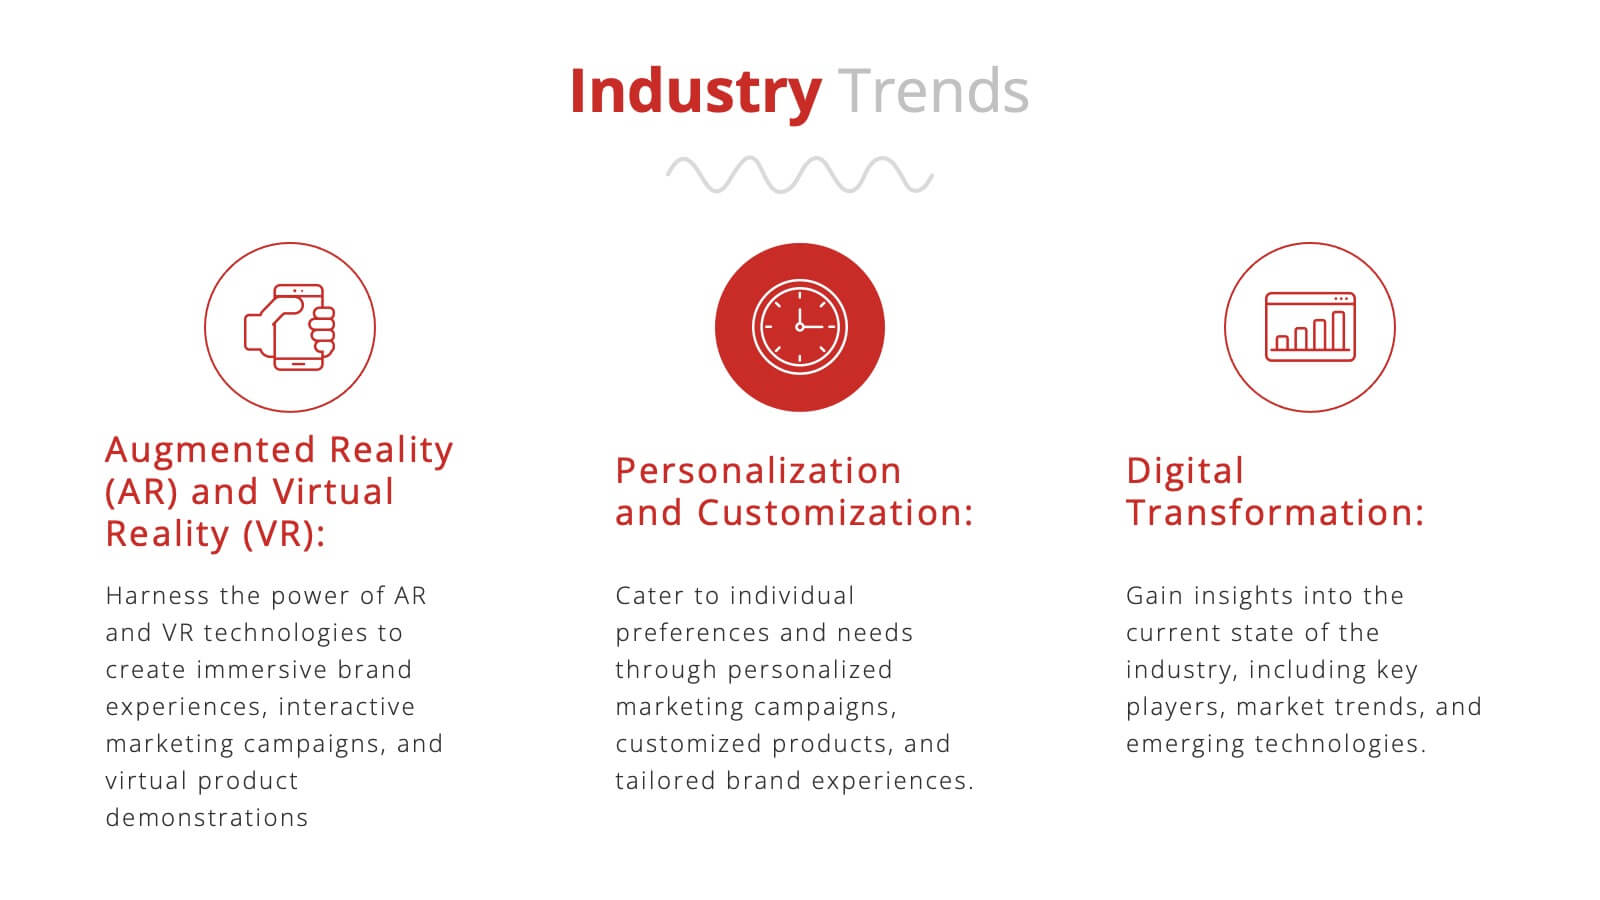
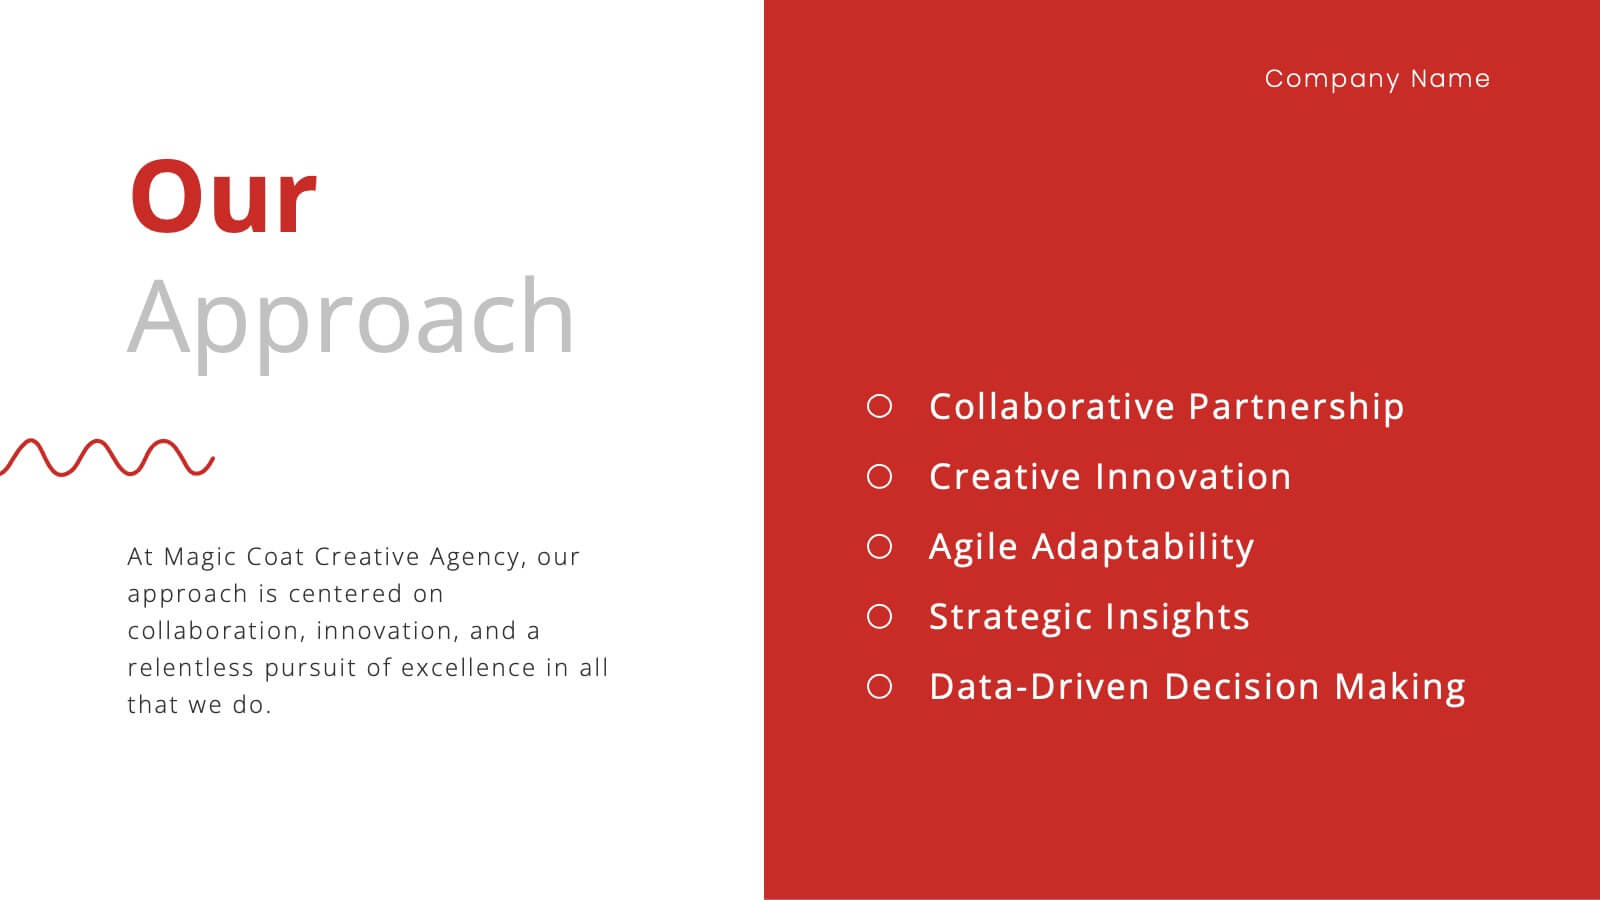
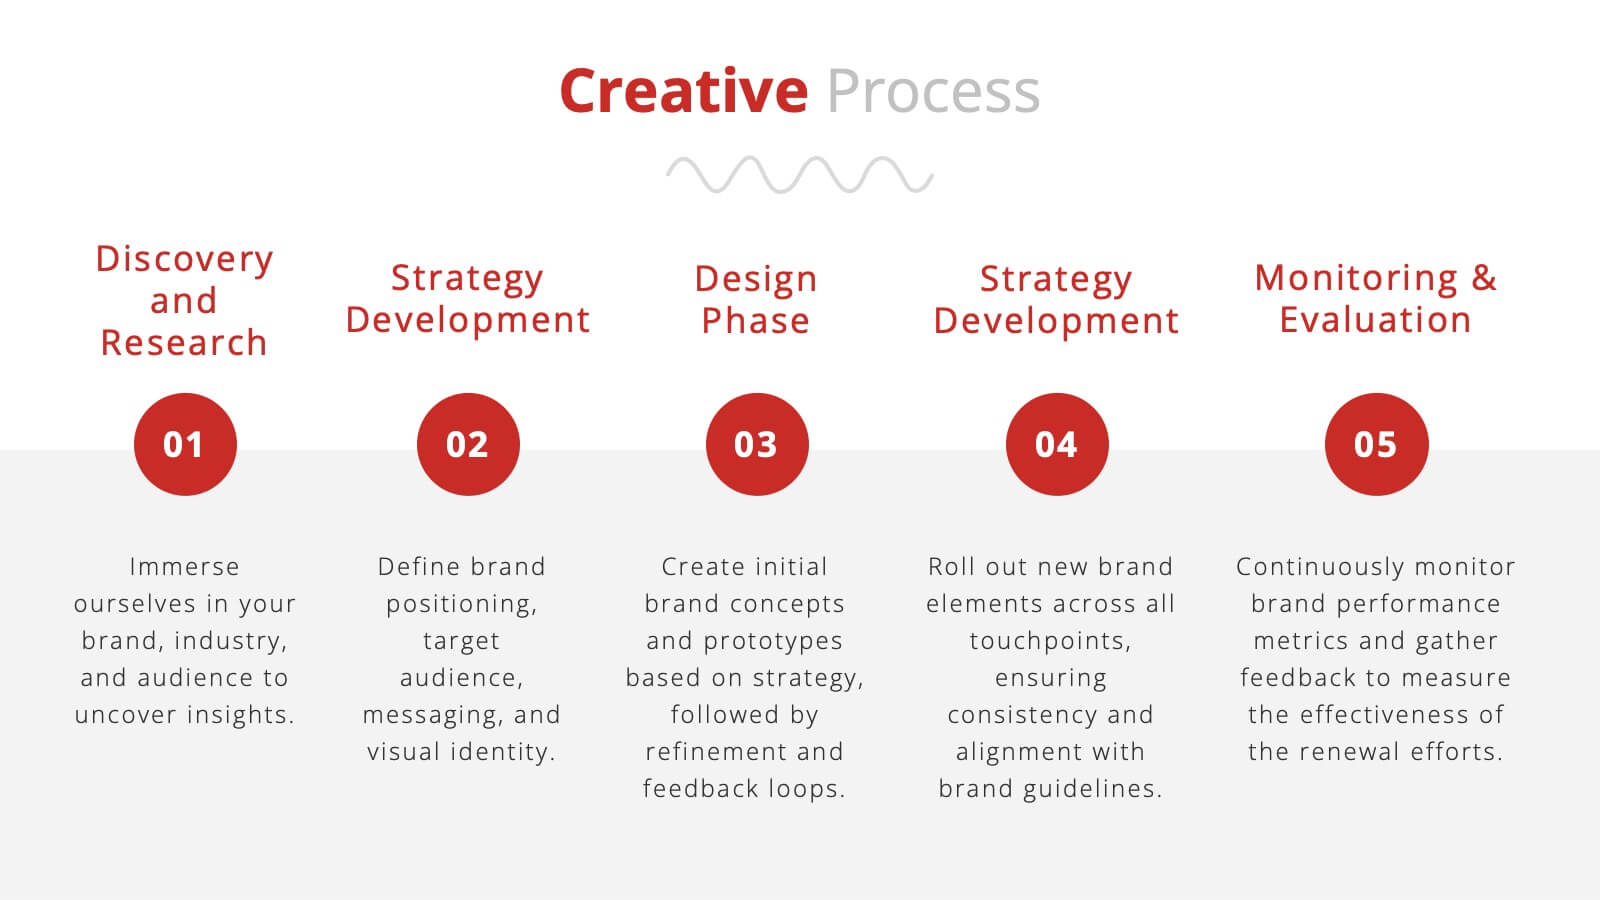
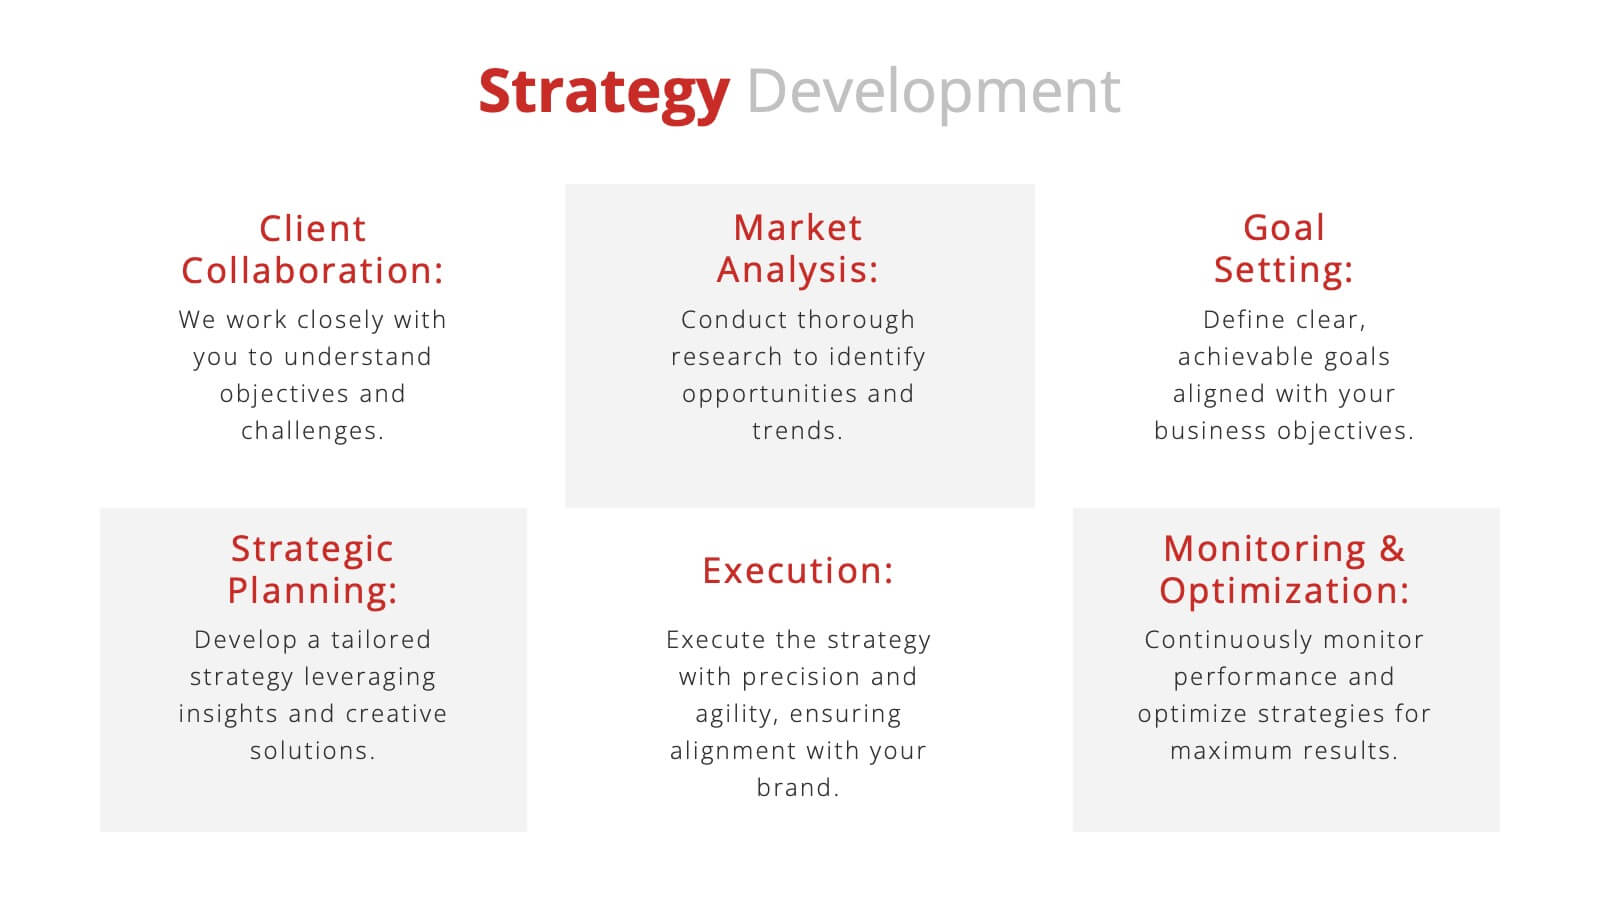
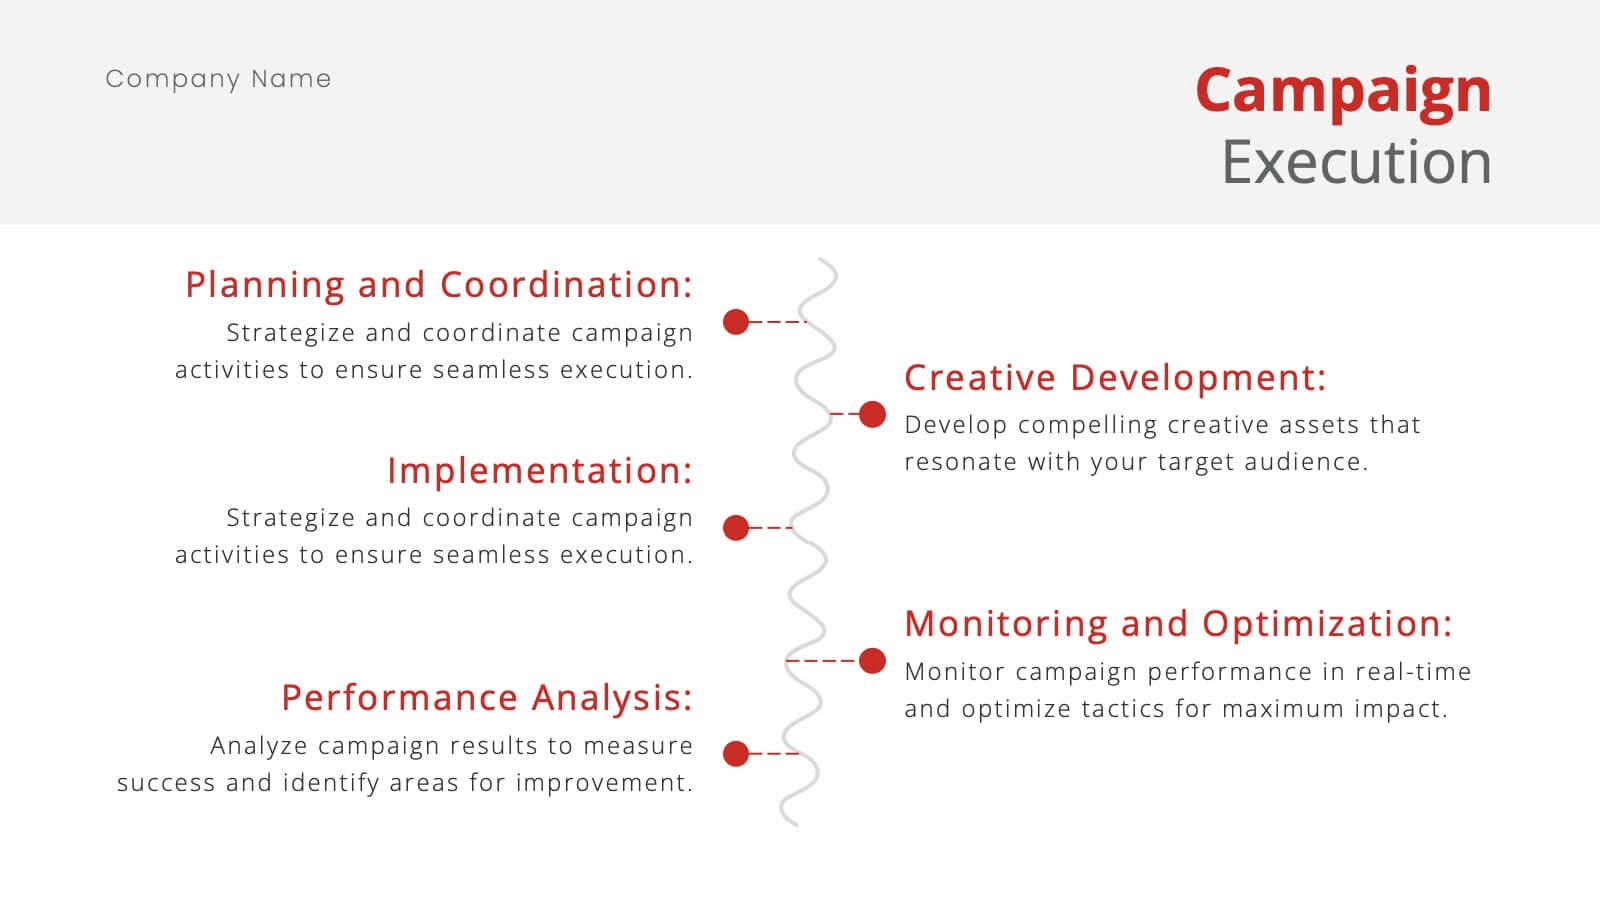
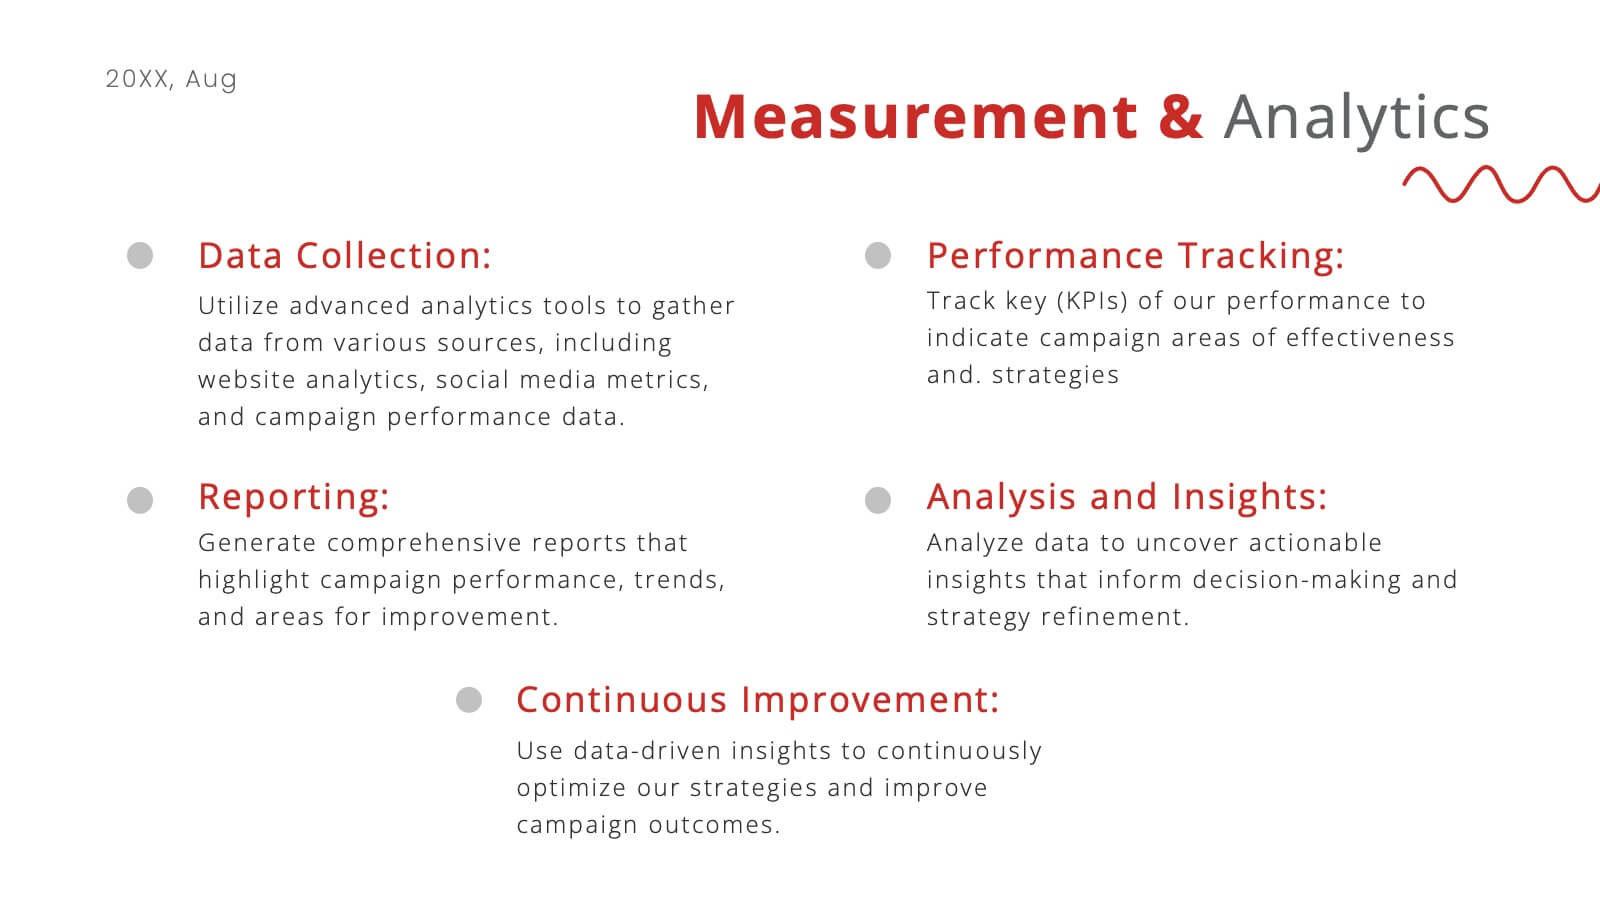
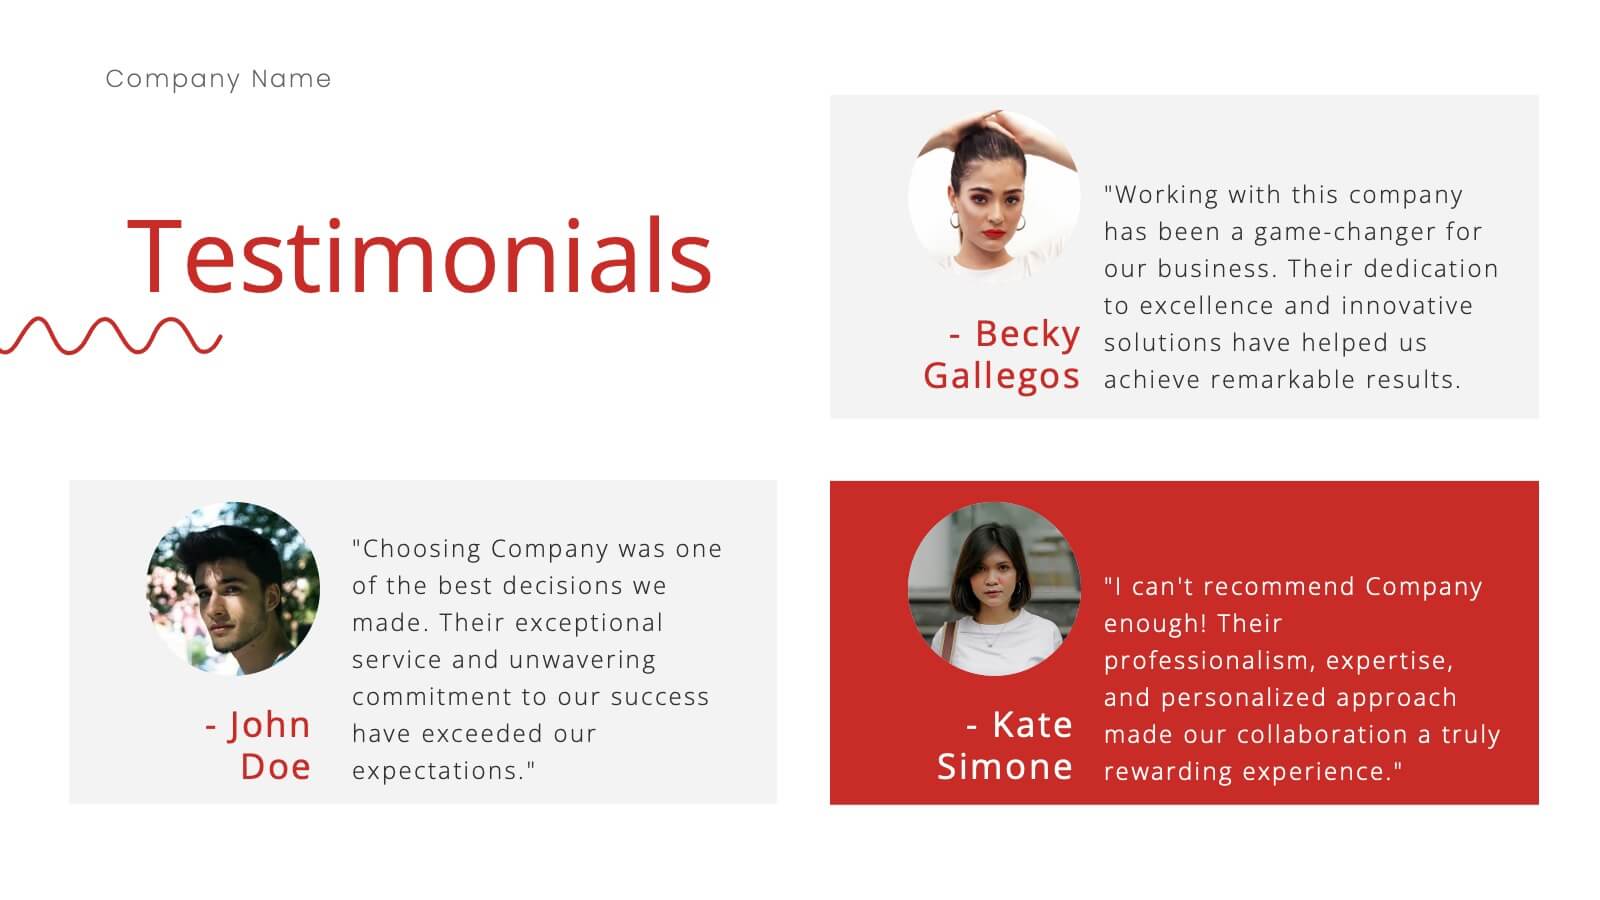
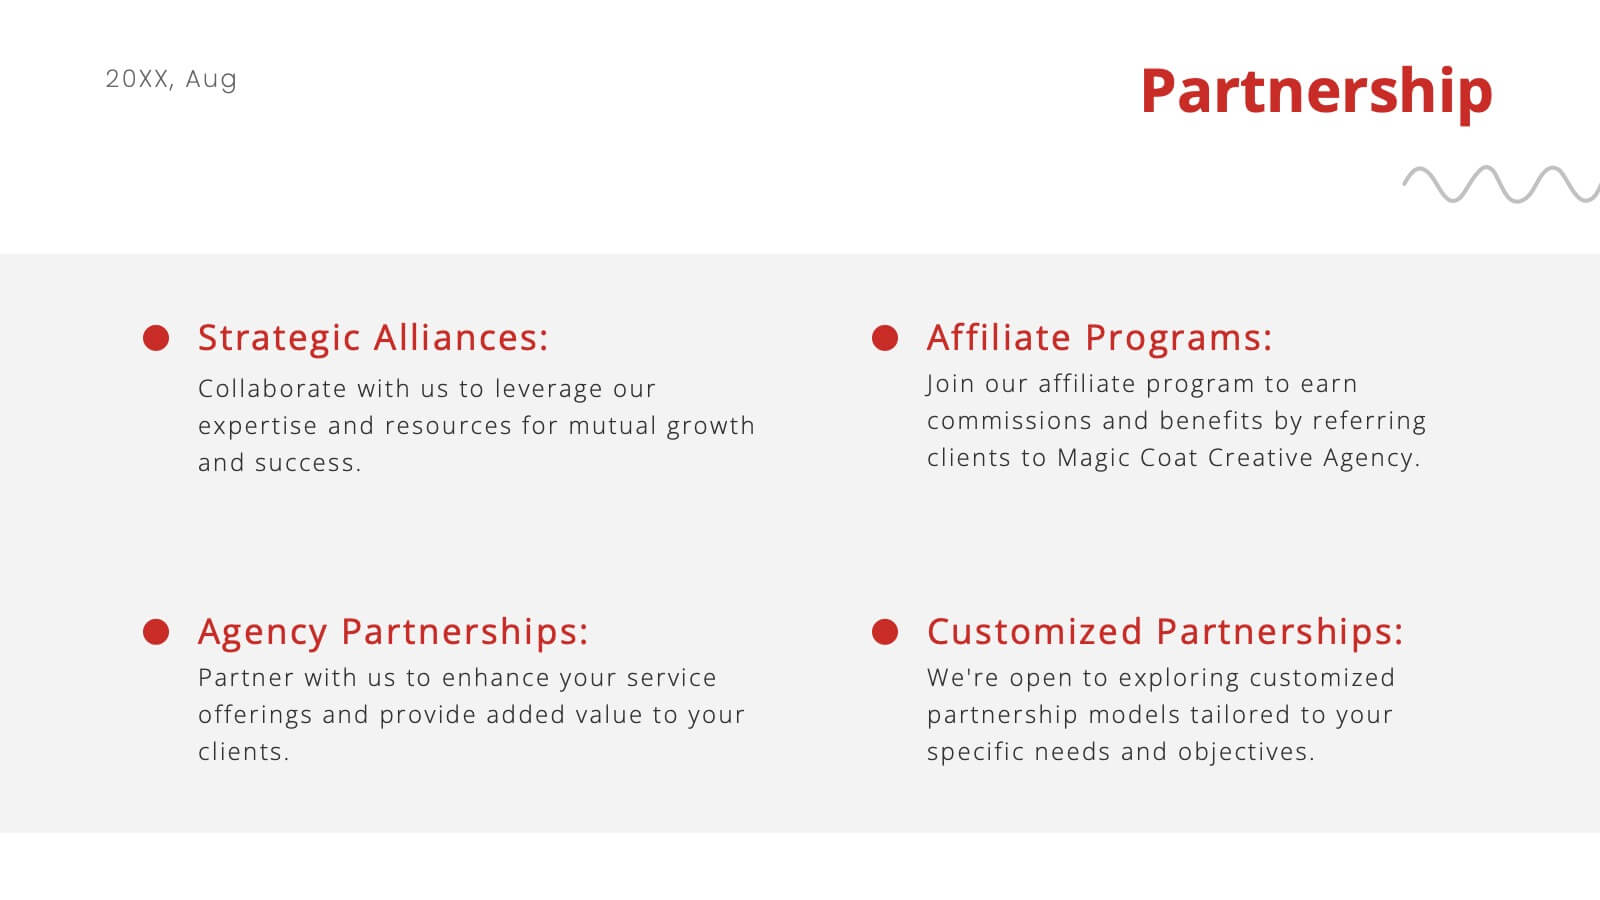
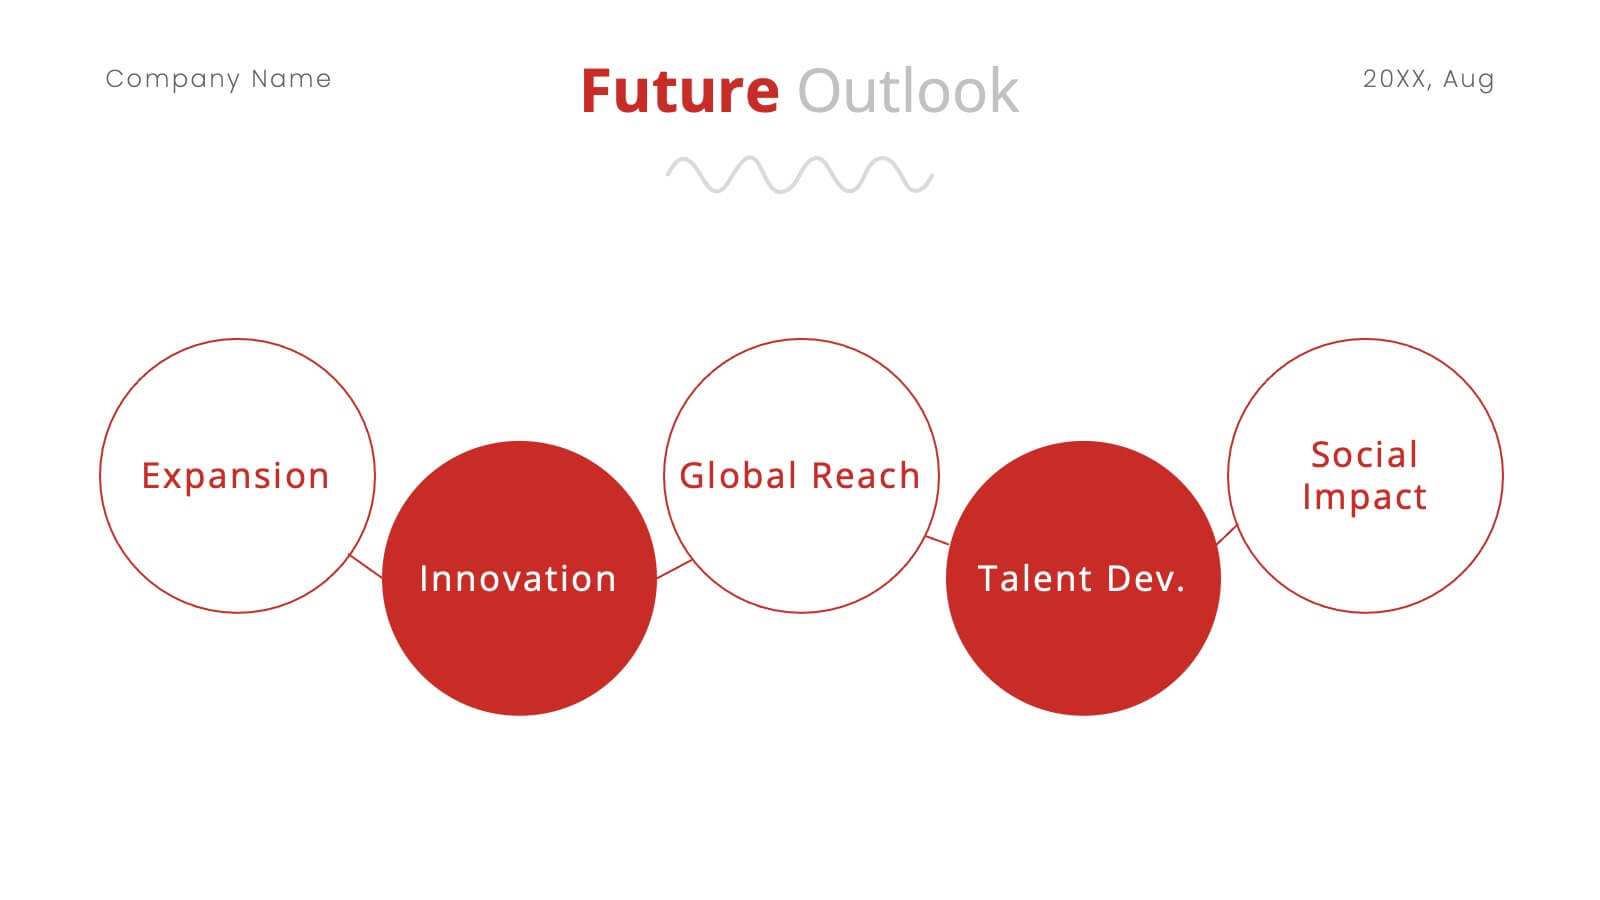
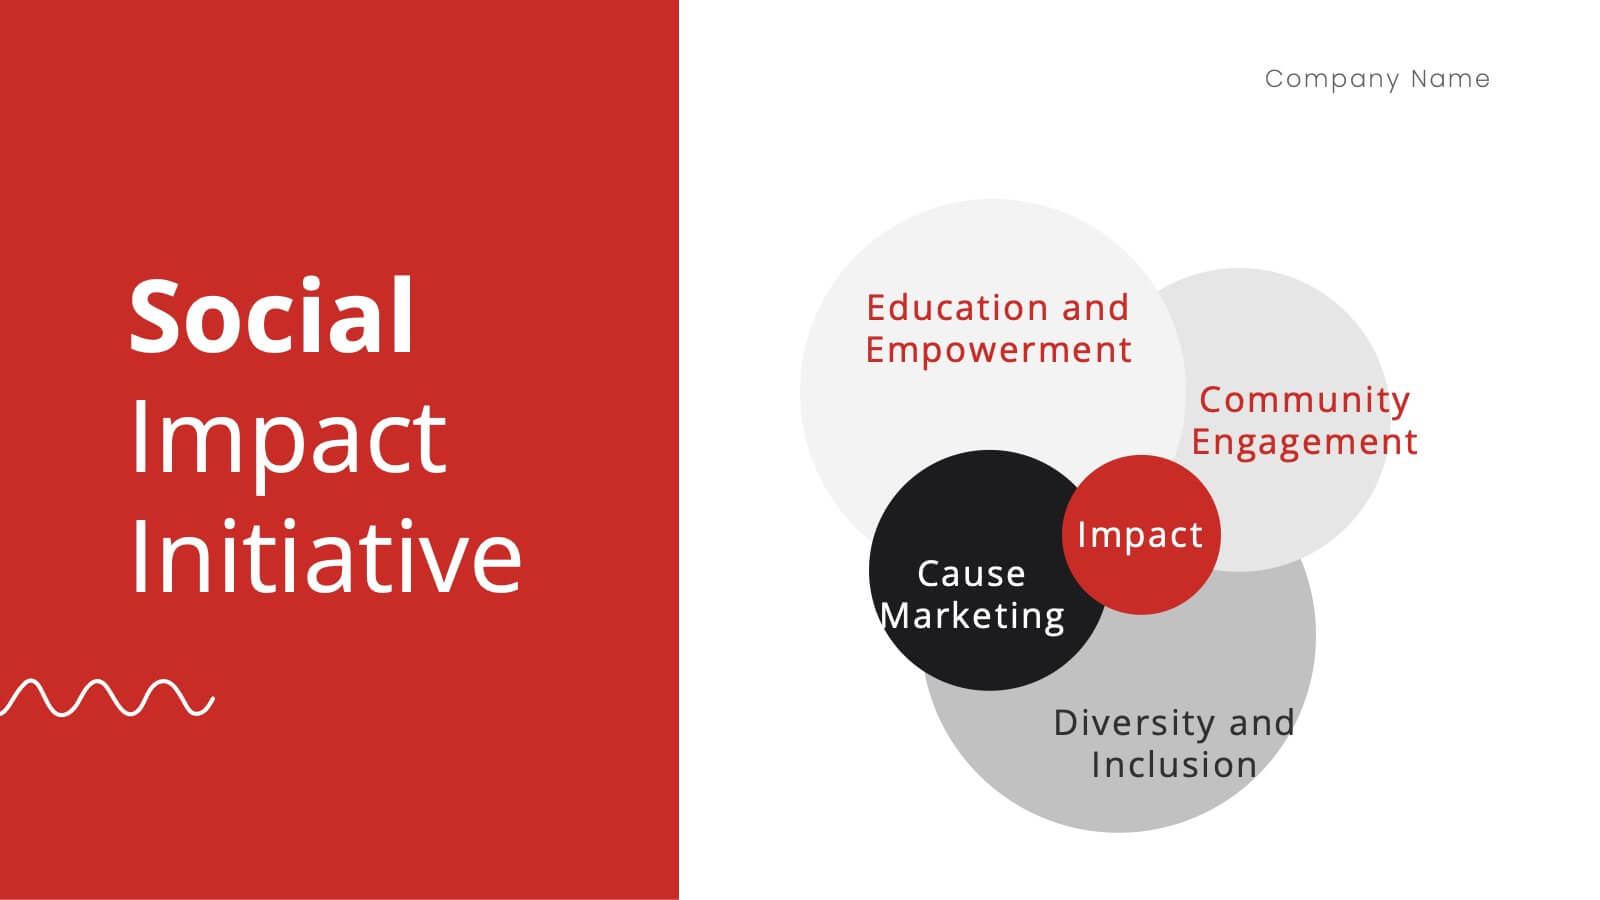
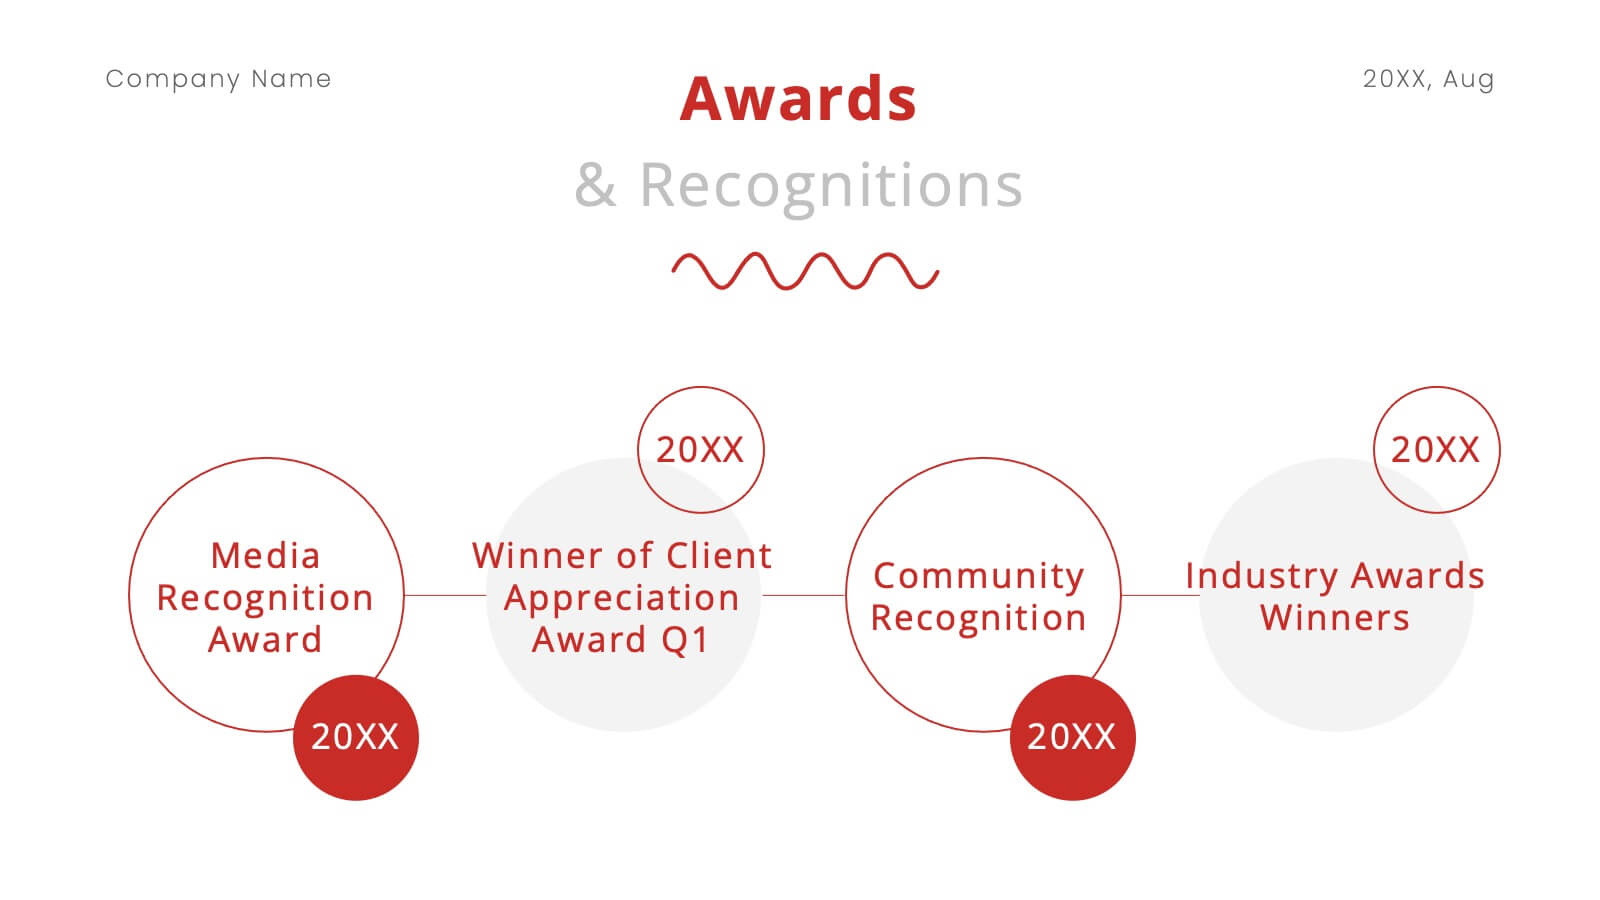
Nickel Advertising Agency Proposal Presentation
Take your advertising agency to the next level with this sleek and modern presentation template! Highlighting your services, team, success stories, and marketing strategies, it’s the perfect tool to showcase your agency’s strengths and capabilities. Fully customizable and compatible with PowerPoint, Keynote, and Google Slides, this template is ideal for impressing potential clients and partners.


20 diapositivas
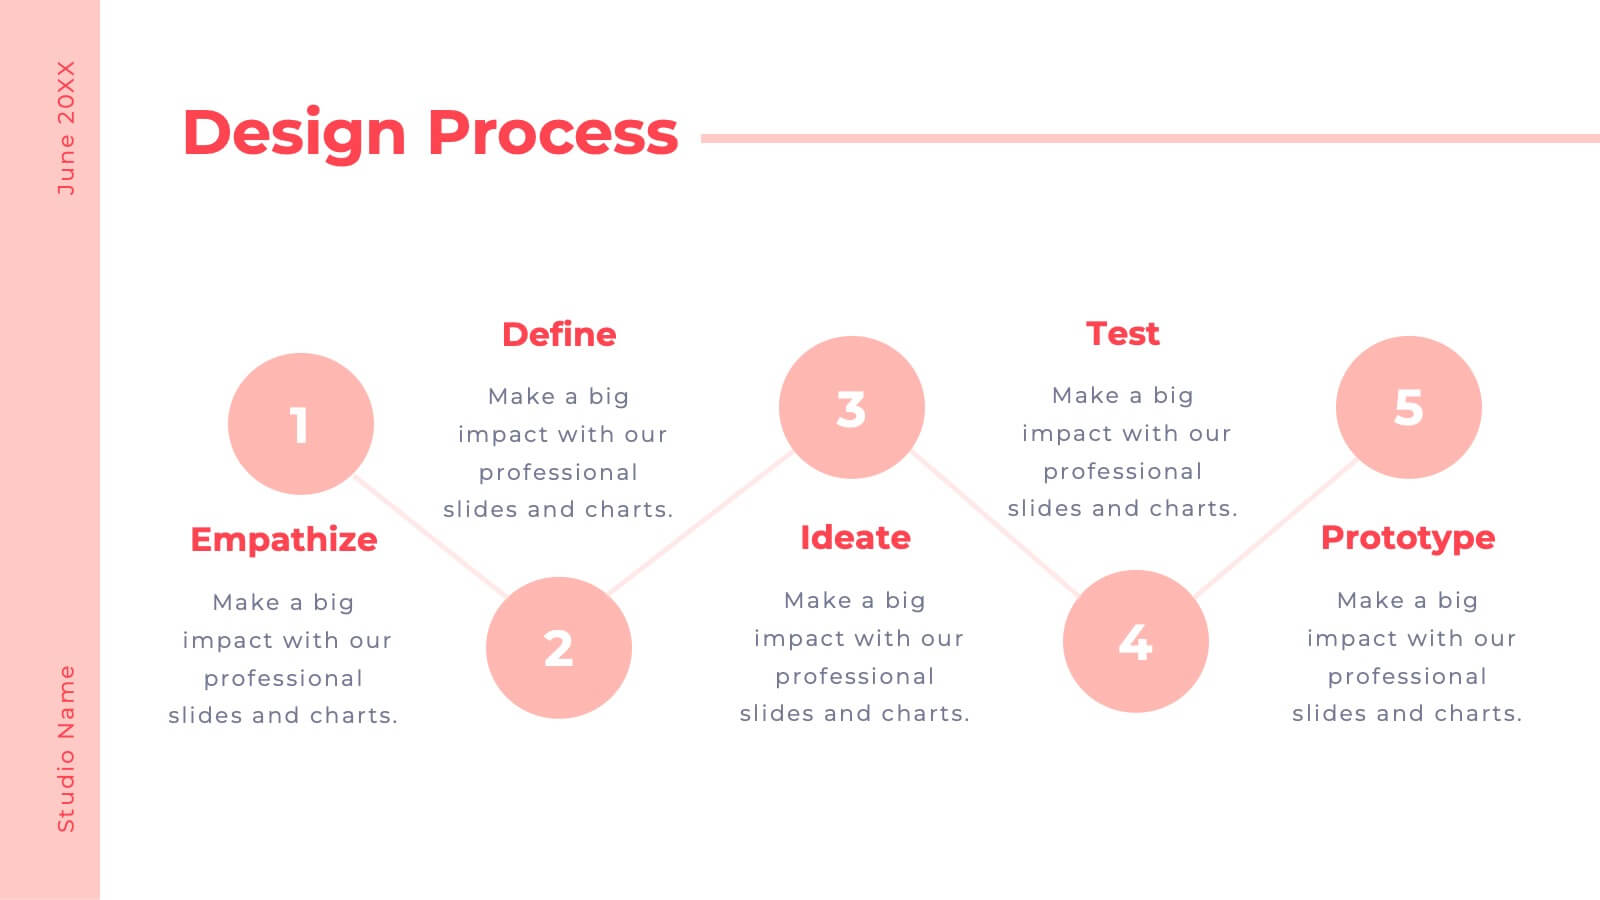
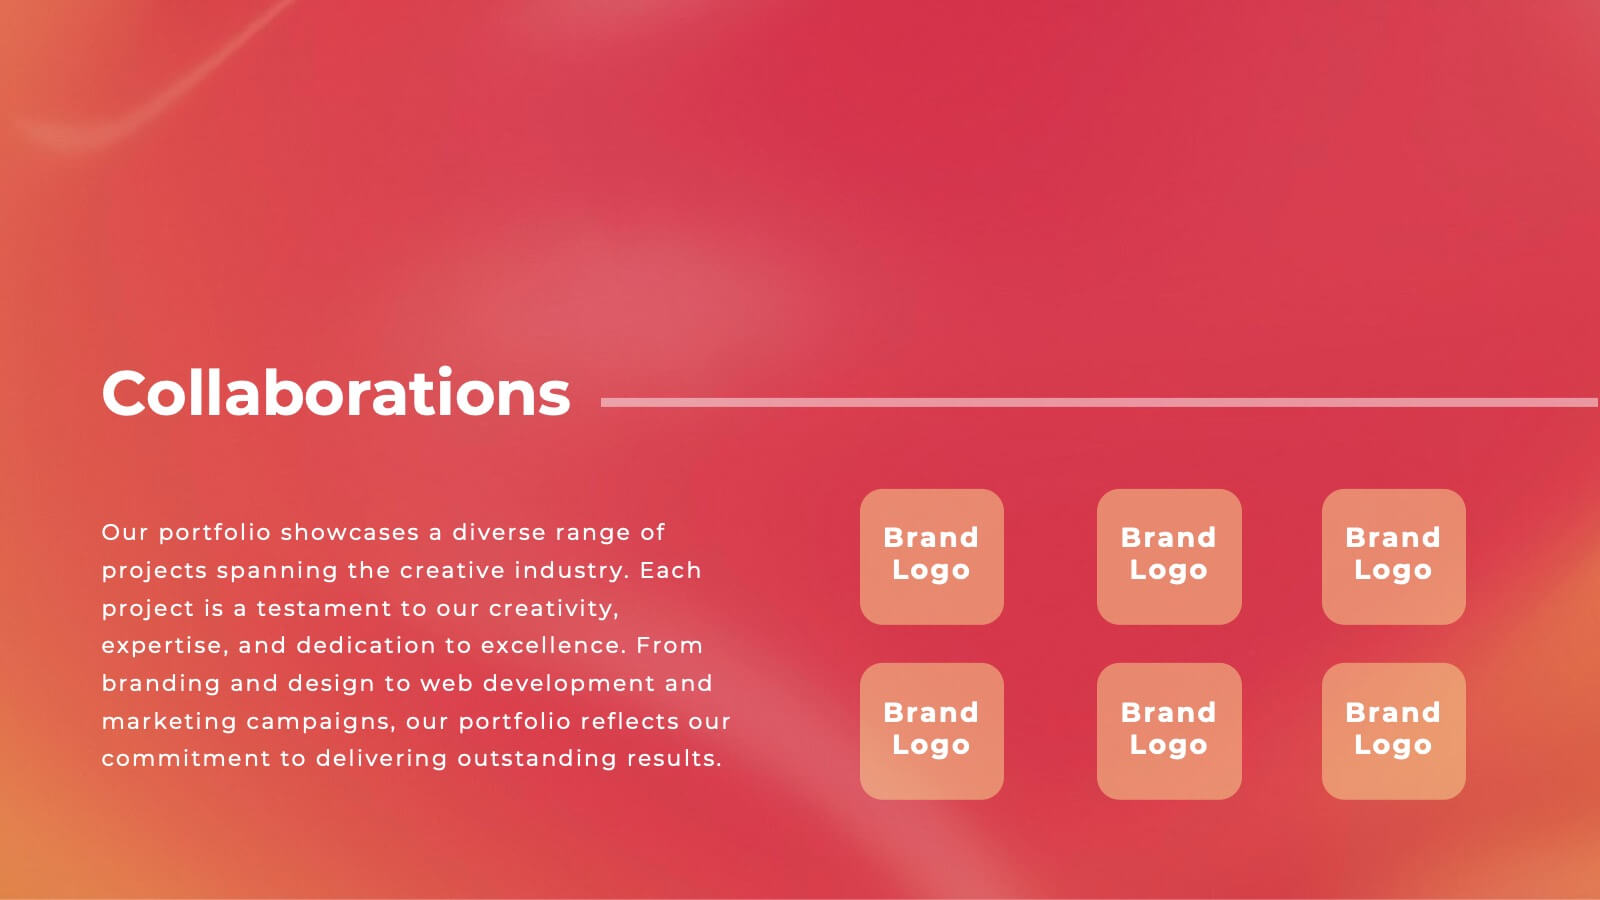
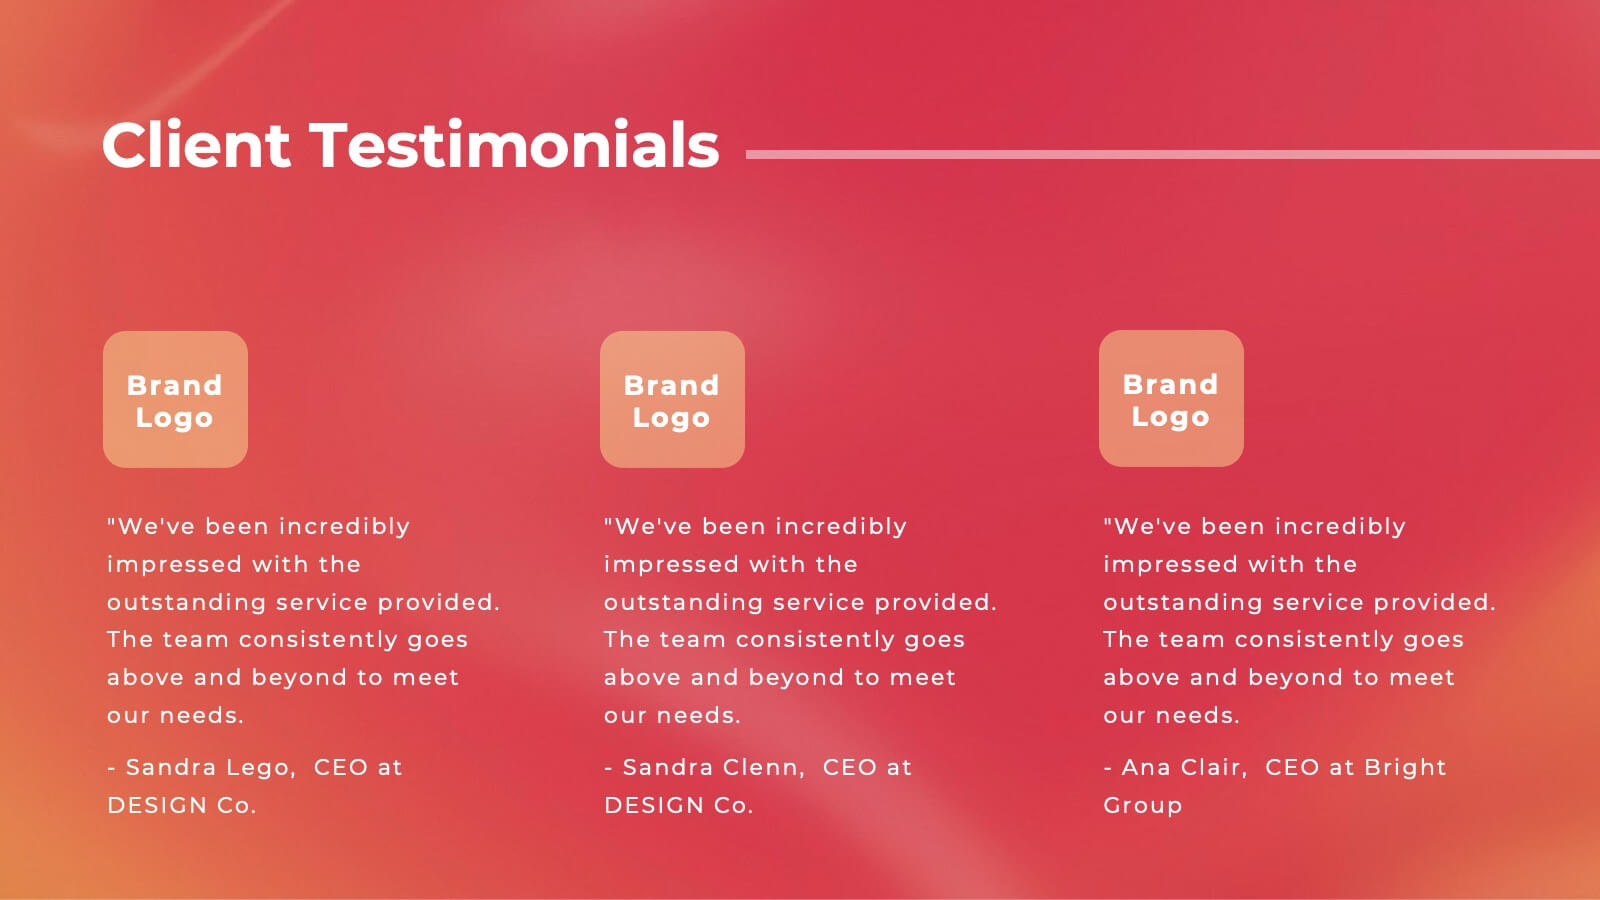
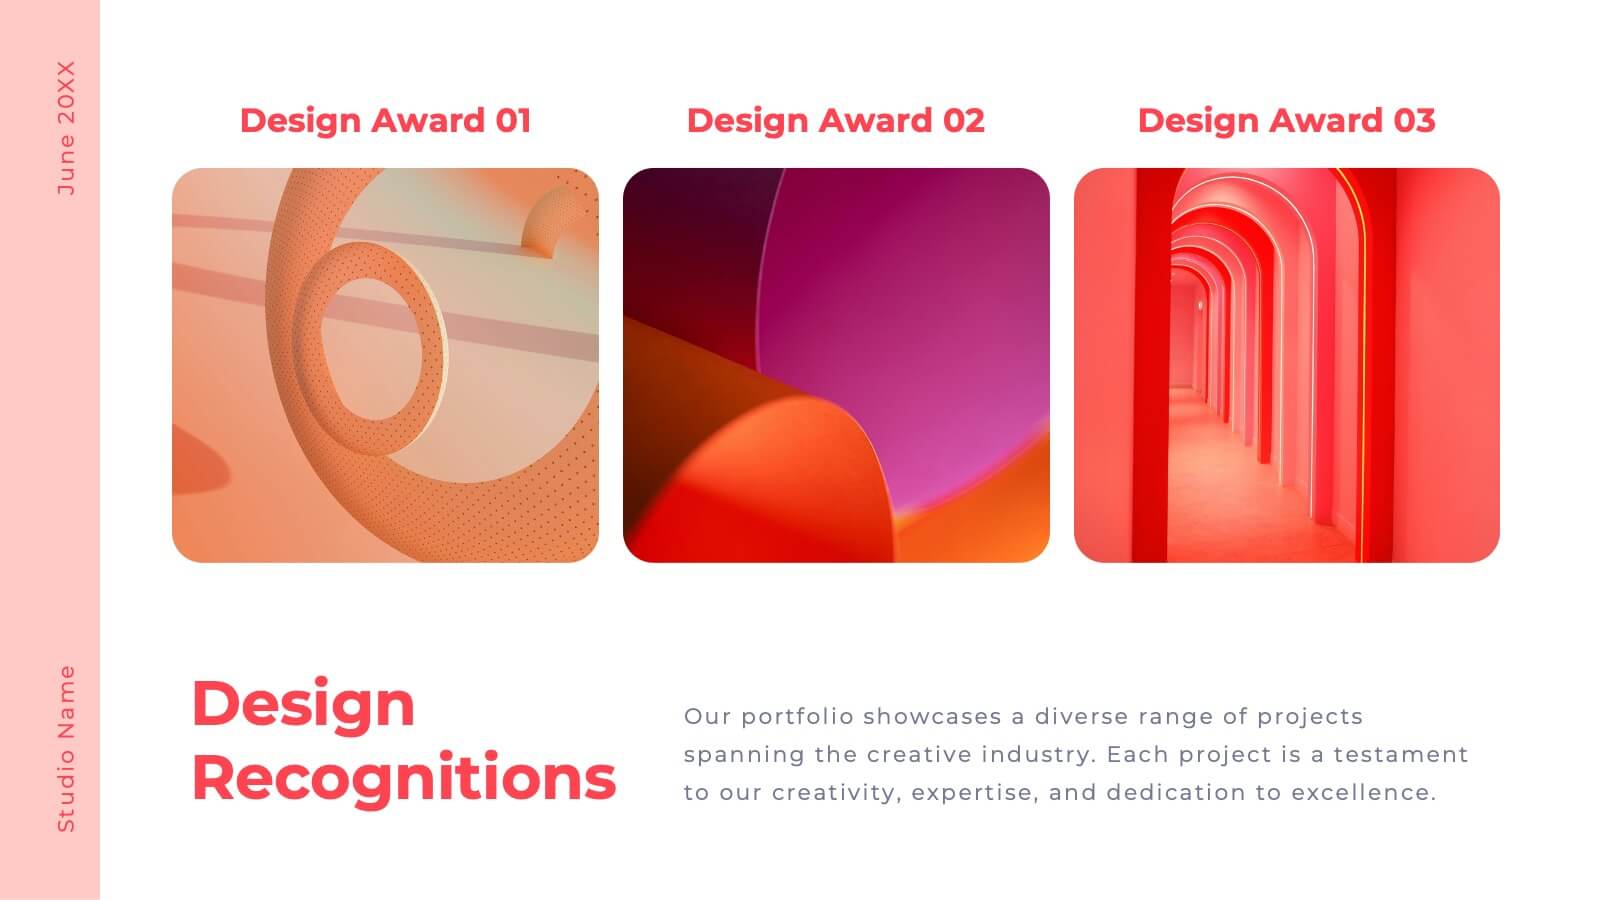
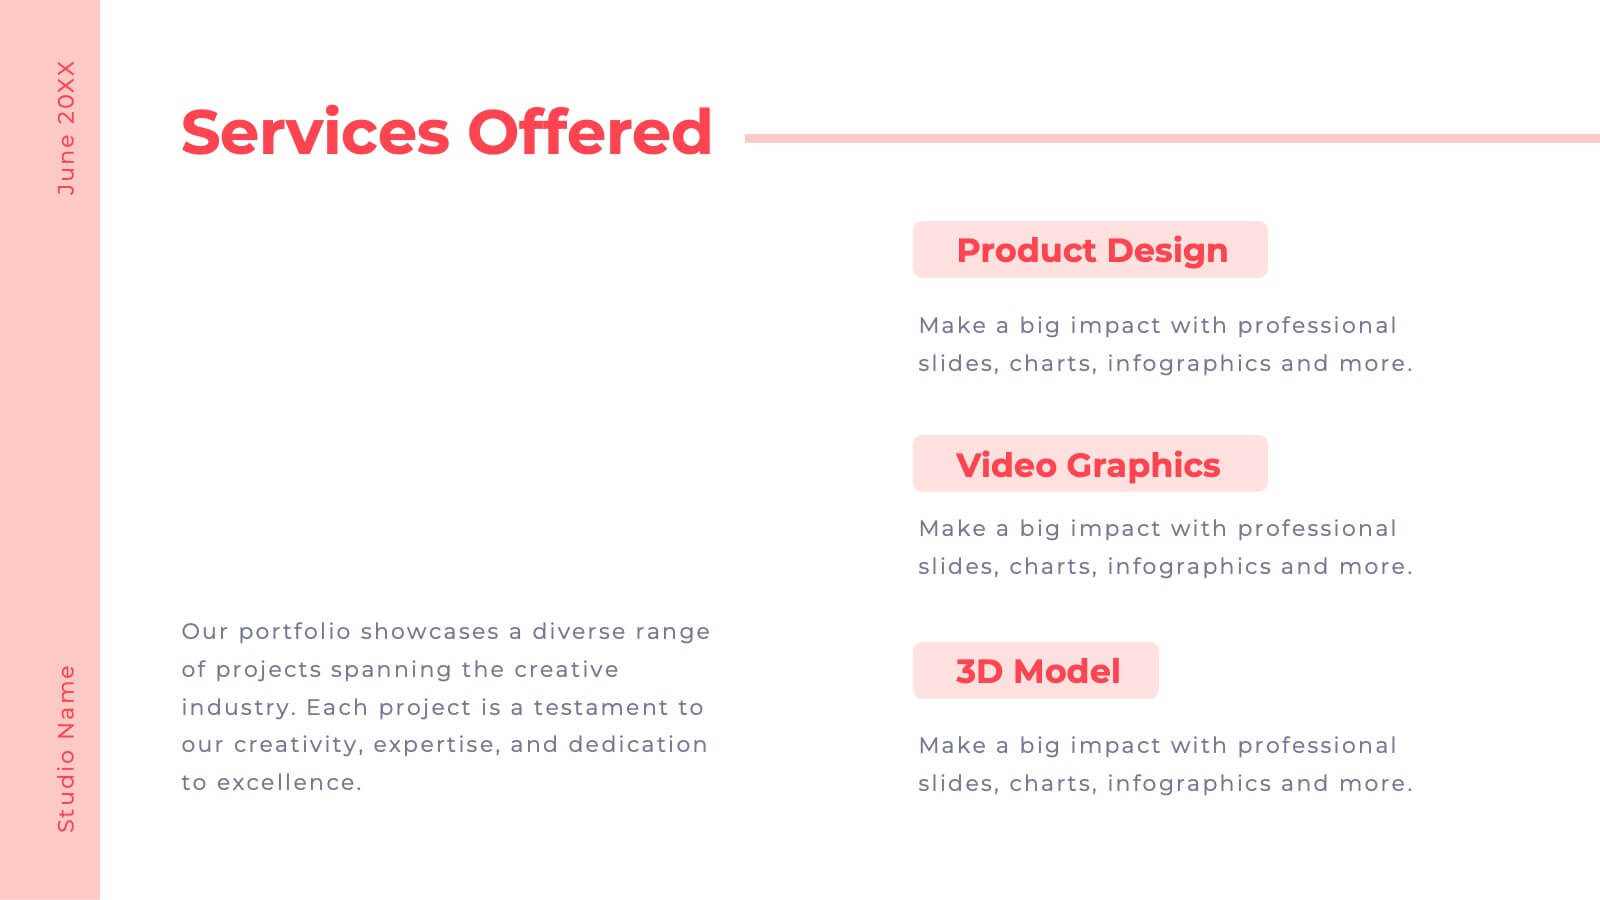
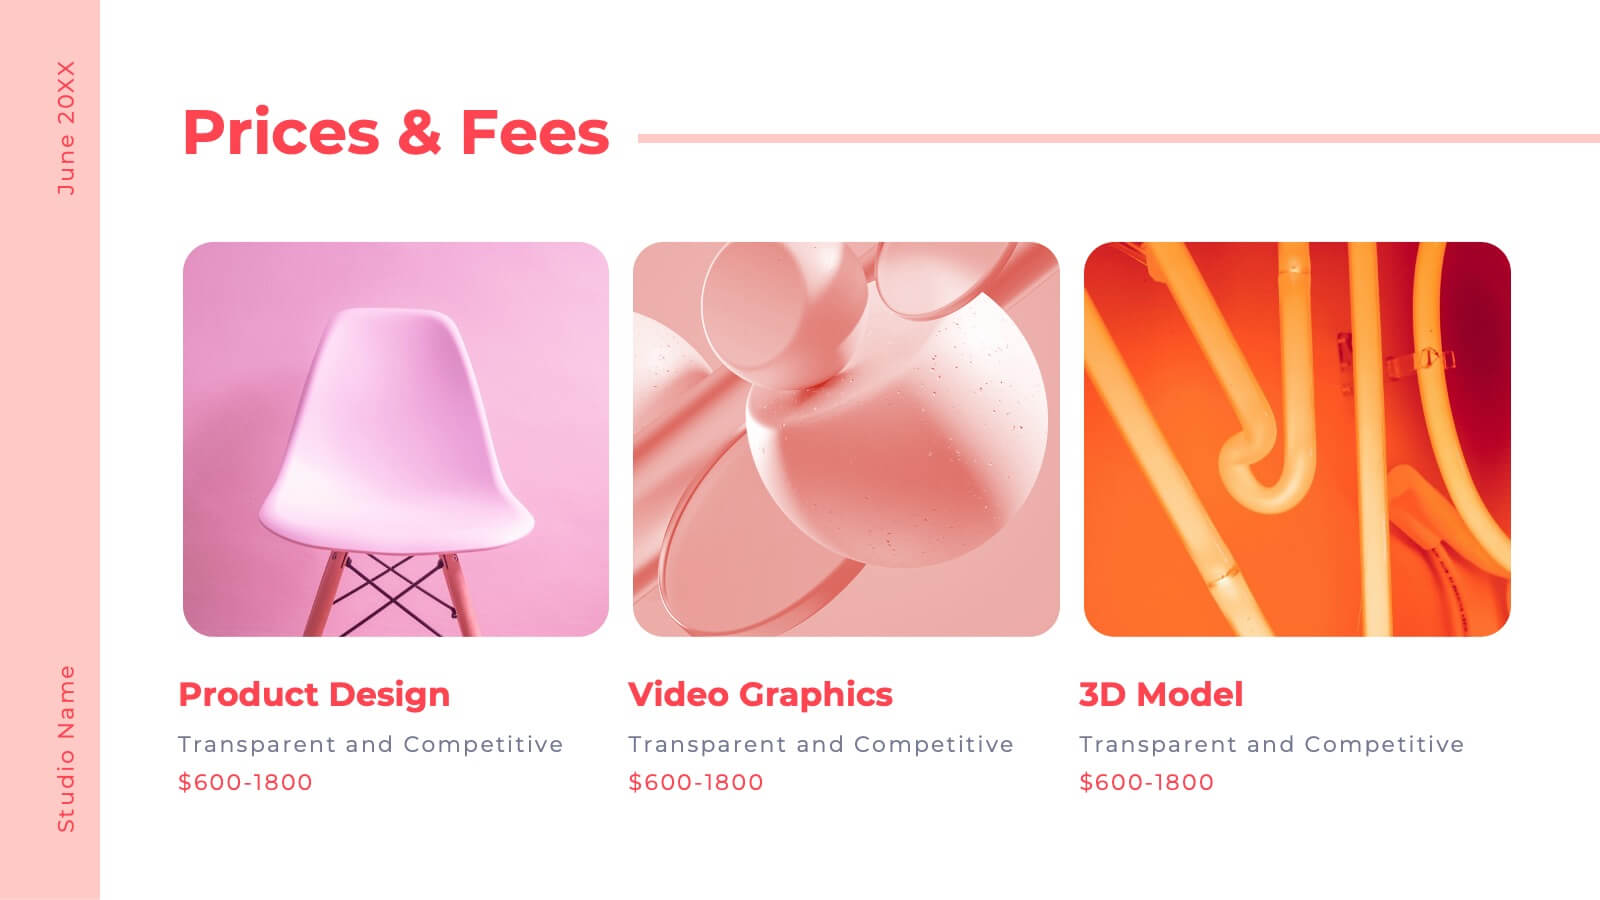
Legendra Artist Portfolio Presentation
Showcase your creative journey with this dynamic artist portfolio presentation template. Highlight your featured projects, creative process, collaborations, and pricing in a visually engaging format. Perfect for artists, designers, and creative professionals looking to impress potential clients. Fully editable in PowerPoint, Keynote, and Google Slides.