


Características


¿Tienes alguna pregunta?
Recomendar


2 diapositivas
Presentation Title Design Options Presentation
Make a bold first impression with the Presentation Title Design Options template. This visually striking layout features a futuristic 3D cube graphic framed in a circular cutout, paired with two clean content blocks for highlighting your key messages. Ideal for opening slides or concept overviews, this design is fully editable in PowerPoint, Keynote, and Google Slides.
3 diapositivas
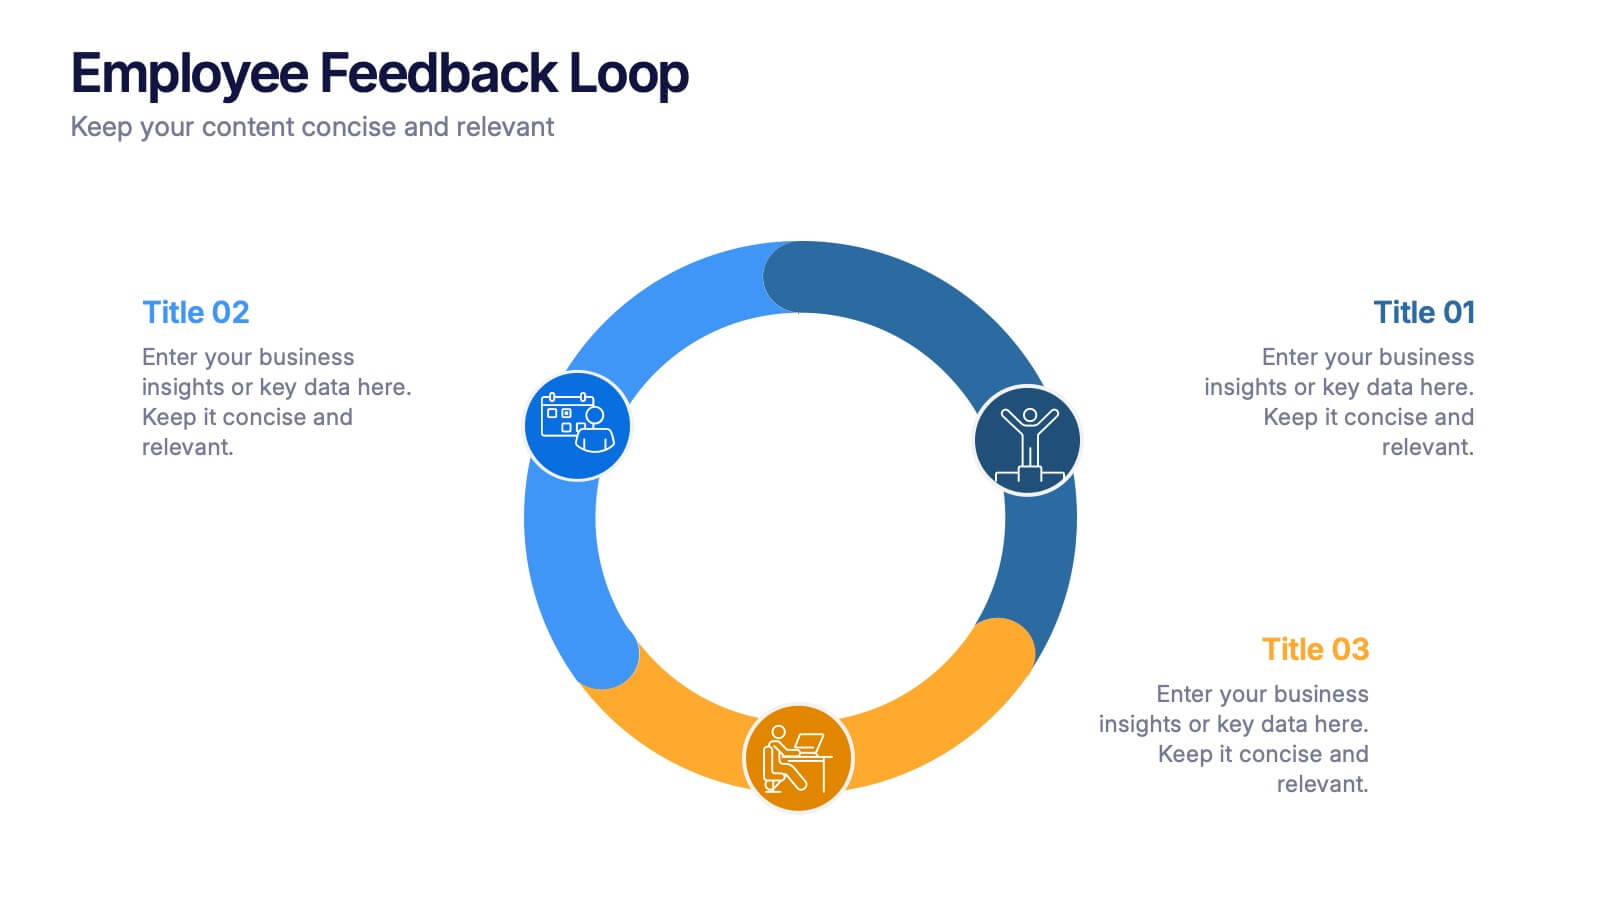
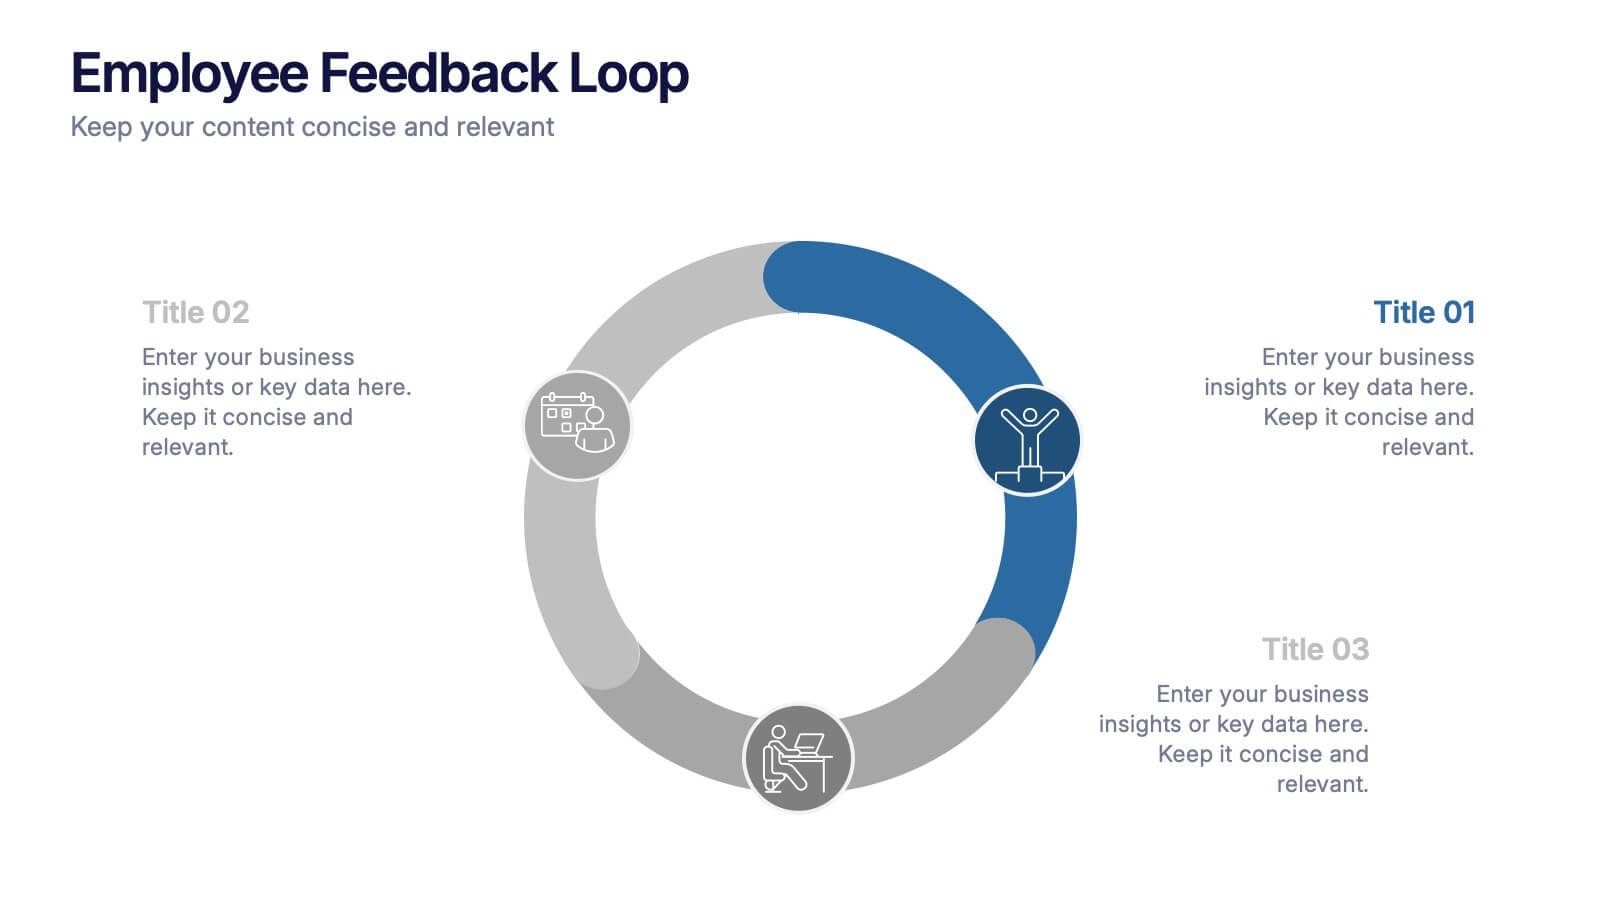
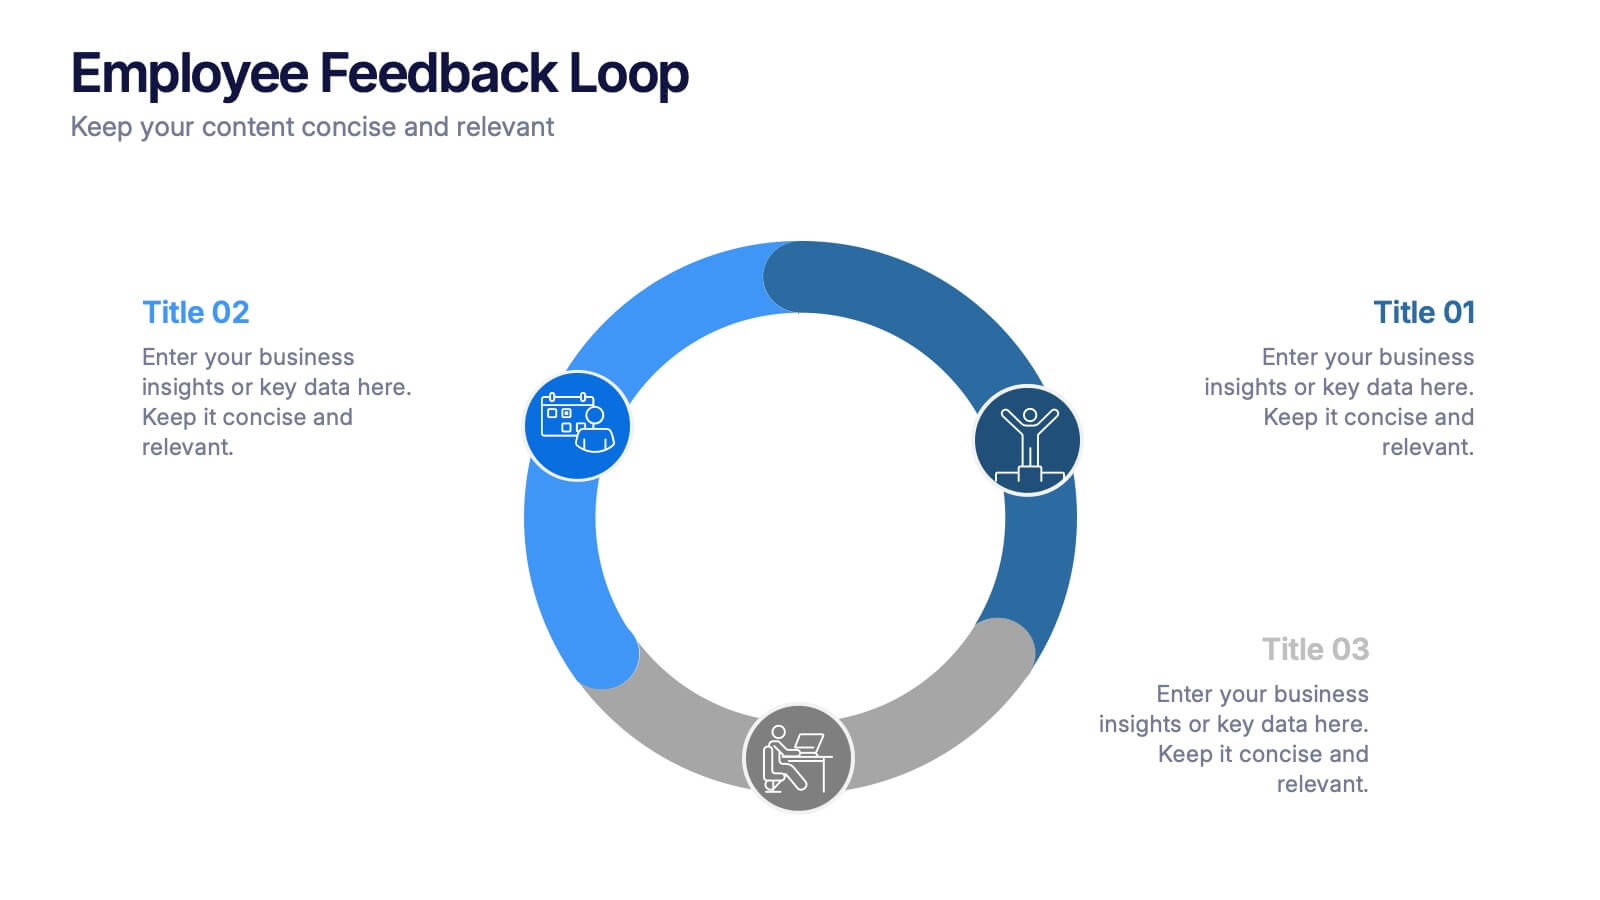
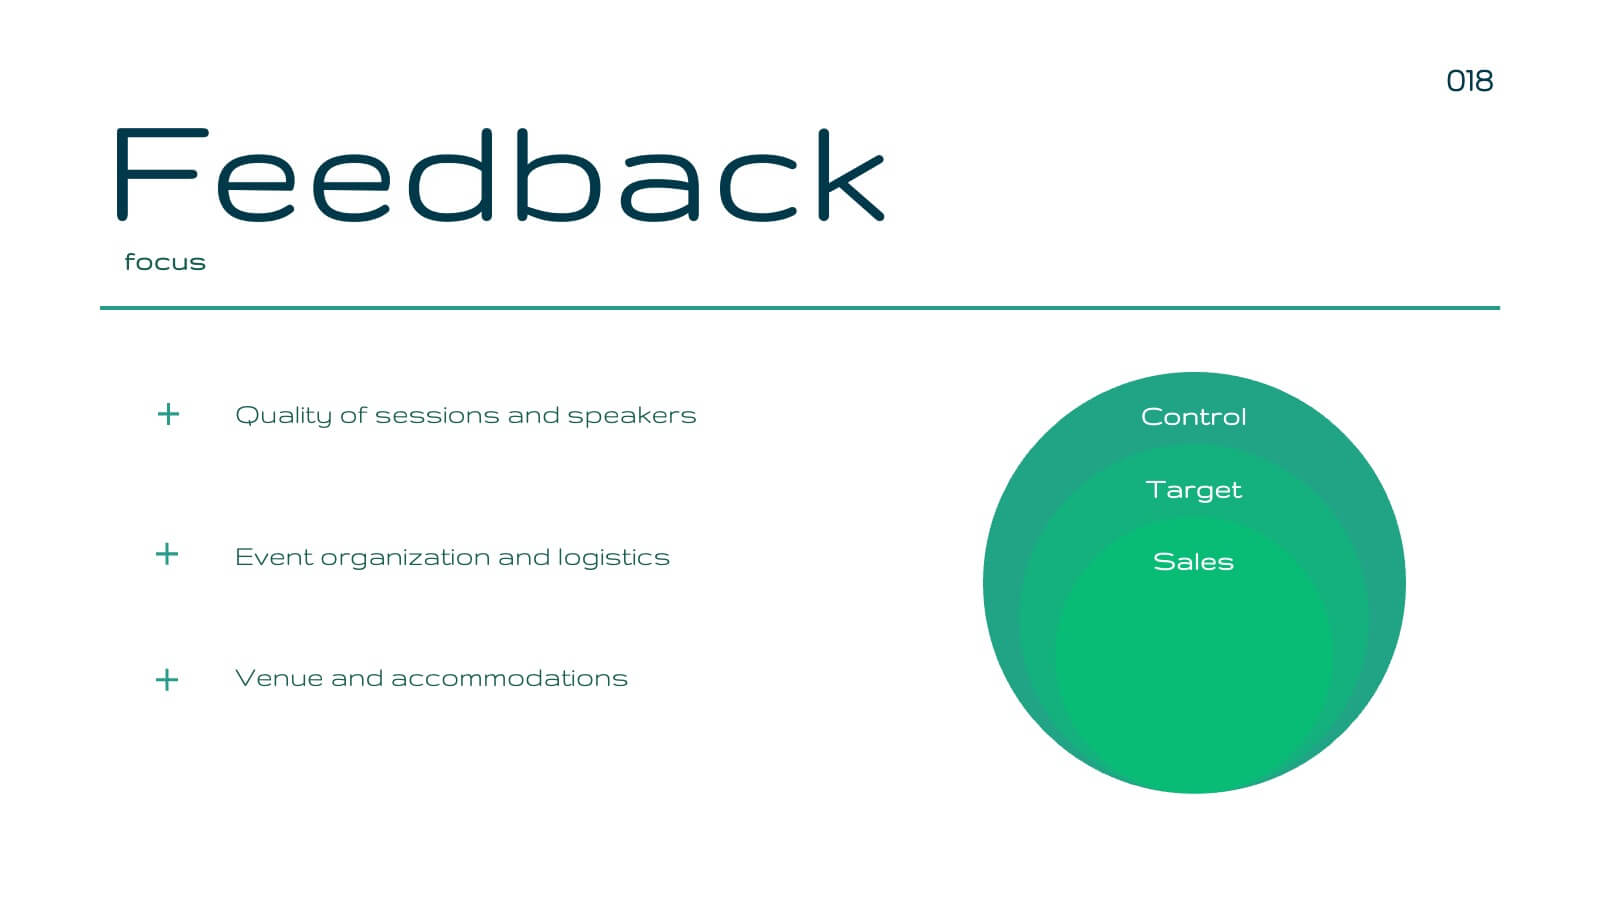
Employee Feedback Loop Presentation
Keep your team connected and continuously improving with this engaging presentation design. Ideal for showcasing communication strategies, feedback cycles, and performance insights, it helps visualize the process of collecting and acting on employee input. Fully customizable and compatible with PowerPoint, Keynote, and Google Slides for effortless, professional presentations.


26 diapositivas
Managing Work-Life Balance Presentation
Find harmony between career and personal life with this insightful presentation on managing work-life balance. Covering key strategies like time management, stress reduction, remote work efficiency, and self-care practices, this template helps promote productivity and well-being. Fully customizable and compatible with PowerPoint, Keynote, and Google Slides for a seamless and engaging presentation experience.


6 diapositivas
Search Engine Optimization Campaign Overview Presentation
Kick off your digital strategy with a clean, modern layout that makes every key insight feel connected and actionable. This presentation helps you explain campaign goals, highlight SEO priorities, and break down essential tasks in a structured, visual flow. Fully compatible with PowerPoint, Keynote, and Google Slides.


5 diapositivas
Business Insights Through Dashboard Visualization Presentation
Visualize key metrics with this Business Insights Through Dashboard Visualization presentation. The funnel chart layout is ideal for showcasing conversion rates, customer journeys, or sales processes. Each section includes clear labels and percentage indicators. Fully editable in Canva, PowerPoint, and Google Slides to suit your business reporting needs.


24 diapositivas
Minerva UX Design Presentation
Elevate your UX design presentations with this comprehensive template, featuring sections for project overview, user research, wireframes, prototyping, and usability testing. Showcase design systems, branding guidelines, and accessibility considerations with ease. Perfect for demonstrating a user-centered approach. Compatible with PowerPoint, Keynote, and Google Slides for seamless customization.


4 diapositivas
Welcome and About Us Introduction Presentation
Start strong with the Welcome and About Us Introduction Presentation, designed to deliver a polished, professional first impression. This clean layout features bold typography and geometric side visuals, perfect for introducing your company, brand values, or strategic vision. Easily customize the content to suit corporate profiles, startup decks, or team intros. Compatible with Canva, PowerPoint, Google Slides, and Keynote.


6 diapositivas
Circular Concept Diagram for Strategy Presentation
Visualize interconnected ideas with this circular concept diagram, ideal for showcasing six key strategic pillars or processes. Each segment is clearly labeled and icon-supported, creating an easy-to-follow layout. Perfect for business planning, marketing strategies, or organizational models. Compatible with PowerPoint, Keynote, and Google Slides for full customization.


19 diapositivas
Prism Design Strategy Proposal Presentation
Bring your design strategy to life with this modern and stylish presentation template! Perfect for showcasing your design concepts, processes, and elements, this template ensures that your ideas are communicated effectively. With a sleek layout for design briefs, mood boards, prototypes, and project timelines, it's the ideal tool for creative professionals. Customize it easily in PowerPoint, Keynote, or Google Slides to make a lasting impression on your audience.


6 diapositivas
Data Trends and Statistical Overview Presentation
Present your insights clearly with the Data Trends and Statistical Overview presentation. This template features a clean combination of bar charts and half-pie graphs to showcase metrics, comparisons, and progress at a glance. Ideal for monthly analytics, business reviews, or performance tracking. Fully editable in PowerPoint, Keynote, and Google Slides.


6 diapositivas
Timeline Planning with Gantt Layout Presentation
Organize your schedules clearly with this Timeline Planning with Gantt Layout presentation. Designed for efficient project tracking, this template breaks down tasks across phases and months, using a clean horizontal bar layout. Perfect for teams, planners, and managers. Fully editable in Canva, PowerPoint, and Google Slides to suit any workflow.


10 diapositivas
Corporate Growth Strategy Presentation
Elevate your corporate presentations with our "Corporate Growth Strategy Presentation" template. Designed to visually represent key growth strategies, this infographic uses a wrench graphic to symbolize the tools necessary for business expansion. Each segment of the wrench is color-coded, highlighting different strategic elements clearly and effectively. This format aids in discussing business objectives systematically, from foundational practices to advanced goals. Ideal for executives, strategists, and business analysts, this template ensures professional and coherent delivery of complex strategies. Compatible with PowerPoint, Keynote, and Google Slides, it is an indispensable tool for articulating and presenting sophisticated corporate strategies.


23 diapositivas
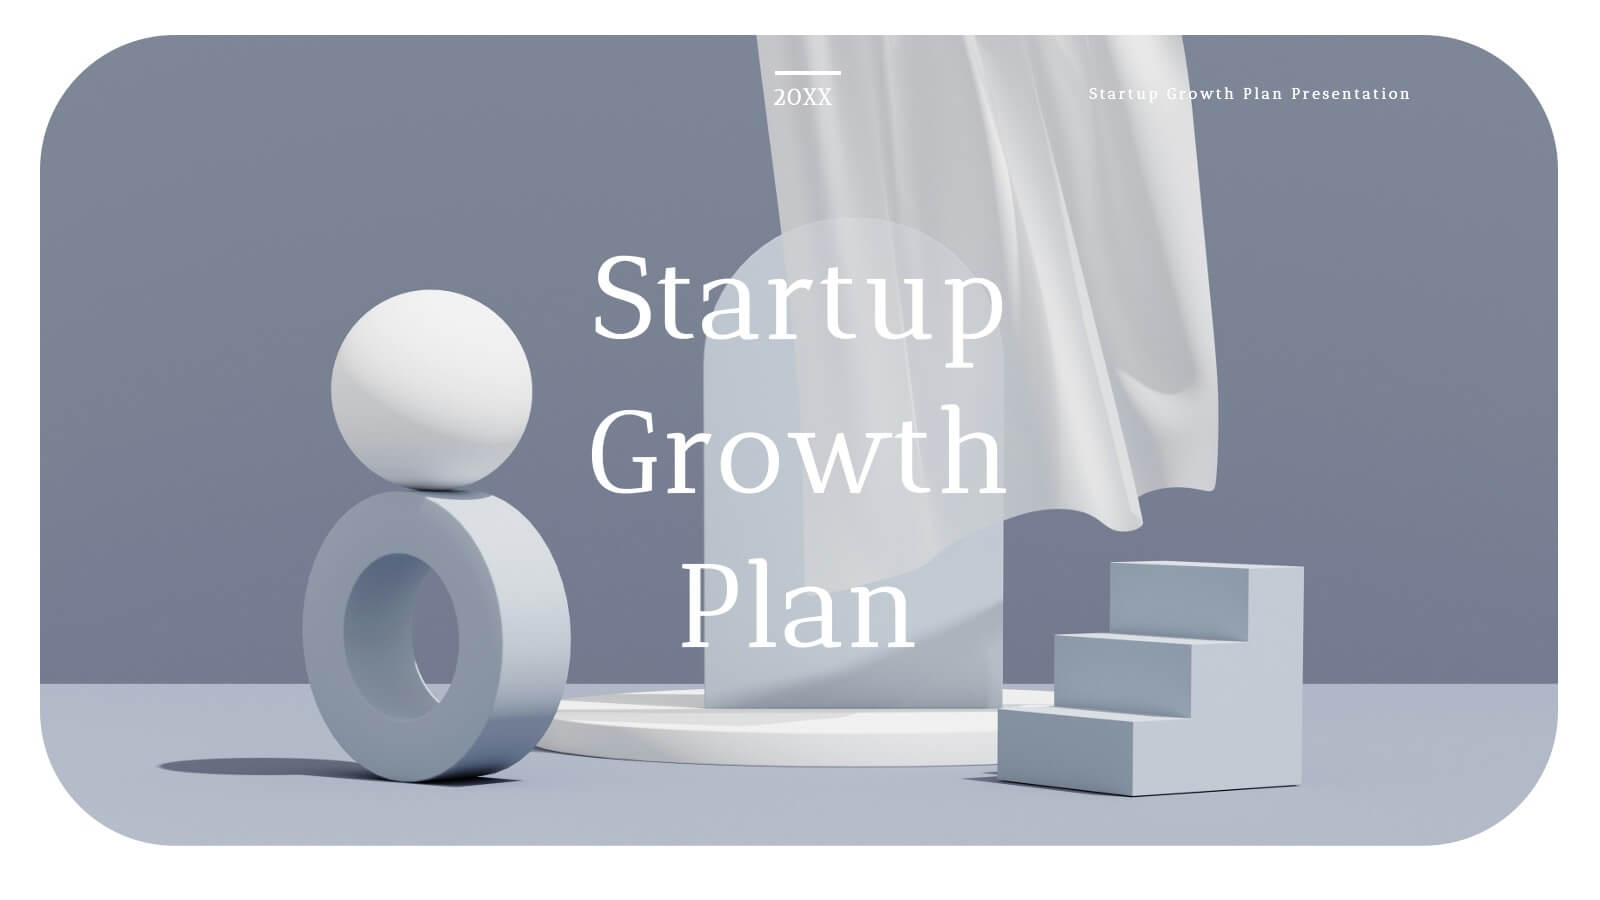
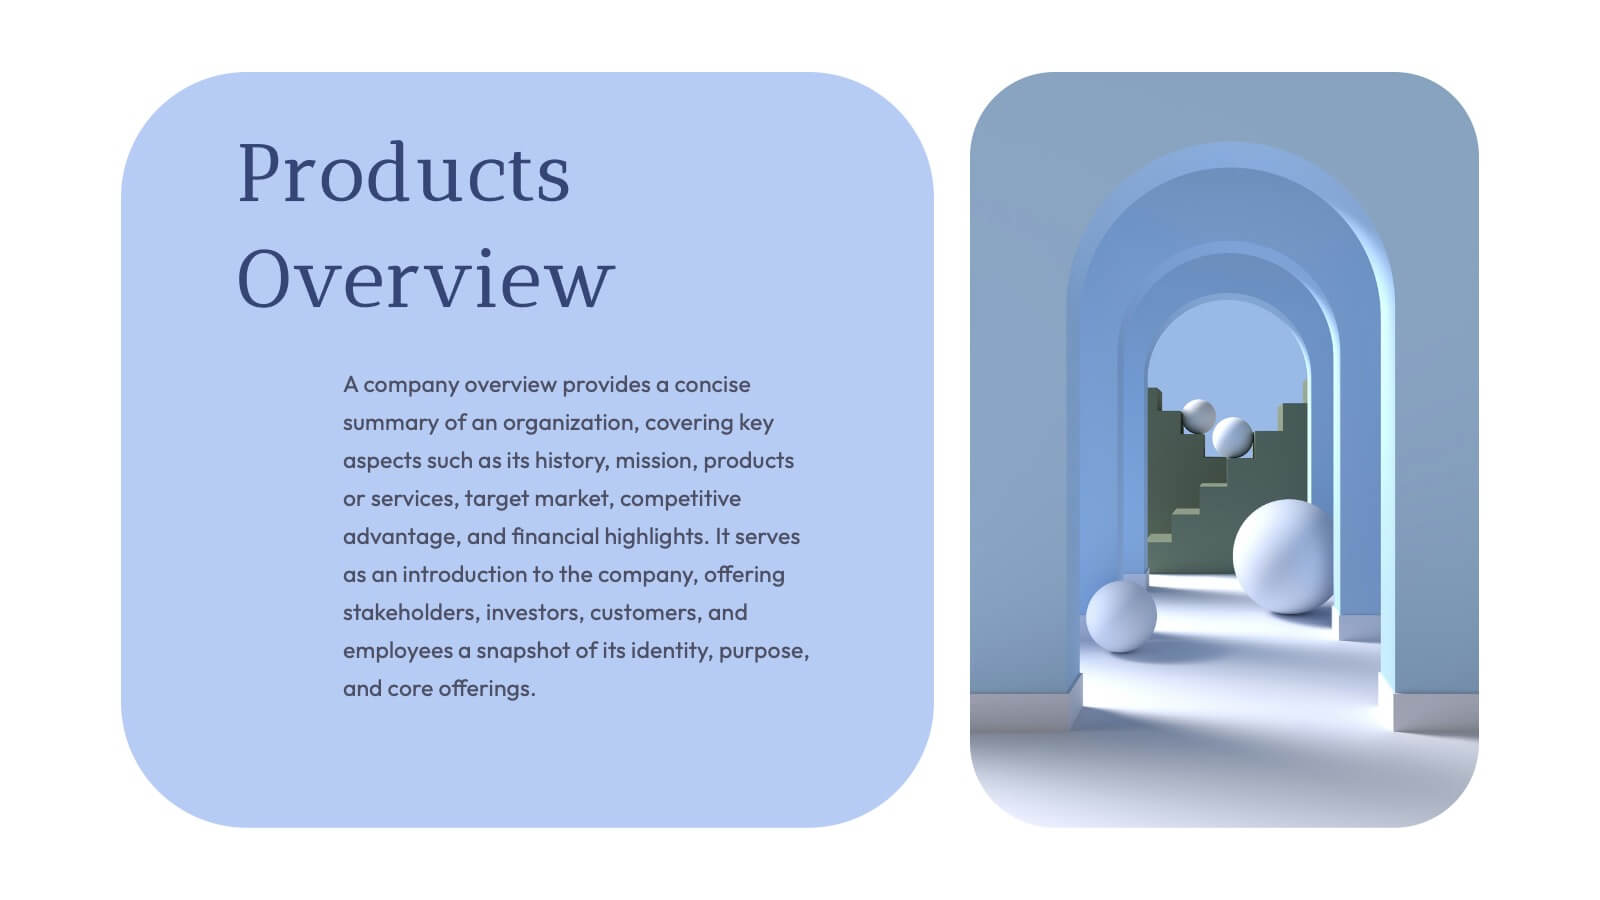
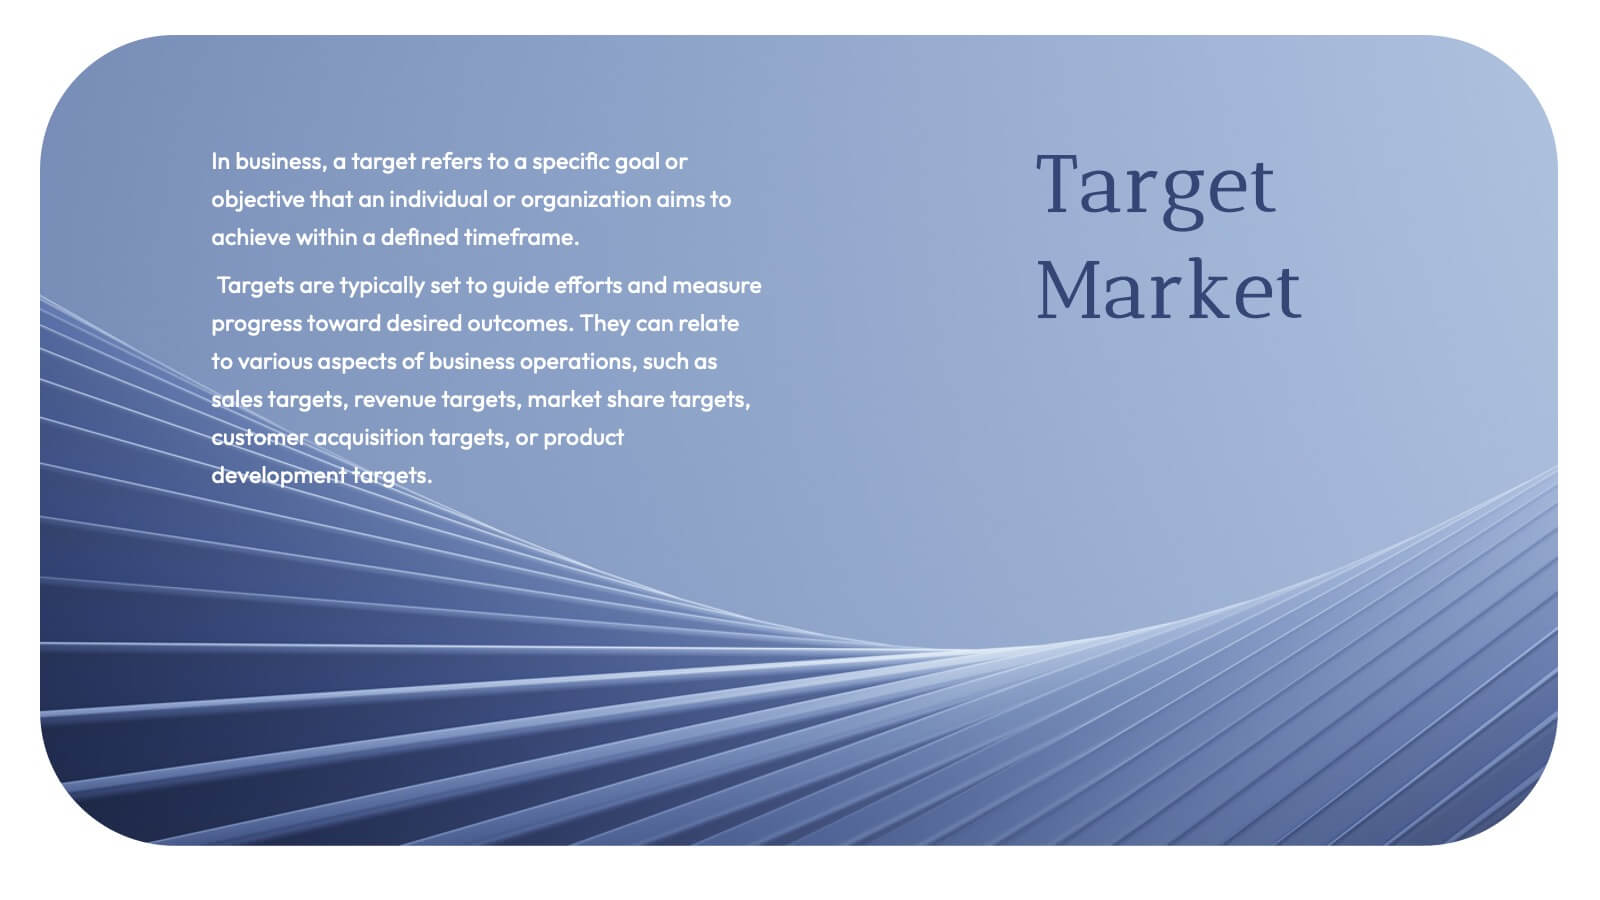
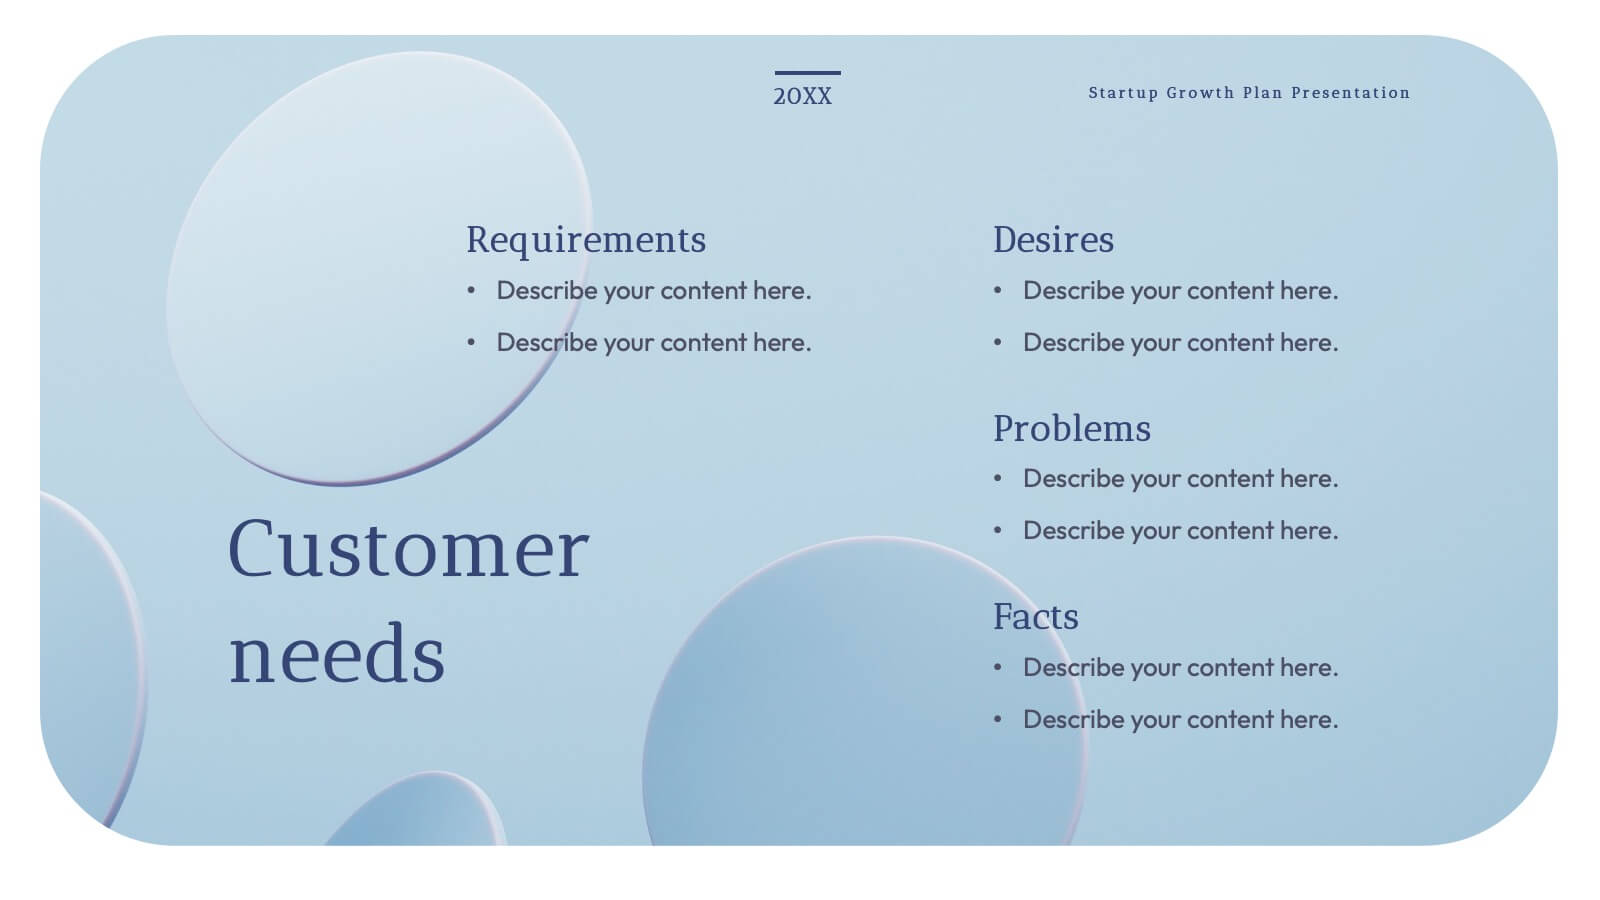
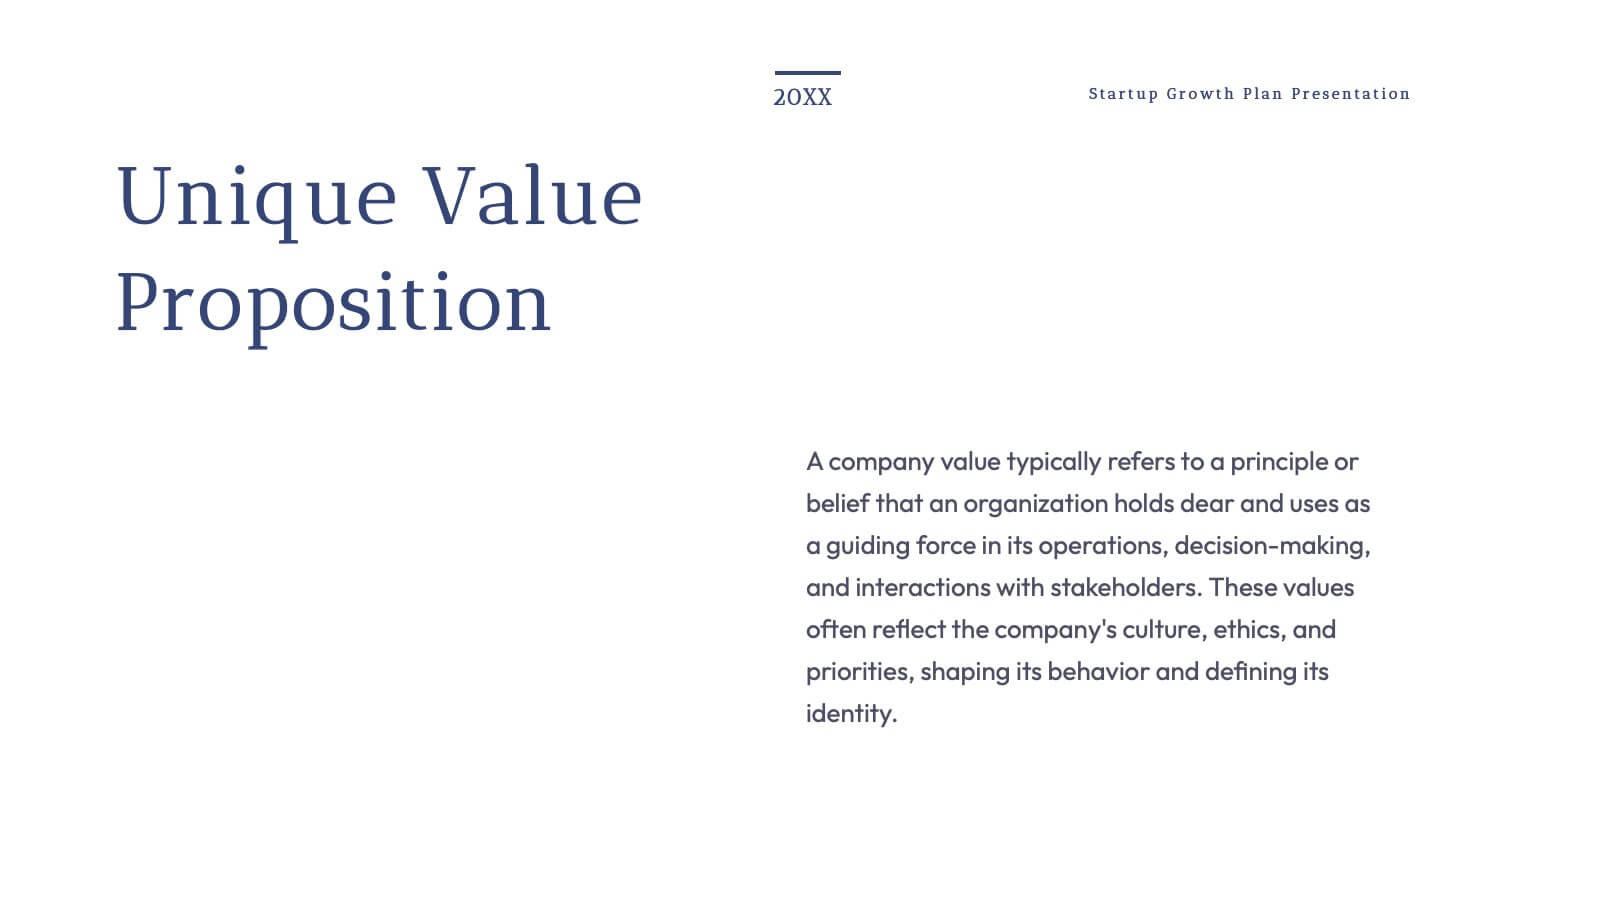
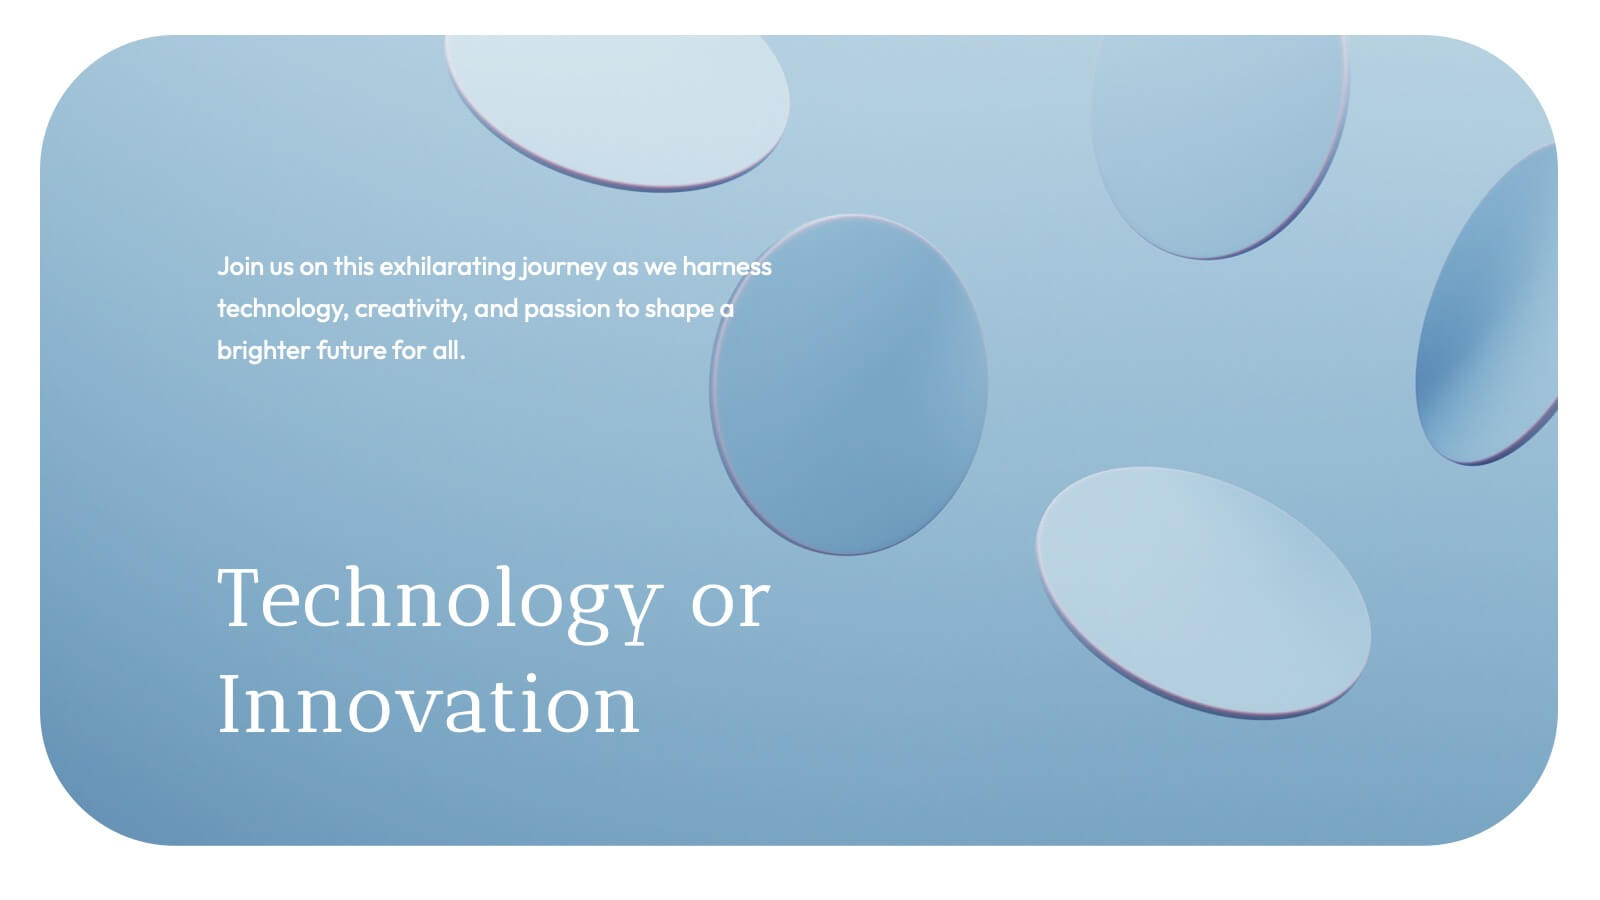
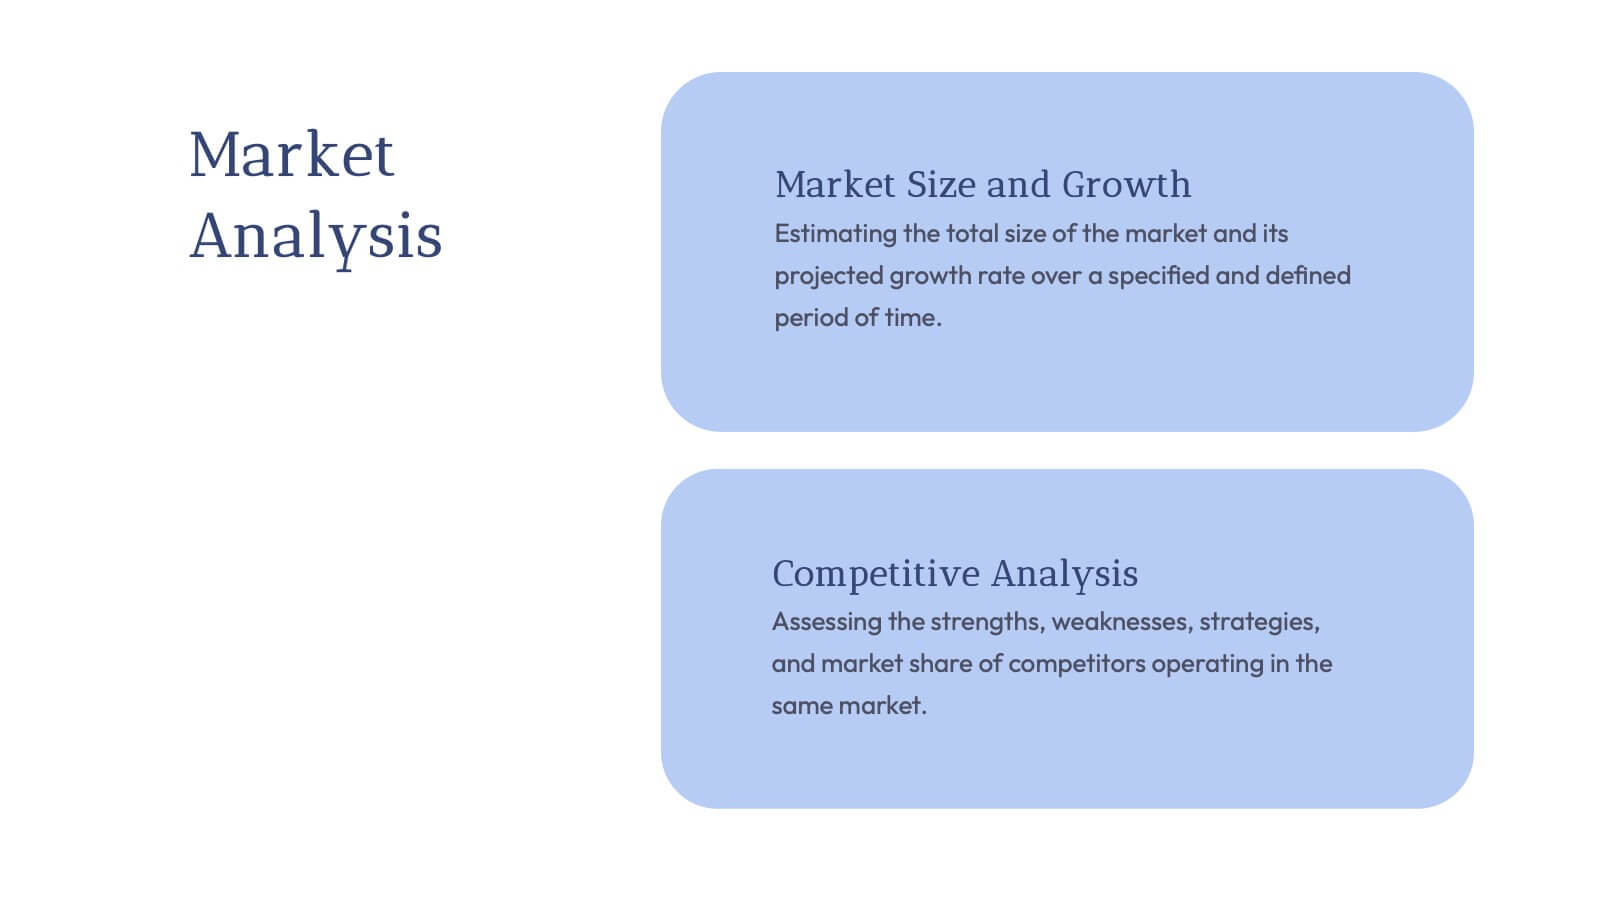
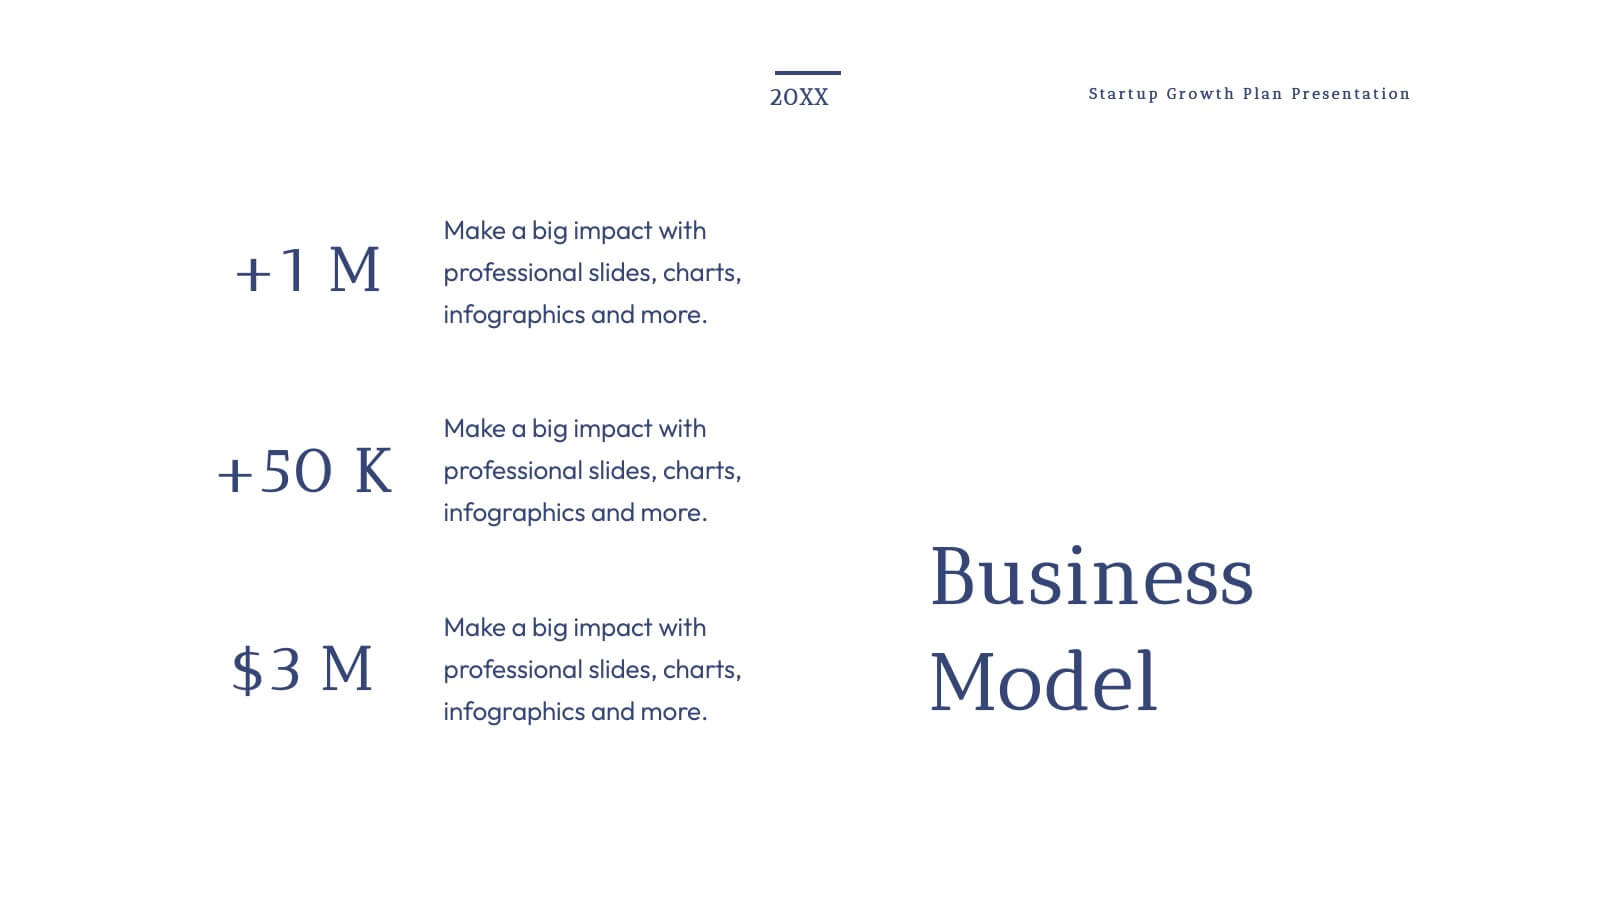
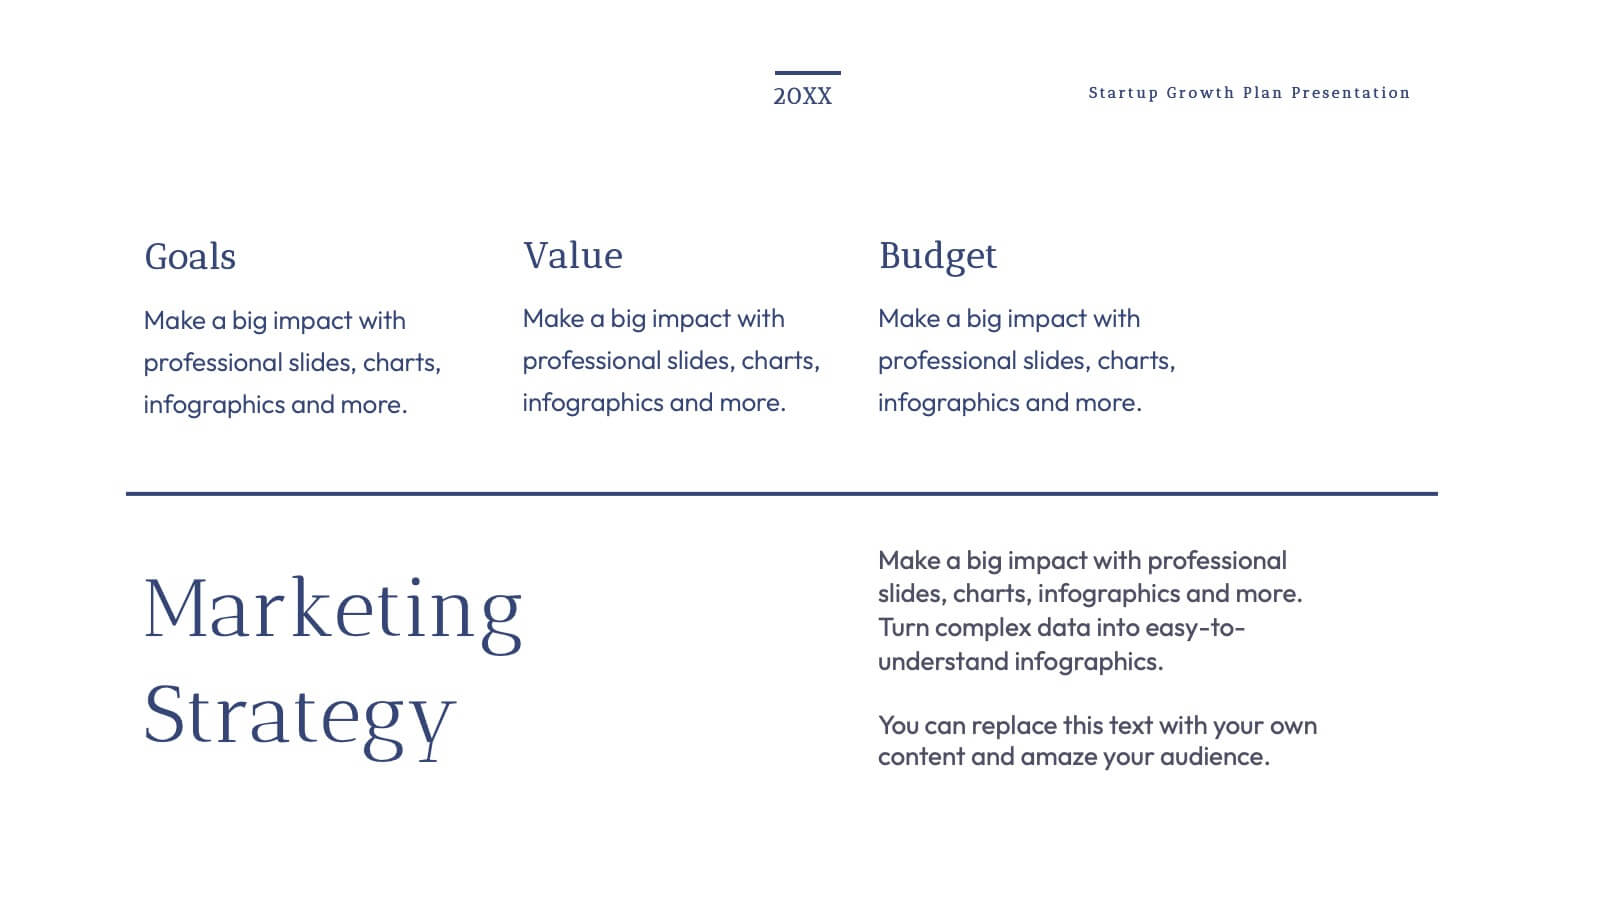
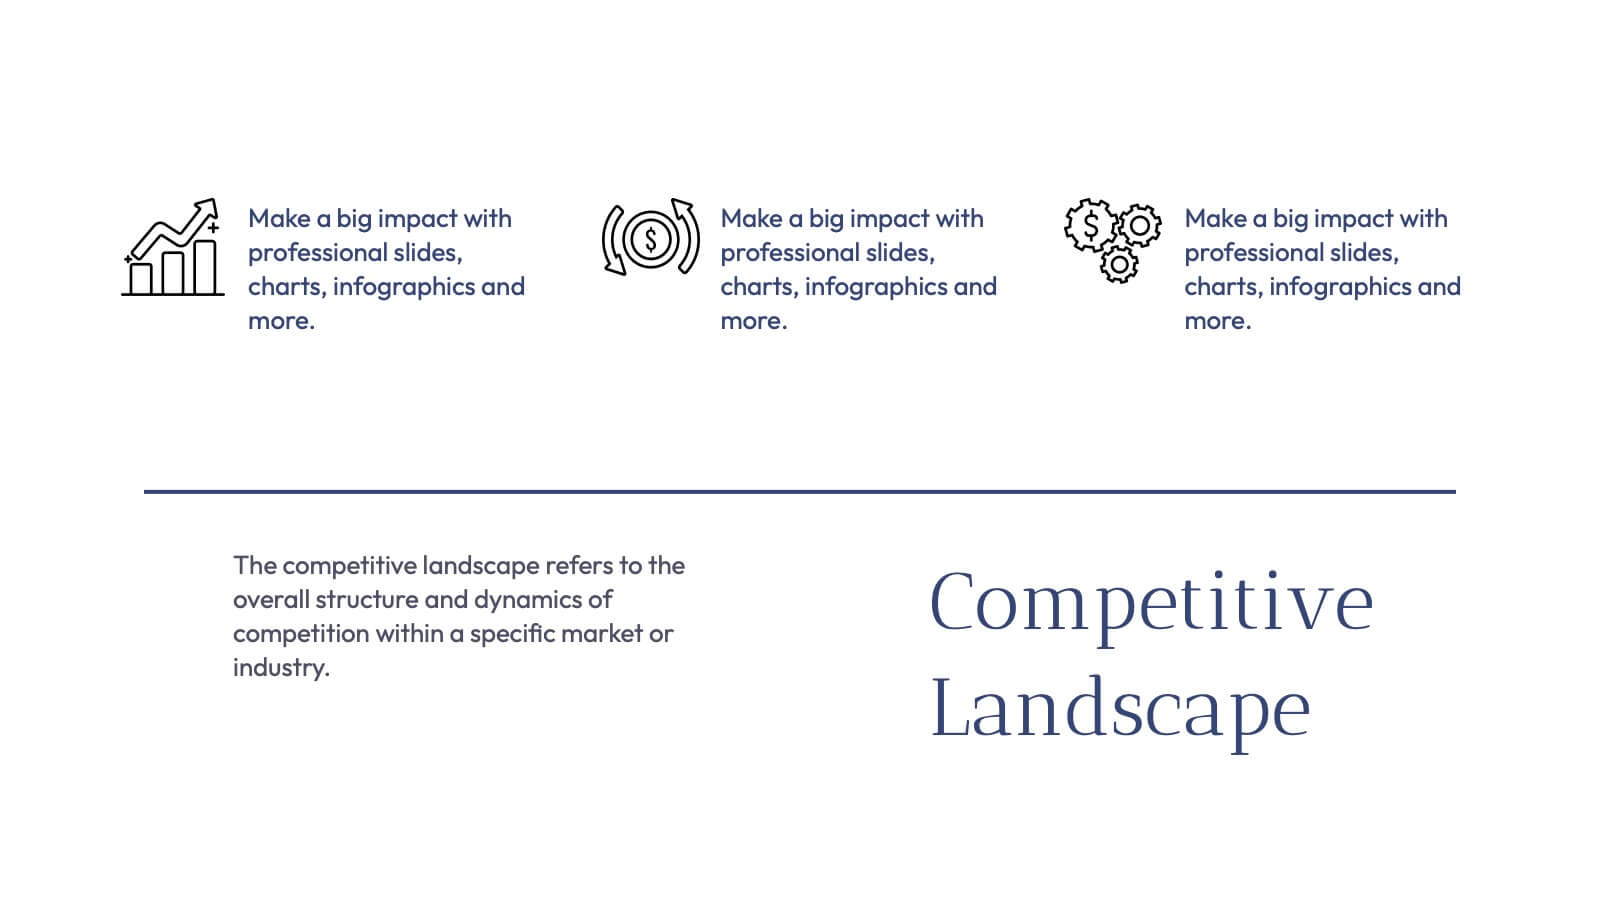
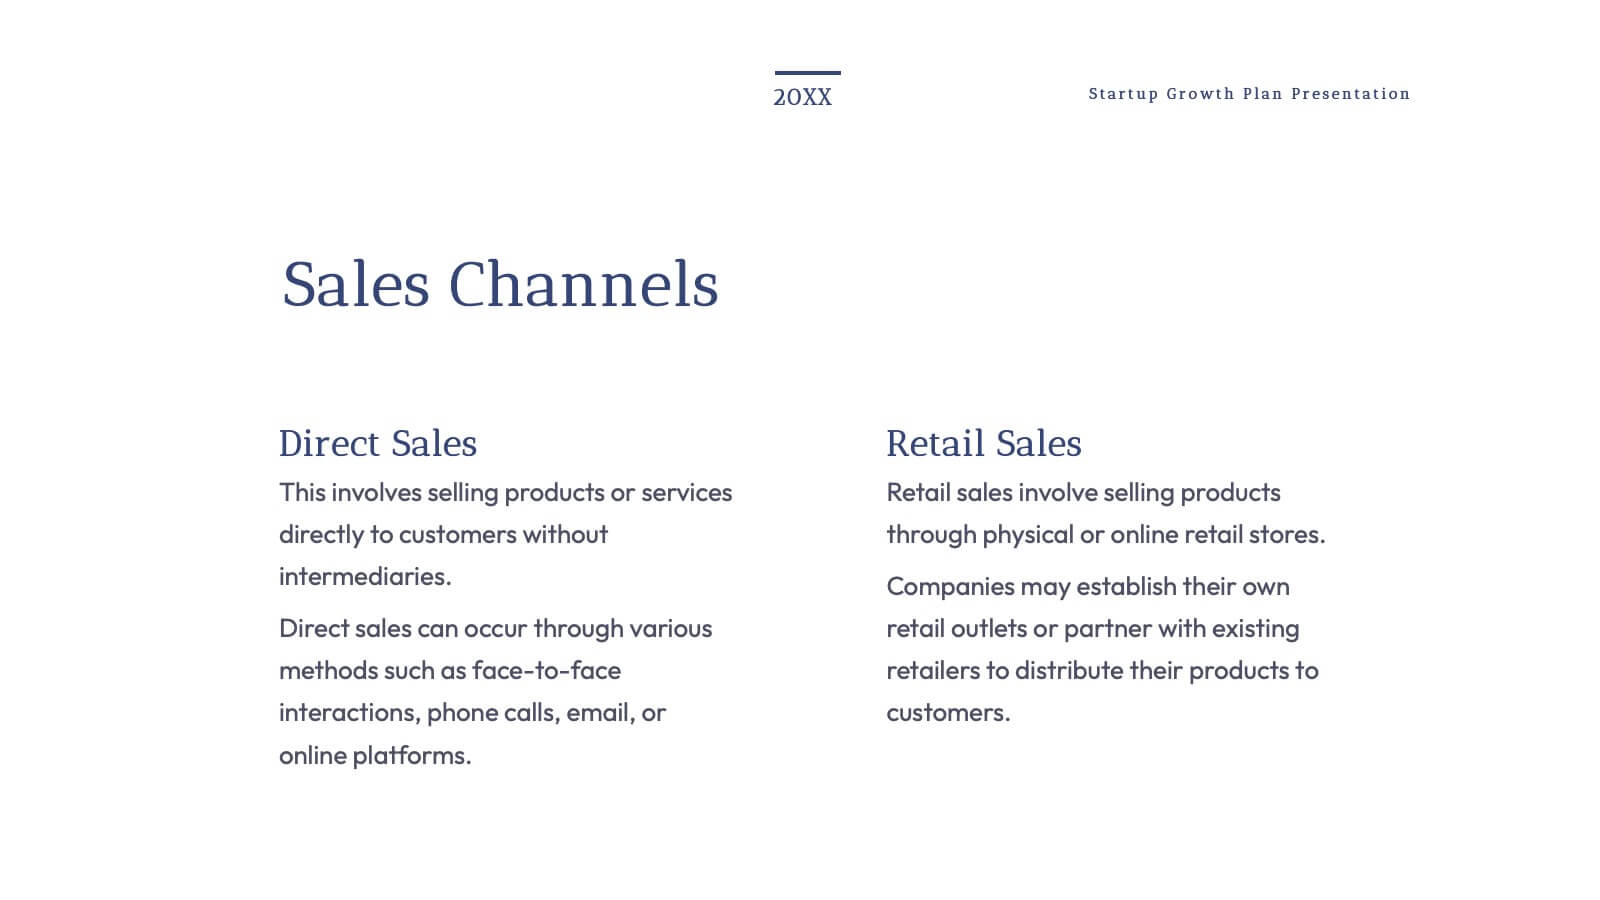
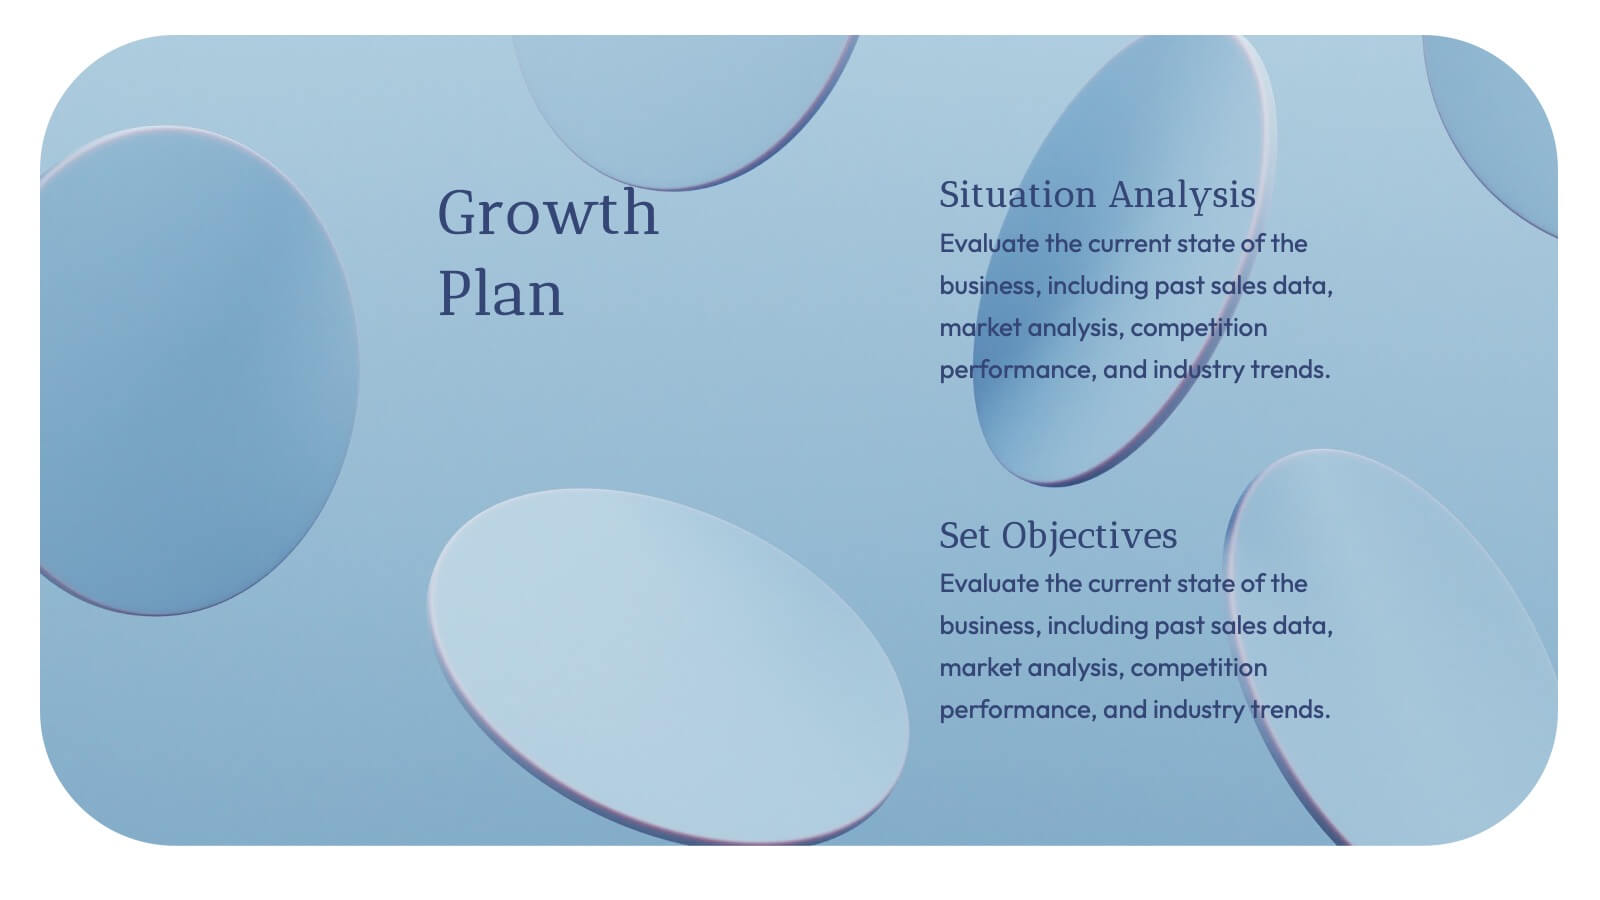
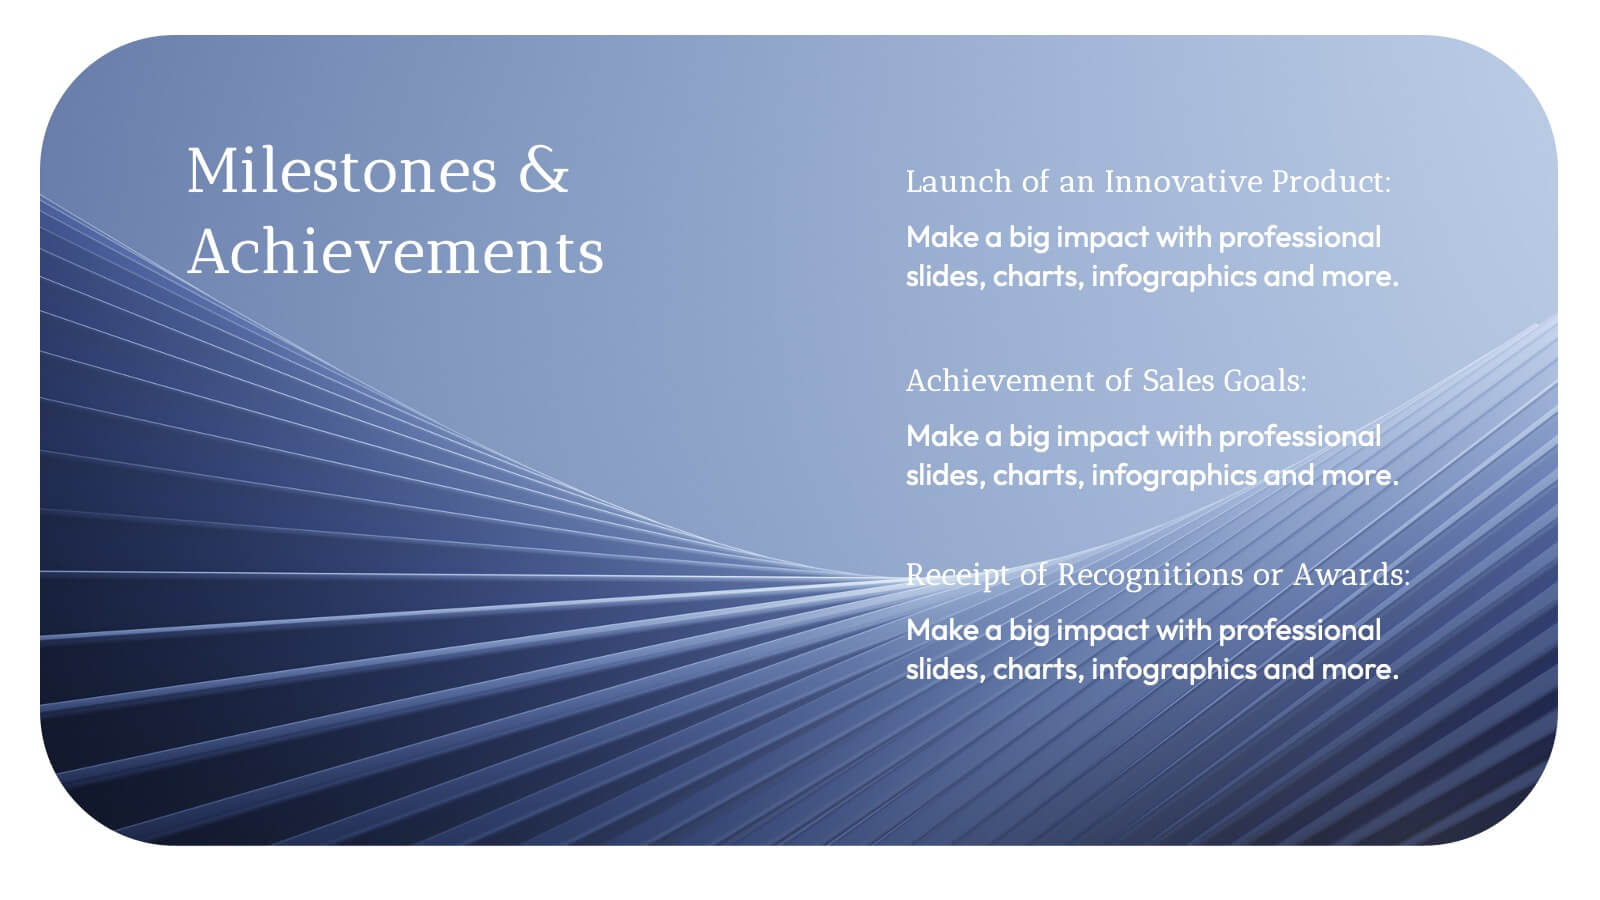
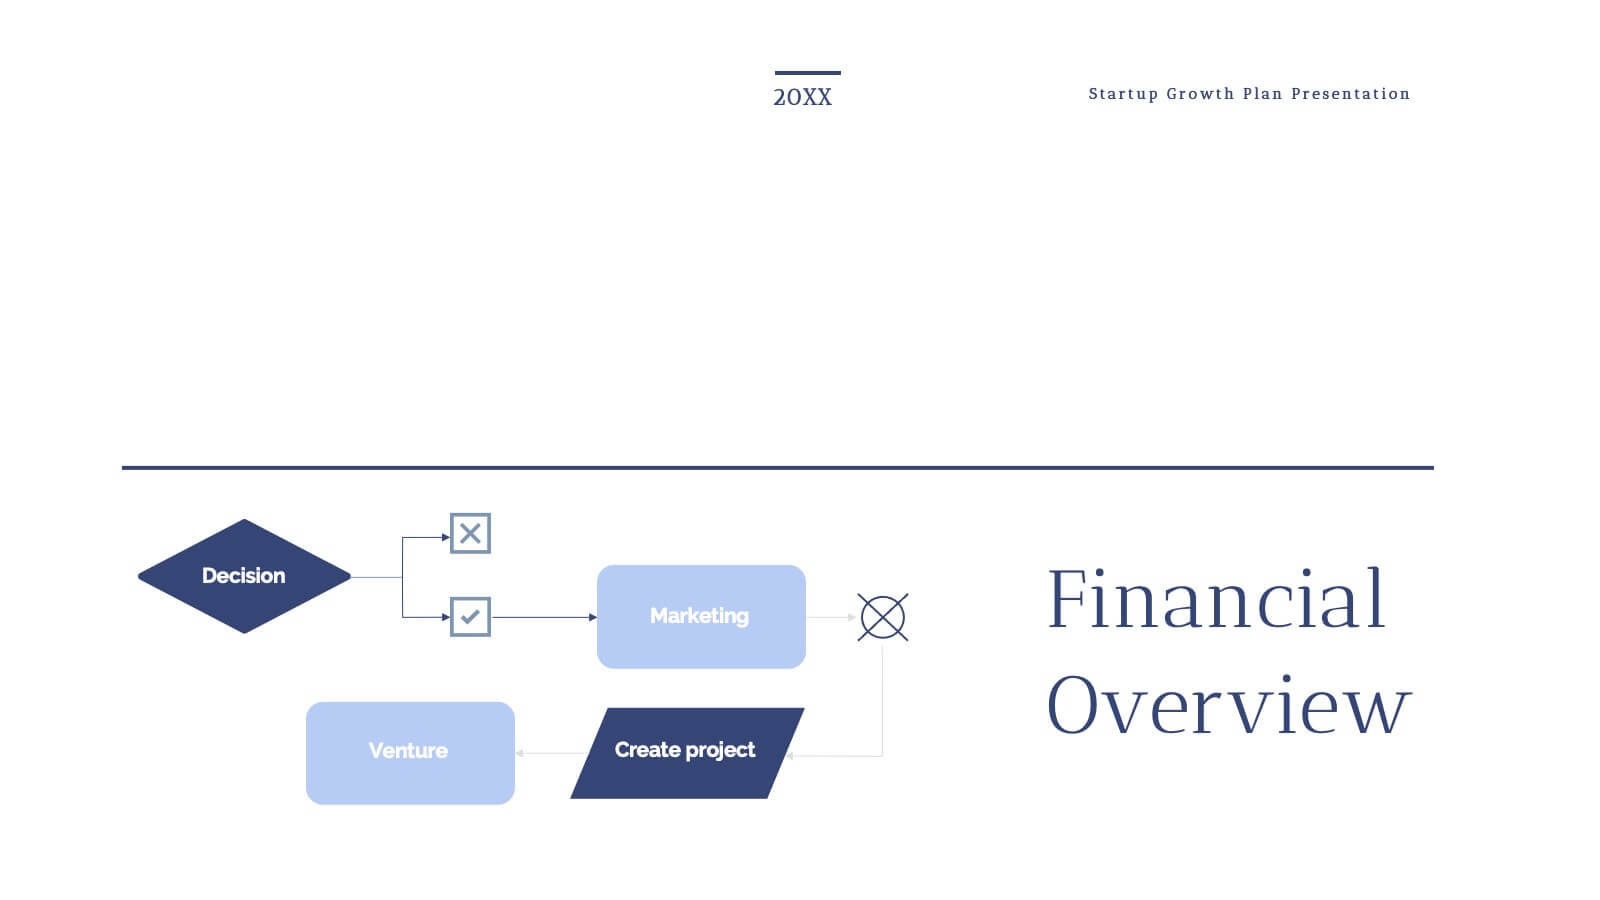
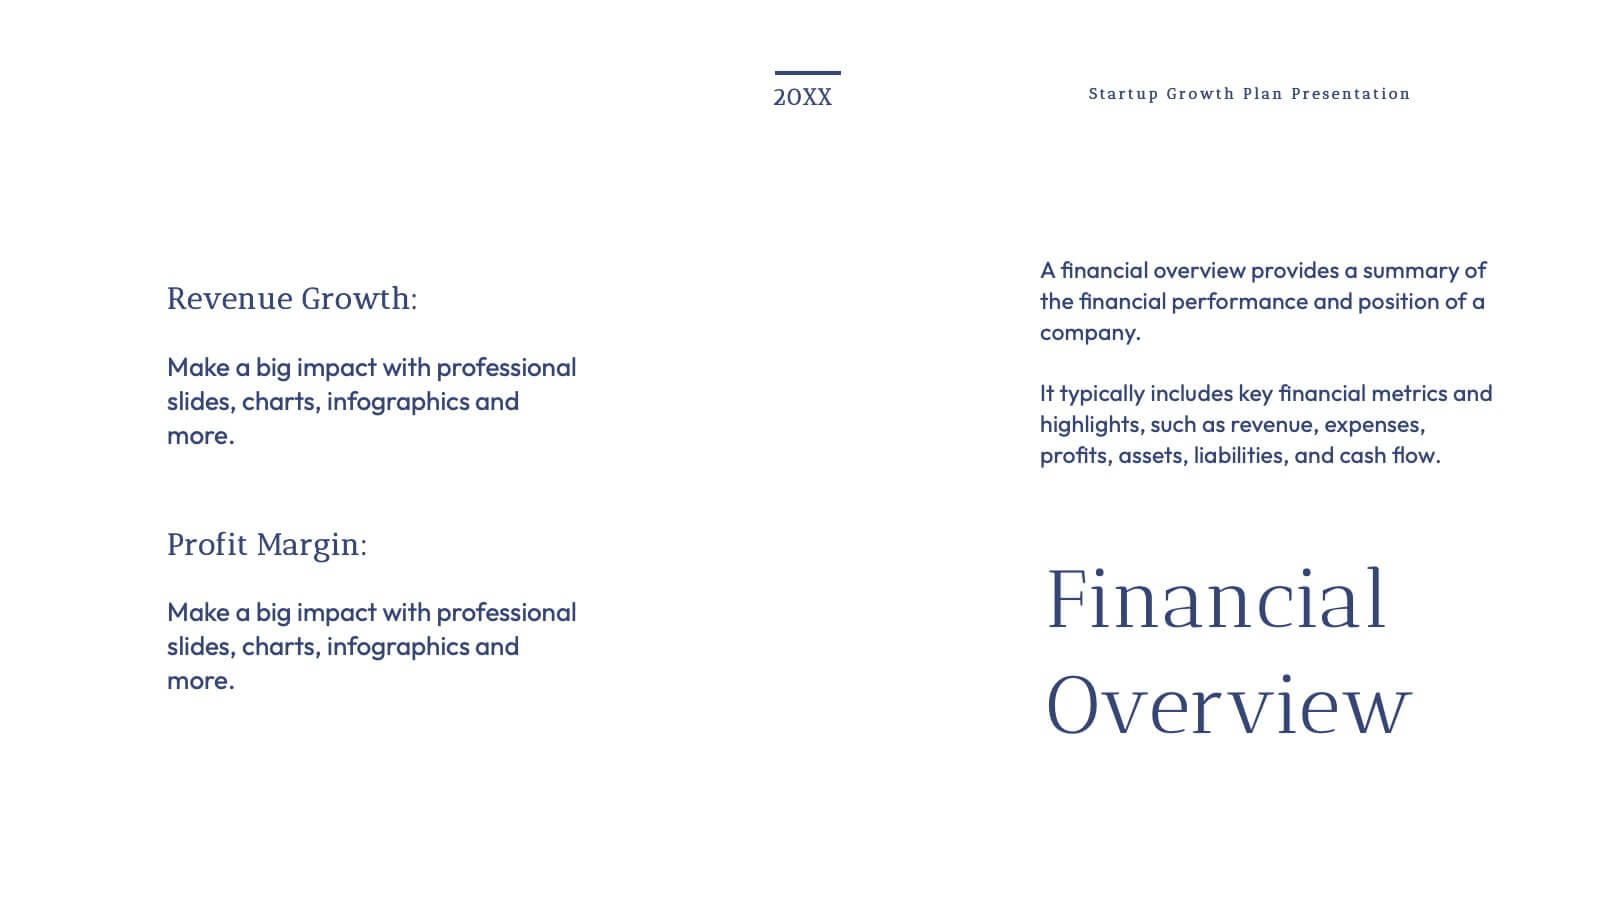
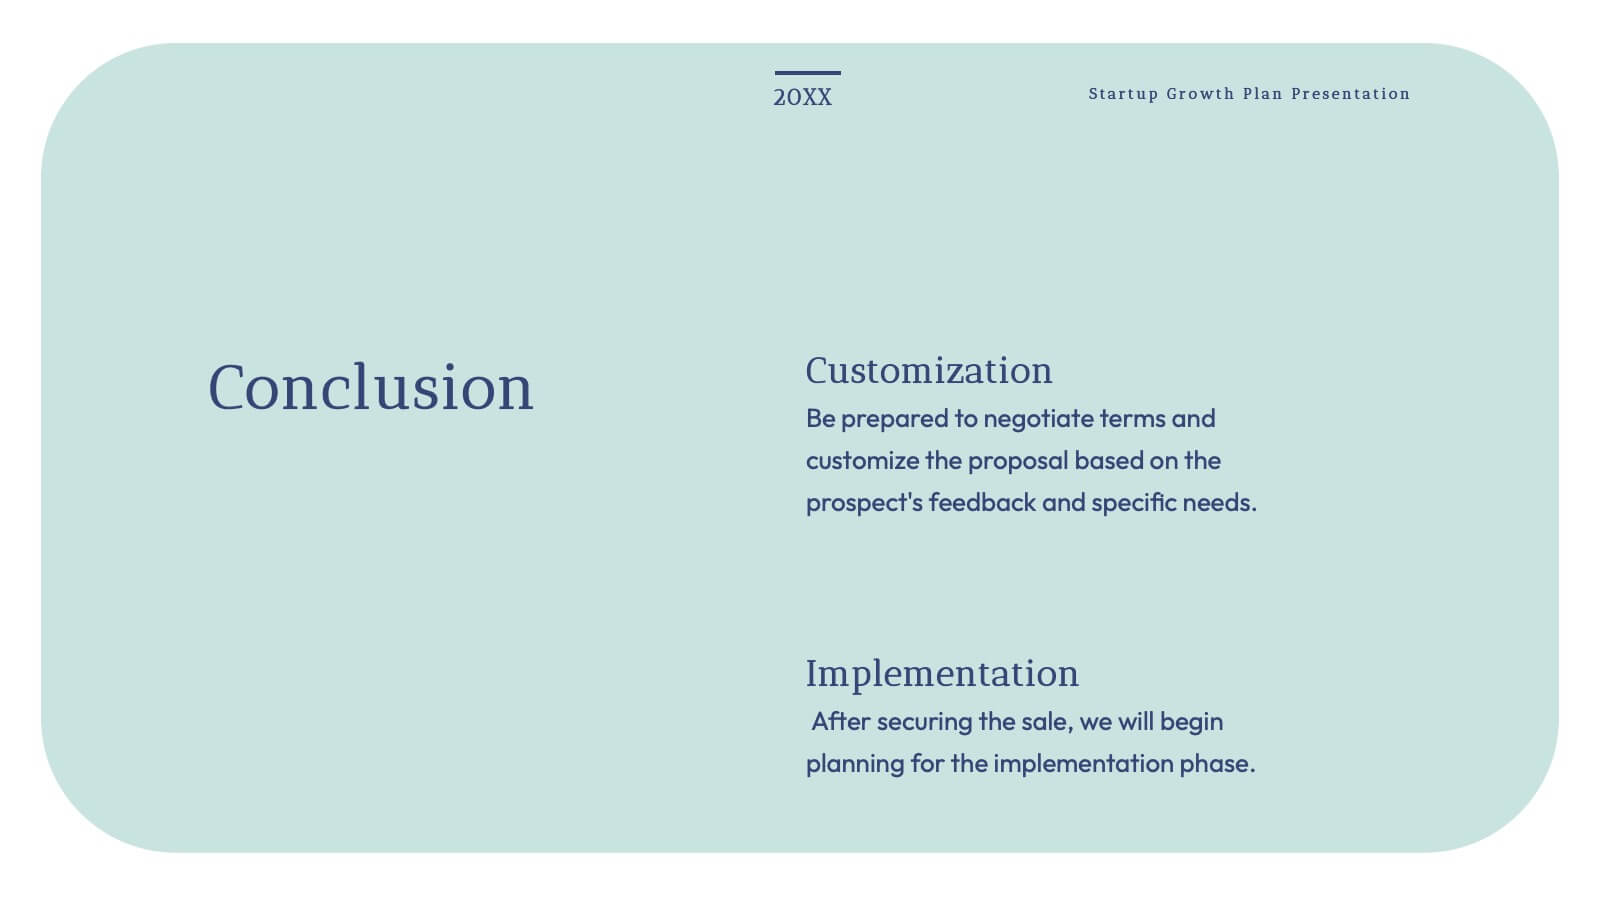
Grecian Startup Growth Plan Presentation
Elevate your pitch with this stunning Grecian-inspired presentation template, perfect for outlining your startup's growth plan! Showcase your business strategy, revenue projections, and scaling opportunities with a clean, elegant design that grabs attention. Impress investors and stakeholders with every slide. Compatible with PowerPoint, Keynote, and Google Slides for seamless customization.


21 diapositivas
Mistrain Marketing Research Report Presentation
Present complex marketing research data with a visually engaging and structured template. This presentation design simplifies the process of showcasing company history, market presence, target audience insights, and competitive landscape analysis. With sections for financial highlights, growth plans, and client testimonials, it supports a comprehensive storytelling approach. Featuring clean layouts and aesthetic visuals, this template is ideal for presenting research findings, marketing plans, or audience insights to stakeholders. Fully customizable and compatible with PowerPoint, Google Slides, and Keynote, it ensures a seamless and professional presentation experience. Perfect for businesses, agencies, and professionals aiming to make impactful impressions.


5 diapositivas
Investor-Ready Business Pitch Plan Presentation
Make your business roadmap stand out with this dynamic visual journey, perfect for impressing investors from the first slide. This infographic-style pitch deck helps clearly outline your business strategy across five milestones, using vibrant colors and icons for easy comprehension. Fully compatible with PowerPoint, Keynote, and Google Slides.


22 diapositivas
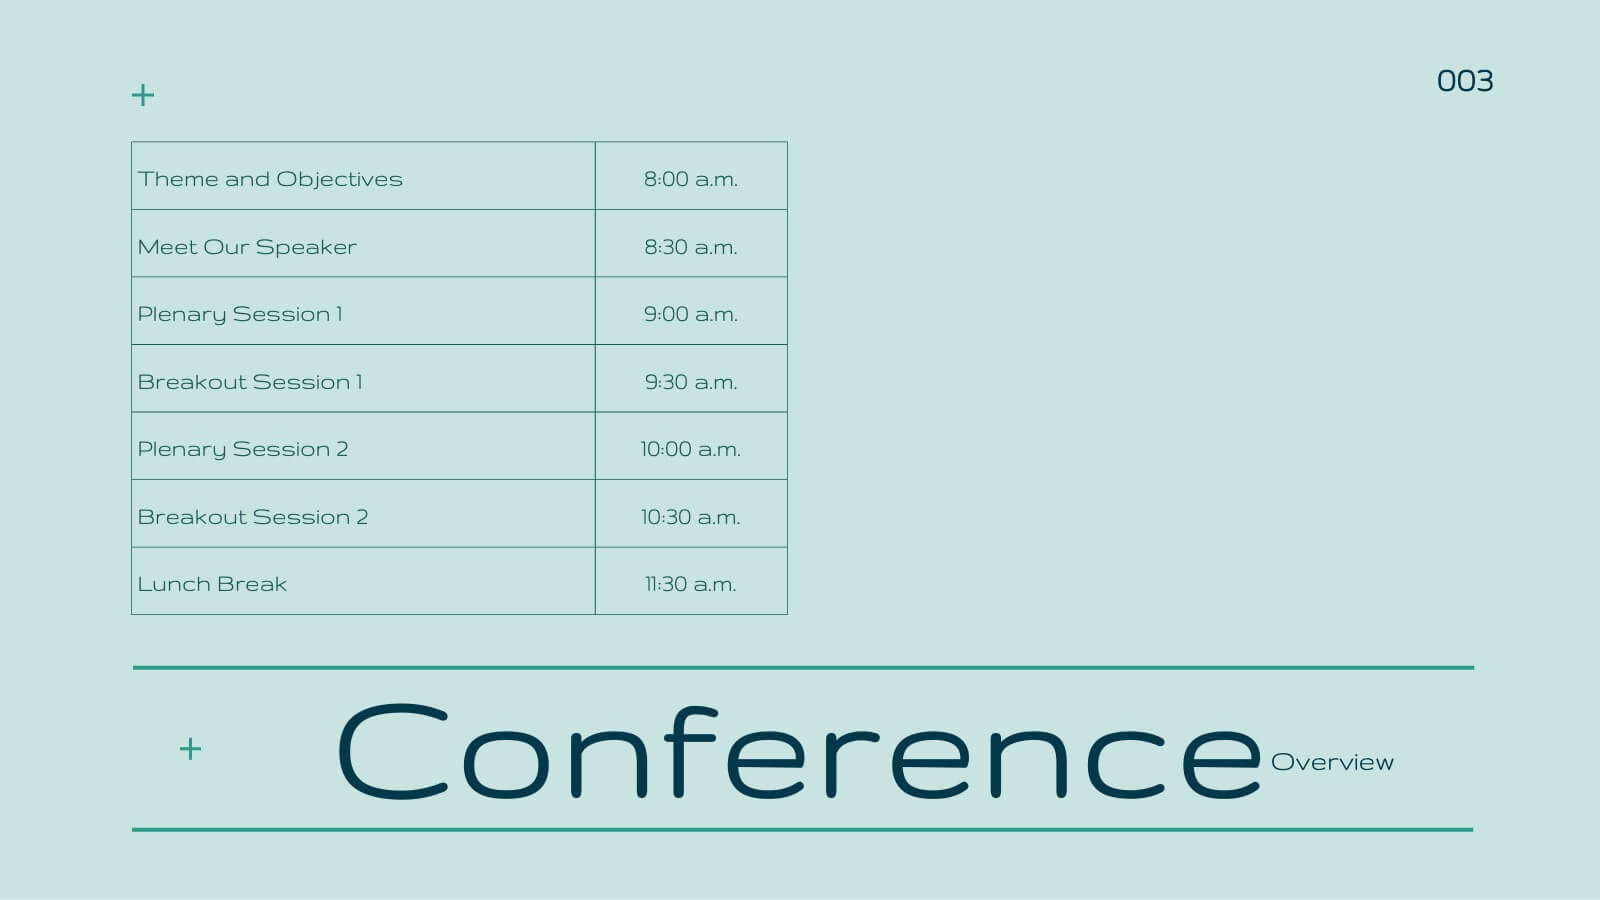
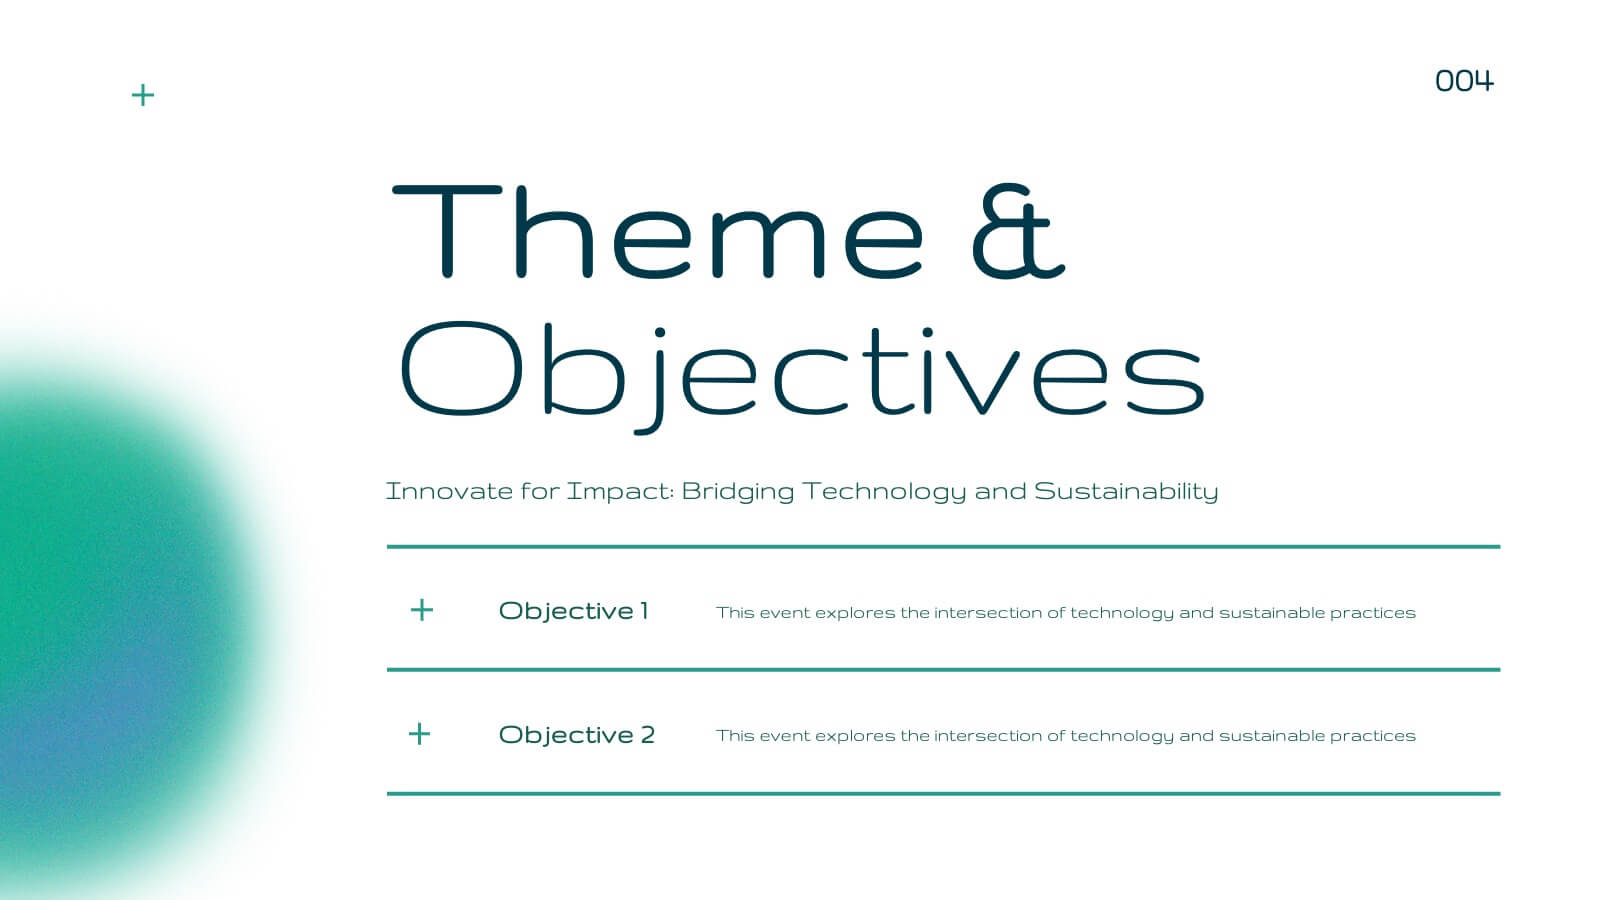
Blaze Business Operations Plan Presentation
Elevate your business presentations with this elegant, modern template designed for comprehensive business operations. Perfect for covering themes, objectives, workshops, and panel discussions, it ensures a professional and engaging delivery. The clean design and structured layout enhance clarity and impact. Compatible with PowerPoint, Keynote, and Google Slides, it’s versatile for any platform.


4 diapositivas
Nutrition and Diet Plan Presentation
Present your wellness programs with clarity using this circular nutrition infographic. Ideal for showcasing food groups, dietary recommendations, or balanced meal plans, this layout uses segmented visuals and icons for better understanding. Perfect for nutritionists, wellness coaches, or healthcare professionals. Compatible with PowerPoint, Keynote, and Google Slides.