


Características


¿Tienes alguna pregunta?
Recomendar


8 diapositivas
Product Development and Innovation
Break down your product journey with this modern step-by-step infographic. Ideal for startups, product managers, and innovation teams, this slide illustrates four stages—perfect for visualizing design thinking, MVP rollouts, or feature planning. Easily editable in PowerPoint, Keynote, and Google Slides.


5 diapositivas
Company Origin and Growth History Presentation
Showcase your company’s journey with the Company Origin and Growth History Presentation. This visual step diagram is ideal for illustrating key milestones, business expansion, or historical achievements. Perfect for pitch decks, annual reports, or investor updates. Fully editable in Canva, PowerPoint, Keynote, and Google Slides for seamless customization.


26 diapositivas
Flowers Bold Company Profile Presentation
Step into the enchanting garden of happy flowers, where petals dance and colors sing. Our template, awash in sunlit shades of pink, yellow, orange, and blue, encapsulates the very essence of floral joy. Bursting with vibrant graphics, whimsical icons, and cheerful image placeholders, it's a bouquet of design brilliance. Crafted to perfection for Powerpoint, Keynote, or Google Slides. A delightful pick for florists, garden enthusiasts, event planners, or anyone looking to infuse their presentation with a touch of nature's merriment. Blossom your ideas; let your presentations bloom with happiness.


6 diapositivas
Demographic and Behavioral Customer Profile Presentation
Understand your audience better with the Demographic and Behavioral Customer Profile Presentation. This visually engaging template separates key demographic details from behavior-based insights to help you build more effective marketing strategies. Fully customizable in Canva, PowerPoint, or Google Slides—perfect for marketers, strategists, and sales teams targeting customer segmentation.


20 diapositivas
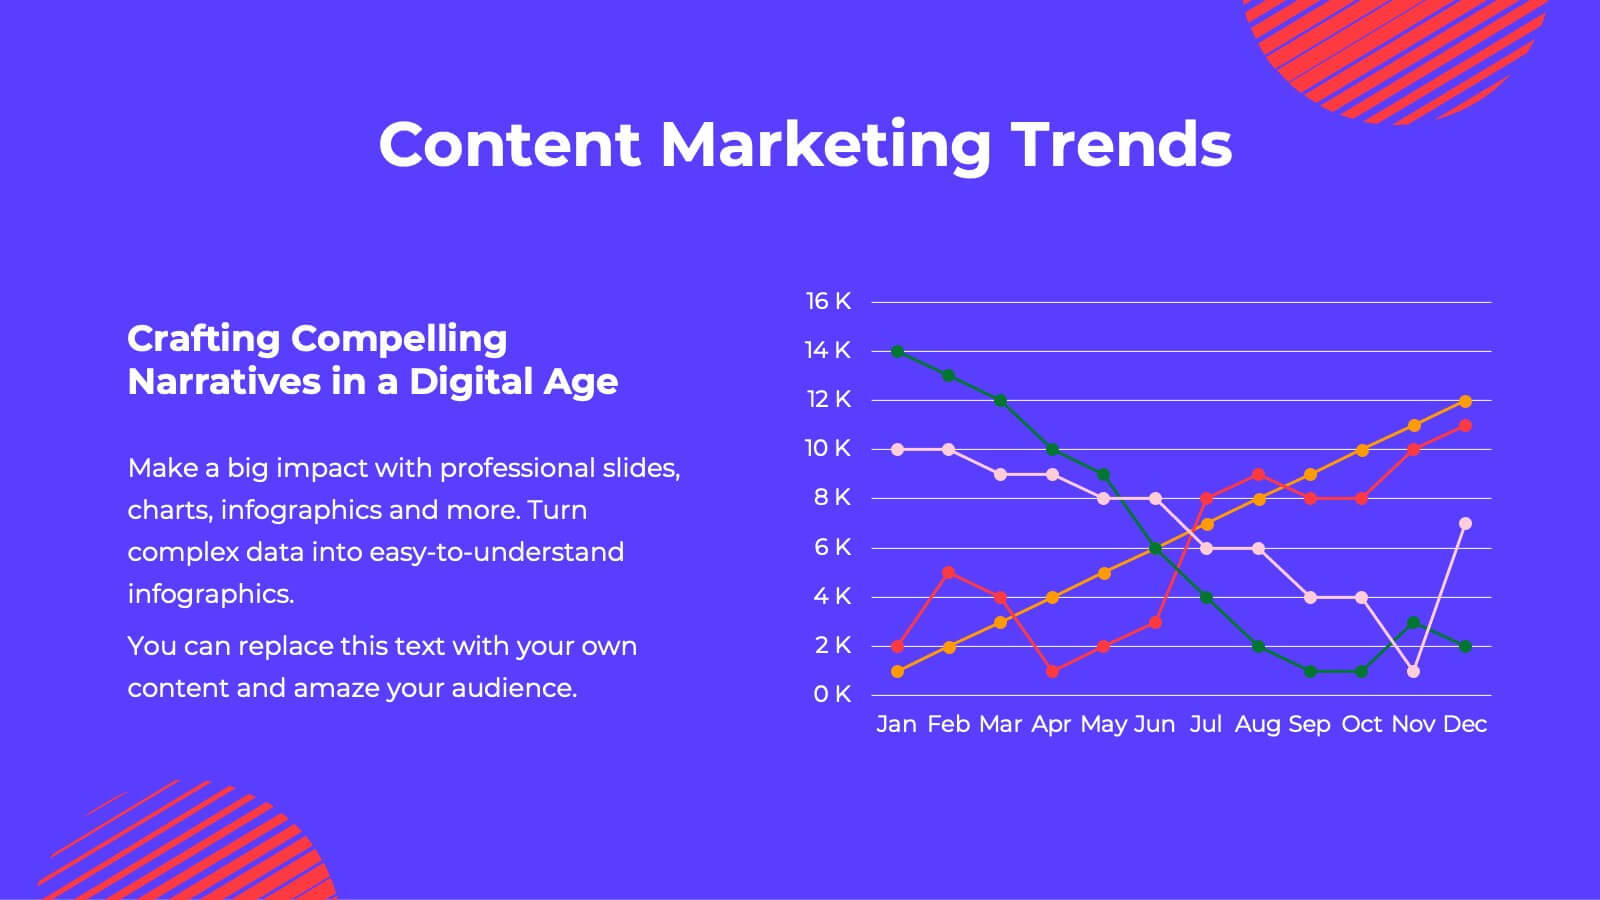
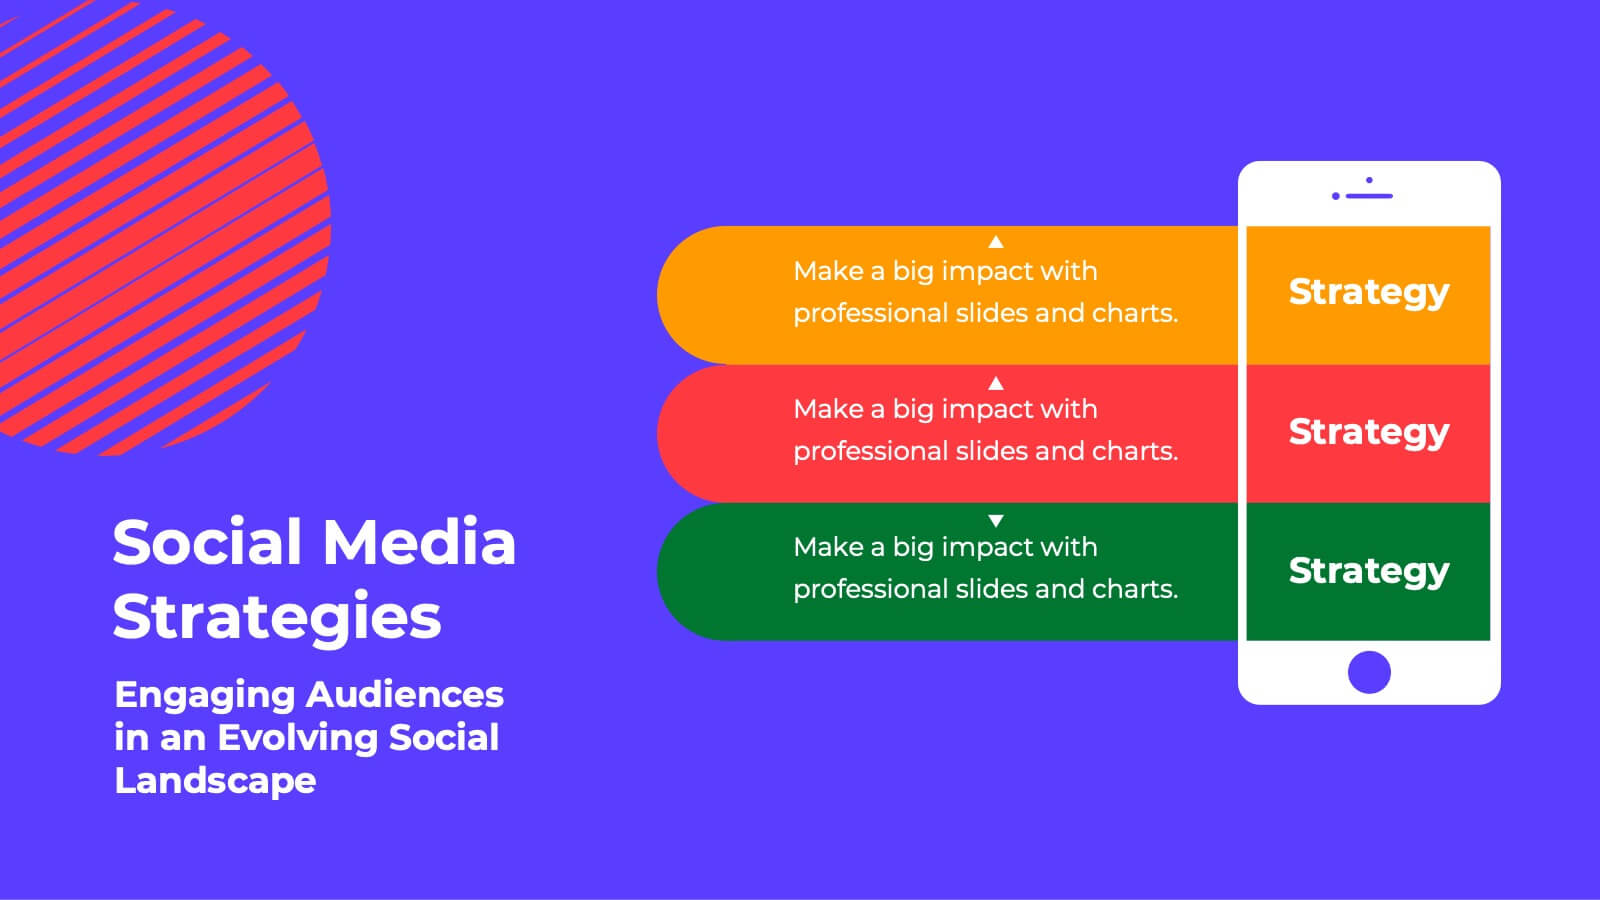
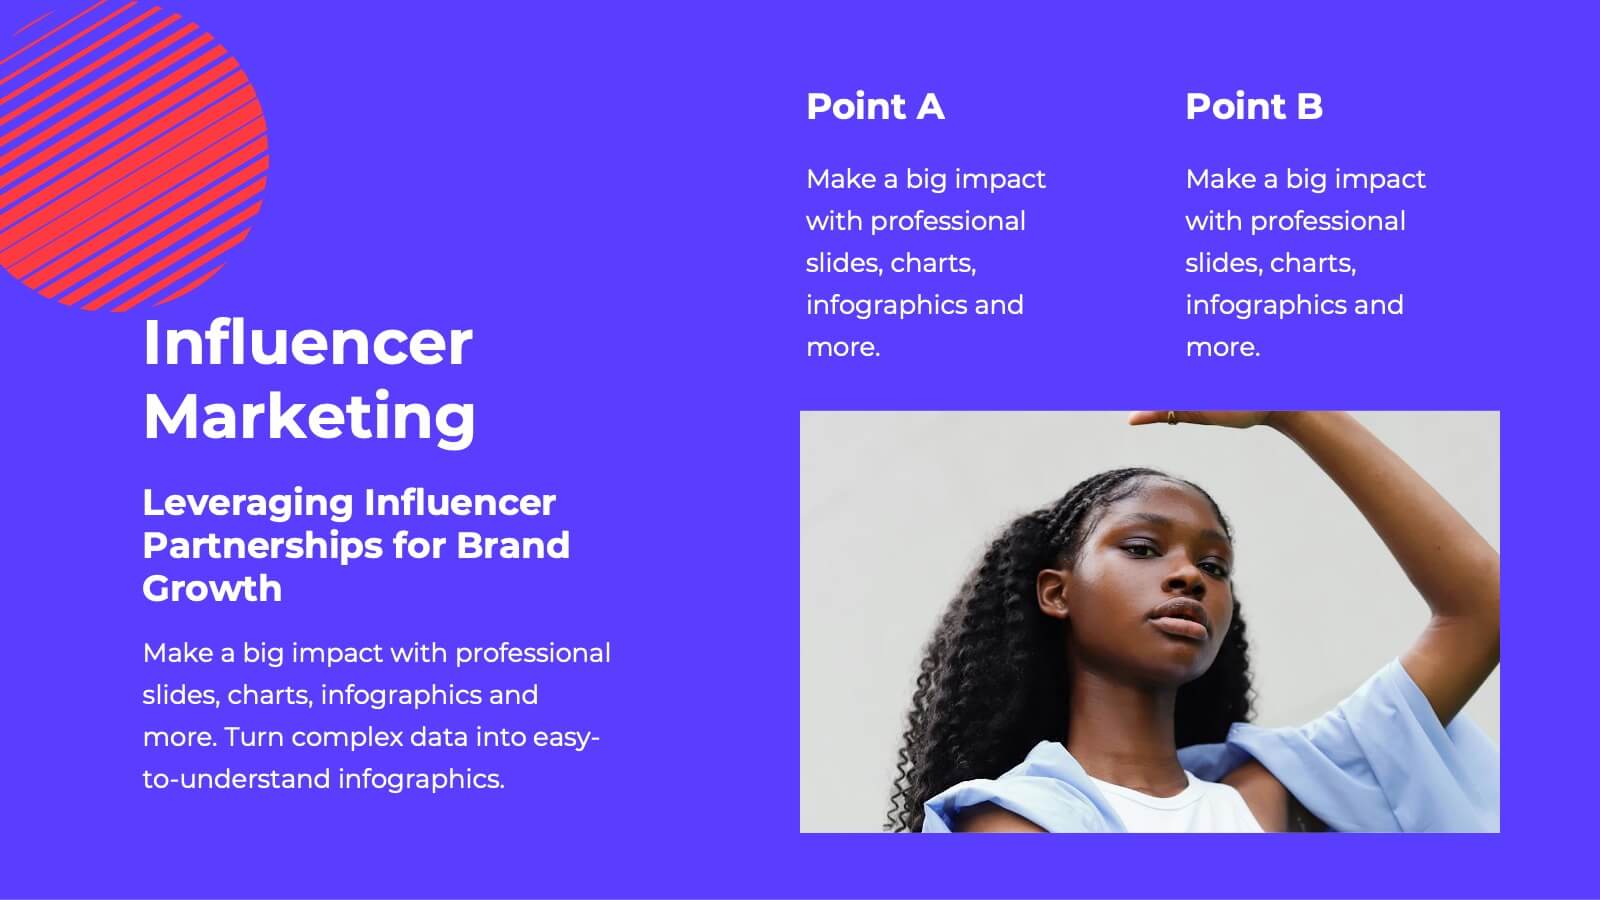
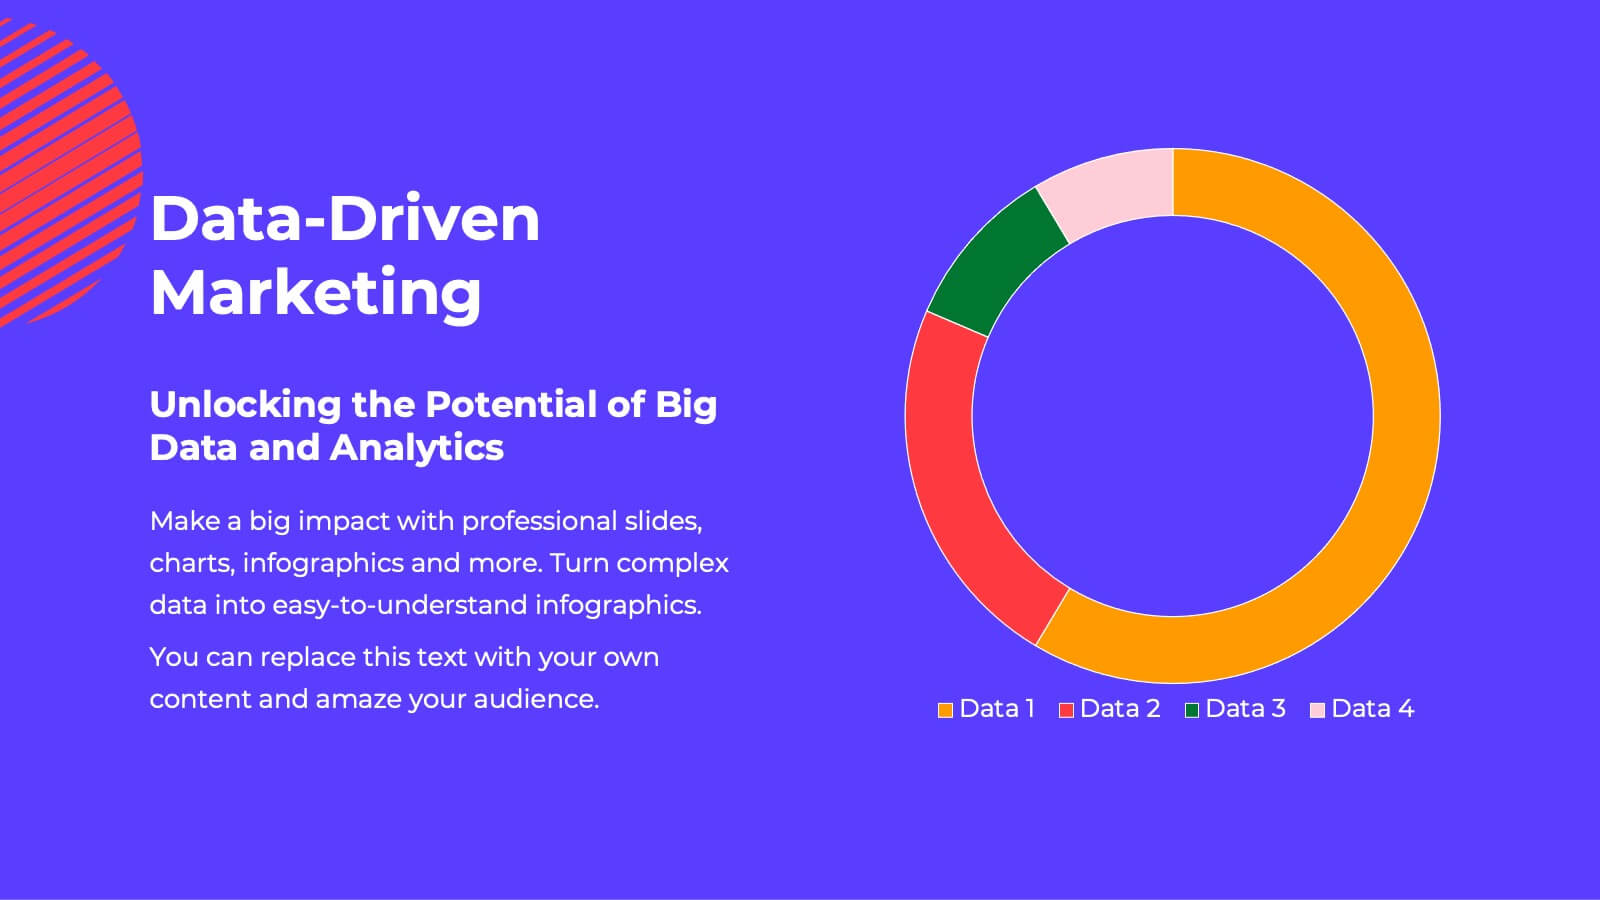
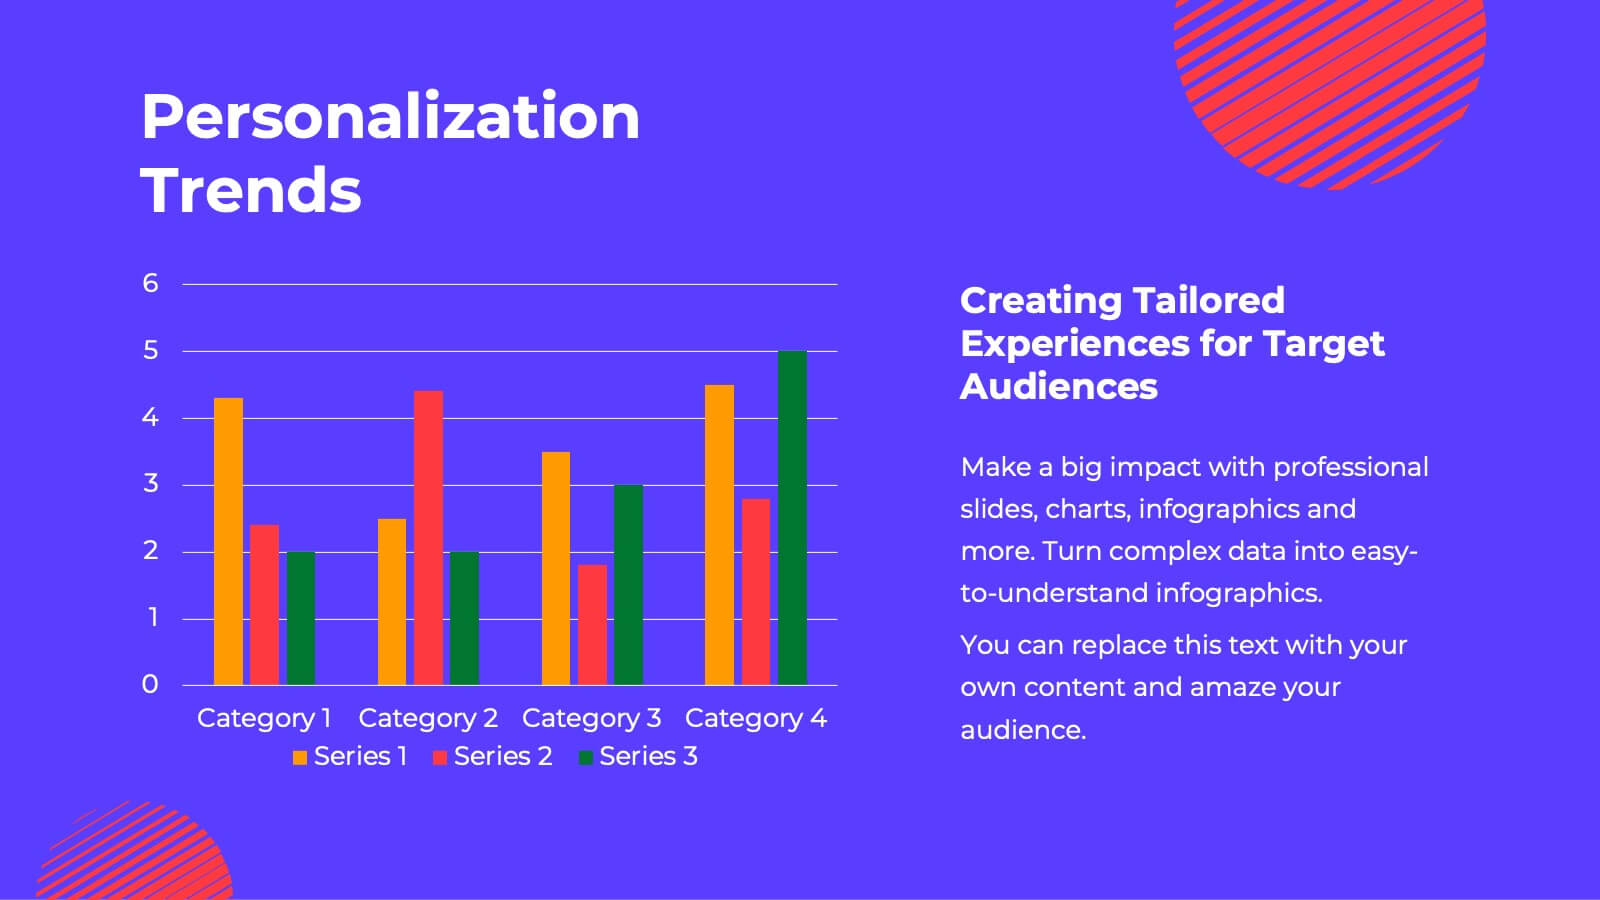
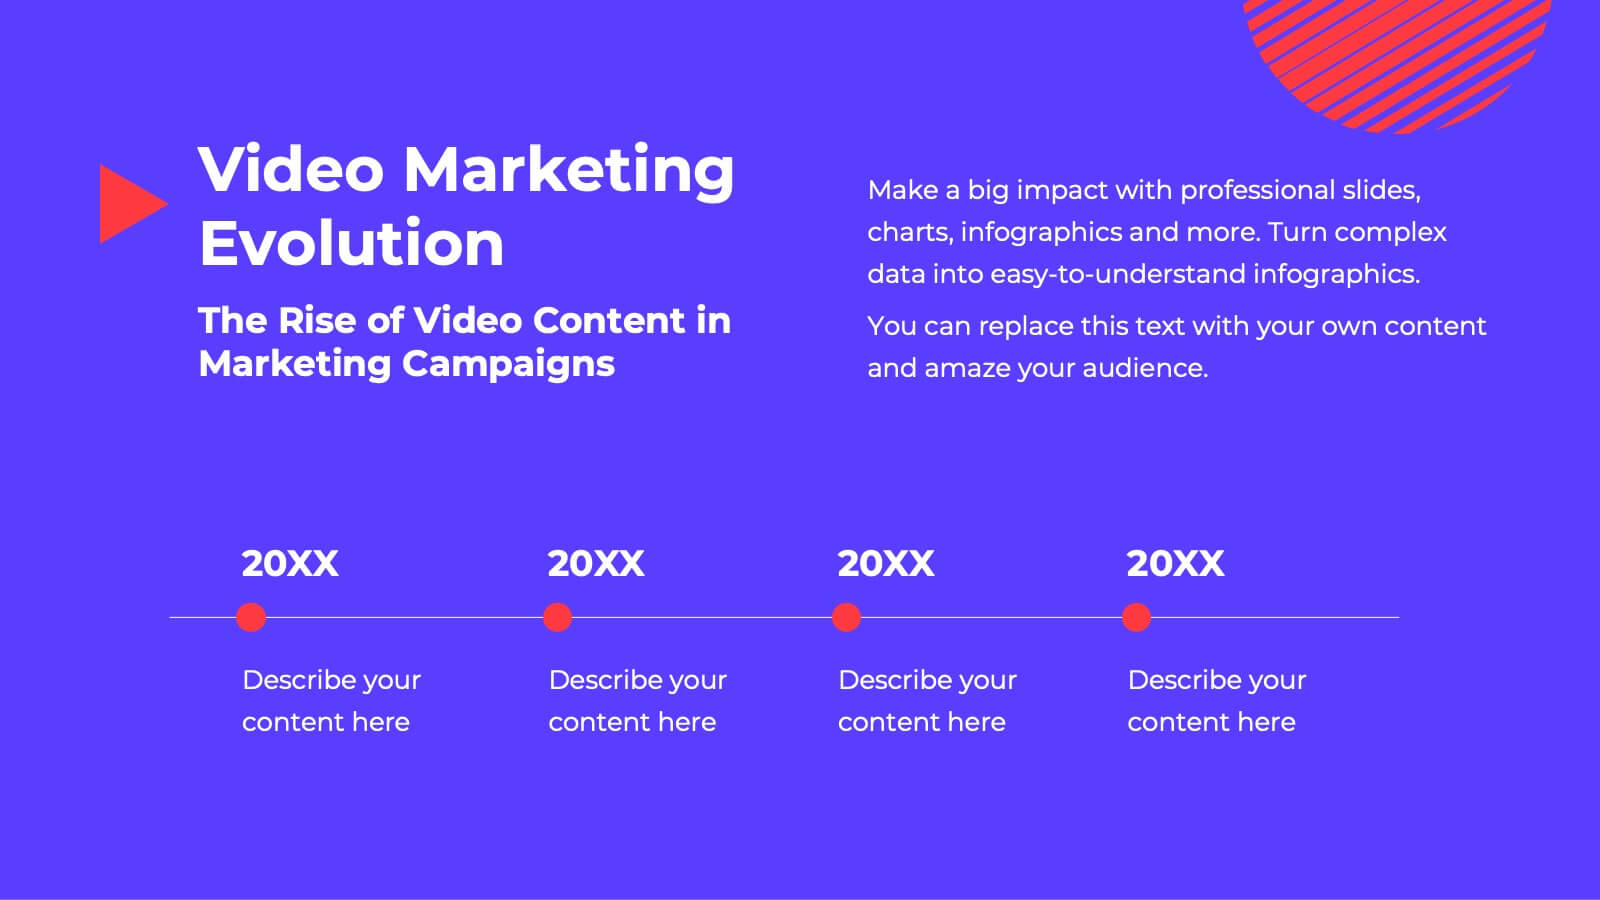
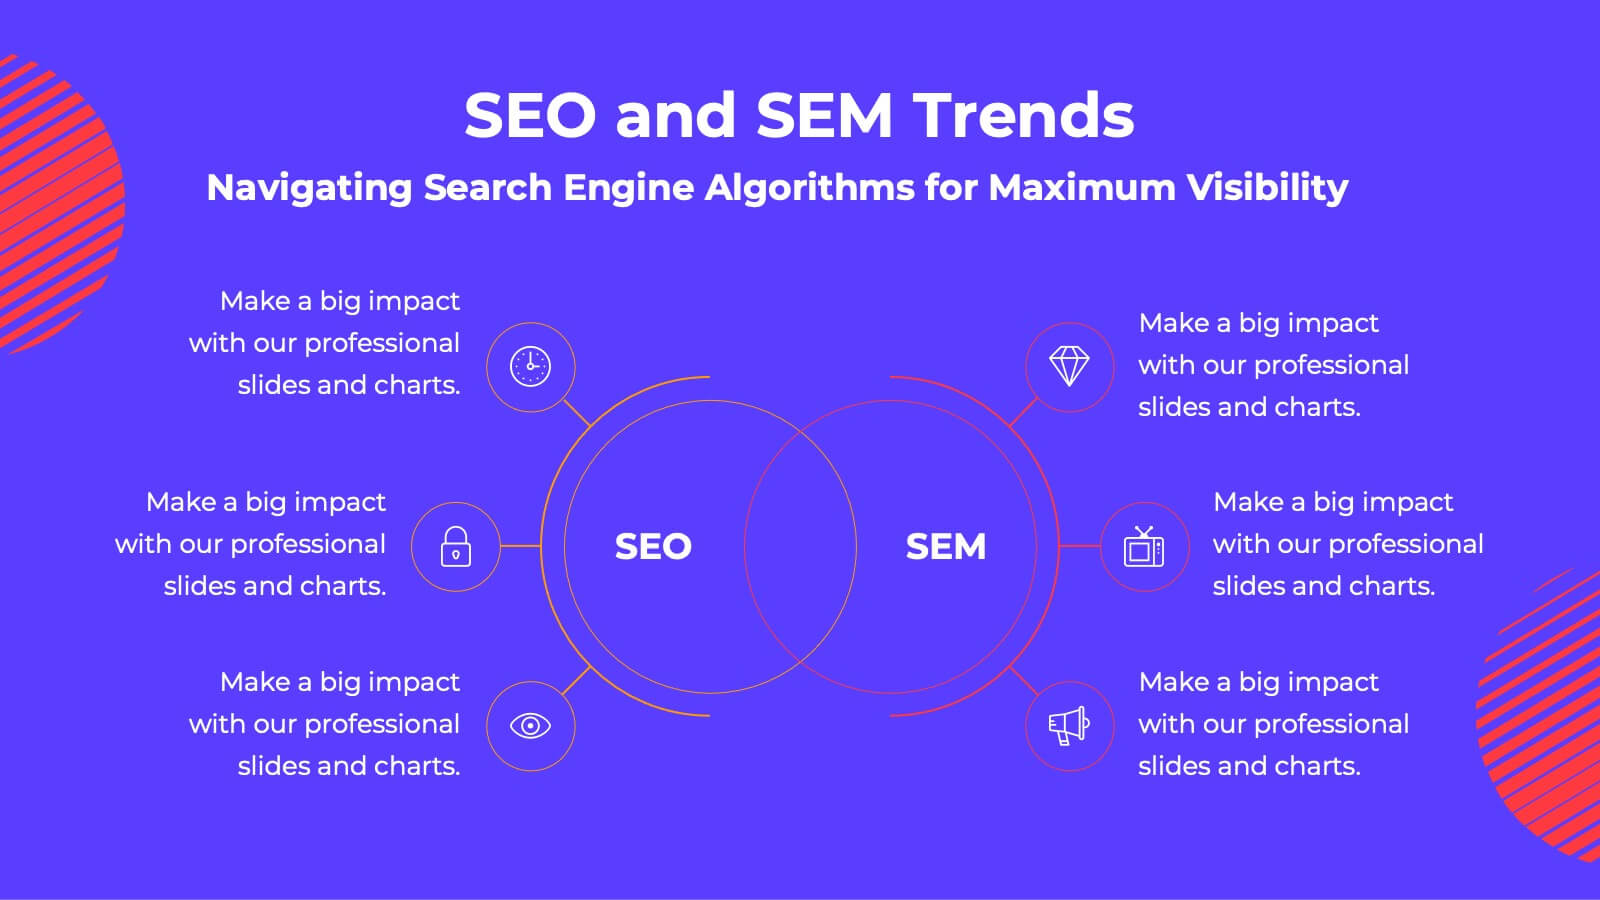
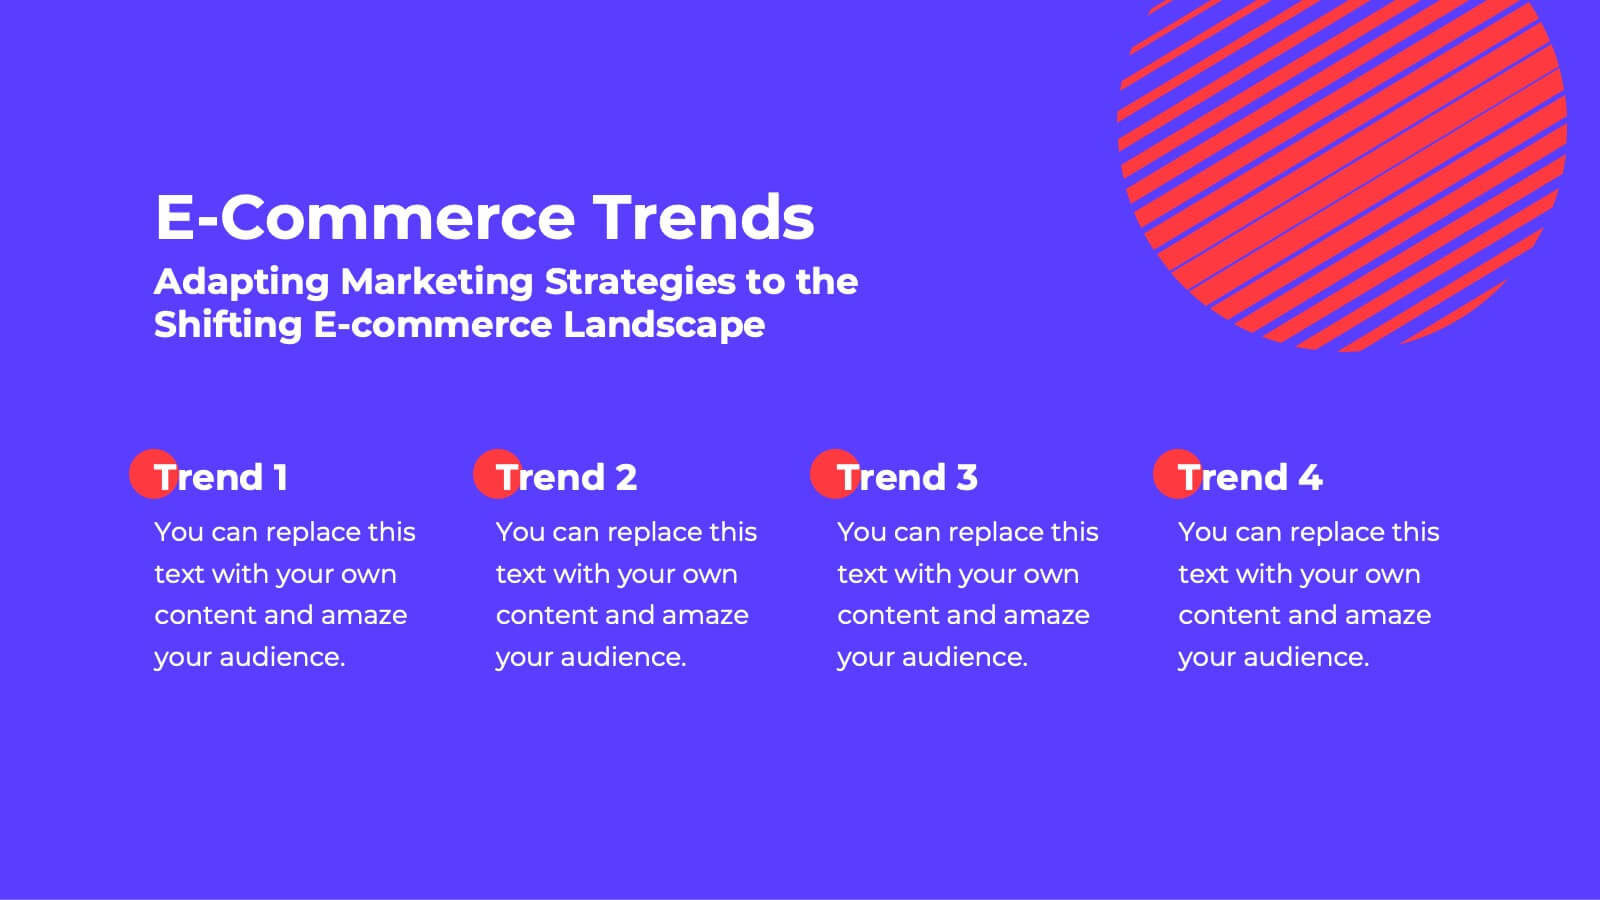
Fusion Marketing Campaign Presentation
Unleash the power of your marketing campaigns with this vibrant marketing campaign template! Dive into social media strategies, influencer marketing, data-driven insights, and more. Perfect for presenting to stakeholders and team members. Fully customizable and compatible with PowerPoint, Keynote, and Google Slides.


2 diapositivas
Digital Mockup Screens for Apps Presentation
Showcase your app in action with the Digital Mockup Screens for Apps Presentation. This bold and modern slide layout centers your mobile UI on colorful abstract shapes, drawing attention to your product. Ideal for startup demos, app features, or UI/UX portfolios. Fully editable in PowerPoint, Keynote, Canva, and Google Slides.


5 diapositivas
Business People Collaboration Overview Presentation
Showcase team dynamics with the Business People Collaboration Overview Presentation. This template uses a clean hexagon layout to highlight roles, responsibilities, or partnerships between individuals or departments. Ideal for collaboration strategies, organizational structures, or cross-functional workflows. Fully editable in PowerPoint, Canva, and Google Slides.


5 diapositivas
Oil Industry Production Infographic
The Oil Industry is an essential component of the global economy, as oil and natural gases are primary sources of energy. This vertical infographic template is a visual representation of data related to the extraction and production of oil and its byproducts. Use this to include statistics and key facts about oil production, including the top oil-producing countries, and the different methods used for extracting and processing oil. This infographic is compatible with PowerPoint, Keynote, and Google Slides, and can be easily edited to match your branding and style to help you effectively communicate your message.


6 diapositivas
Supply Chain Management Infographics
Elevate your presentation with our Supply Chain Management template, designed for clarity and impact. The slides are a blend of professional and engaging visuals, perfect for showcasing the intricacies of supply chain operations. Ideal for professionals and educators, they simplify complex logistics concepts into understandable visuals. The design is clean, making it perfect for business presentations that need to convey detailed processes and strategies effectively. With these slides, you're equipped to deliver a powerful message about the importance of streamlined supply chain management.


6 diapositivas
Cryptocurrency Exchange Infographic
A cryptocurrency exchange is a platform that allows users to buy, sell, and trade cryptocurrencies. This infographic template illustrates the key aspects of cryptocurrency exchanges, providing an overview of how these platforms work, their benefits, and the steps involved in trading cryptocurrencies. This infographic aims to educate and inform individuals about cryptocurrency exchanges and make the process of trading digital assets more accessible. This template aims to simplify complex concepts and provide a clear overview of the steps involved in using cryptocurrency exchanges, encouraging more people to participate in the growing digital asset market.


6 diapositivas
Corporate Governance Strategy
Present your company’s leadership structure with clarity using this corporate governance strategy slide. This hexagonal framework highlights key areas such as vision, objectives, and strategy—surrounded by six supporting pillars. Each section includes editable icons and text for board responsibilities, ethics, oversight, and more. Ideal for executive updates, policy reviews, and stakeholder reports. Fully customizable in PowerPoint, Keynote, and Google Slides.


7 diapositivas
Venn Diagram Structure Infographic
Illuminate intersections and highlight distinctions with our Venn diagram infographic. Cast on a pristine white canvas, the design radiates with harmonious hues of pastel purple, calming blue, passionate red, and rejuvenating green, emphasizing the areas of overlap and distinct zones in a structured manner. Bolstered with infographics, representative icons, and adjustable image placeholders, this template is an epitome of clarity in showcasing relational logic among sets. Configured for Powerpoint, Keynote, or Google Slides. An ally for data analysts, statisticians, educators, or anyone seeking to depict intertwined relationships in a clear, visual format.


7 diapositivas
Frequently Asked Questions (FAQ)
Answer key concerns clearly with this Frequently Asked Questions (FAQ) infographic template. Featuring a clean question mark-centered design with six content blocks, this layout is perfect for addressing customer queries, onboarding information, or stakeholder briefs. Fully customizable in PowerPoint, Keynote, and Google Slides.


5 diapositivas
Diabetes Treatments & Symptoms Infographics
Diabetes is a chronic medical condition that affects how the body processes glucose in the blood. There are three main types of diabetes: type 1 diabetes, type 2 diabetes, and gestational diabetes. These infographic templates are comprehensive and visually appealing tools designed to educate and create awareness about diabetes symptoms and treatment options. With its attractive design, concise information, and visually appealing graphics, this template will help individuals understand the importance of diabetes management and make informed decisions regarding their health. This template is completely customizable and compatible with Powerpoint, Keynote, and Google Slides.


26 diapositivas
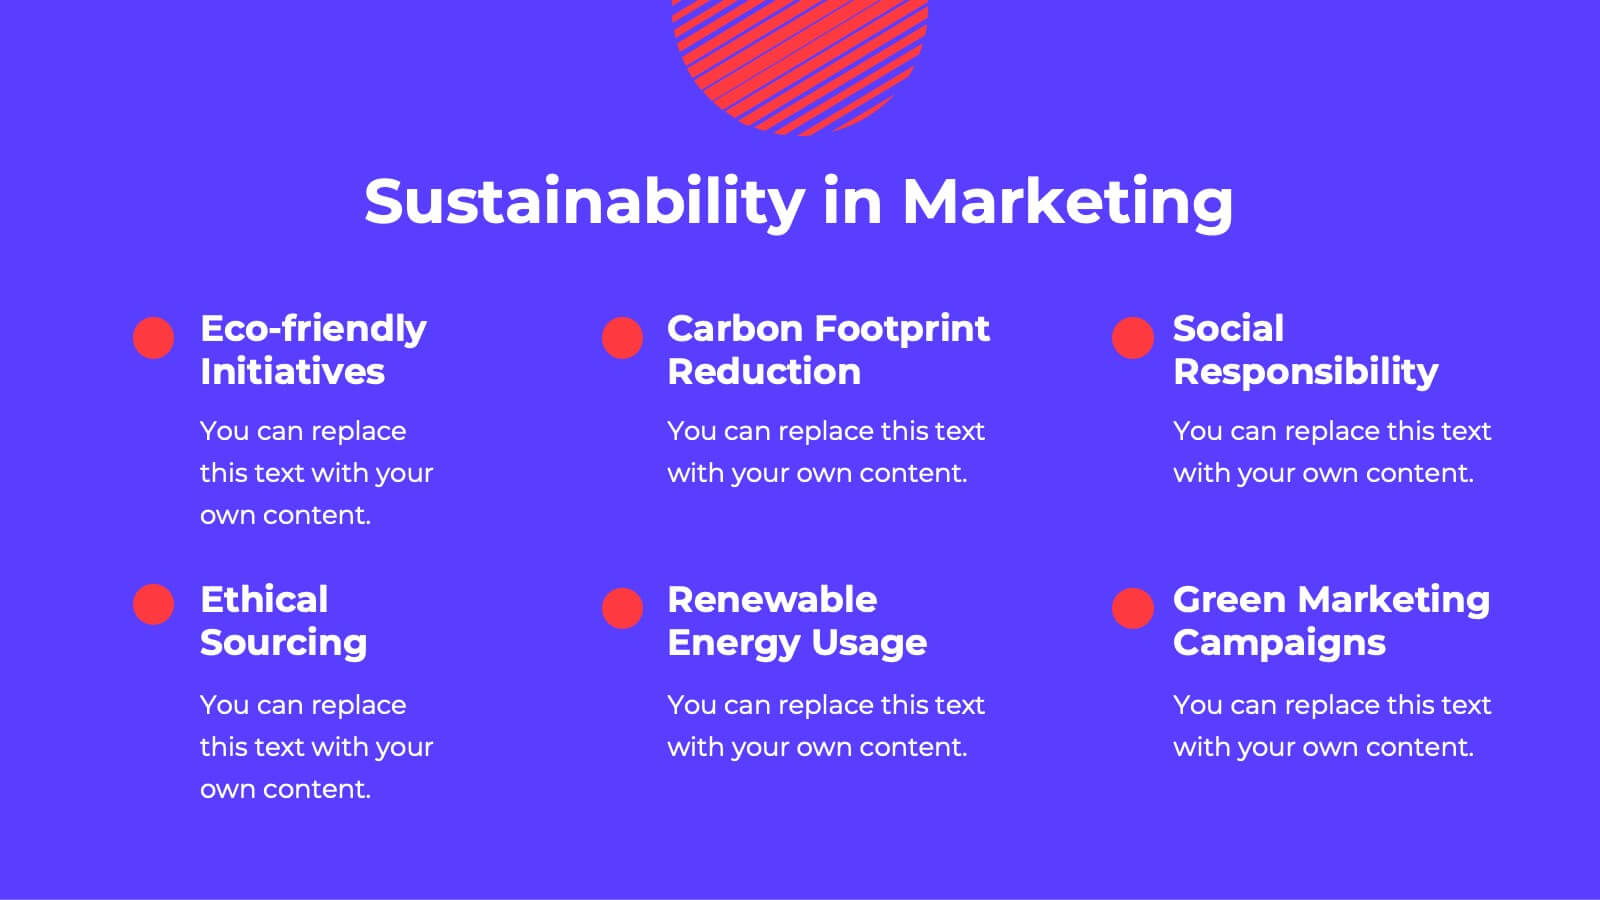
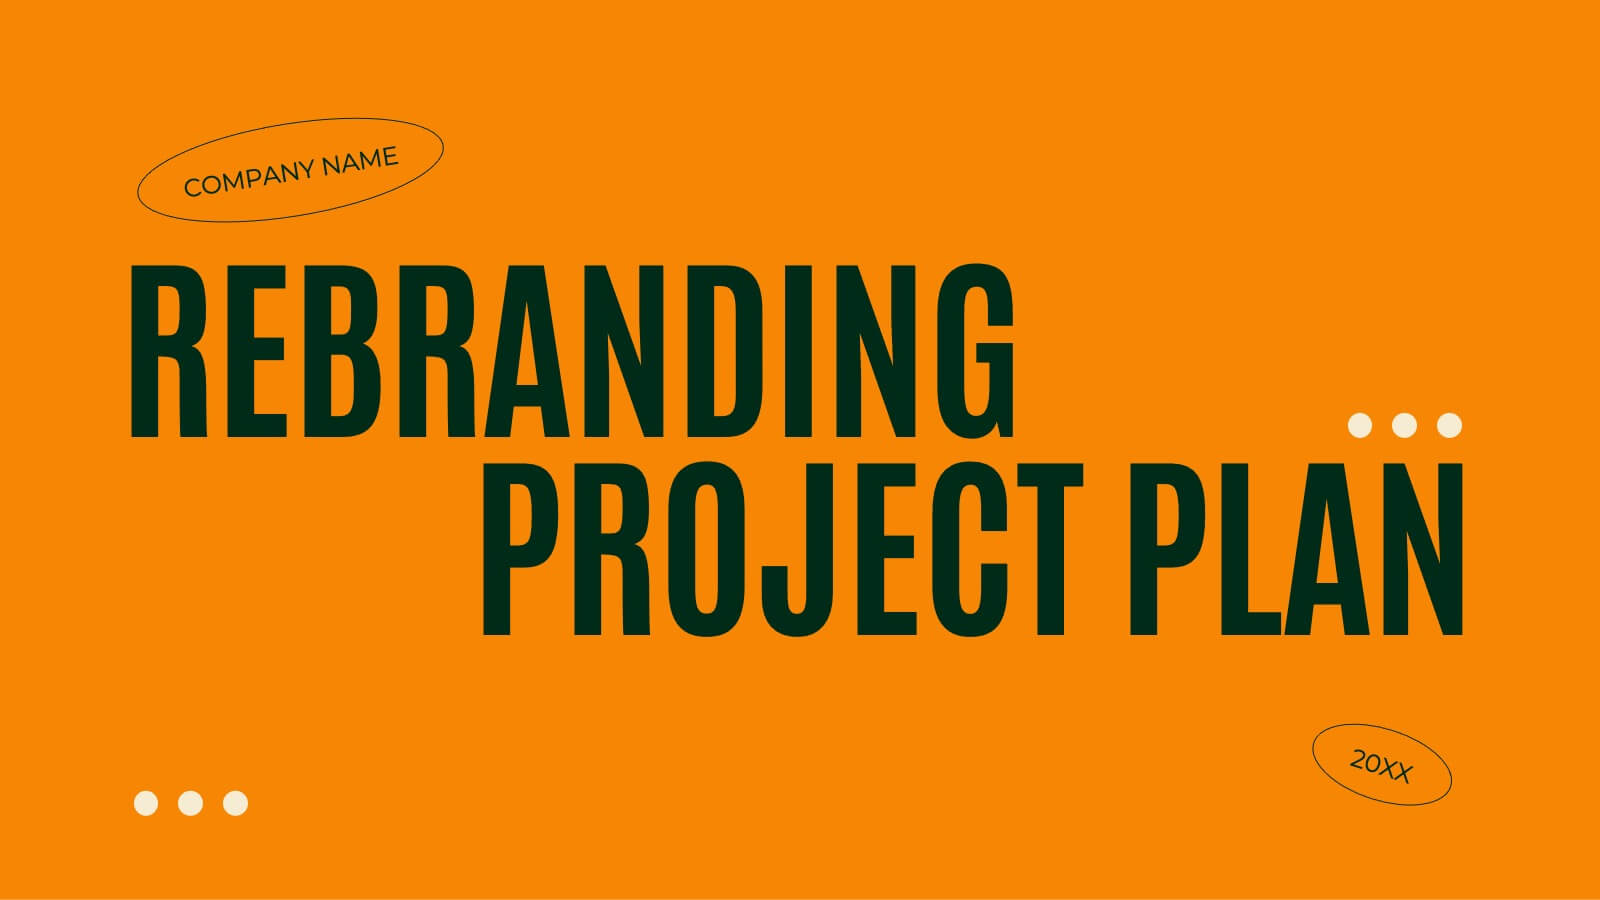
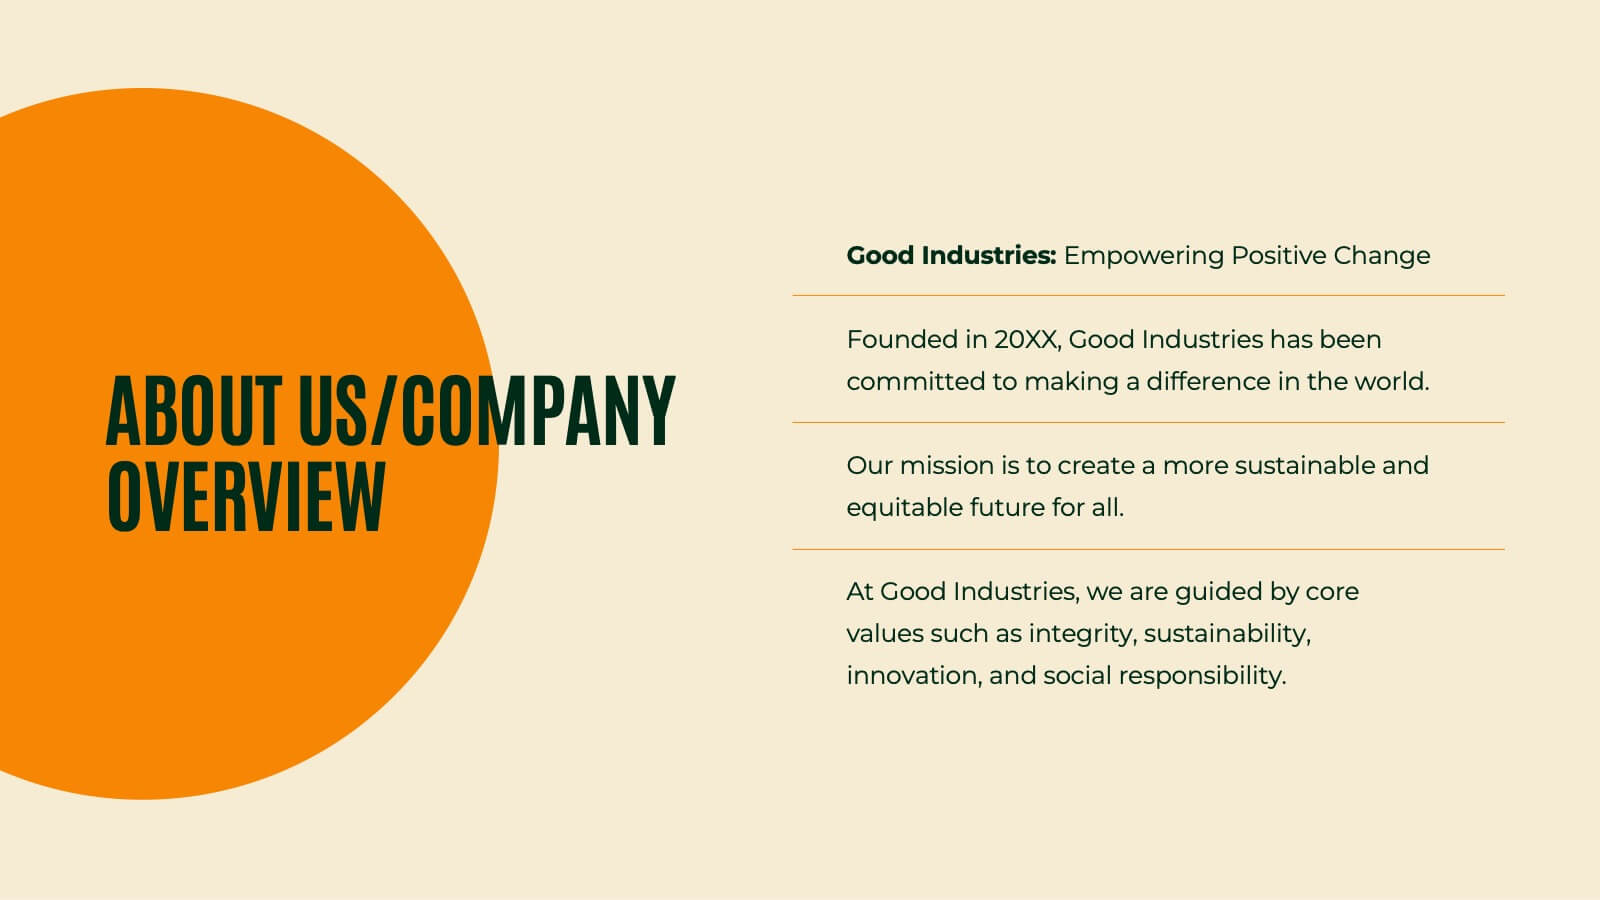
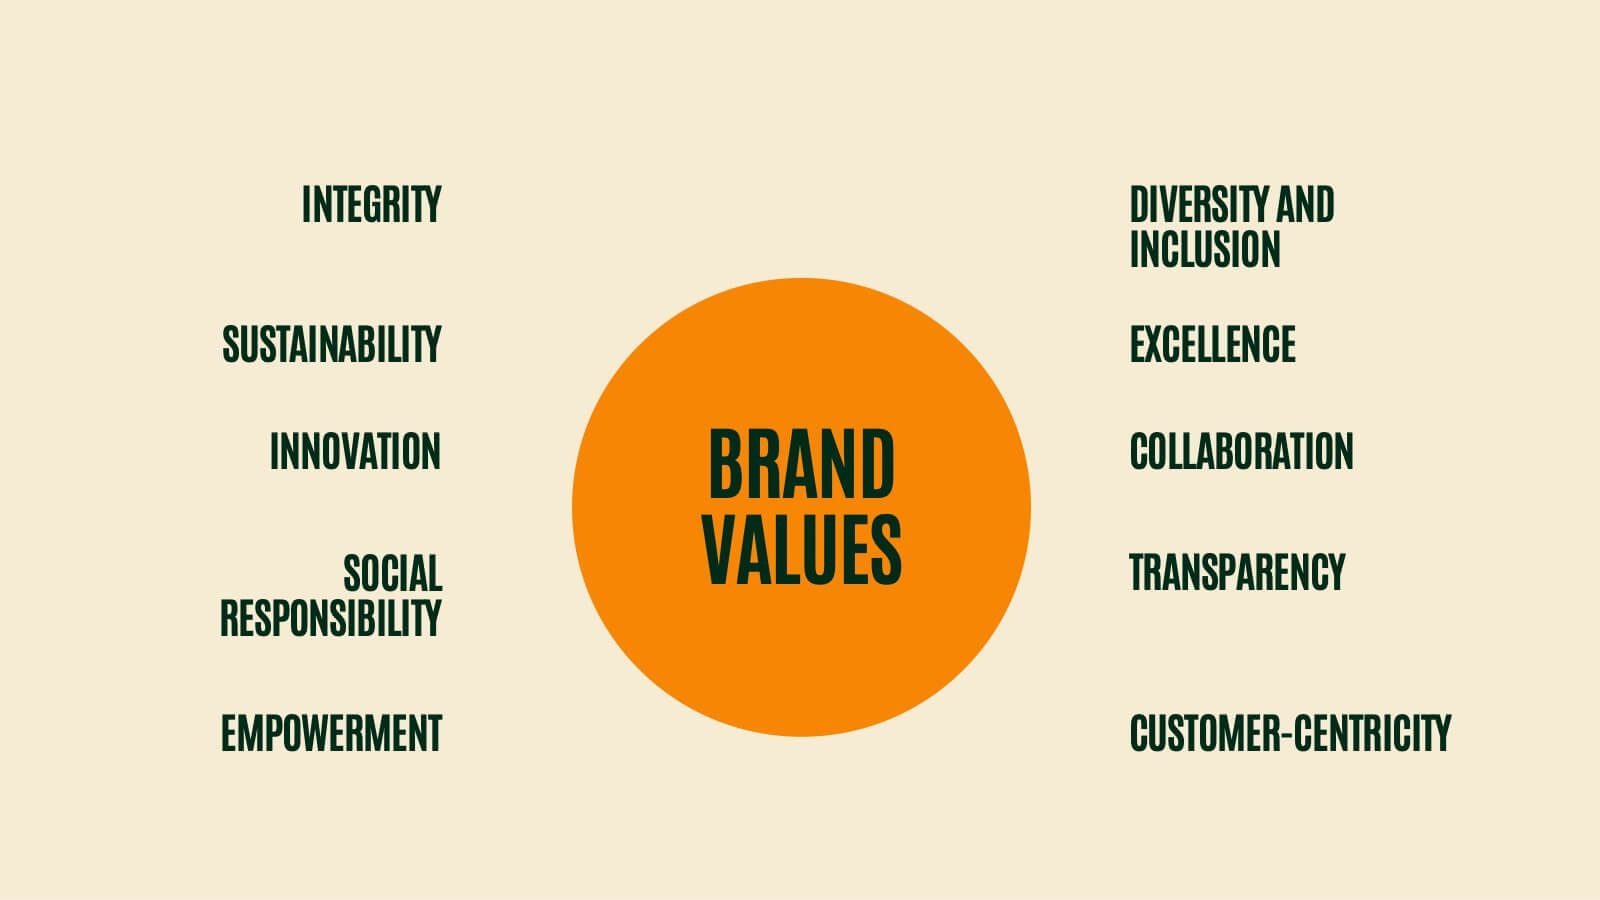
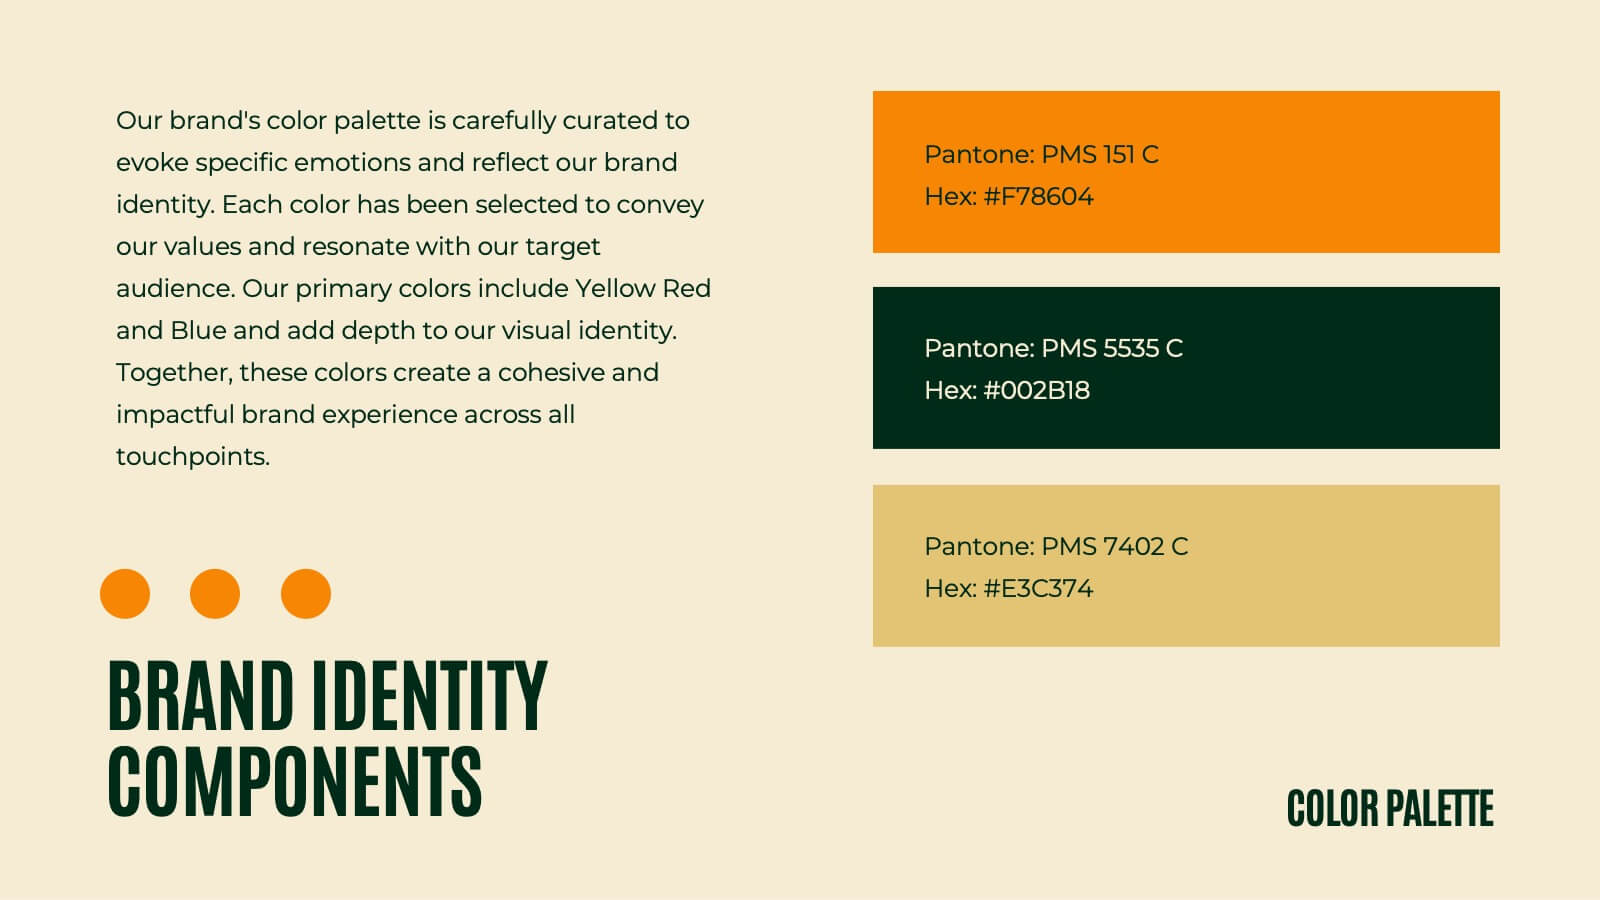
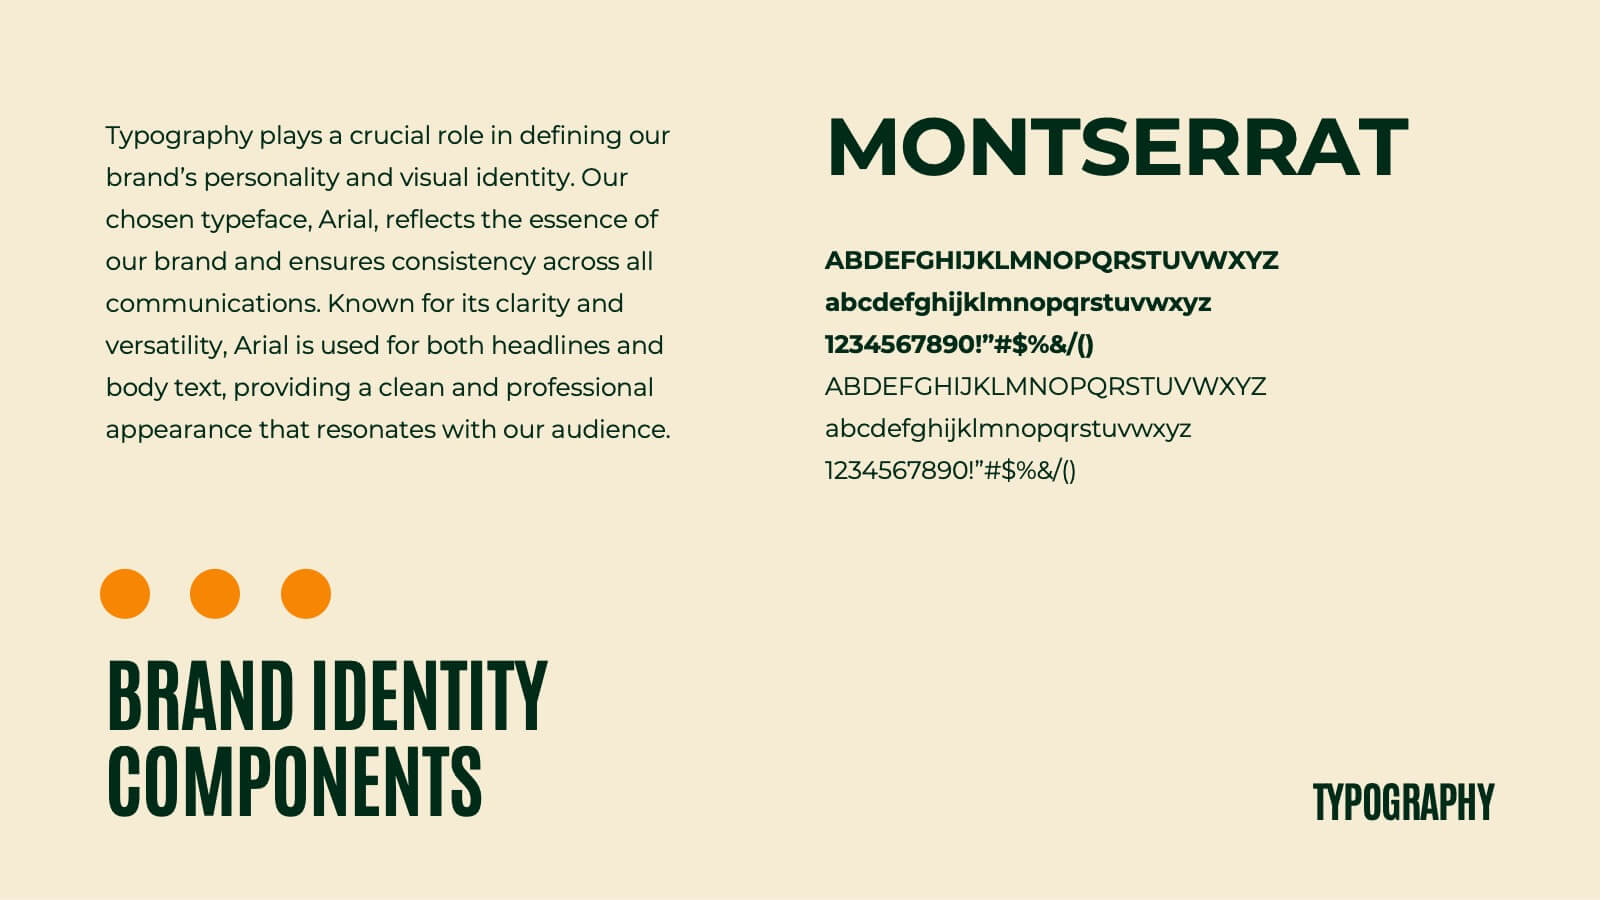
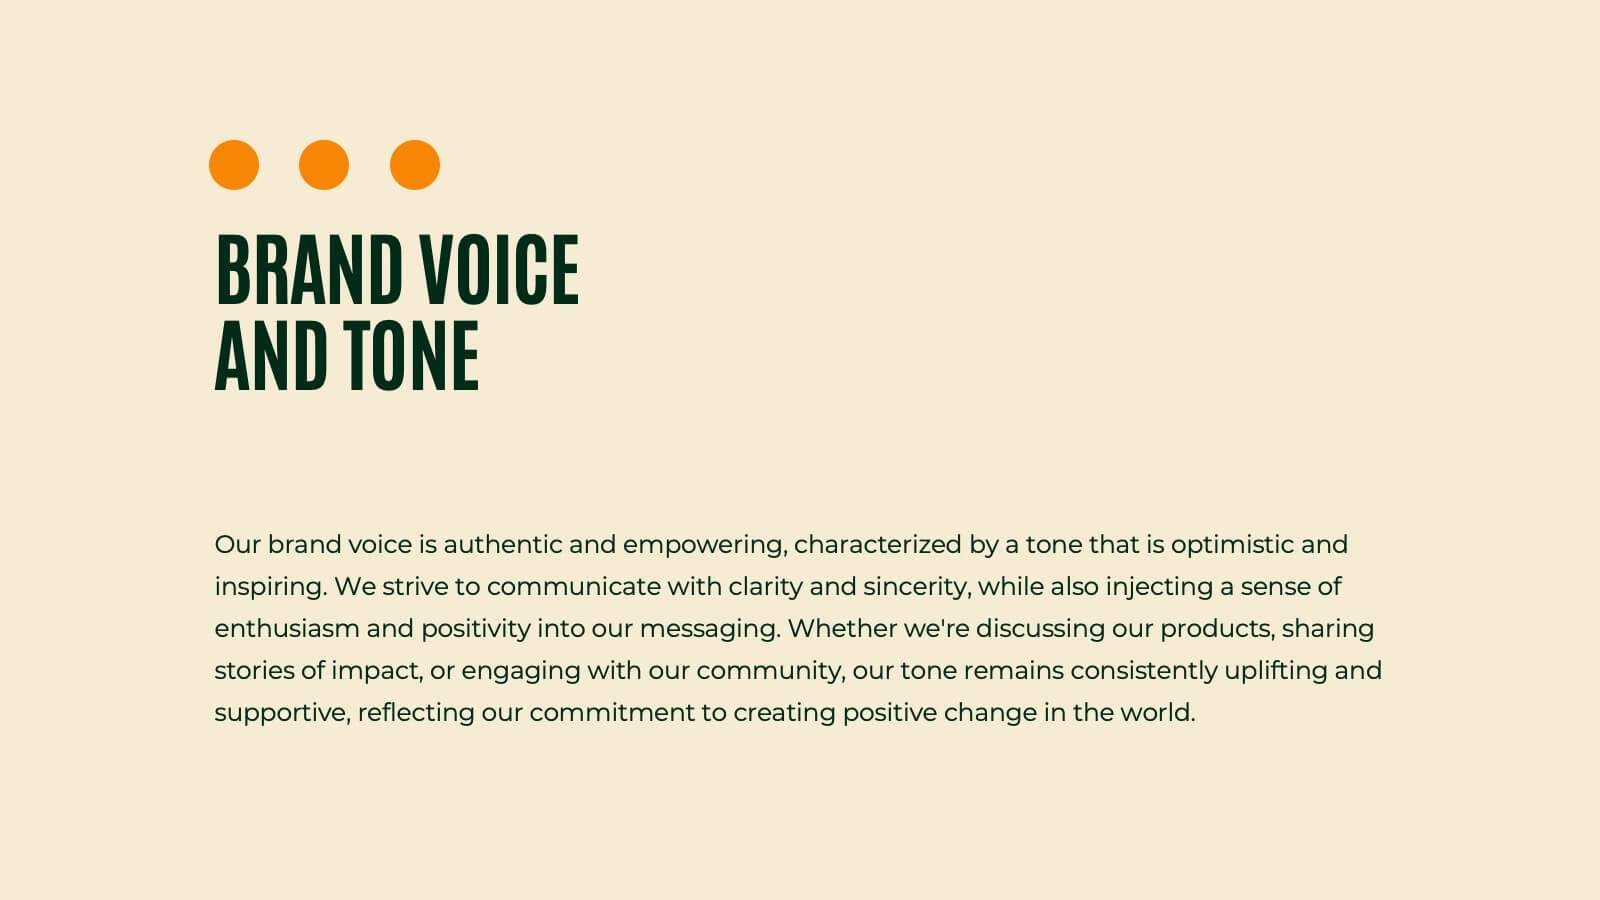
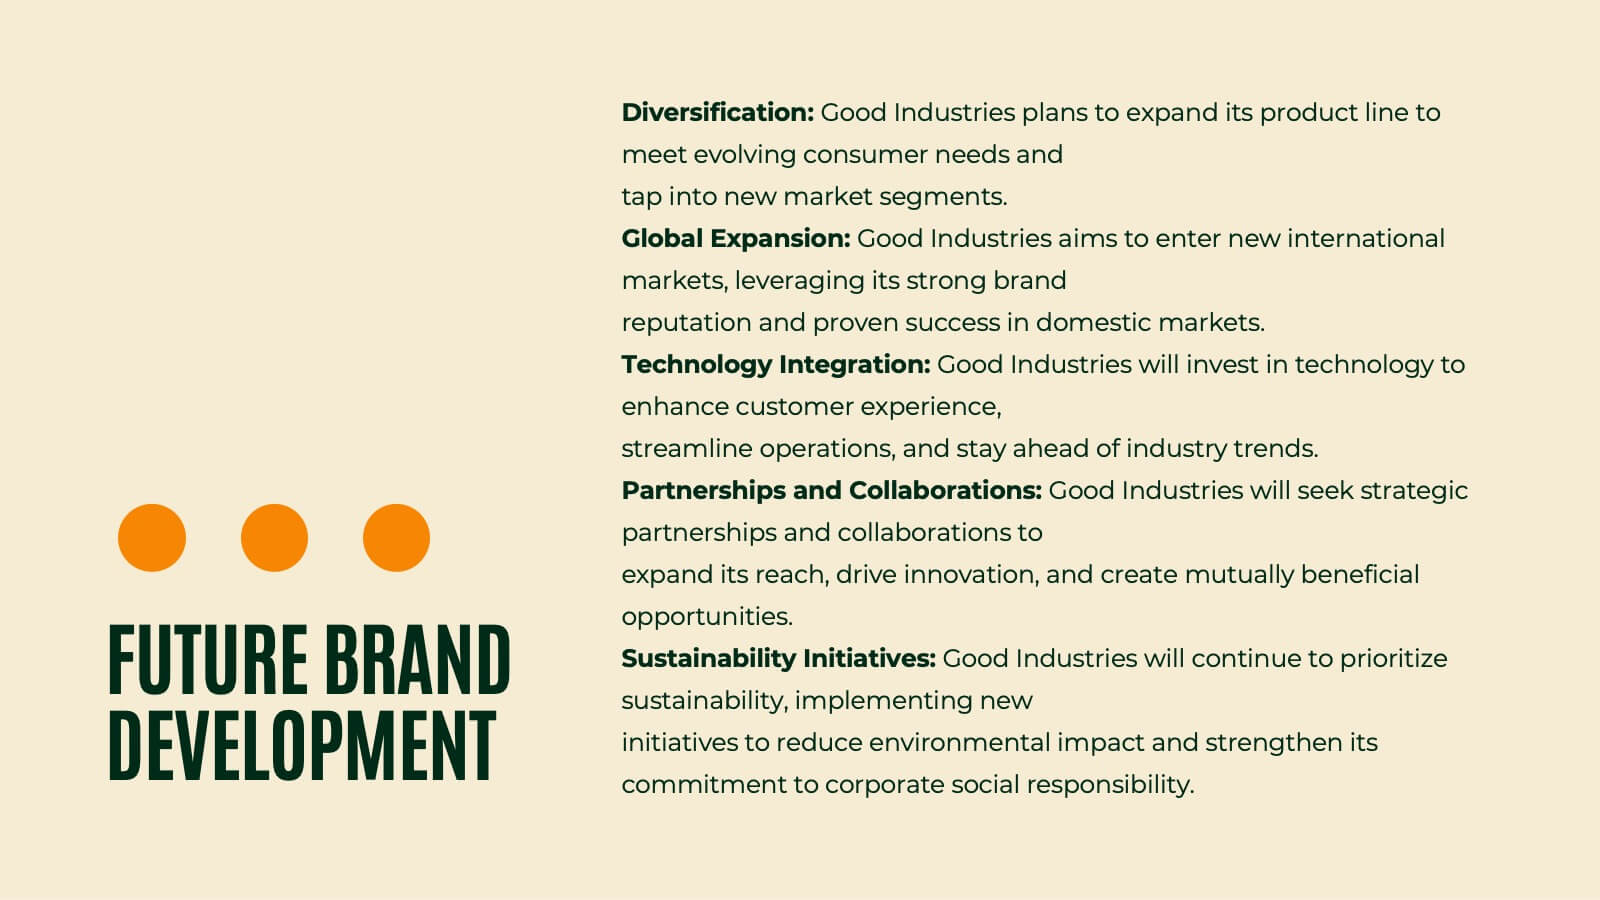
Griffin Rebranding Project Plan Presentation
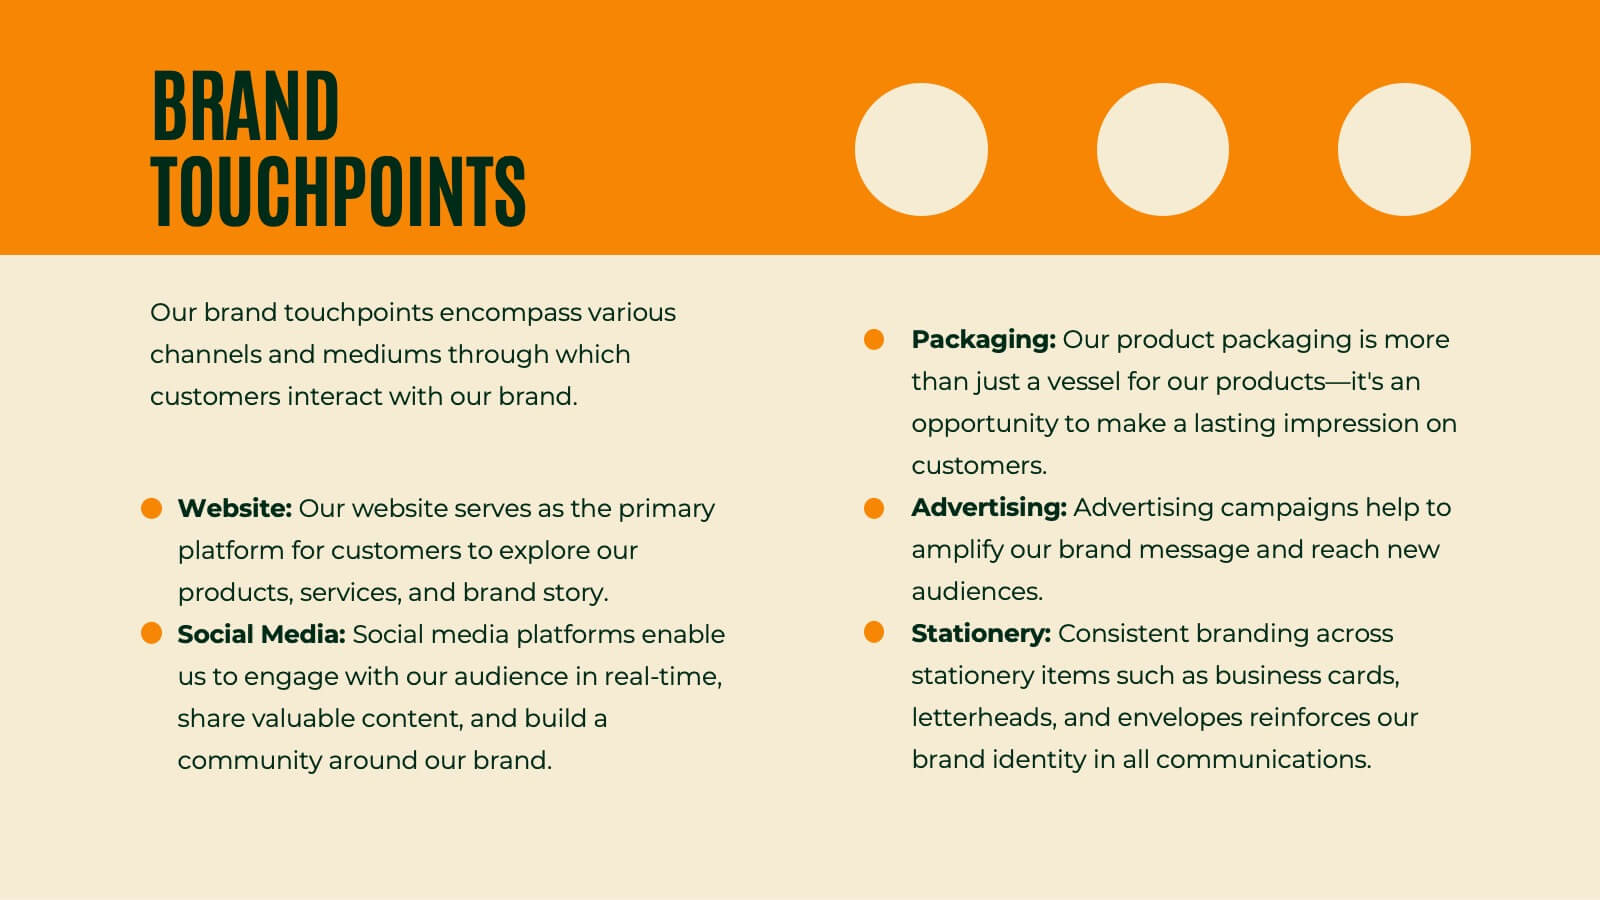
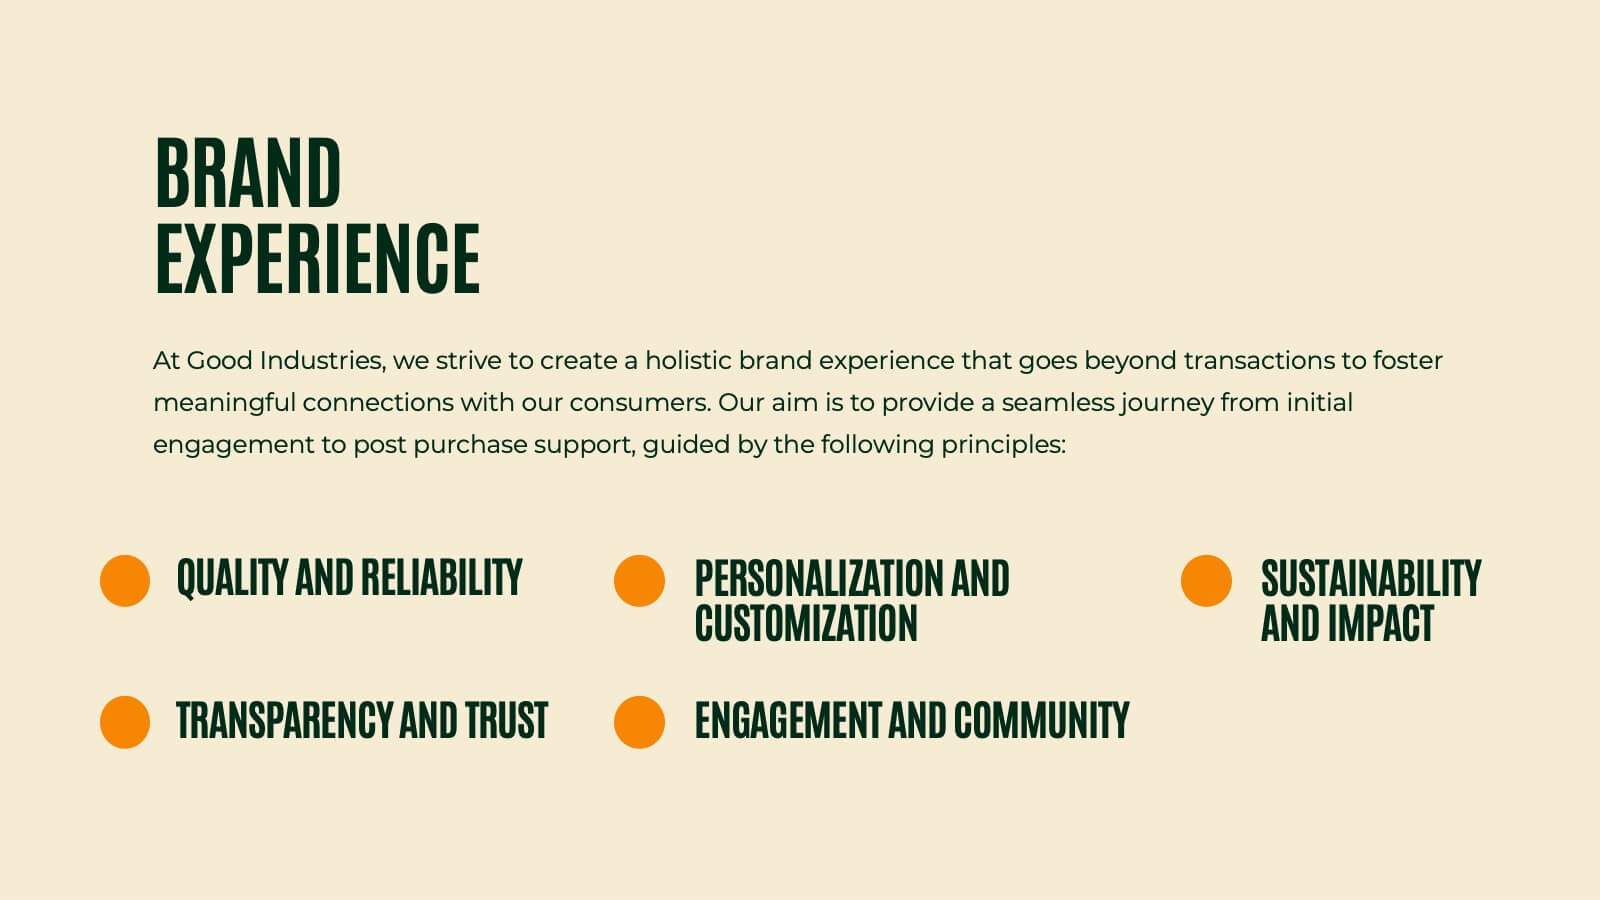
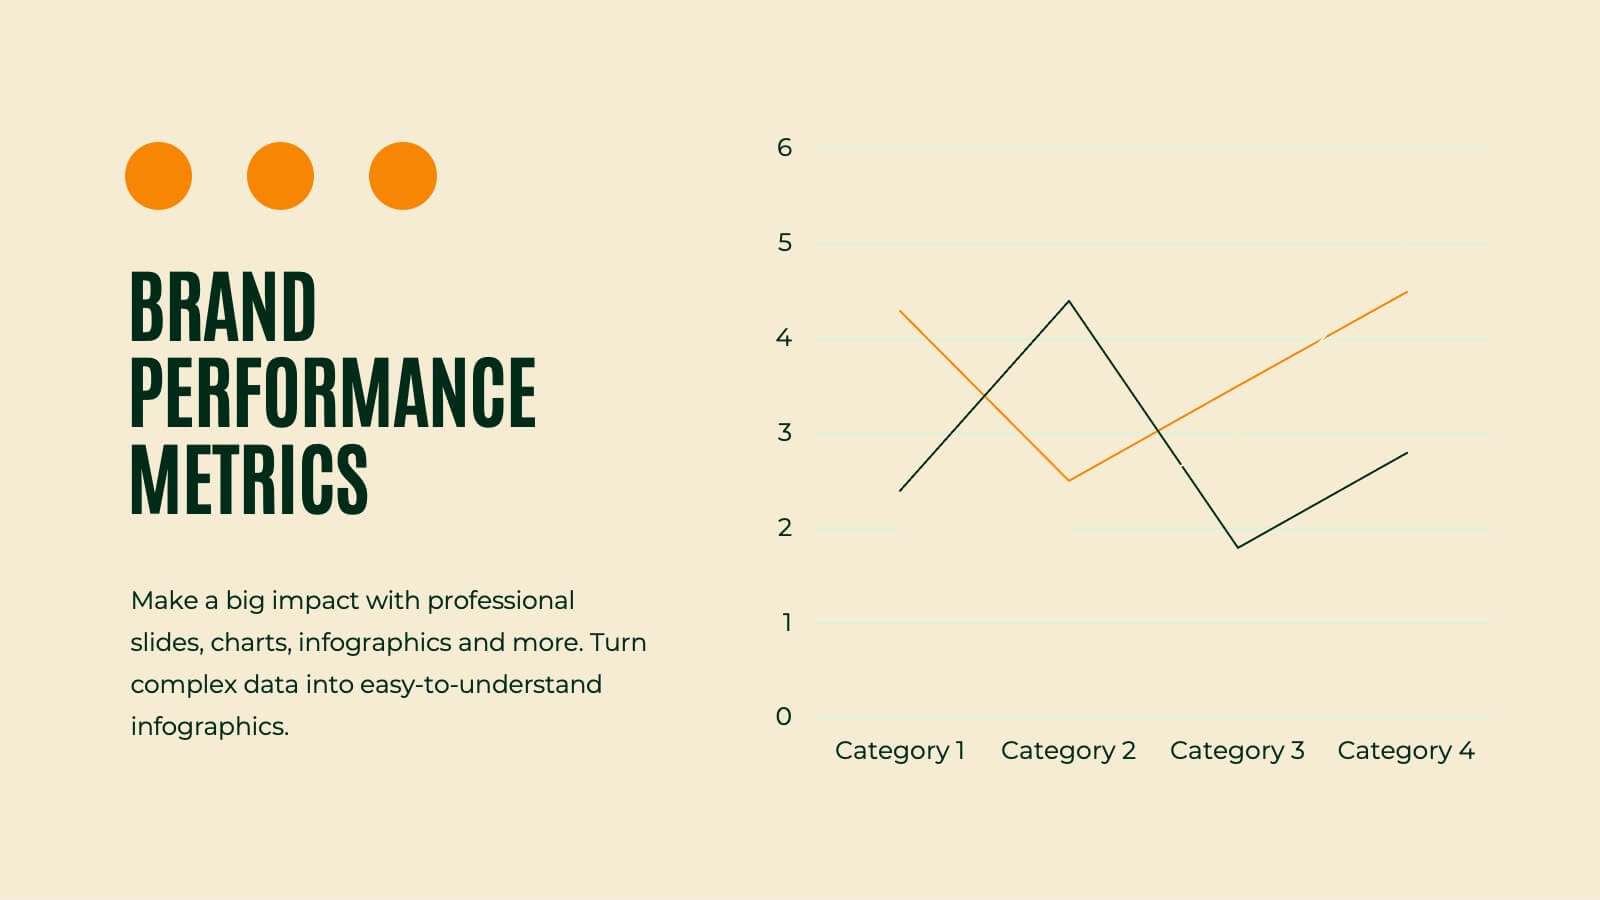
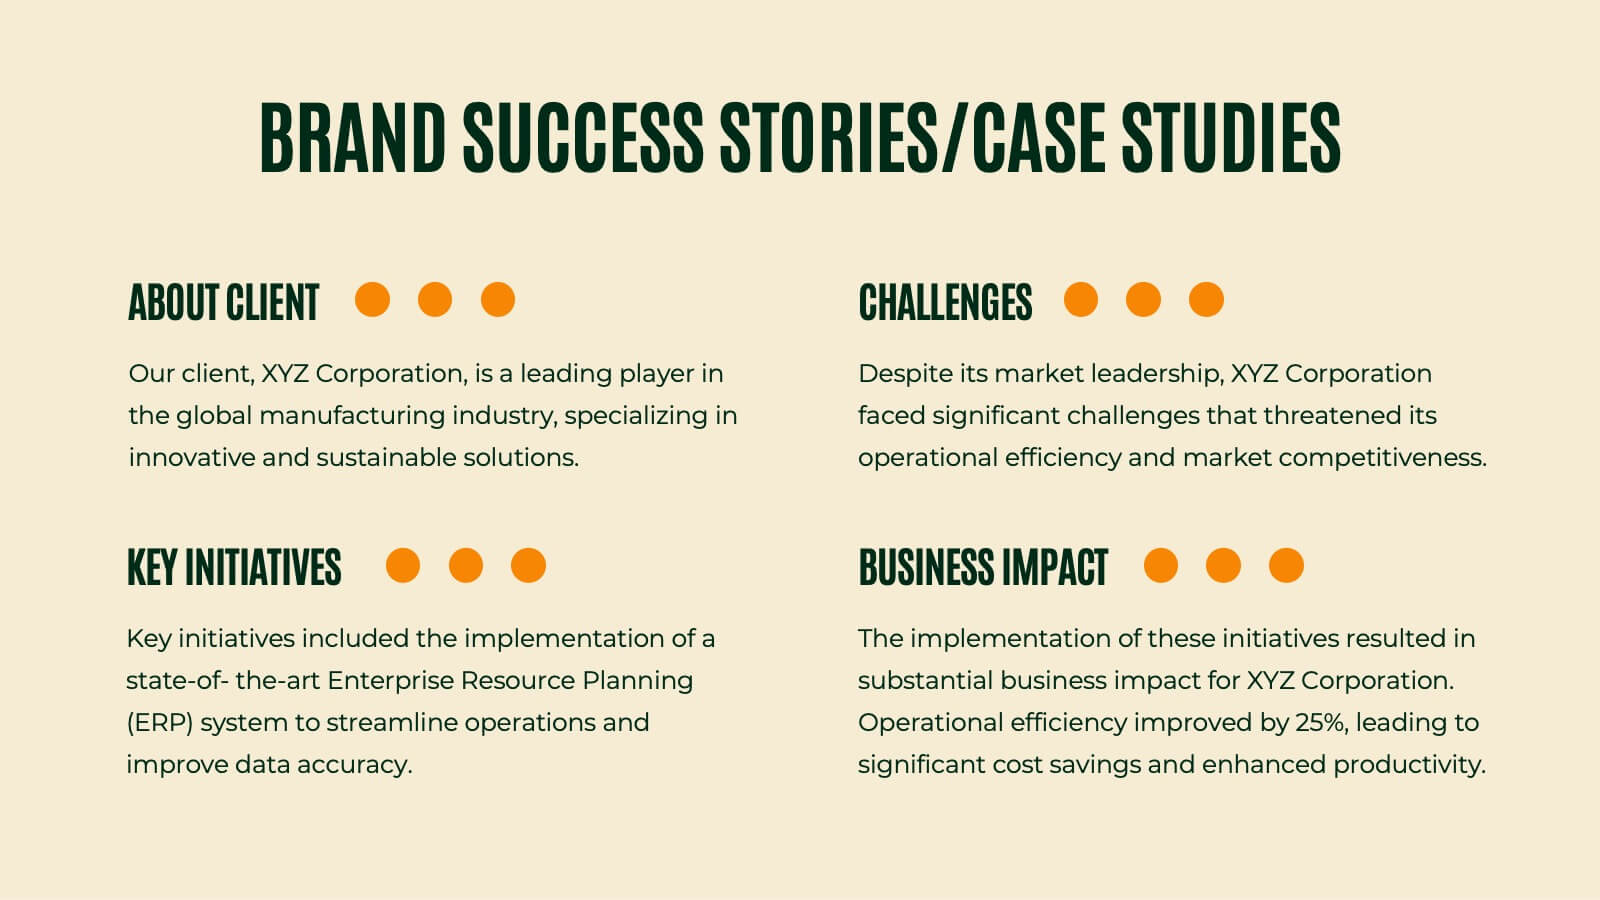
Unleash the power of branding with this vibrant presentation template! This tool guides you through essential brand elements like identity, voice, and strategy. Perfect for marketers and brand managers aiming to make a memorable impact. Compatible with PowerPoint, Keynote, and Google Slides, it's a must-have for any branding project.


7 diapositivas
Sports Management Infographic
Sports management involves planning, organizing, and coordinating activities related to sports and recreation. Step into the dynamic world of sports with our engaging sports management infographic. This template isn't just a game plan; it's a visual journey through the strategies, insights, and principles that drive success in the thrilling realm of sports management. Compatible with Powerpoint, Keynote, and Google Slides. Use this template to explore winning strategies, leadership insights, and the dynamics of this exciting field, and gear up to manage sports with precision, passion, and finesse.


10 diapositivas
Business Expansion and Growth Path Presentation
Illustrate your company’s strategic milestones with the Business Expansion and Growth Path Presentation. This step-by-step layout is perfect for showcasing phases of development, scaling goals, or startup growth trajectories. Fully customizable in PowerPoint, Keynote, and Google Slides—ideal for business plans, pitch decks, and strategic reviews.