Company Profile History Infographic
PowerPoint Template and Google Slides Theme


Características
Etiquetas
- Eliminar de favoritos
Plantilla de PowerPoint
1 MB
Plantilla de Google Slides
Enlace externo
Plantilla de Keynote
2 MB
Recomendar
- Eliminar de favoritos
Plantilla de PowerPoint
1 MB
Plantilla de Google Slides
Enlace externo
Plantilla de Keynote
1 MB
5 diapositivas
Project Planning and Rollout Timeline
Stay on track from kickoff to delivery with the Project Planning and Rollout Timeline Presentation. This curved roadmap layout visually guides your audience through five sequential stages—perfect for illustrating workflows, rollout phases, or go-to-market strategies. Easily customizable in PowerPoint, Keynote, and Google Slides to suit any project.
- Eliminar de favoritos
Plantilla de PowerPoint
1 MB
Plantilla de Google Slides
Enlace externo
Plantilla de Keynote
1 MB
7 diapositivas
Stock Market Forecast Infographic Presentation
Introducing our brand new stock market infographic presentation template, the perfect tool for your next school project, classroom presentation or business adventure! Compatible with Powerpoint, Keynote, and Google Slides, our template is easy to use and customize to your liking. Our template features a fun and engaging color scheme, along with Infographics and editable text that make it easy to add your own personal touch. Whether you're presenting data or forecasting information, our template will help you stand out and make an impression on your audience. With our stock market infographic presentation, you can showcase your knowledge and impress your classmates and clients with your presentation skills.
- Eliminar de favoritos
Plantilla de PowerPoint
1 MB
Plantilla de Google Slides
Enlace externo
Plantilla de Keynote
1 MB
2 diapositivas
Modern Title Slide for Presentation
Make a strong first impression with this Modern Title Slide design. Its bold typography, dual-tone layout, and customizable accent icons create a clean, contemporary aesthetic. Perfect for professional and creative presentations alike. Editable in PowerPoint, Keynote, and Google Slides.
- Eliminar de favoritos
Plantilla de PowerPoint
1 MB
Plantilla de Google Slides
Enlace externo
Plantilla de Keynote
1 MB
7 diapositivas
PESTEL Market Analysis Infographic
PESTEL analysis is a crucial framework for comprehending the macro-environmental factors influencing a market. Our PESTEL market analysis infographic, rendered in lively shades of green and orange against a pristine white backdrop, provides a concise yet comprehensive overview of Political, Economic, Social, Technological, Environmental, and Legal aspects. Specifically tailored for business analysts, strategists, and market researchers, this template serves as a vibrant visual guide for dissecting the external market environment. With compatibility spanning PowerPoint, Keynote, and Google Slides, it promises a dynamic addition to your market analysis presentations.
- Eliminar de favoritos
Plantilla de PowerPoint
1 MB
Plantilla de Google Slides
Enlace externo
Plantilla de Keynote
1 MB
6 diapositivas
Change Management Plan and Timeline Presentation
Bring your strategy to life with a clean, visual roadmap that connects goals to real timelines. A team performance improvement plan helps identify areas needing support, establish measurable targets, and align team efforts across months. This editable presentation template works seamlessly in PowerPoint, Keynote, and Google Slides for flexible collaboration.
- Eliminar de favoritos
Plantilla de PowerPoint
1 MB
Plantilla de Google Slides
Enlace externo
Plantilla de Keynote
1 MB
5 diapositivas
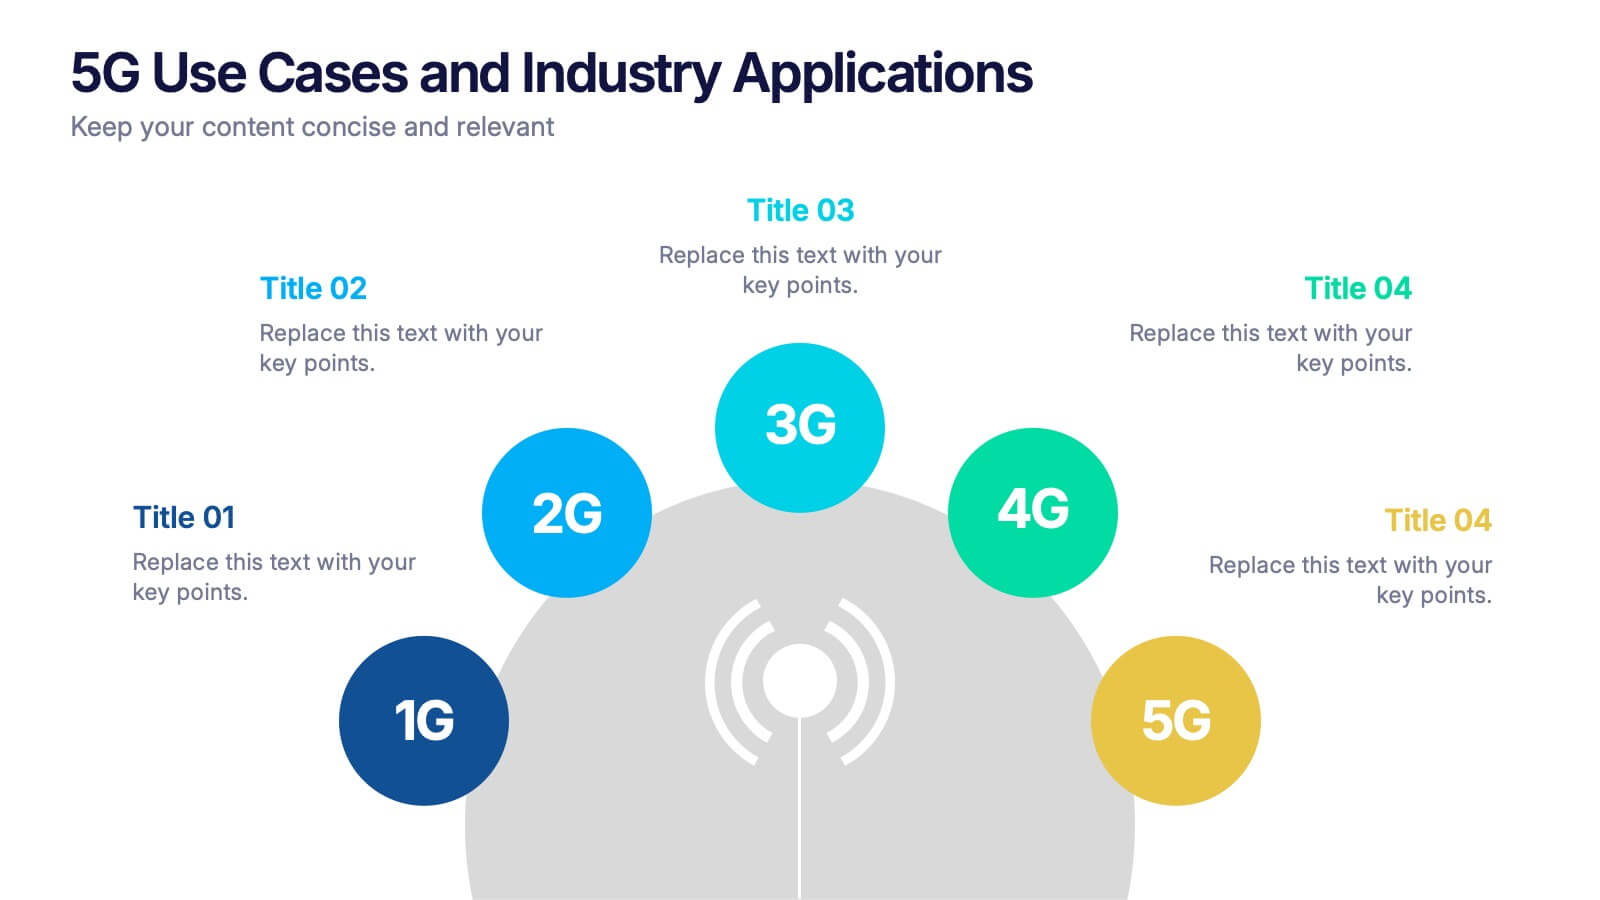
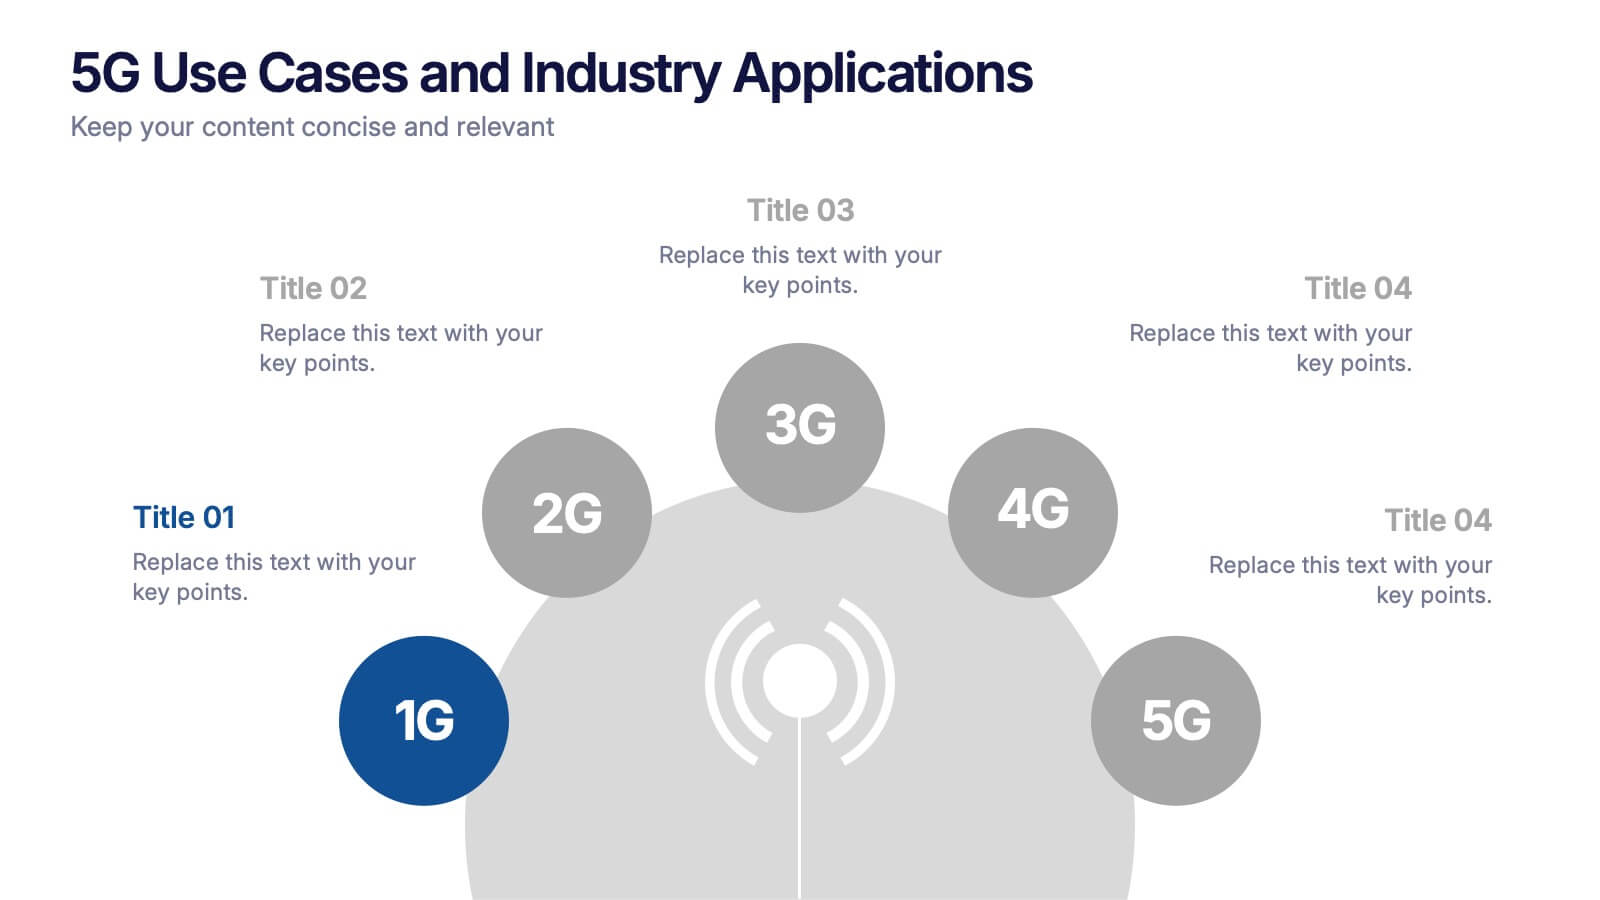
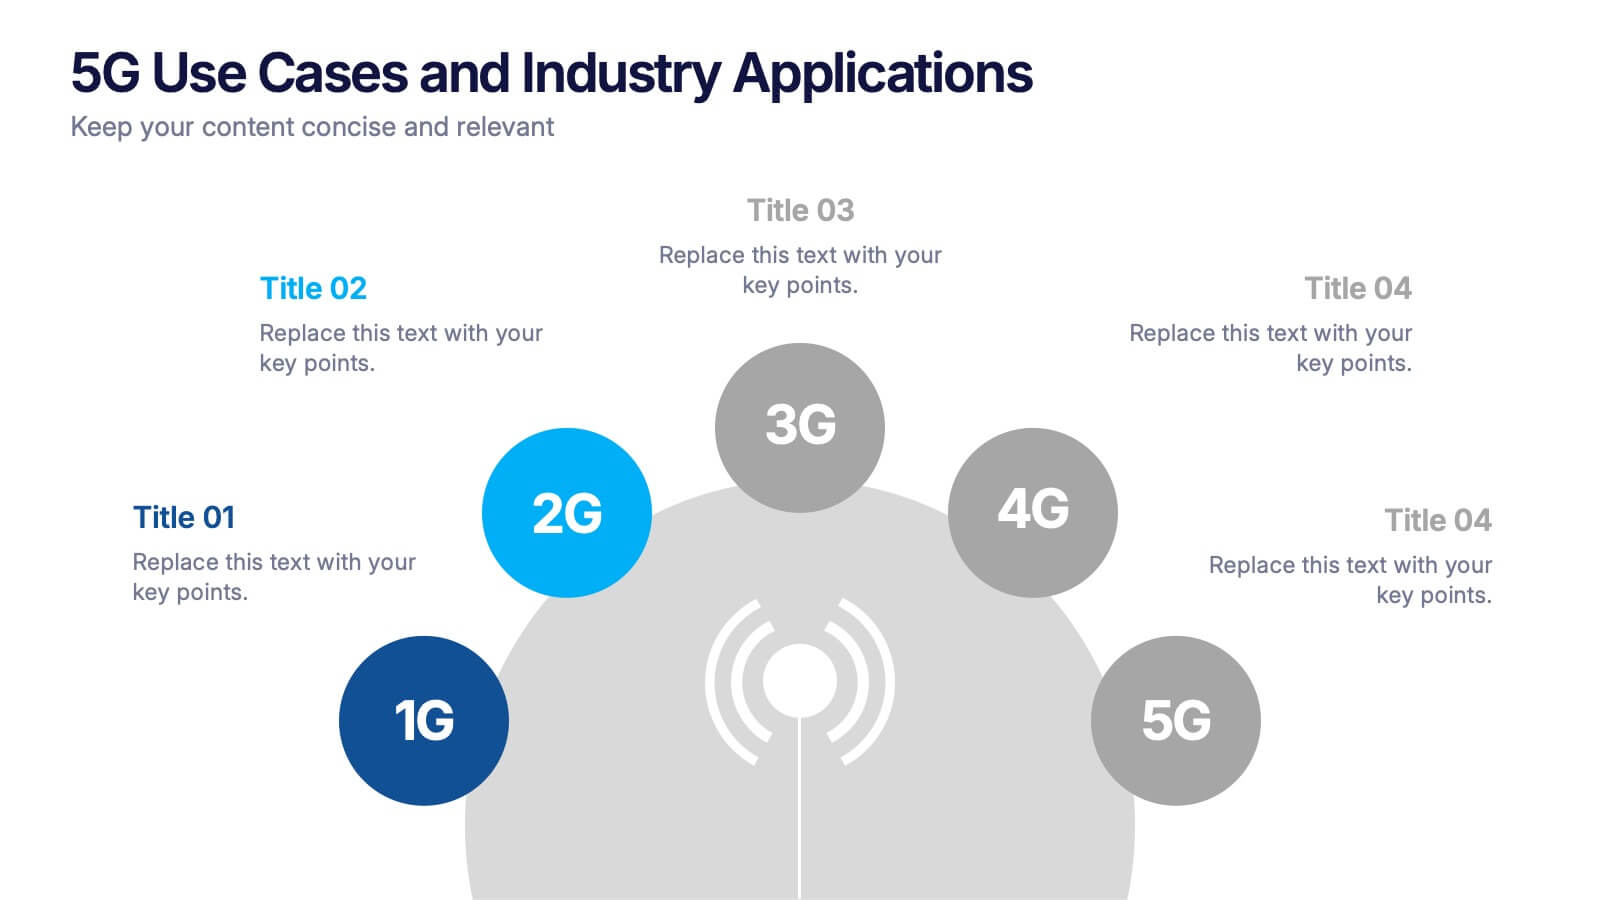
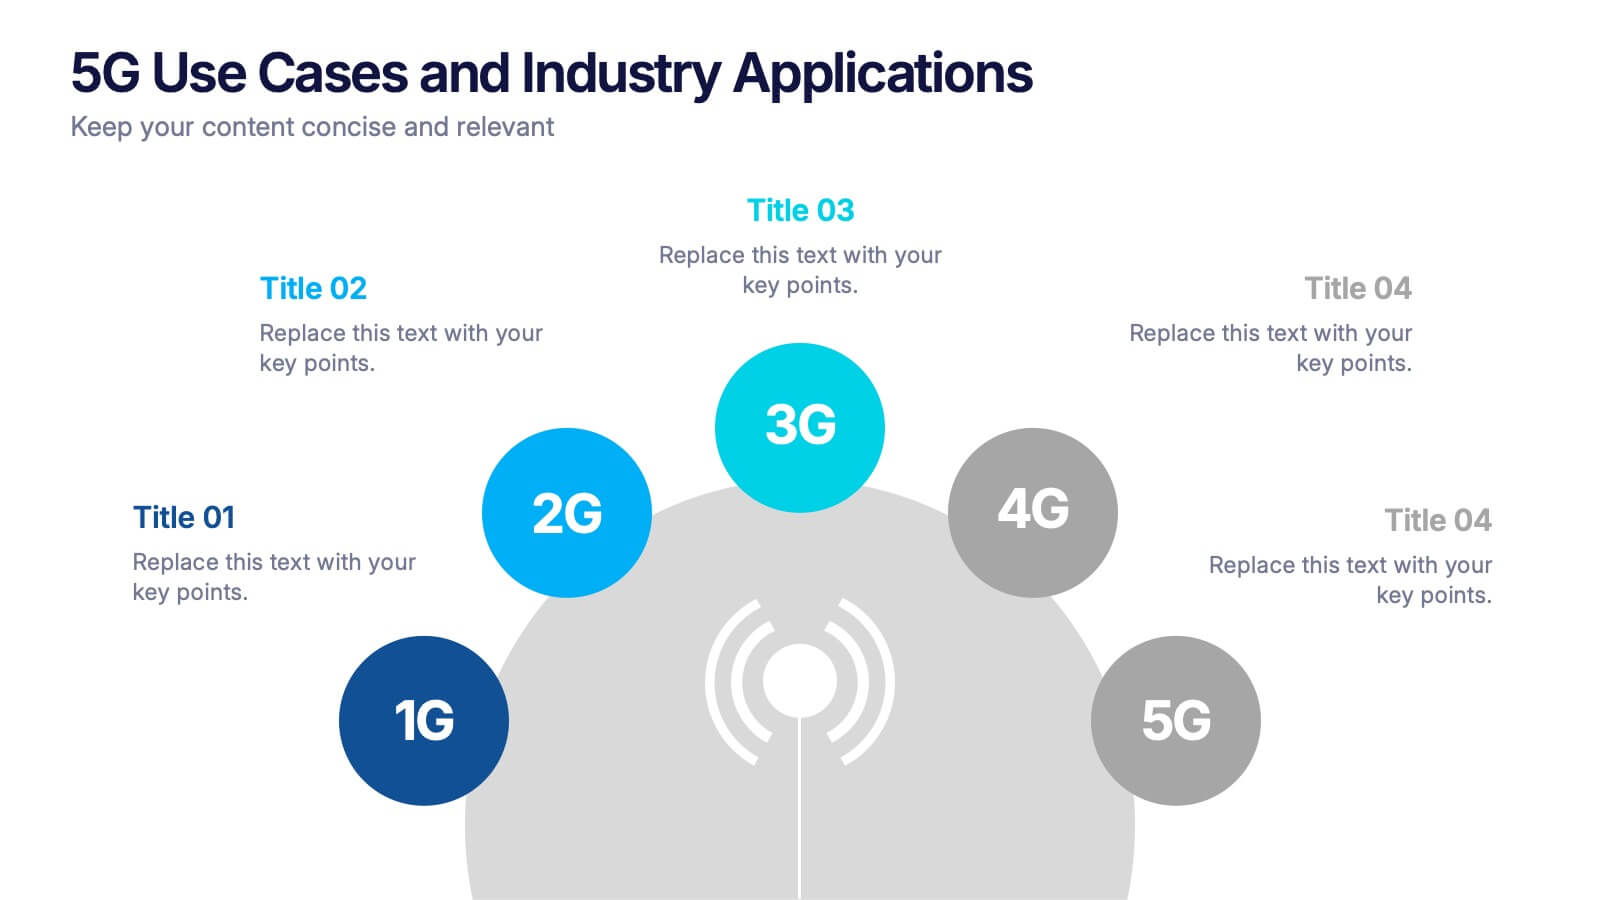
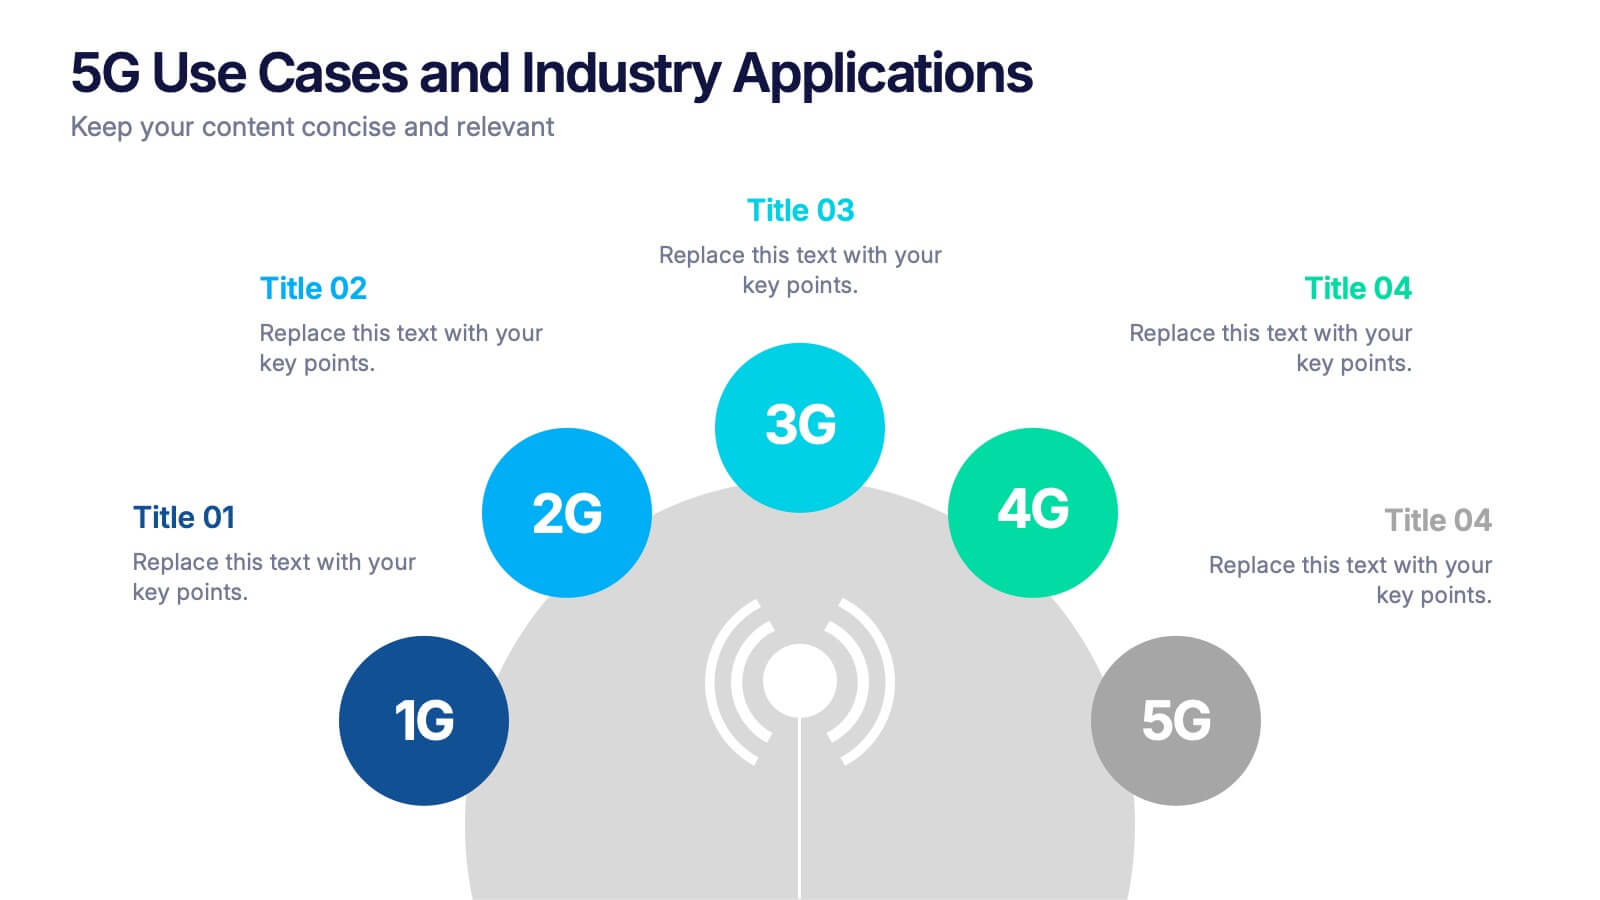
5G Use Cases and Industry Applications Presentation
Unlock the possibilities of next-generation connectivity with a clear, visual explainer designed to showcase how different industries benefit from faster, smarter networks. This presentation breaks down key applications, technology shifts, and real-world 5G impact in an easy, engaging format. Fully compatible with PowerPoint, Keynote, and Google Slides.
- Eliminar de favoritos
Plantilla de PowerPoint
1 MB
Plantilla de Google Slides
Enlace externo
Plantilla de Keynote
1 MB
7 diapositivas
PESTEL Framework for External Analysis Presentation
Evaluate external factors with ease using the PESTEL Framework for External Analysis Presentation. This structured layout helps you assess Political, Economic, Social, Technological, Environmental, and Legal influences on your business. Perfect for market research, risk assessment, and strategic planning. Fully customizable in PowerPoint, Canva, and Google Slides.
- Eliminar de favoritos
Plantilla de PowerPoint
1 MB
Plantilla de Google Slides
Enlace externo
Plantilla de Keynote
1 MB
6 diapositivas
TAM SAM SOM Market Analysis
Take your market insights to the next level with a visual that simplifies complex data in seconds. This layered template helps you clearly communicate TAM, SAM, and SOM breakdowns—perfect for startups, product pitches, or strategic planning. Easily editable in PowerPoint, Keynote, and Google Slides for fast, polished presentations.
- Eliminar de favoritos
Plantilla de PowerPoint
1 MB
Plantilla de Google Slides
Enlace externo
Plantilla de Keynote
1 MB
5 diapositivas
Investment and Wealth Planning Presentation
Visualize your financial strategy with this creative piggy bank diagram layout. Each quadrant highlights a different element of your investment plan—from savings and risk management to asset growth and long-term wealth goals. Perfect for financial advisors, business consultants, or educators. Fully editable in PowerPoint, Keynote, and Google Slides for easy customization
- Eliminar de favoritos
Plantilla de PowerPoint
10 MB
Plantilla de Google Slides
Enlace externo
Plantilla de Keynote
4 MB
4 diapositivas
Social and Professional Networking
Visualize global connections and collaborative ecosystems with this Social and Professional Networking presentation. Ideal for HR teams, marketers, or networking strategists, it showcases relationship-building and engagement across key hubs. Fully customizable in PowerPoint, Keynote, and Google Slides for maximum flexibility in any professional setting.
- Eliminar de favoritos
Plantilla de PowerPoint
1 MB
Plantilla de Google Slides
Enlace externo
Plantilla de Keynote
1 MB
4 diapositivas
Construction Project Planning
Streamline your workflow and improve clarity with this vibrant project planning wheel designed for construction professionals. This slide helps visualize key phases—such as planning, team coordination, and logistics—using color-coded segments and editable icons. Perfect for architects, contractors, and project managers. Fully customizable in PowerPoint, Keynote, and Google Slides.
- Eliminar de favoritos
Plantilla de PowerPoint
2 MB
Plantilla de Google Slides
Enlace externo
Plantilla de Keynote
3 MB
7 diapositivas
North America Population Infographic Presentation
North America is a continent located in the northern hemisphere of the Earth, bordered by the Pacific Ocean to the west. It includes countries such as the United States, Canada, Mexico, and several others in the Caribbean and Central America. This template can be a powerful tool to communicate information about the continent in an informative and engaging way. This can help people understand and appreciate the diversity and complexity of North America, and can be used for a variety of purposes, from education to marketing. This template is compatible with Powerpoint, Keynote and Google Slides.
- Eliminar de favoritos
Plantilla de PowerPoint
1 MB
Plantilla de Google Slides
Enlace externo
Plantilla de Keynote
2 MB
10 diapositivas
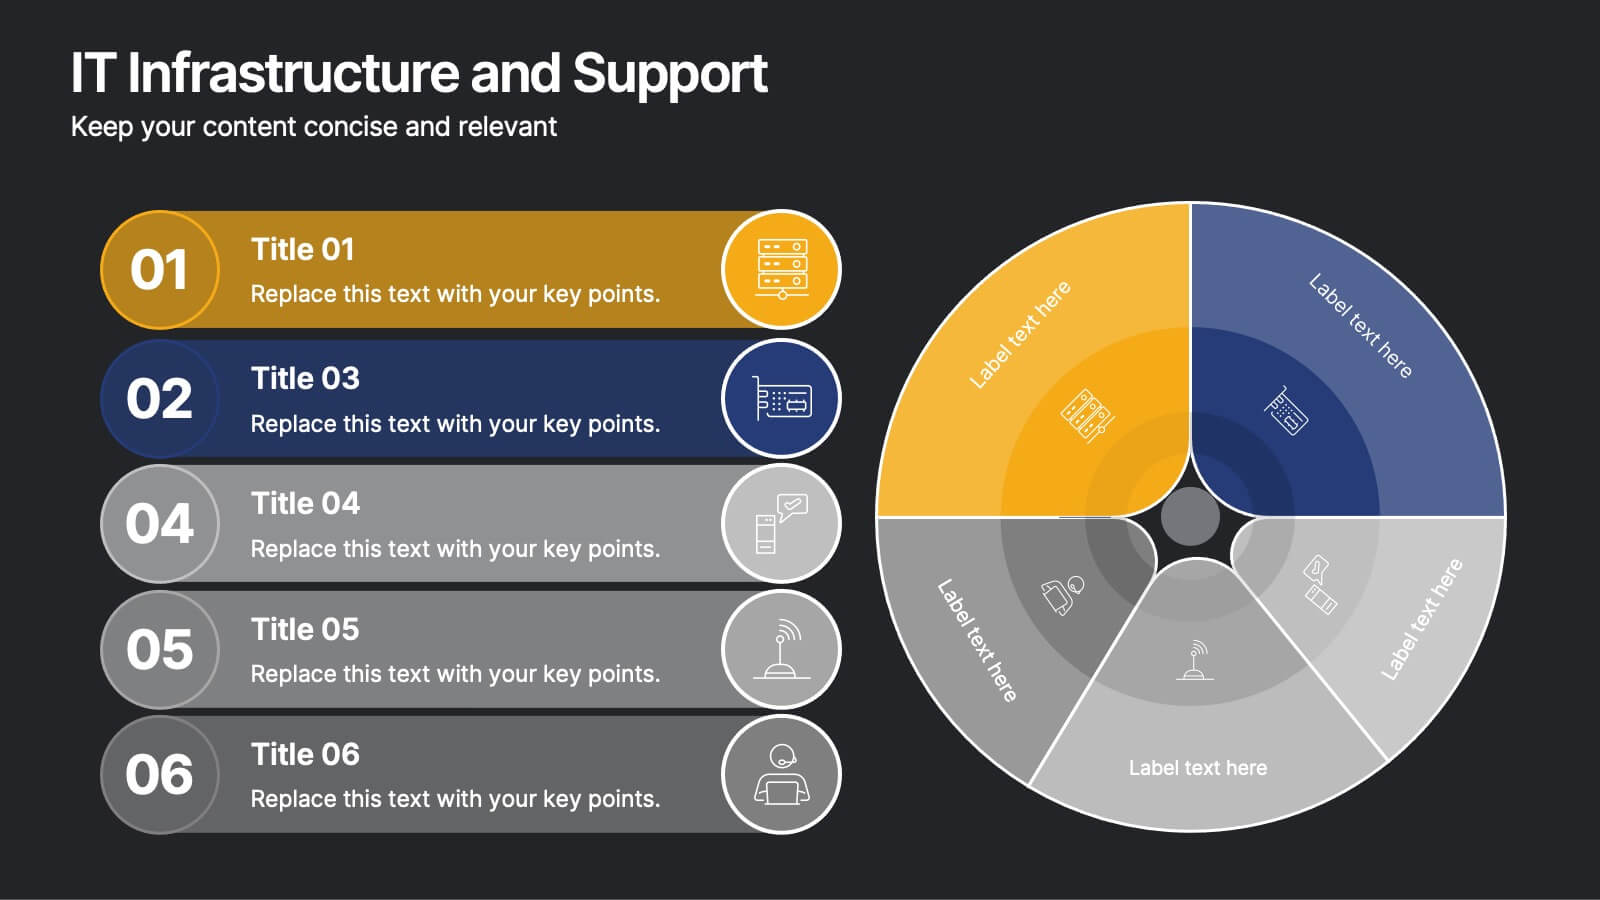
IT Infrastructure and Support
Present your tech strategy with clarity using this IT infrastructure and support slide. Featuring a segmented donut chart and coordinated icon-labeled sections, it's perfect for visualizing network components, system layers, or support processes. Ideal for CIOs, IT managers, and tech teams, and fully editable in PowerPoint, Keynote, or Google Slides.
- Eliminar de favoritos
Plantilla de PowerPoint
1 MB
Plantilla de Google Slides
Enlace externo
Plantilla de Keynote
1 MB
4 diapositivas
Problem Tracing with Fishbone Diagram Presentation
Identify root causes clearly with the Problem Tracing with Fishbone Diagram Presentation. This template features a horizontal, fish-shaped layout with six categories represented in vertical columns, helping you trace issues back to their source. Ideal for quality control, brainstorming, and strategic reviews. Fully editable in PowerPoint, Keynote, and Google Slides.
- Eliminar de favoritos
Plantilla de PowerPoint
1 MB
Plantilla de Google Slides
Enlace externo
Plantilla de Keynote
1 MB
7 diapositivas
SCRUM Process Infographic
Scrum is an agile framework used in software development and project management. Embark on an agile journey through the scrum Process with our infographic template. This illustrative and informative infographic provides a clear visual guide to this methodology, facilitating a swift and efficient path to project success. Compatible with Powerpoint, Keynote, and Google Slides. This is an informative and visually engaging presentation that brings the effectiveness of scrum methodology to life, encouraging individuals and teams to sprint towards project excellence with precision and collaboration.
- Eliminar de favoritos
Plantilla de PowerPoint
1 MB
Plantilla de Google Slides
Enlace externo
Plantilla de Keynote
1 MB
6 diapositivas
Restaurant Menu and Culinary Brand Presentation
Present your culinary identity with the Restaurant Menu and Culinary Brand Presentation. This template offers a clean layout with five customizable icons and text areas—ideal for showcasing your menu highlights, brand values, or dining experience. Perfect for chefs, restaurants, or food entrepreneurs. Fully editable in PowerPoint, Canva, and Google Slides.
- Eliminar de favoritos
Plantilla de PowerPoint
1 MB
Plantilla de Google Slides
Enlace externo
Plantilla de Keynote
1 MB
7 diapositivas
Business Plan Infographic Presentation Template
A business plan is a document that is prepared by entrepreneurs and analysts to support the decision of making a business venture. It typically helps individuals in raising capital and obtaining funds for their new ventures. A business plan often involves multiple steps that can be elaborate, sometimes difficult to explain during presentations in front of potential investors if not summarized properly. This is a comprehensive template that has all of the most important features of a well thought out business plan. This professional template that will present your plan in a sophisticated way.


