


Características


¿Tienes alguna pregunta?
Recomendar


5 diapositivas
Visual Mind Connections Bubble Chart
Present interconnected ideas with clarity using the Visual Mind Connections Bubble Chart Presentation. This diagram helps map key points around a central concept, making it perfect for brainstorming, strategy sessions, or educational content. Easy to customize in PowerPoint, Keynote, or Google Slides. Ideal for teams, coaches, and presenters.


5 diapositivas
Strategic Budget Planning Forecasting
Tired of messy spreadsheets? This clean and creative template makes budget forecasting easier to visualize and share. Centered around a playful piggy bank illustration, it lets you outline strategic goals, savings plans, and key metrics in a format that’s easy to follow. Fully compatible with PowerPoint, Keynote, and Google Slides.


4 diapositivas
Strategic Planning Spider Diagram
Visualize strategic goals with clarity using the Strategic Planning Spider Diagram Presentation. This template leverages a radial layout to assess and compare up to four focus areas, such as vision alignment, resource allocation, stakeholder engagement, and performance metrics. The spider chart structure helps you map gaps or growth across each strategic axis. Ideal for planning sessions, board reviews, or team briefings. Fully customizable in PowerPoint, Keynote, and Google Slides.


6 diapositivas
Product Launch Pitch Deck
Make your product debut unforgettable with this dynamic pitch deck slide. Featuring clean visuals, pie chart stats, and a mobile app mockup, it’s ideal for tech startups and innovative brands. Fully customizable in PowerPoint, Keynote, and Google Slides, it's perfect for presenting key product benefits and performance highlights.


6 diapositivas
Target Audience Segmentation Strategy
Break down your audience with clarity using the Target Audience Segmentation Strategy Presentation. This slide features a vibrant vertical funnel layout, ideal for displaying five customer segments or persona categories. Each layer is numbered and color-coded, with connected callout areas for detailed insights. Perfect for marketers, campaign strategists, or product teams presenting customer journey data, audience demographics, or behavioral insights. Fully customizable in PowerPoint, Keynote, and Google Slides—easily align the design with your brand colors and content structure.


6 diapositivas
Cloud Engineering Infographics
Discover the world of Cloud Engineering with our customizable infographic template. This template is fully compatible with popular presentation software like PowerPoint, Keynote, and Google Slides, allowing you to easily customize it to illustrate and communicate various aspects of cloud engineering. The Cloud Engineering infographic template offers a visually engaging platform to explore and explain the principles, practices, and technologies related to cloud computing and engineering. Whether you're a cloud engineer, IT professional, business leader, or simply interested in cloud technology, this template provides a user-friendly canvas to create informative presentations and educational materials. Deepen your understanding of Cloud Engineering with this SEO-optimized infographic template, thoughtfully designed for clarity and ease of use. Customize it to highlight key concepts, cloud service models, deployment strategies, and the benefits of cloud engineering, ensuring that your audience gains valuable insights into this rapidly evolving field. Start crafting your personalized infographic today to delve into the world of Cloud Engineering.
20 diapositivas
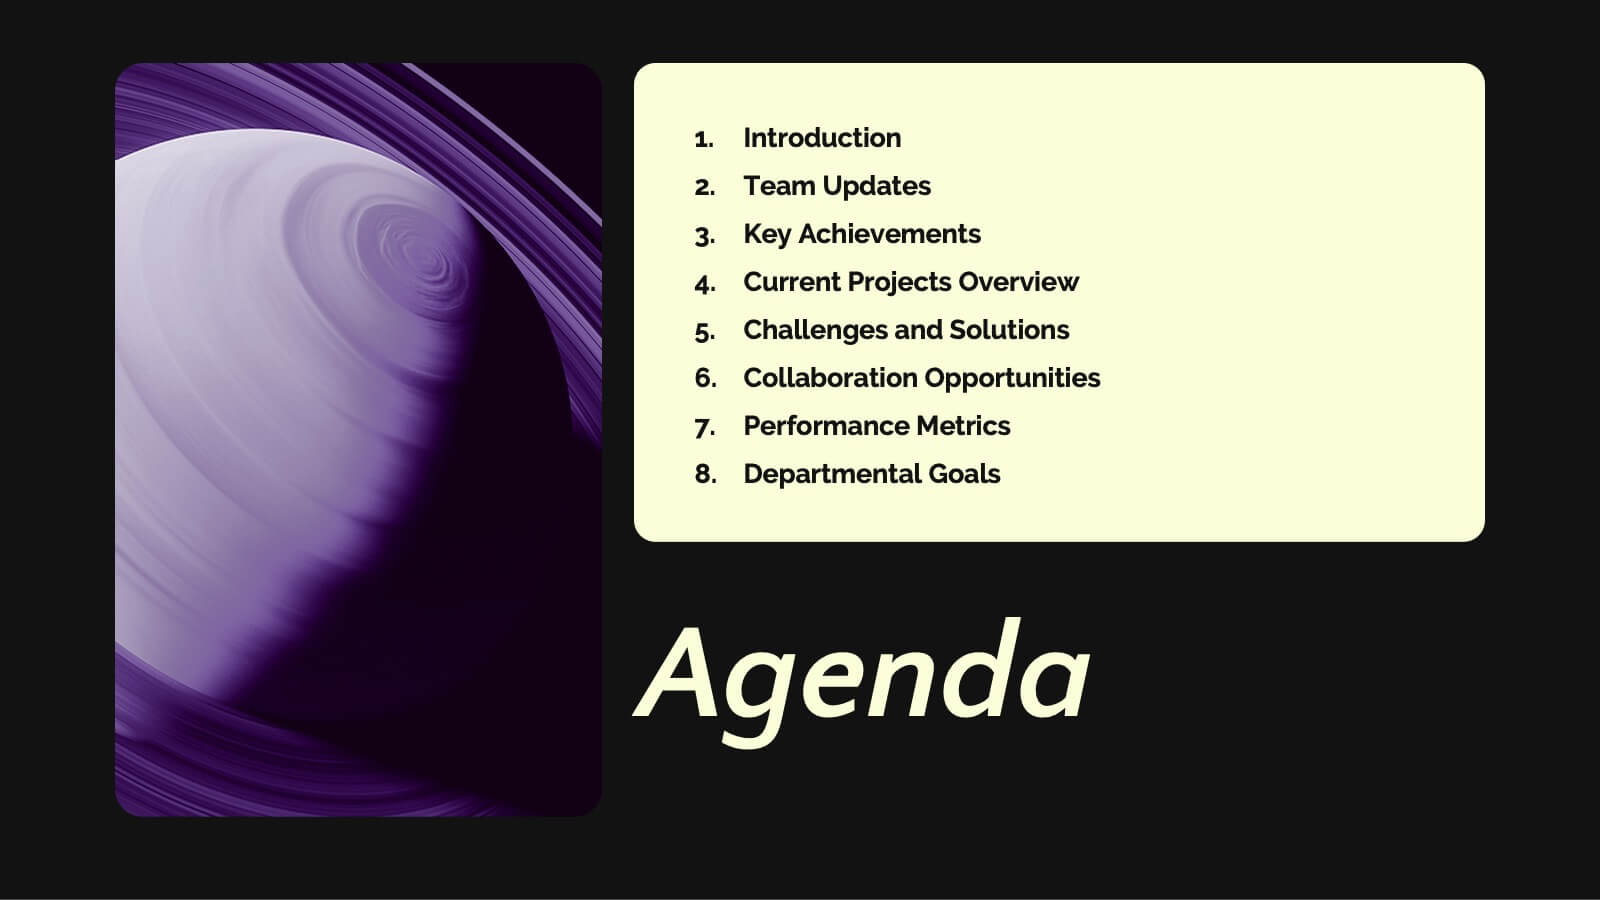
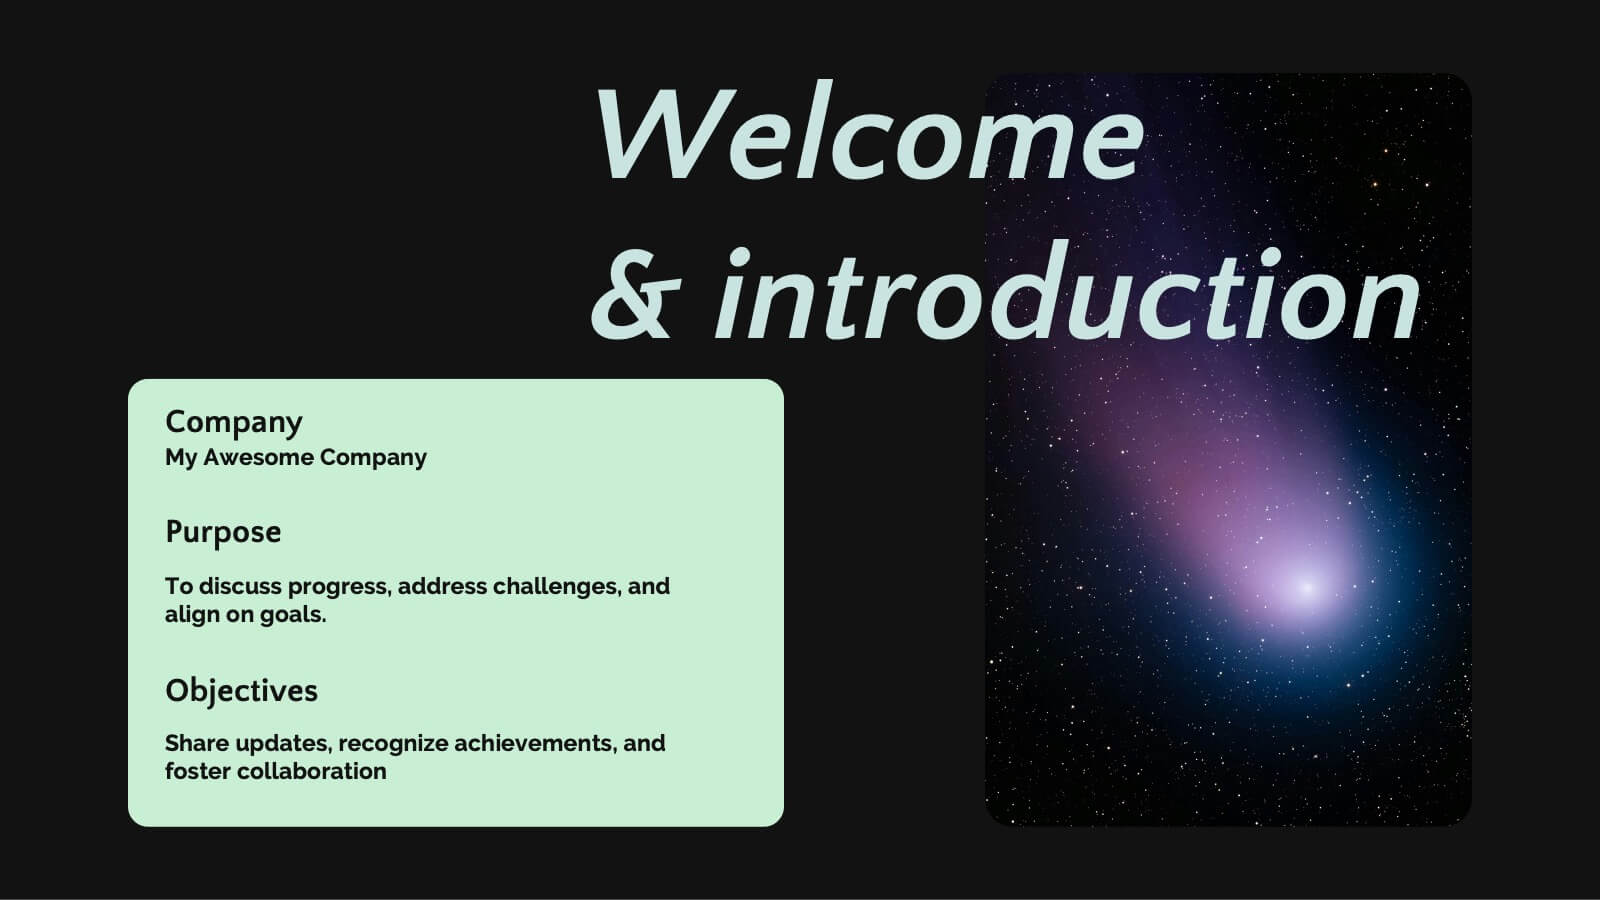
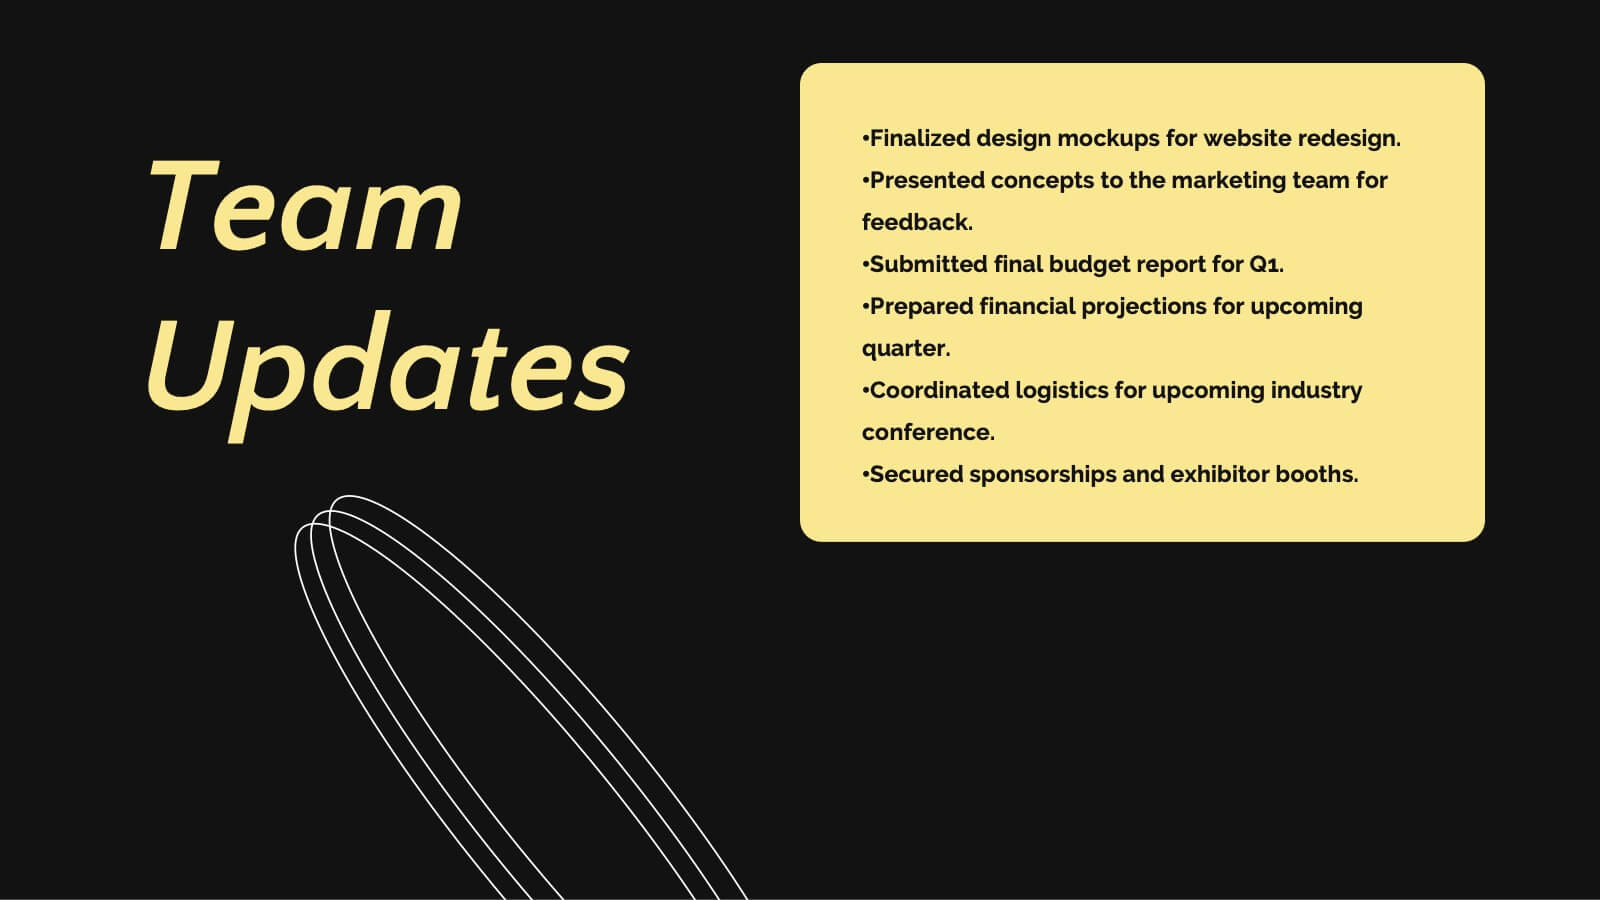
Saturn Business Plan Presentation
Embark on a journey to present your business plan like never before with this stellar presentation template! Perfect for diving deep into key updates, achievements, collaborations, and future goals, it guides your team through essential business strategies and challenges. Compatible with PowerPoint, Keynote, and Google Slides, it offers seamless flexibility and polished professionalism.


4 diapositivas
Veterinary Care and Health Tips Presentation
Keep your audience engaged with this clean, friendly infographic layout perfect for sharing animal care advice and clinic insights. Ideal for veterinarians or pet health professionals, it helps communicate tips, services, and best practices clearly. Fully editable and compatible with PowerPoint, Keynote, and Google Slides for easy customization.


7 diapositivas
Sales Cycle Infographic
A sales cycle, refers to the series of stages or steps that a salesperson or a sales team follows to convert a prospective customer into a paying customer. This infographic template is a structured approach to lead a potential customer from the initial contact to making a purchase. Compatible with Powerpoint, Keynote, and Google Slides. This is an illustrative guide to the fundamental stages of the sales journey. Equip yourself with an understanding of how sales progress, from prospecting to closing the deal, enabling you to optimize your strategies and drive success in the dynamic world of sales.


4 diapositivas
Colorful Workflow Process Chart Presentation
Bring your workflow to life with a vibrant, easy-to-follow layout that makes every stage feel connected and purposeful. This presentation helps you map processes, explain team roles, and simplify complex steps using a clean, visual flow. Fully compatible with PowerPoint, Keynote, and Google Slides.


6 diapositivas
Project Proposal Slide Deck Presentation
Make your next pitch unforgettable with a clean, structured layout that turns complex project ideas into a clear visual story. Ideal for presenting timelines, goals, or performance metrics, it helps you communicate your proposal with confidence and precision. Fully compatible with PowerPoint, Keynote, and Google Slides for effortless editing.


8 diapositivas
Market Research Survey Analysis Presentation
Present your Market Research Survey Analysis with this visually engaging template, designed for clear data visualization and insights presentation. Featuring an intuitive infographic layout, this template allows you to highlight key survey findings, customer insights, and strategic takeaways. Fully customizable in PowerPoint, Keynote, and Google Slides, you can adjust colors, edit text, and modify icons to align with your business needs.


7 diapositivas
Company Title Infographic
This collection of slides is designed to vividly present company profiles and services, utilizing a dynamic color palette of blue, yellow, and white to create an engaging viewer experience. Each slide is meticulously crafted to cater to specific content, enhancing the presentation's overall effectiveness and appeal. Starting with the "Empathy Map" slide, it offers a detailed insight into customer perceptions and experiences, essential for tailoring services to meet client needs. The "SEO Report" slide focuses on showcasing quantifiable data, critical for evaluating marketing success. A dedicated "Portfolio" slide highlights past achievements, pivotal for attracting potential clients and investors by demonstrating proven capability and success. Further slides like "What We Do" and "Objectives" provide clear, straightforward layouts that detail the company’s primary activities and strategic goals, respectively. The "Projects" slide offers a glimpse into current and prospective projects, illustrating ongoing development and future aspirations. Ideal for stakeholder briefings, marketing pitches, or internal reviews, these templates support companies in communicating a cohesive and comprehensive narrative of their operational scope and strategic direction.


5 diapositivas
Strategic Business Case Presentation
Make every proposal stand out with a clear, goal-focused design that simplifies your strategic narrative. Ideal for presenting initiatives, project justifications, or decision-making insights, this layout balances visual clarity with professionalism. Fully compatible with PowerPoint, Keynote, and Google Slides for effortless editing and polished presentations.


26 diapositivas
Operational Efficiency Tips Purple Presentation
Optimize your team's workflow and showcase your strategies for improved performance with this operational efficiency template. The vibrant purples and dynamic design invite viewers into a world where streamlined processes and clear objectives lead to success. Lay out the steps of your action plan, from the CEO's vision to the team's execution, with a variety of slides designed for clear communication. Charts and diagrams turn complex data into easy-to-follow visuals, while mockups provide a real-world view of your tools and platforms. Tailored for use in popular presentation software, this set of slides is an excellent aid for managers and consultants aiming to present plans that boost productivity and cut down waste. It’s all about making the complex simple and achieving more with less, helping your audience see the path to a leaner and more effective operation.


10 diapositivas
Results-Oriented Strategy Solutions Presentation
Drive your message home with the Results-Oriented Strategy Solutions Presentation. This layout features a presenter and chart graphic to emphasize goal tracking, performance analysis, and strategic actions. Perfect for business updates, KPIs, or coaching sessions. Fully customizable for PowerPoint, Keynote, and Google Slides.


4 diapositivas
3-Step Supply Chain and Logistics Planning Presentation
Bring your workflow to life with a clean three-stage visual that makes your process feel fast, simple, and smart. This slide helps explain planning steps, logistics timelines, and supply chain actions in a way that’s easy for any audience to follow. Fully compatible with PowerPoint, Keynote, and Google Slides.