


Características


¿Tienes alguna pregunta?
Recomendar


3 diapositivas
Business Self-Introduction
Make a memorable first impression with this clean, skill-focused introduction slide. Ideal for presenting professional backgrounds, role highlights, and expertise levels. Great for resumes, team intros, or portfolio decks. Fully editable in PowerPoint, Keynote, and Google Slides.


5 diapositivas
Global Warming Crisis Infographics
Global Warming refers to the long-term increase in the Earth's average surface temperature, primarily caused by the buildup of greenhouse gases in the atmosphere. This vertical infographics includes information about the effects of climate change on the planet. There are designed sections where you can feature data on rising temperatures, sea levels, and extreme weather events. These infographics feature unique designs that incorporate colors and images that convey the severity and urgency of this crisis. The goal of this template is to raise awareness about the need to address the global warming crisis and mitigate the impact of climate change.


6 diapositivas
Business Scheduling Calendar Presentation
The "Business Scheduling Calendar" presentation template provides a clear and structured visual tool for planning and tracking tasks across a business quarter or year. Each week is distinctly highlighted, and tasks can be listed under specific days to enhance week-to-week planning. This format is highly beneficial for organizations aiming to maintain a visual overview of key tasks and deadlines, ensuring nothing is overlooked. The design allows for easy updates and can be adjusted to suit different time frames or project scales, making it an essential tool for effective time management and project planning


5 diapositivas
Ishikawa Fishbone Diagram Presentation
Bring clarity to problem-solving with a visual that makes root-cause analysis feel simple and intuitive. This presentation helps you map issues, organize insights, and highlight contributing factors with clean, structured design. Perfect for workshops, audits, and process improvement. Fully compatible with PowerPoint, Keynote, and Google Slides.


5 diapositivas
Employee Onboarding 30-60-90 Day Plan
Set new hires up for success with this visual 30-60-90 Day Plan tailored for employee onboarding. Featuring progress-style gauges and clear milestone breakdowns, this template helps HR teams and managers communicate expectations, goals, and achievements across each phase. Fully customizable in PowerPoint, Keynote, and Google Slides.


5 diapositivas
Fitness Program Infographics
A fitness program is a structured plan designed to improve and maintain physical health and well-being. These vertical infographics outline the key elements and benefits of a fitness program. This template is ideal for gyms, personal trainers, and fitness enthusiasts looking to educate and inspire others to adopt a healthy and active lifestyle. The infographics offer space to include customizable workout plans tailored to different fitness levels, such as weight loss, muscle gain, or overall fitness improvement. Helpful nutrition tips are incorporated to complement the fitness program, emphasizing the importance of achieving fitness goals.


7 diapositivas
Mortgage Comparison Infographic
Make the home buying decision easier with our mortgage comparison infographic template. This user-friendly and visually engaging infographic allows you to compare different mortgage options, helping your audience make informed financial choices. Use the charts to illustrate how the loan term impacts the total cost of the mortgage, making it easier to choose the right term. Fully customizable and compatible with Powerpoint, Keynote, and Google Slides. With this template, you can demystify mortgage options and empower individuals to choose the mortgage that best fits their needs and financial goals.


26 diapositivas
Ethical Business Practices Presentation
Promote integrity with our Ethical Business Practices presentation template, suitable for PowerPoint, Keynote, and Google Slides. This essential tool is crafted for business leaders, compliance officers, and educators who aim to reinforce the importance of ethics in the corporate environment. Our template facilitates a clear understanding of ethical standards in business operations. It includes slides on ethical decision-making, corporate governance, social responsibility, and the long-term benefits of maintaining high ethical standards. With customizable layouts, you can present real-world scenarios, ethical frameworks, and company policies that illustrate your commitment to ethical conduct. This SEO-optimized template is key for reaching audiences interested in building trust and credibility through responsible business practices. Use this template to lead discussions on ethics, influence corporate culture positively, and showcase how ethical behavior is not just right but also beneficial for business success.


5 diapositivas
Secure Cloud Storage and Access Presentation
Highlight your data protection strategy with the Secure Cloud Storage and Access presentation slide. Featuring a central cloud shield icon with five connected callouts, it’s perfect for illustrating encryption methods, access protocols, or compliance points. Fully editable in PowerPoint, Keynote, and Google Slides.


5 diapositivas
Core to Outer Ring Concentric Planning Presentation
Present your strategy from the inside out with the Core to Outer Ring Concentric Planning Presentation. This layered, radial design guides viewers through a central concept outward into supporting elements—ideal for planning, process modeling, or decision frameworks. Fully customizable in PowerPoint, Keynote, and Google Slides.


7 diapositivas
Harvey Ball Charts Infographic
A Harvey Ball is a simple, round graphic used for visual representation and communication of qualitative information. This infographic template harnesses the power of Harvey Balls, those simple yet potent icons, to convey information and insights in a visually striking manner. Highlight strategies to engage the audience effectively using Harvey Balls. Fully customizable and compatible with Powerpoint, Keynote, and Google Slides. This infographic allows you to explore the ability to customize Harvey Balls, varying in size, color, and style to suit your unique data representation needs.


3 diapositivas
Transportation Services Workflow Presentation
Showcase your delivery process with clarity. This template tracks each transportation step—from port to truck to doorstep—with minimal, modern visuals and editable callouts. It’s perfect for workflow overviews, operations planning, or client onboarding. Use it in PowerPoint, Keynote, or Google Slides without losing style or structure.


5 diapositivas
Easy Asian Recipes Infographics
Asian cuisine is incredibly diverse and offers a wide range of delicious and flavorful recipes from various countries and regions. These vertical infographics are designed in a user-friendly design that showcase a collection of simple and delicious Asian recipes. These are perfect for home cooks, food bloggers, and anyone interested in exploring the flavors of Asian cuisine. These infographics include beautifully designed recipes for a variety of popular Asian dishes, such as ramen, teriyaki chicken, and more. Each recipe provides a list of ingredients needed and step-by-step instructions to guide users through the cooking process.


8 diapositivas
Health Metrics and Wellbeing Dashboard Presentation
Visualize patient insights with this dashboard-style layout combining human figures, progress bars, and anatomical icons. Ideal for healthcare data, wellness reporting, or gender-based analysis, it balances stats and storytelling effectively. Customize it easily in PowerPoint, Keynote, or Google Slides for your next health-focused presentation.


22 diapositivas
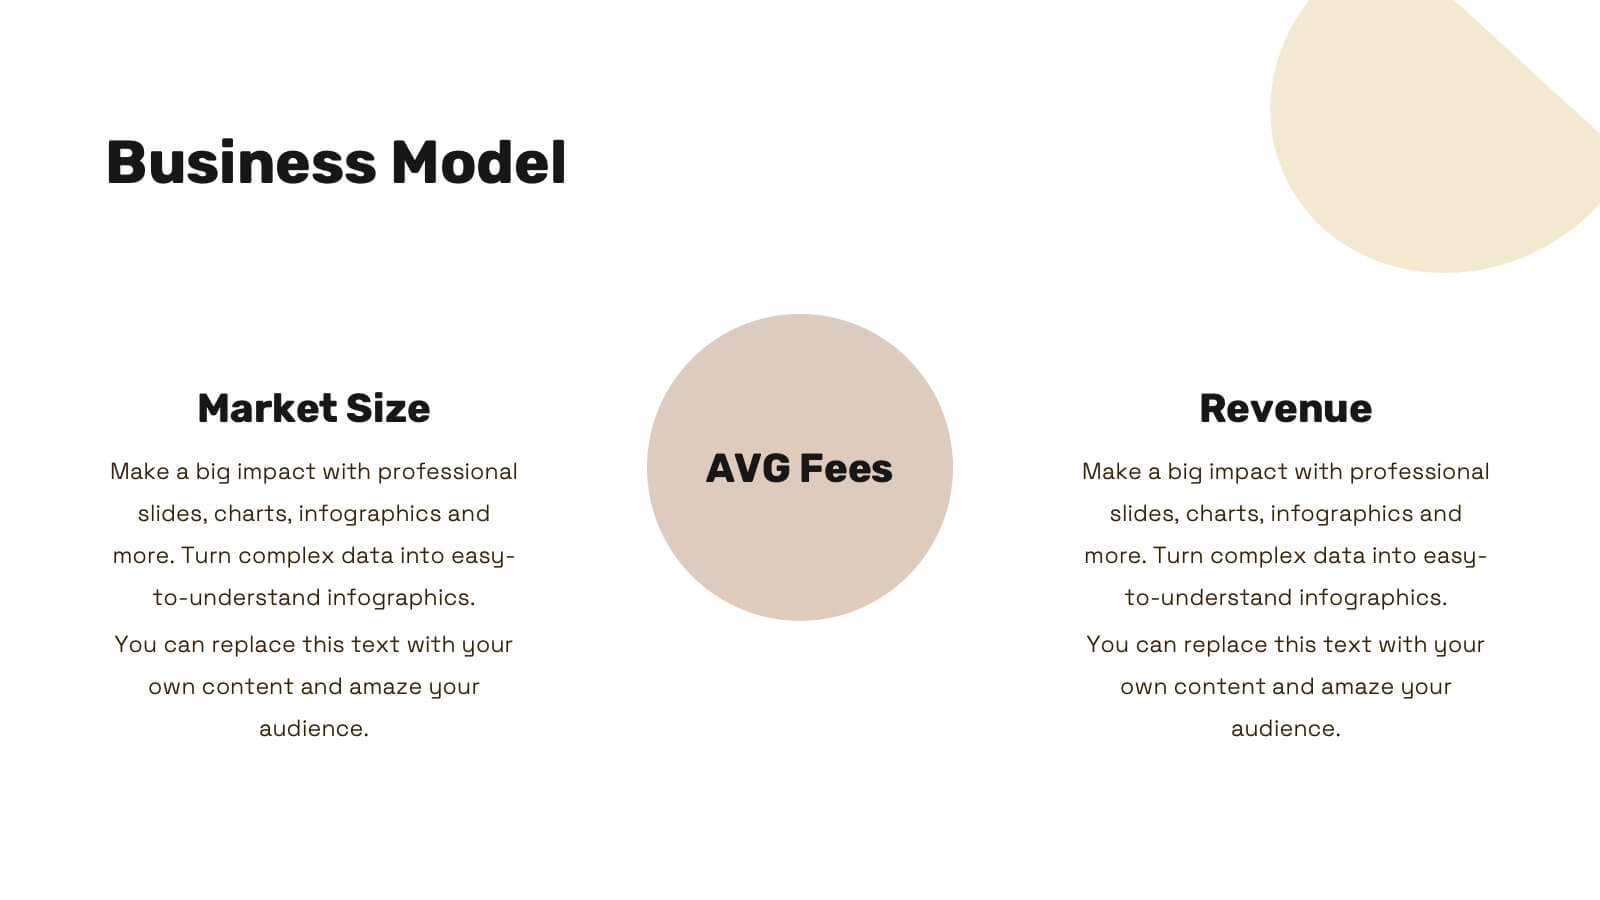
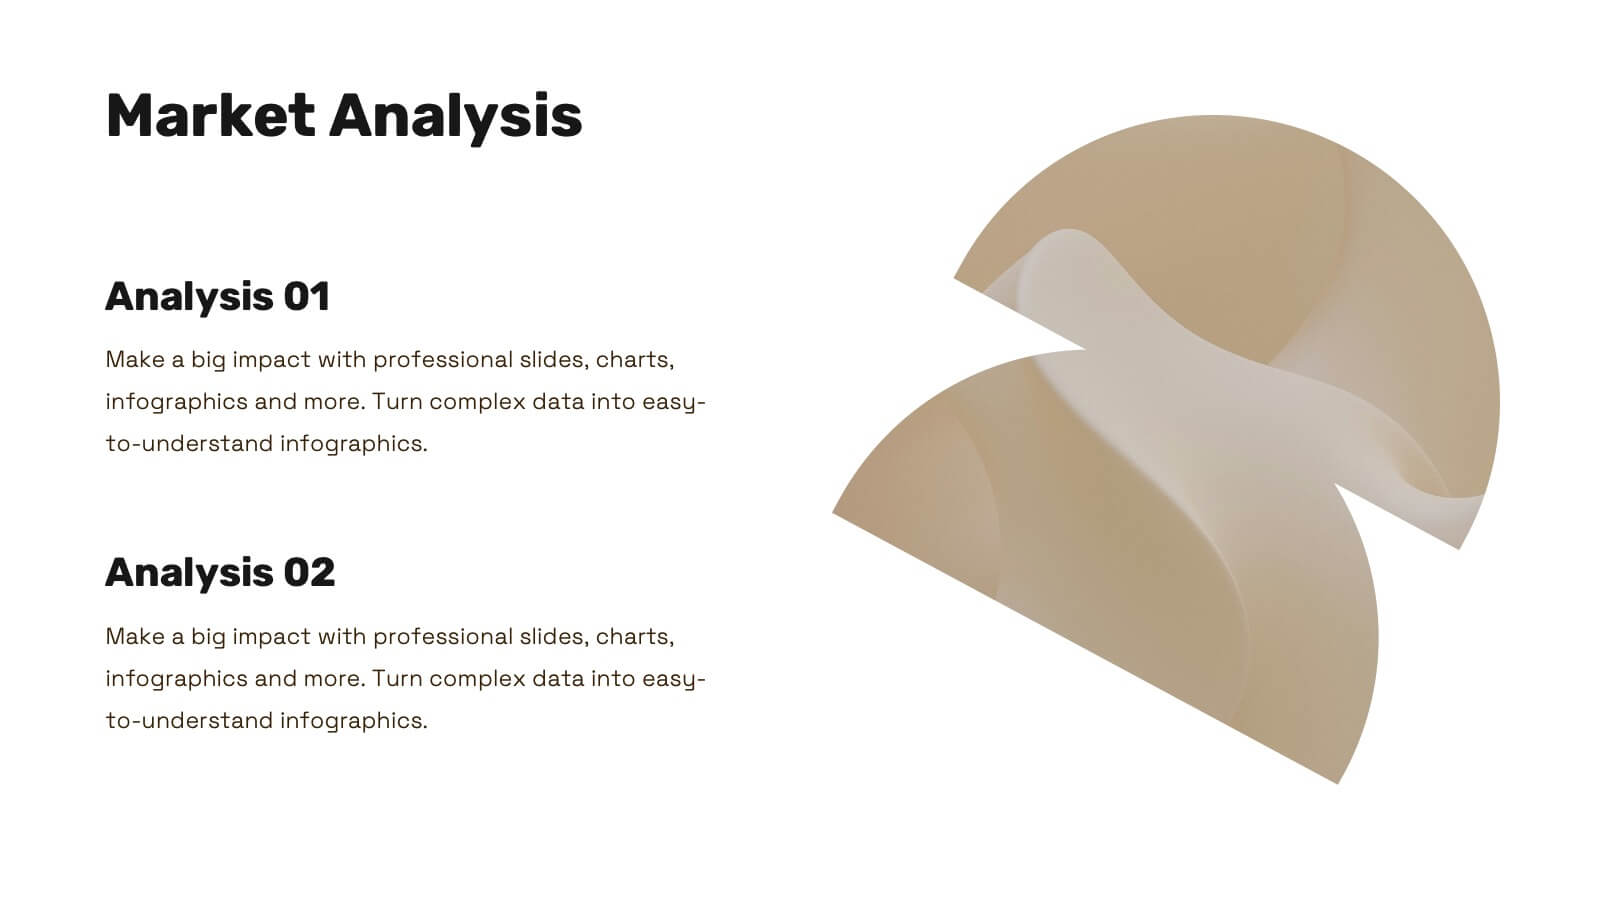
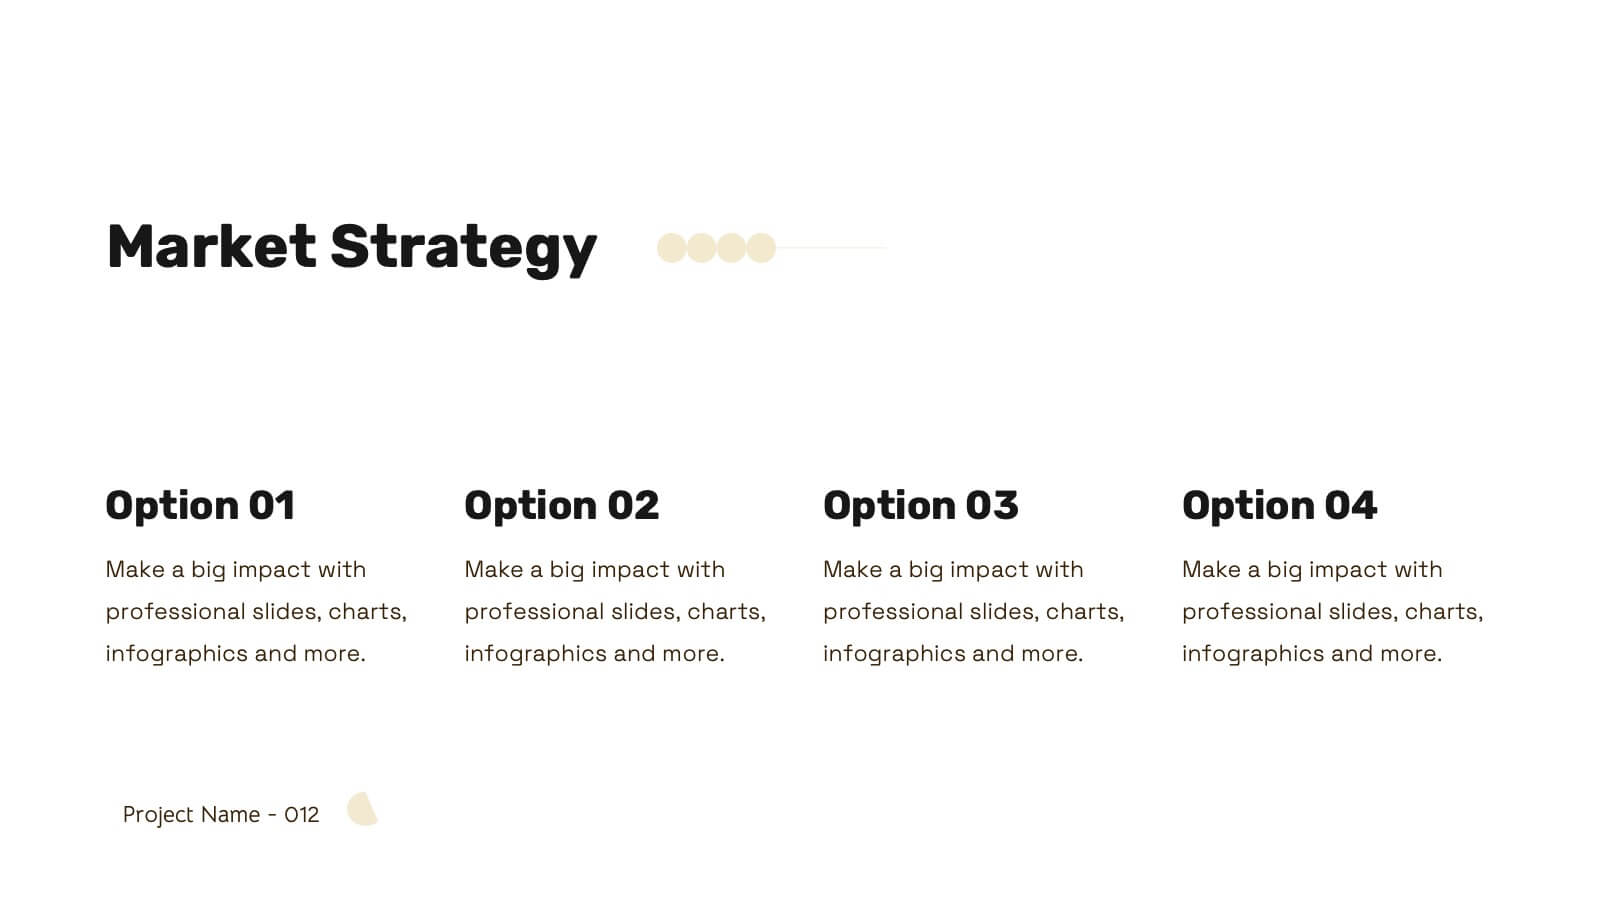
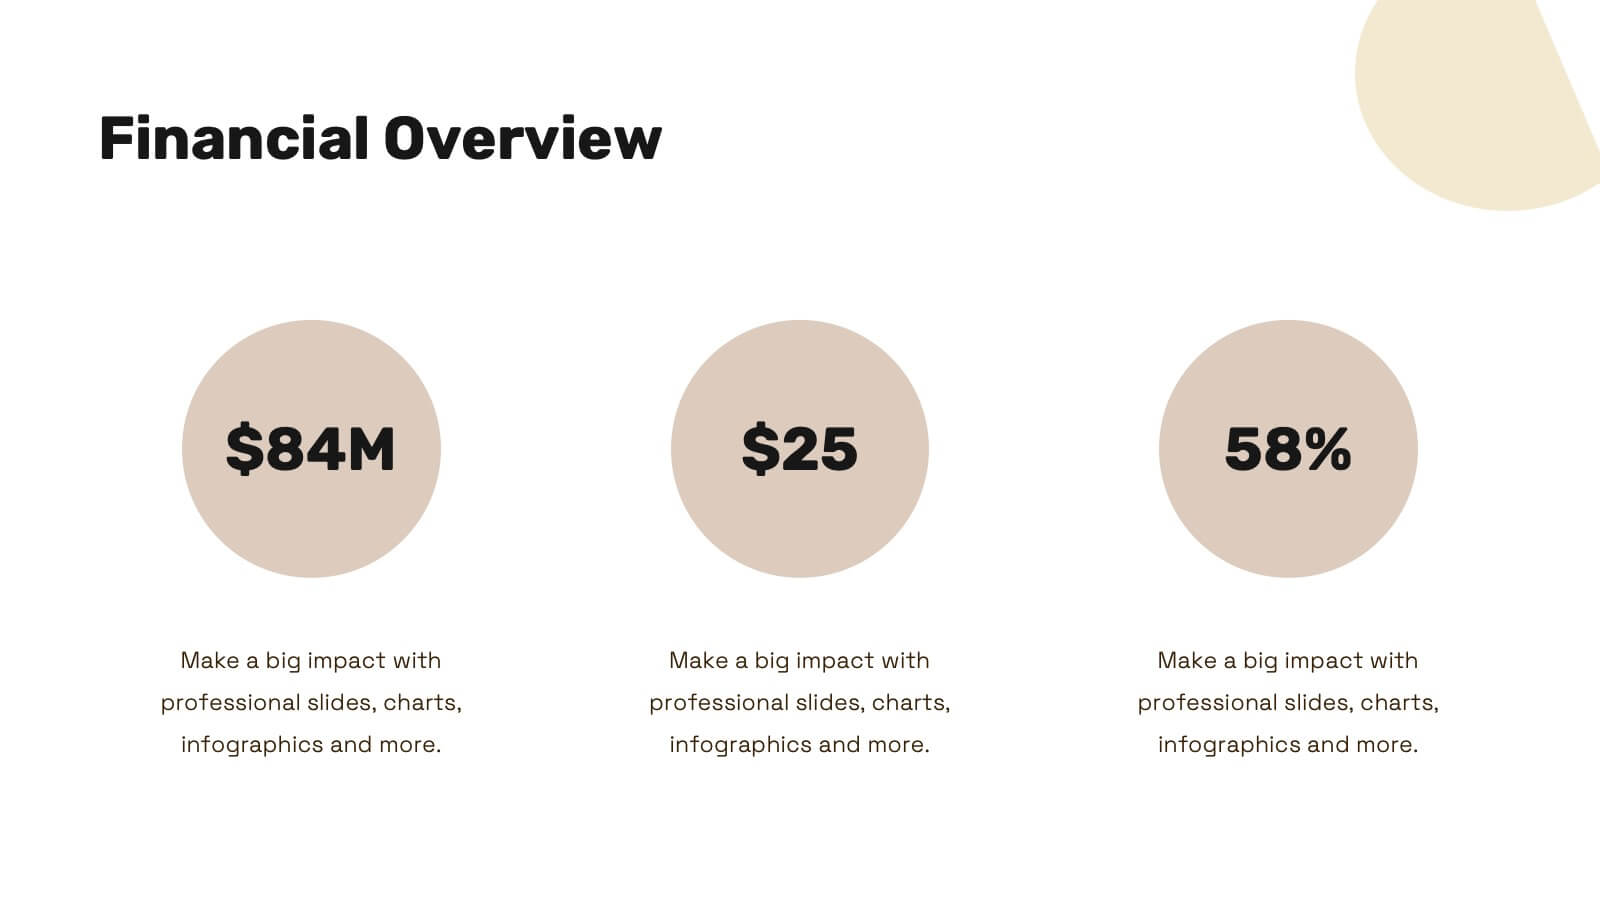
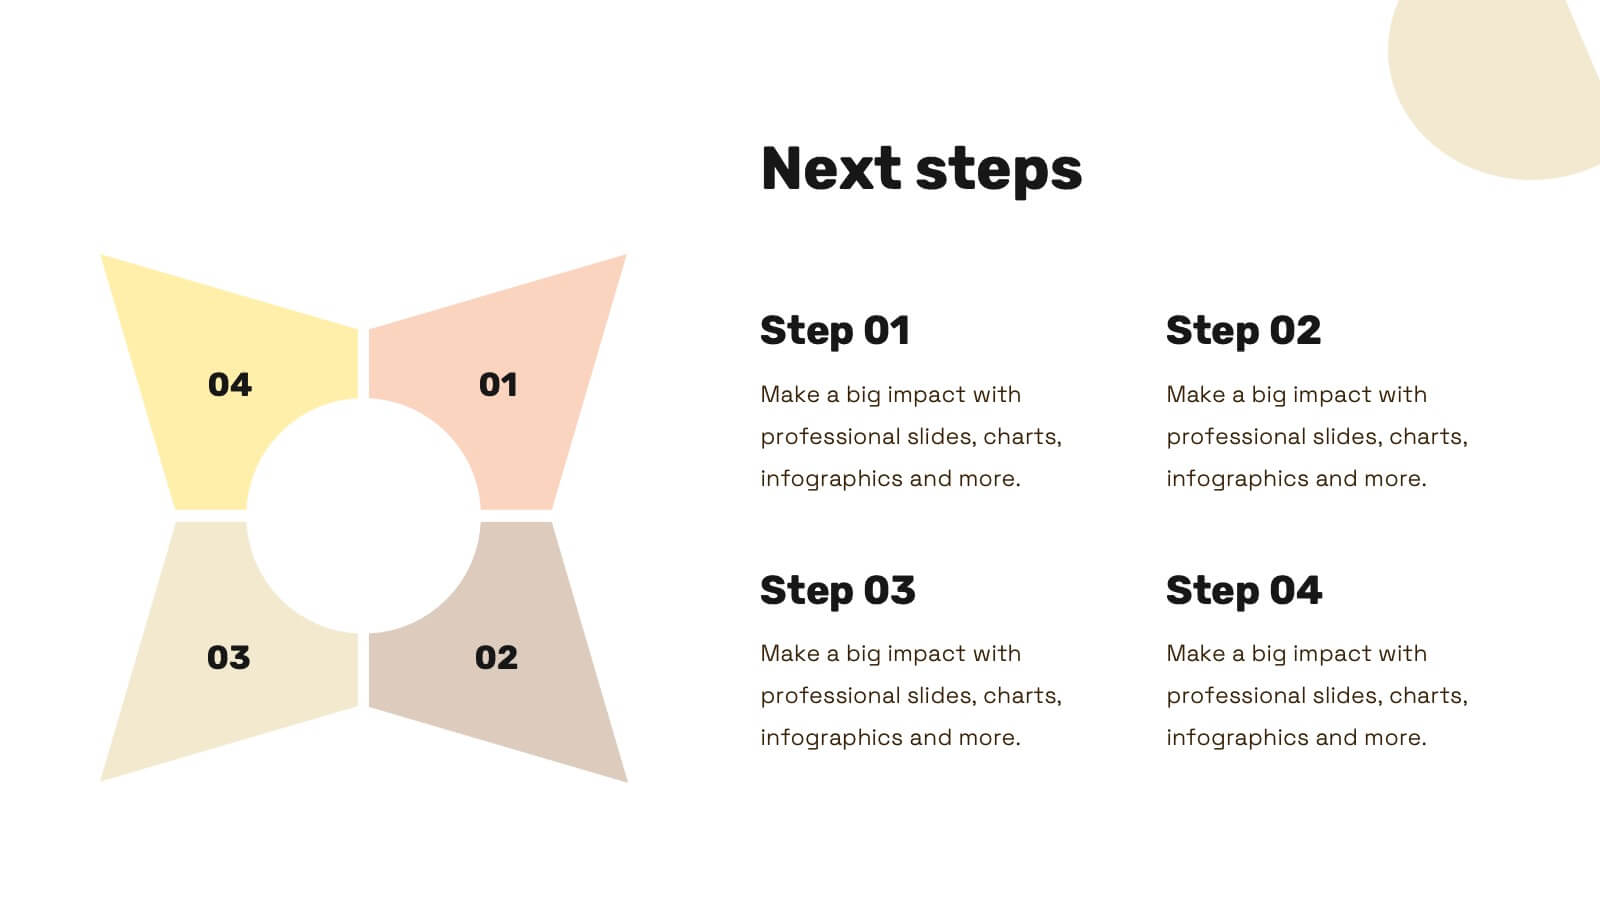
Nova Startup Funding Proposal Presentation
Craft an impressive startup funding proposal with this elegant template. It includes sections for mission, vision, market analysis, business model, and financial overview. Ideal for clear and professional presentations. Fully compatible with PowerPoint, Keynote, and Google Slides for easy customization.


7 diapositivas
Transportation & Logistics Infographic PowerPoint Template and Google Slides Theme
A transportation & logistics infographic is a visual representation of information and data related to the movement of goods and people from one place to another. This template can be used to convey complex information about a variety of topics in the transportation and logistics industry. This template includes many graphics, images, and charts to help illustrate your data, and allows you to Input your shipping routes, delivery times, and flow of goods. This template can be used for various purposes, such as educating the public and promoting efficient transportation and logistics practices.


6 diapositivas
KPI Metric Infographic
KPI stands for Key Performance Indicator, and it is a measurable value that helps organizations track their progress and performance towards achieving specific business goals and objectives. This infographic template is designed to display key performance indicators and metrics in a concise and easy-to-understand manner. KPIs are quantifiable measurements used to evaluate the success of an organization, project, or specific business activities. The infographic provides a visual representation of these KPIs, making it easier for stakeholders and decision-makers to interpret the data and track progress.