


Características


¿Tienes alguna pregunta?
Recomendar


8 diapositivas
2x2 Matrix Chart Presentation
Bring clarity to complex decisions with this clean, visually engaging layout designed for comparing four key factors at a glance. This presentation makes it easy to highlight priorities, map insights, and explain strategic choices with confidence. Fully customizable and compatible with PowerPoint, Keynote, and Google Slides.


7 diapositivas
Thank You Message Infographic
Express gratitude with flair using this vibrant template, perfect for crafting messages that leave a lasting impression. Each slide is designed with a combination of bold colors, modern typography, and creative layouts, ensuring your thanks stands out. Tailor these slides to any occasion by adjusting the design to suit your unique style or corporate branding. This template is ideal for expressing appreciation in various contexts—whether thanking a team for their hard work, acknowledging a client's loyalty, or showing gratitude to participants at an event. Its versatility makes it suitable for digital or print formats, from email campaigns to thank you cards. Enhance your messages of thanks with a personal touch, ensuring they resonate more deeply with recipients. This approach not only communicates gratitude but also strengthens relationships with a professional and polished presentation.


5 diapositivas
Mission and Values Alignment
Align your purpose with progress using this clean, directional layout that maps your mission, core values, and strategic focus in a unified flow. Perfect for internal briefings or culture decks, this slide visually connects each value to your organizational journey. Fully compatible with PowerPoint, Keynote, and Google Slides.


26 diapositivas
Digital Art Tools and Techniques Presentation
Unleash your creativity with this vibrant presentation on digital art tools and techniques. Covering essential topics like graphic design software, digital brushes, layering methods, and creative workflows, this template helps artists and designers enhance their skills. Fully customizable and compatible with PowerPoint, Keynote, and Google Slides for a seamless and visually stunning presentation experience.
8 diapositivas
Directional Arrow Timeline Flow
Highlight key milestones or project phases with this smooth, flowing arrow timeline layout. Designed for project managers, team leads, and strategists to showcase sequential steps, launch plans, or performance stages. Fully customizable in PowerPoint, Keynote, and Google Slides—change icons, colors, and text to match your brand style.


4 diapositivas
Current vs Future State Gap Presentation
Take your audience on a journey of progress with this dynamic slide, designed to clearly compare where things stand today and where they’re headed next. It helps highlight key gaps, improvement areas, and strategic opportunities with a simple, visual flow. Fully compatible with PowerPoint, Keynote, and Google Slides.


6 diapositivas
Business Security Compliance Presentation
Visualize your security framework with this clear and modern infographic layout. This slide is ideal for presenting compliance steps, risk assessments, or regulatory requirements, featuring a shield-centered hub with 5 editable sections. Customize easily in PowerPoint, Keynote, or Google Slides.


6 diapositivas
South America Biome Map Infographics
Explore our adaptable South America Biome Map infographic template, a powerful resource for visualizing the diverse ecosystems found across the South American continent. This template is fully compatible with popular presentation software such as PowerPoint, Keynote, and Google Slides, enabling you to easily customize it to suit your specific needs. The South America Biome Map infographic template serves as a flexible canvas for illustrating information about various biomes, including rainforests, grasslands, deserts, and more. Whether you're an educator, environmental enthusiast, or simply intrigued by South America's ecology, this template offers an intuitive platform to create informative presentations and educational materials. Impress your audience with this SEO-optimized South America Biome Map infographic template, expertly designed for clarity and user-friendliness. Customize it to showcase the unique features and biodiversity of South America's biomes, making it an invaluable tool for your projects and presentations. Get started on crafting your personalized infographic today!


7 diapositivas
Business Office Scenes Infographic Presentation
Office Scene Infographics can be a valuable tool for businesses or organizations that want to showcase their workplace culture or attract potential employees by providing a visual representation of what it's like to work at their company. This template is designed to provide a visual representation of different office scenarios and activities. The template is fully customizable and can be used for a variety of purposes, such as internal communication, training, marketing, and educational. It has a unique design, easy customization, and compatibility with Powerpoint, Keynote and Google Slides.


8 diapositivas
Business Growth Strategies Presentation
Take your vision from concept to expansion with a sleek, modern presentation designed to highlight progress and future potential. Ideal for showcasing goals, performance metrics, and market strategies, it keeps your ideas structured and engaging. Fully compatible with PowerPoint, Keynote, and Google Slides for effortless customization and presentation delivery.


5 diapositivas
HIV Treatment & Awareness Infographics
Explore the critical realms of healthcare with our HIV treatment & awareness infographics. Rendered in striking shades of red and blue, this vertical, informative, and creatively designed template serves as a profound educational tool. It's intricately crafted for healthcare professionals, awareness campaign coordinators, and community health educators, providing a visual journey through the complexities of HIV understanding. This infographic includes compelling graphics and relevant icons, making it indispensable for those seeking to inform, prevent, and empower communities about HIV. Elevate awareness with clarity and a deep sense of humanity, one fact at a time.


6 diapositivas
Revenue Cycle Infographic
The Revenue Cycle refers to the set of processes and activities involved in generating revenue for a business. This infographic template serves as a comprehensive guide to understanding and optimizing the revenue generation cycle. This presents the key stages, processes, metrics, and strategies involved in managing revenue in a colorful visually engaging and easy-to-understand format. With this template, you can effectively communicate the revenue cycle concepts and promote revenue optimization within your organization. Fully customizable and compatible with Powerpoint, Keynote, and Google Slides.


7 diapositivas
Concentric Circles for Data Representation Infographic
Visualize the hierarchy and relationship of your data with our Concentric Circles Infographic, an invaluable tool for data analysts, strategic planners, and educators. This infographic is designed to represent complex data in an organized, easily interpretable format. Our Concentric Circles Infographic offers a multi-layered approach to data presentation, showcasing the interconnection between different levels of information. It's perfect for displaying structures such as organizational hierarchies, market segmentation, or product feature breakdowns. Customize this infographic to highlight core elements and their dependencies or to showcase the ripple effect of central policies on various organizational branches. This SEO-friendly infographic is crafted to make your data stand out and to facilitate a quick understanding of intricate systems. Employ our Concentric Circles Infographic to bring clarity to your data, making it an insightful resource for reports, presentations, and educational materials.


26 diapositivas
Remote Work Strategies Presentation
Enhance your team's flexibility with our Remote Work Strategies presentation template, designed for use with PowerPoint, Keynote, and Google Slides. This template is an invaluable asset for team leaders, HR professionals, and business consultants dedicated to cultivating a productive remote work culture. Our template is tailored to provide an in-depth analysis of remote work best practices, offering slides that cover essential strategies for communication, collaboration, and project management in a virtual environment. It also includes insights on setting up a successful home office, maintaining work-life balance, and leveraging technology for seamless remote operations. With customizable elements, you can illustrate the advantages of remote work, share success stories, and provide actionable tips to maximize team efficiency from afar. This template is SEO-optimized to ensure your presentation reaches those seeking to optimize their remote work operations and foster a thriving digital workplace.


6 diapositivas
Tree Diagrams Stats Infographics
Our Tree Diagram Stats infographic is a highly effective tool for Powerpoint, Keynote, and Google Slides presentations, designed to aid educators, data analysts, and project managers. This infographic is structured to visually represent hierarchical information, statistical data, and decision trees in a clear and logical format. The Tree Diagram Stats infographic is ideal for illustrating the breakdown of components in a system, the steps in a process, or the choices available in a decision-making scenario. Its organized design helps viewers trace the paths from a single starting point down through multiple branches, displaying the relationship between different levels of information. Using this infographic in your slides will greatly enhance the audience's understanding of complex data sets and decision-making processes. Whether you're detailing organizational structures, process flows, or probability outcomes, this infographic provides a professional and easy-to-understand approach to presenting detailed information. It's an essential addition to any presentation requiring a clear visual mapping of data or processes.

20 diapositivas
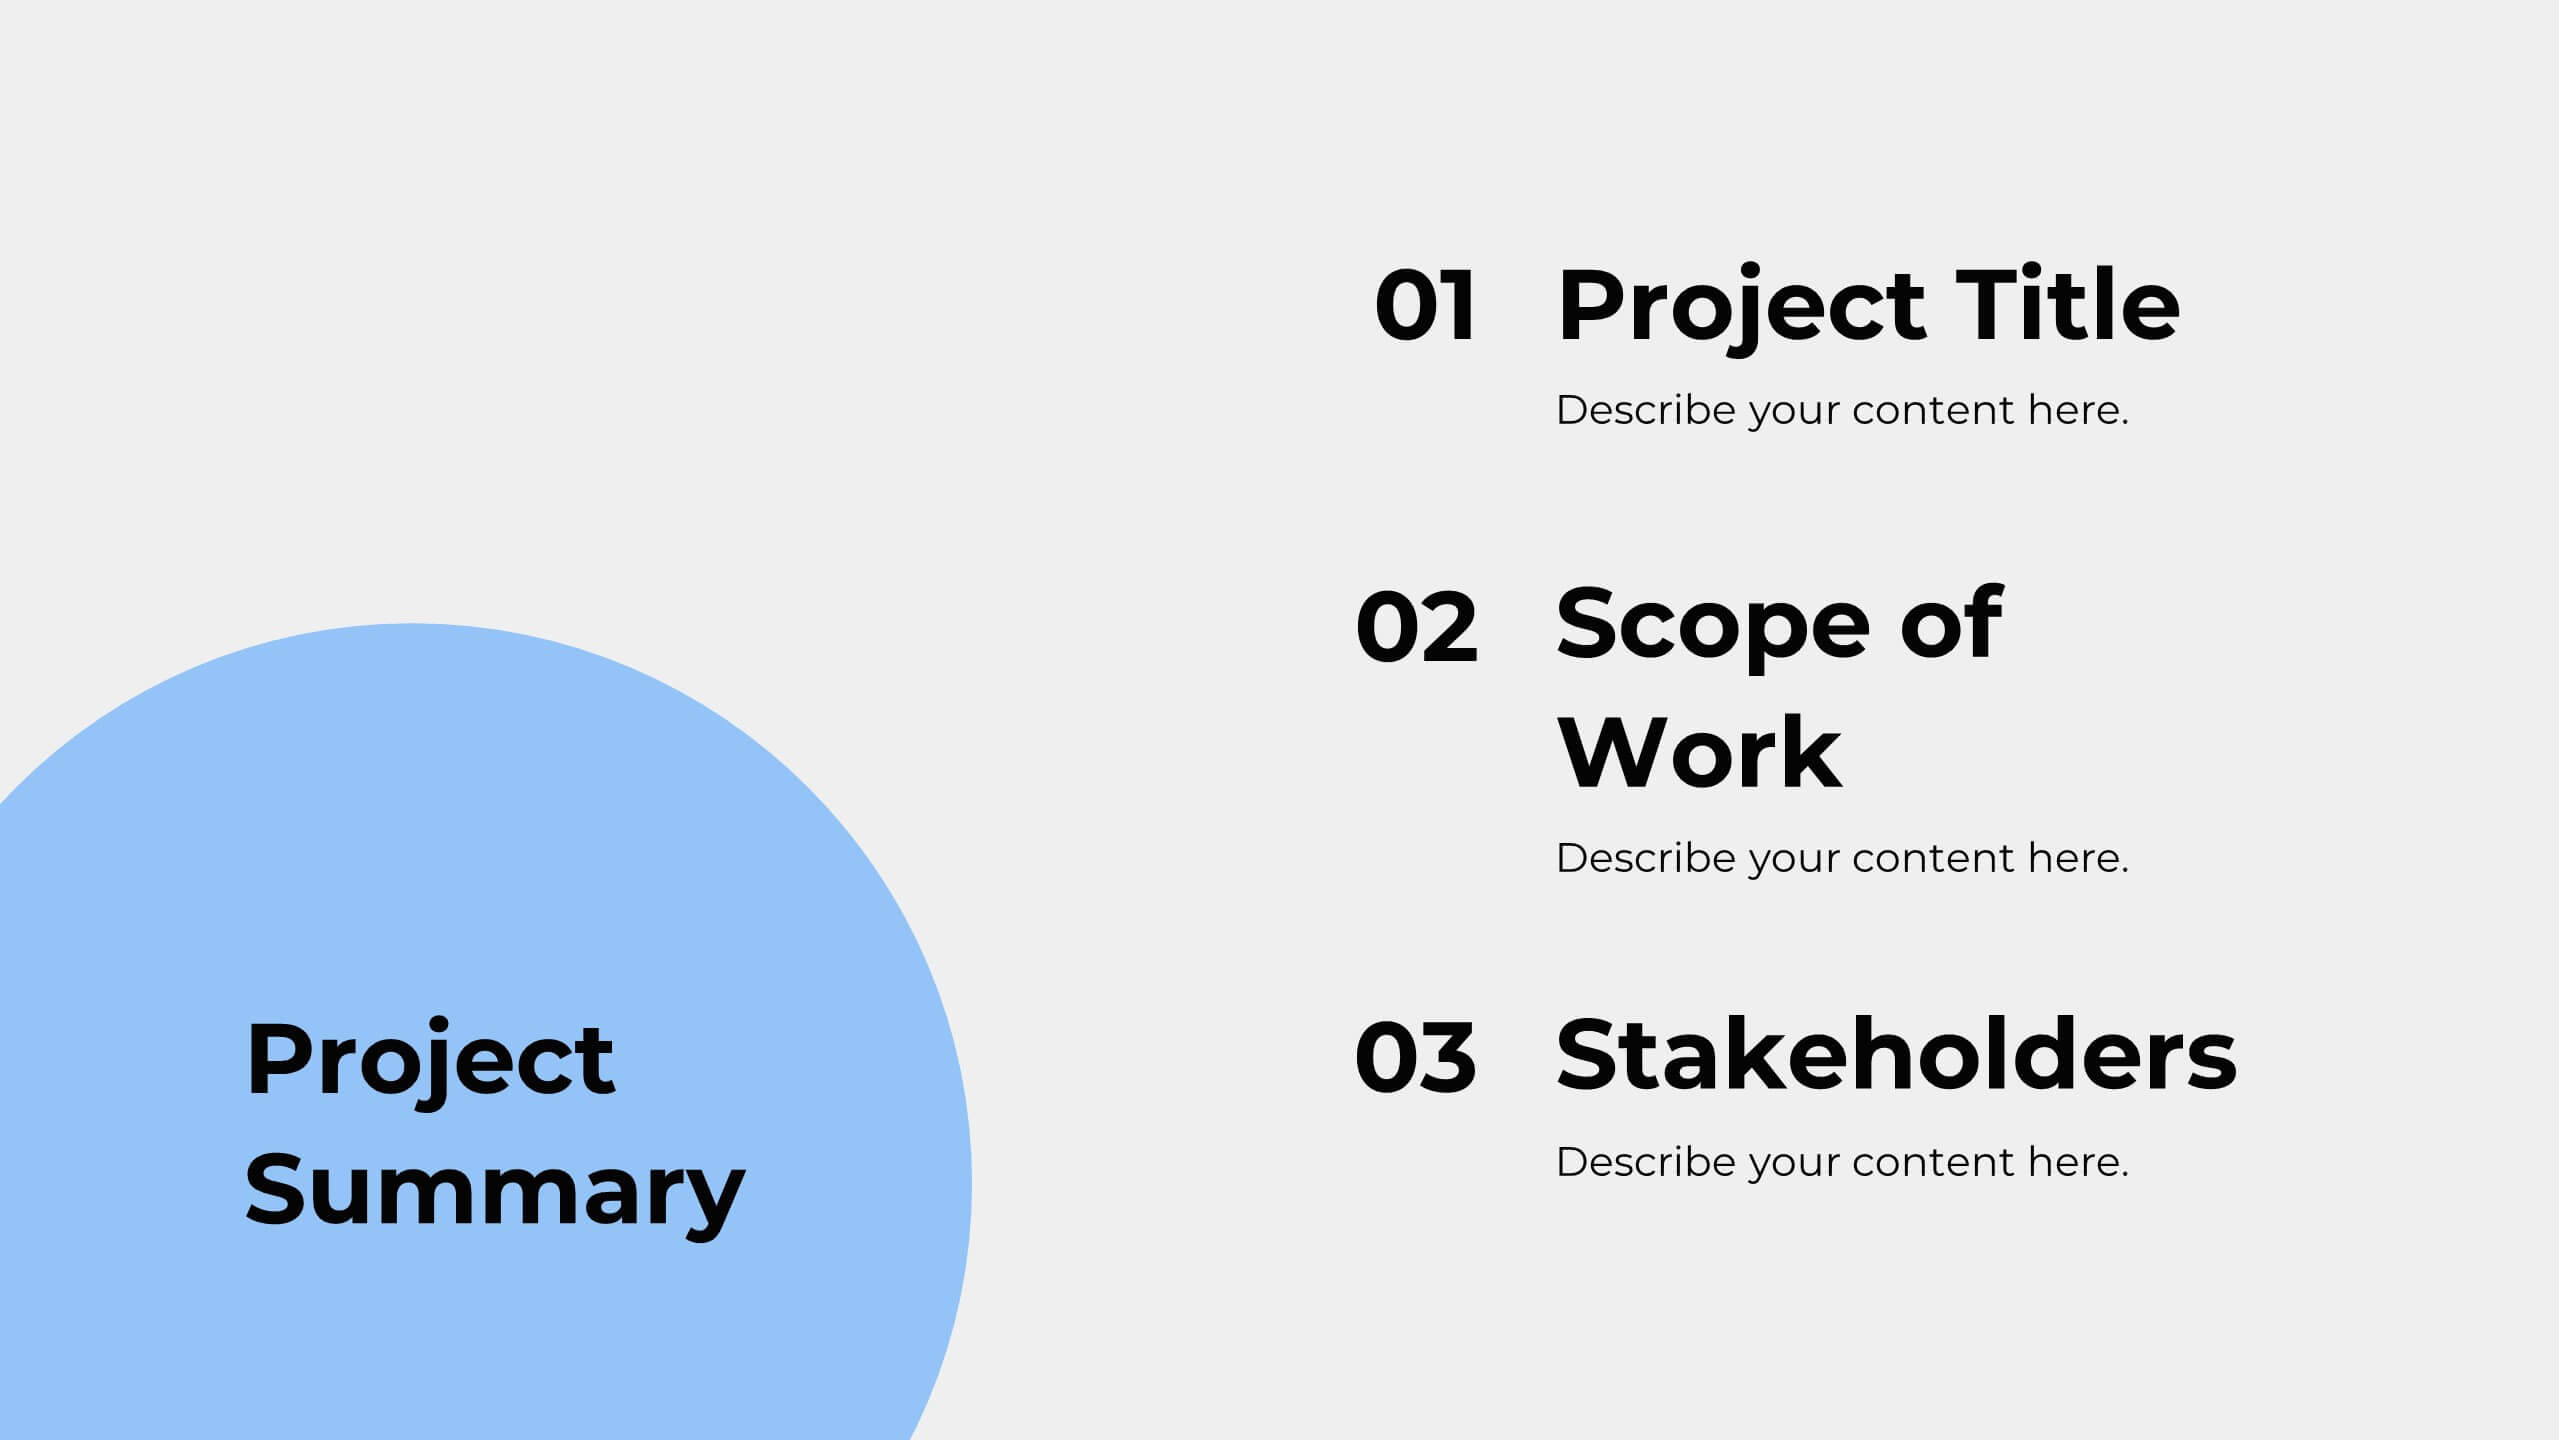
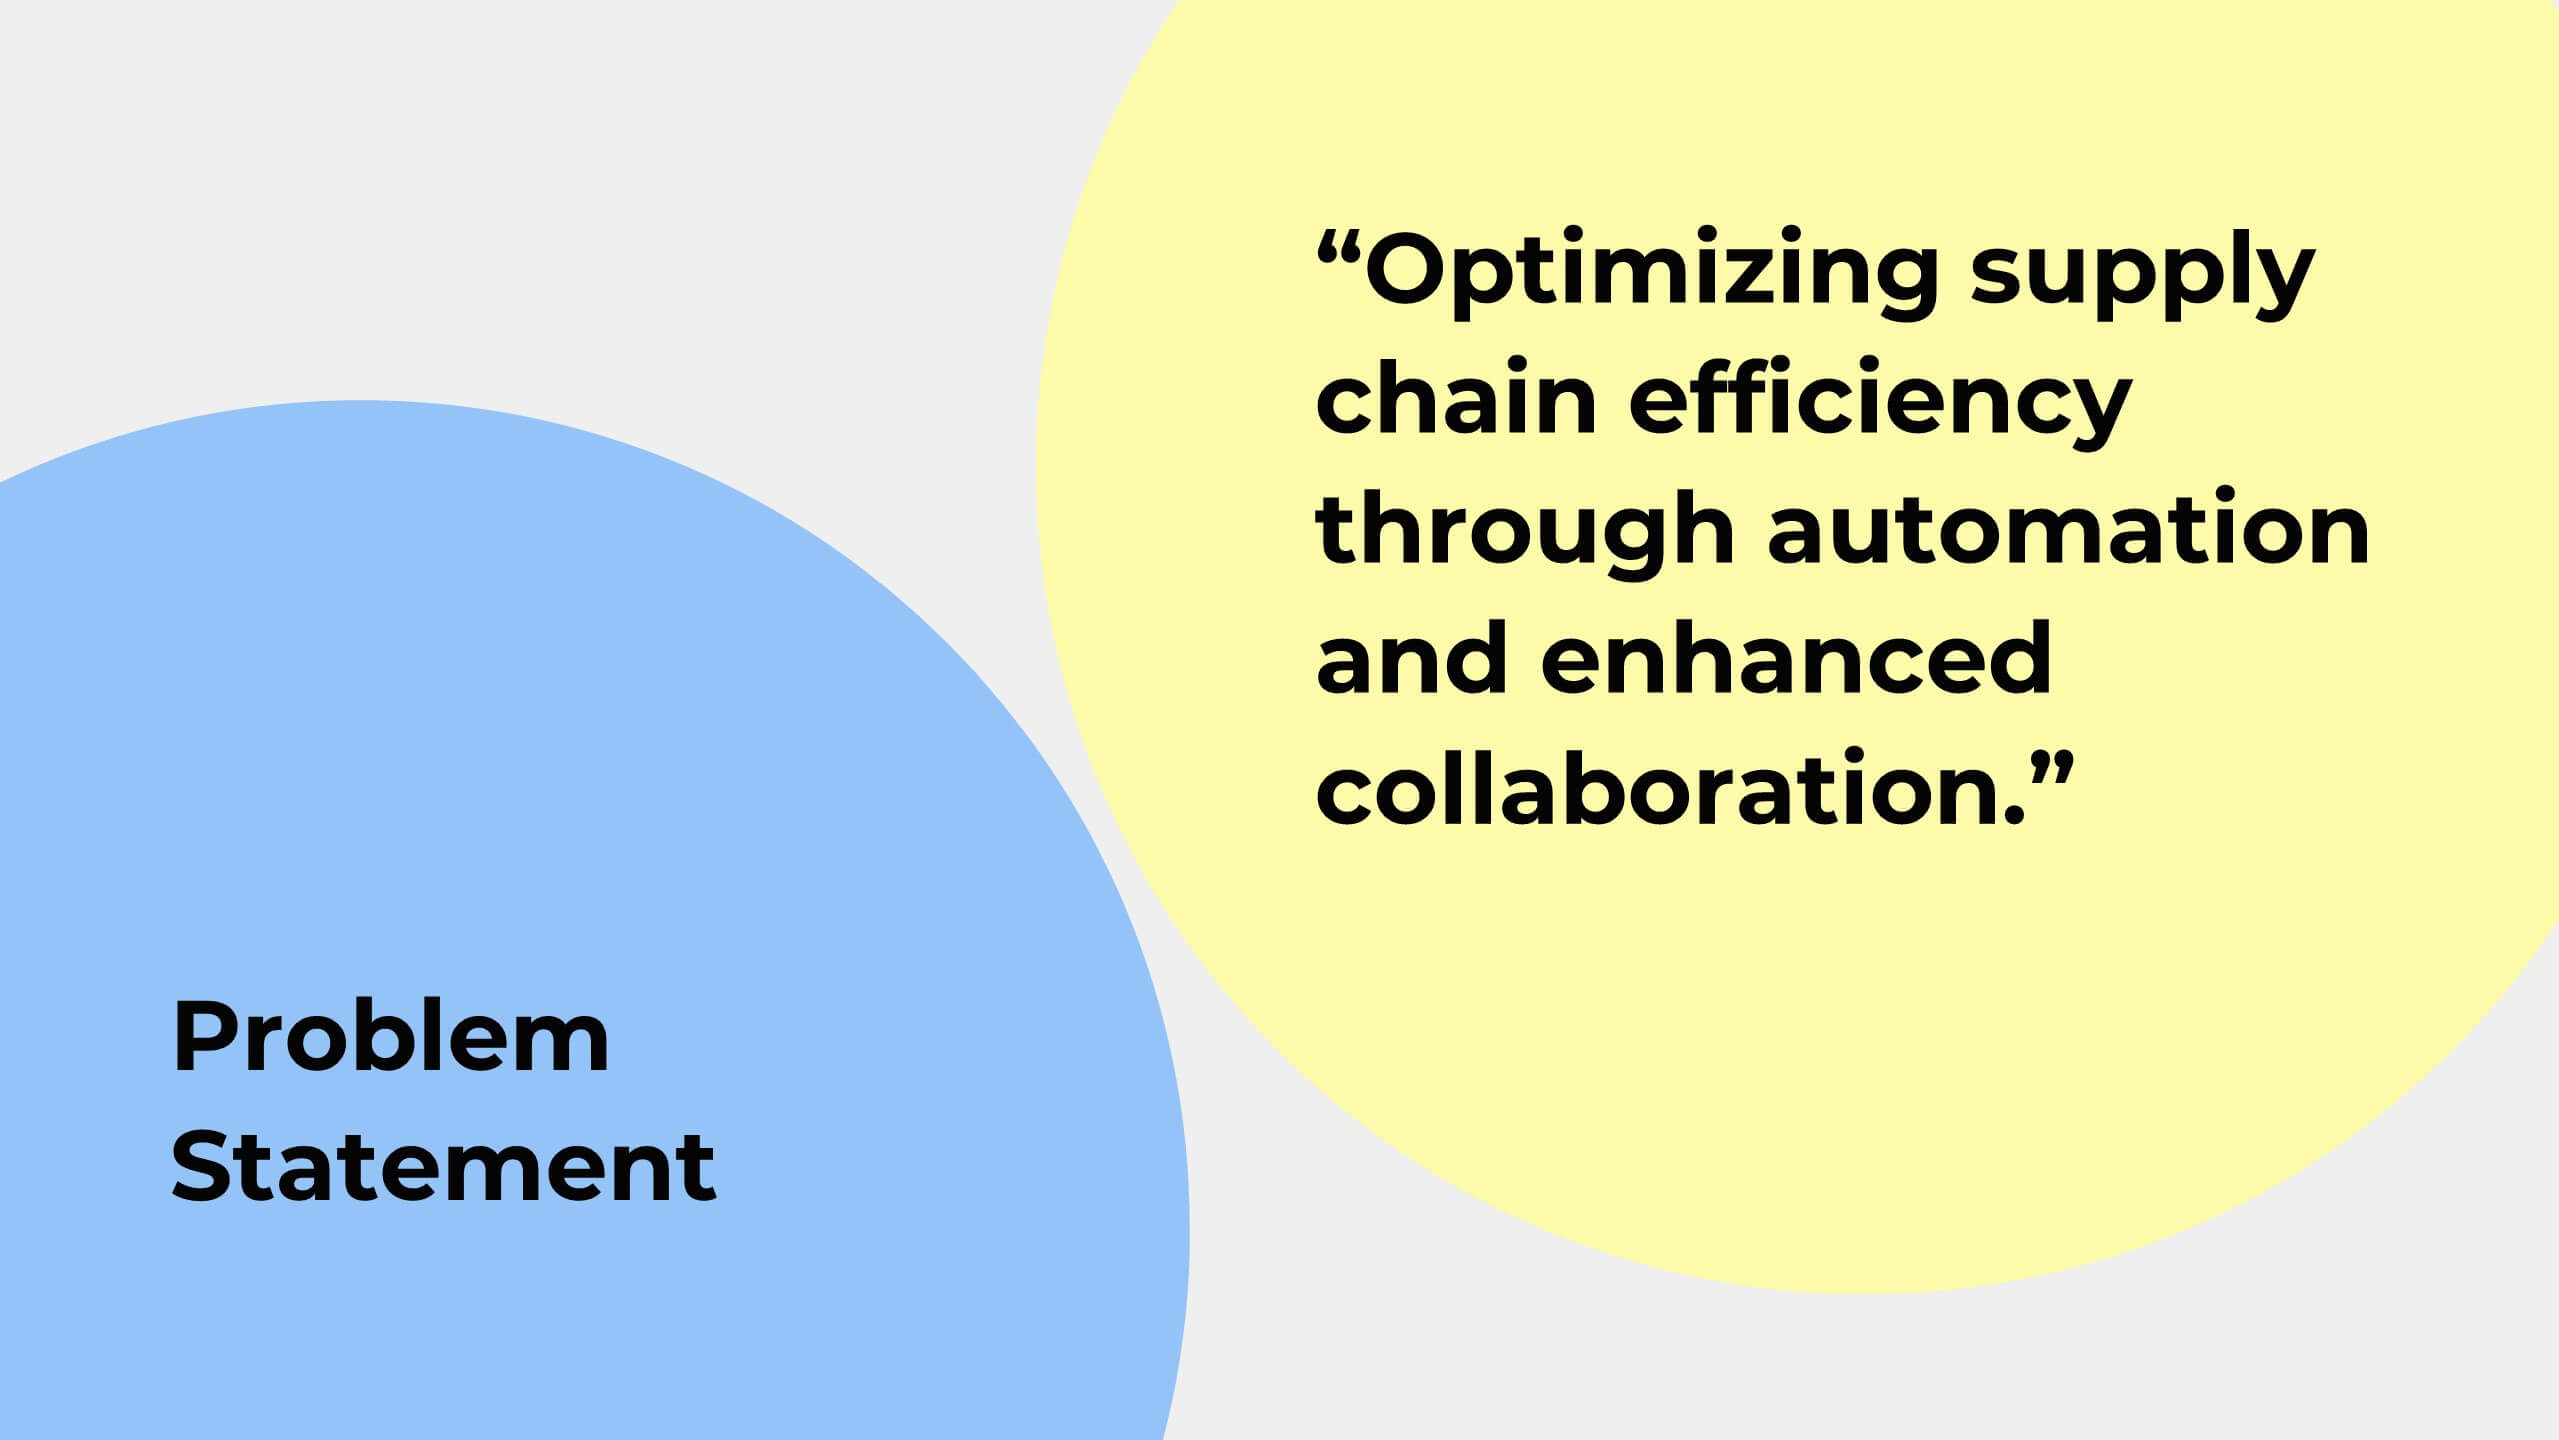
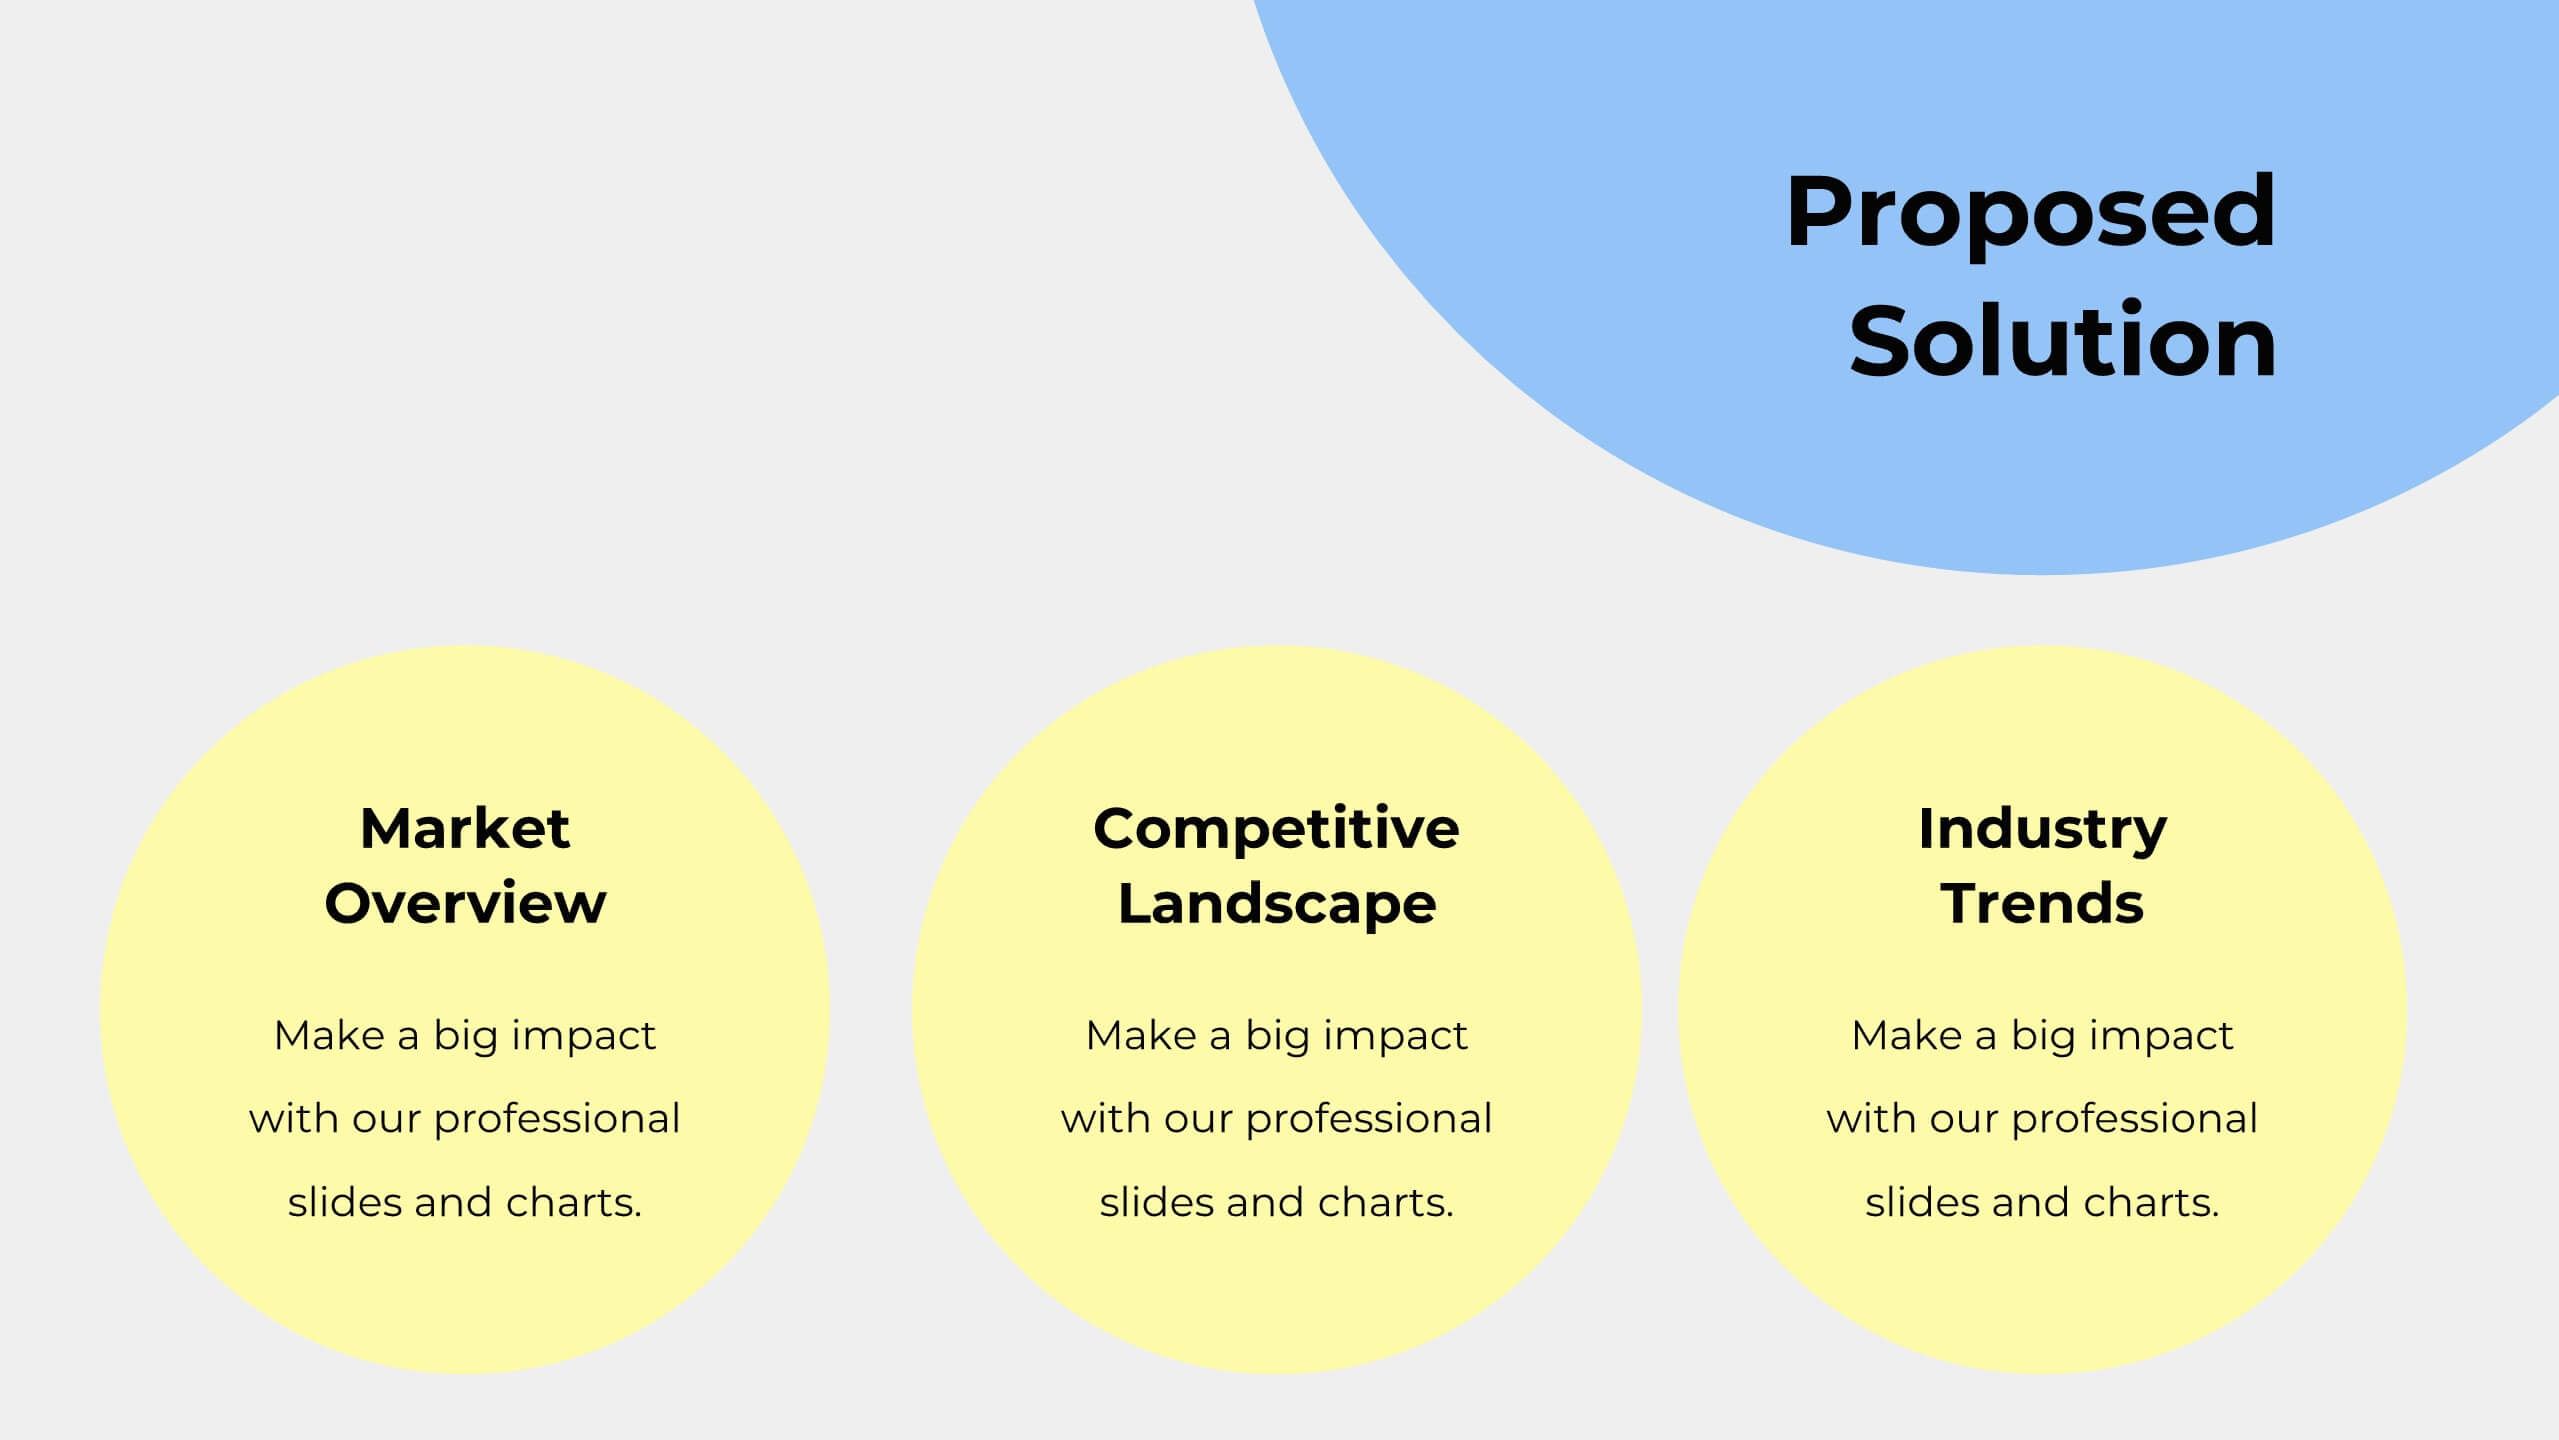
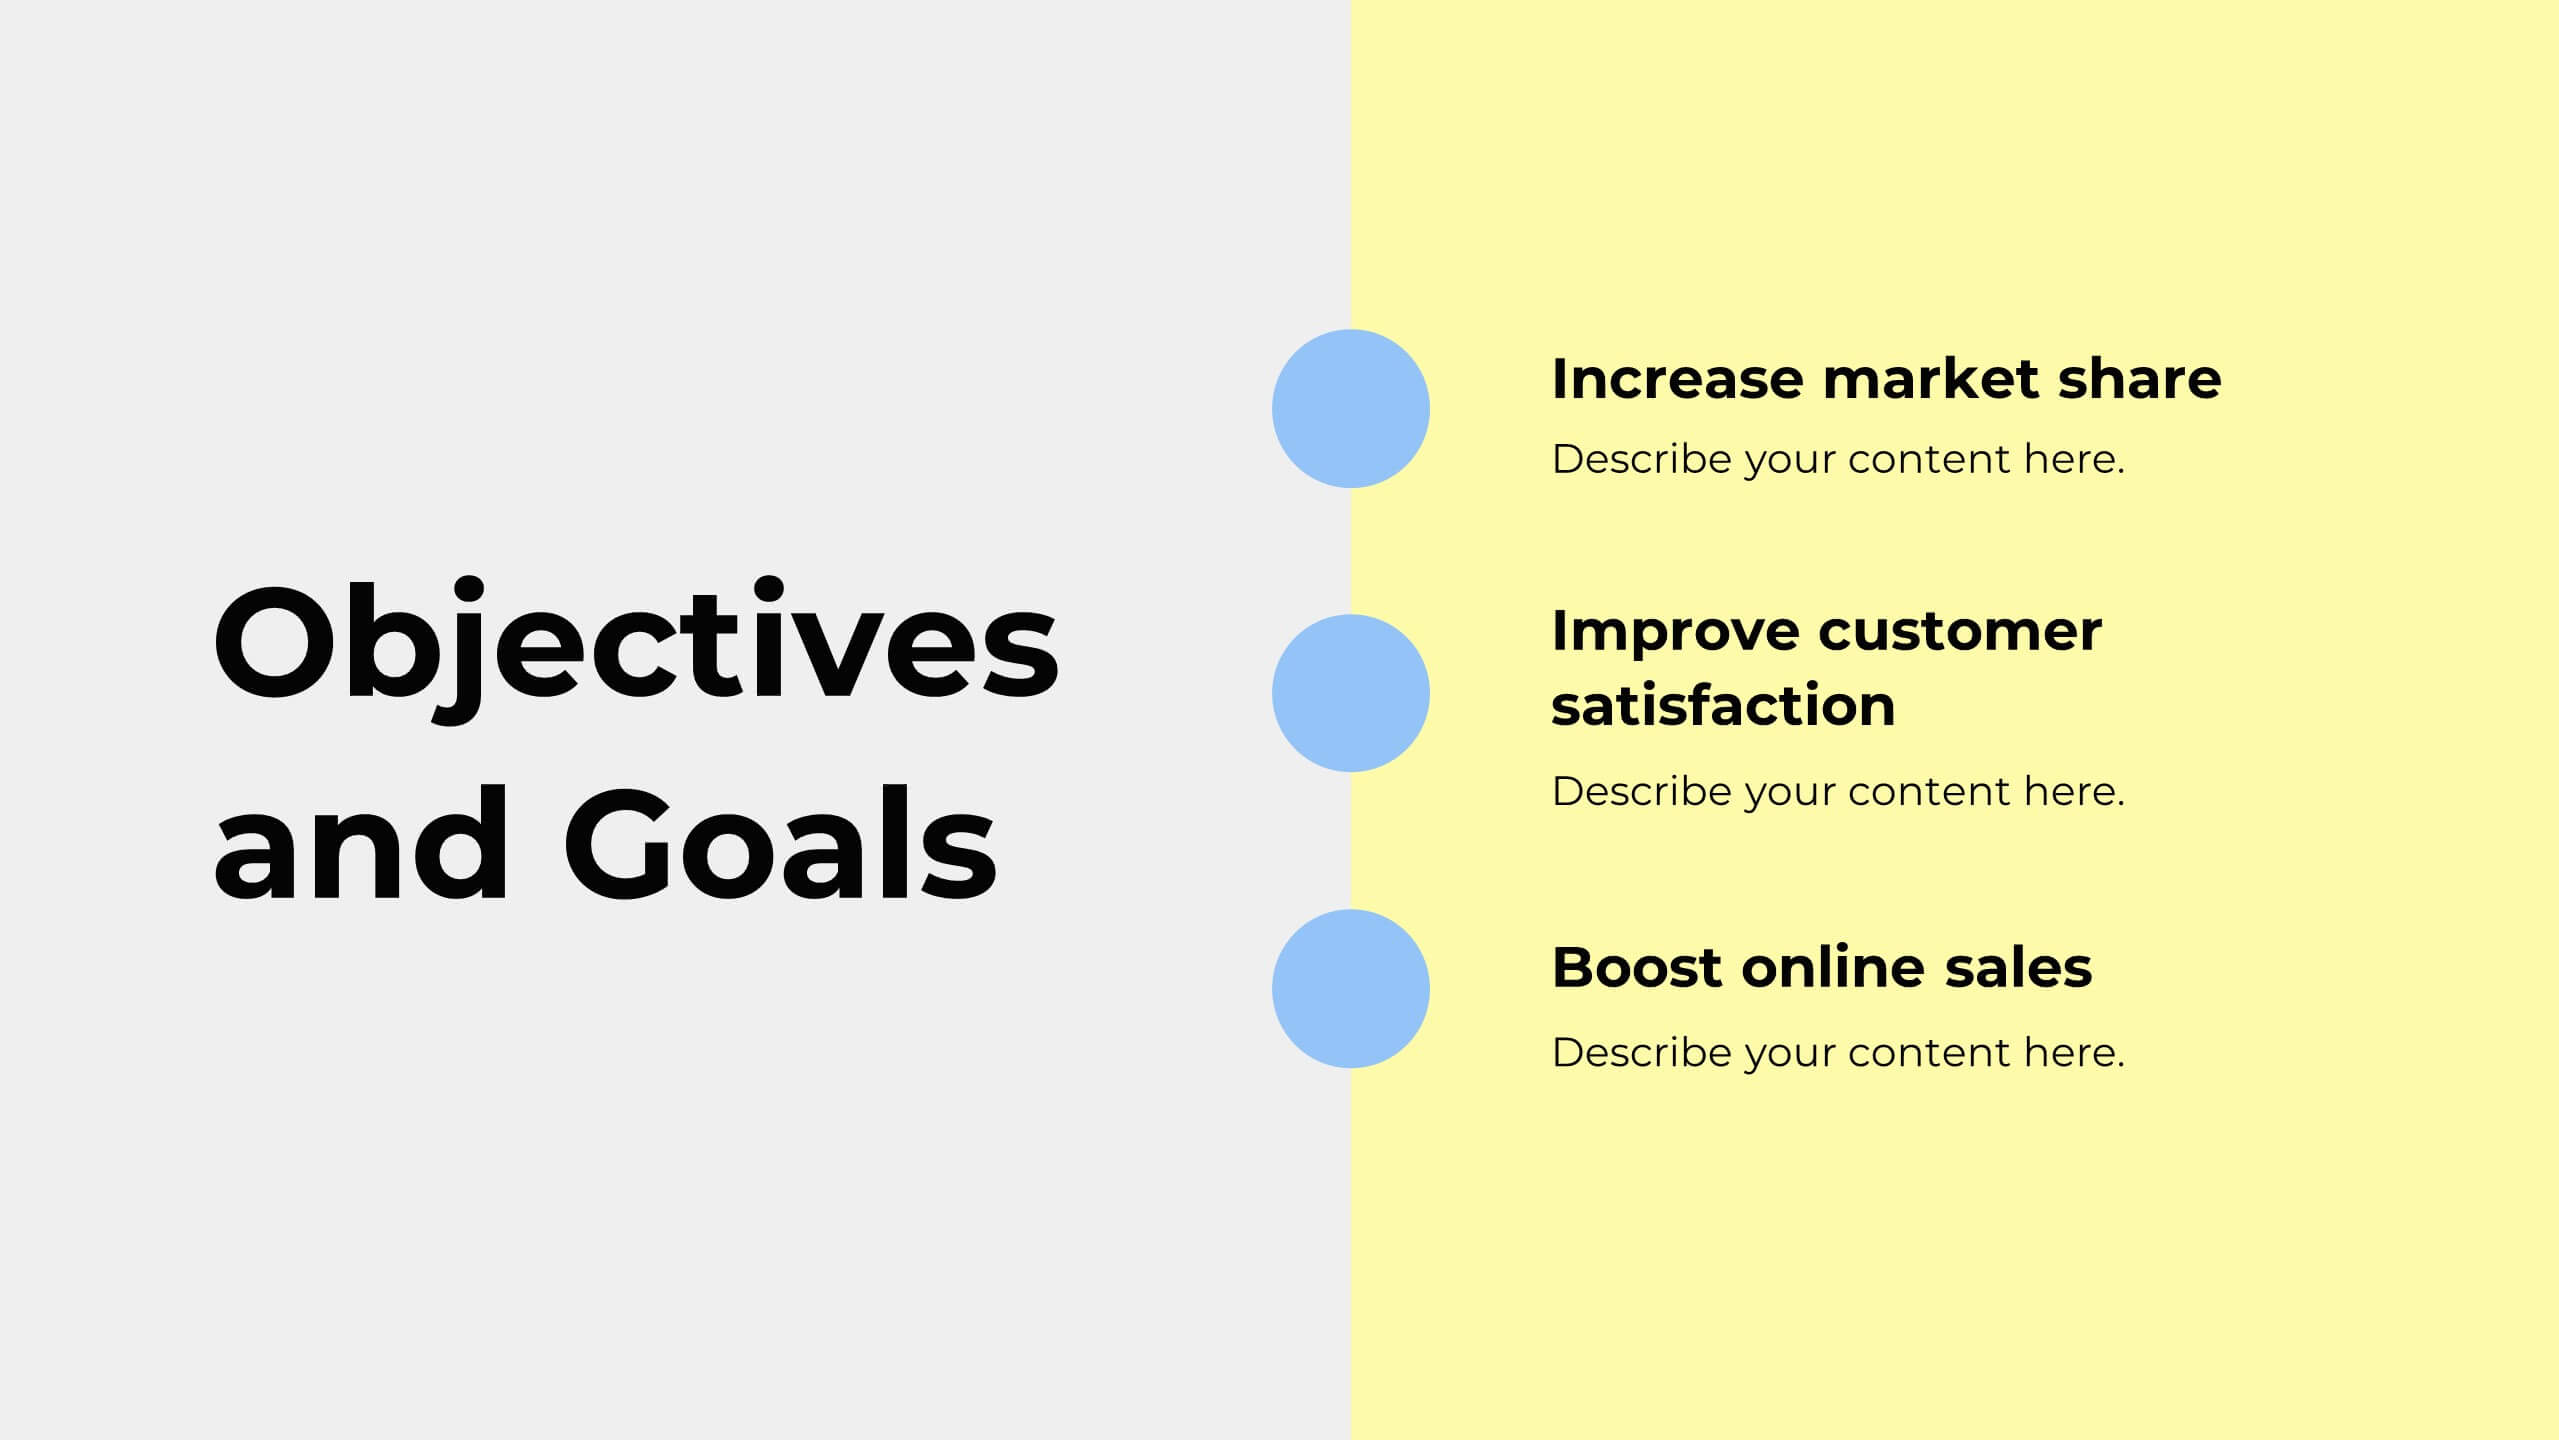
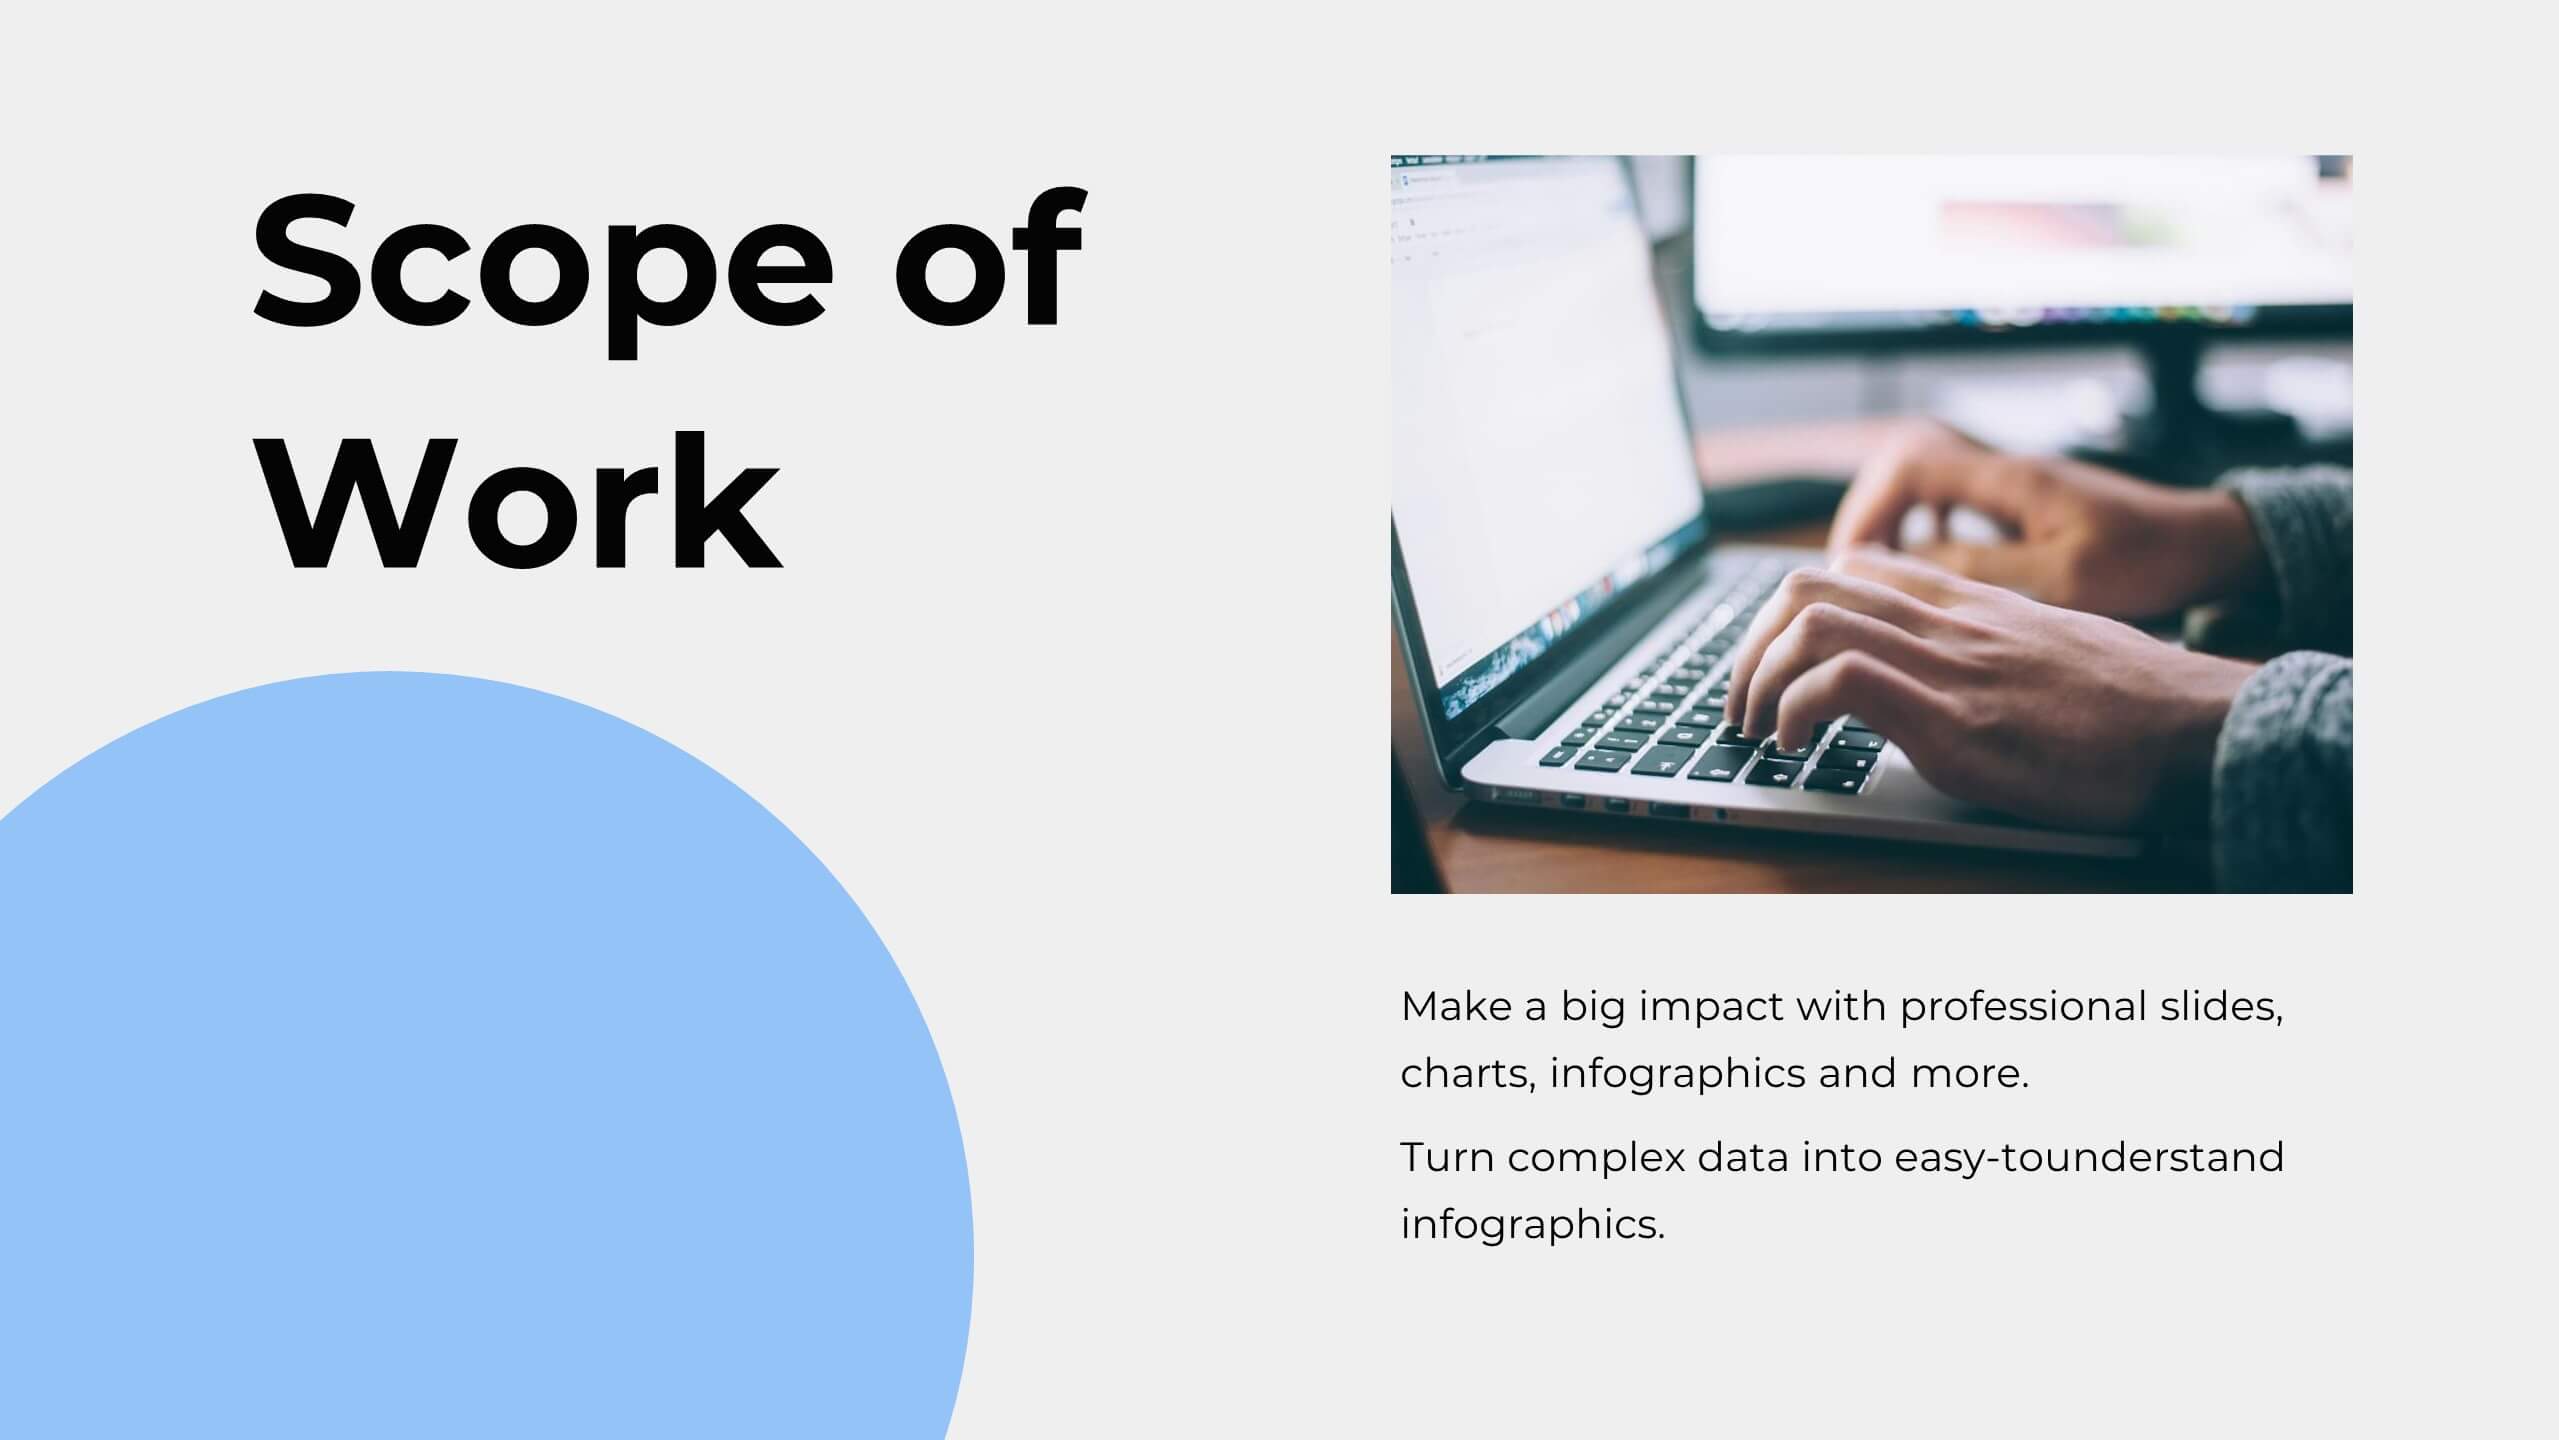
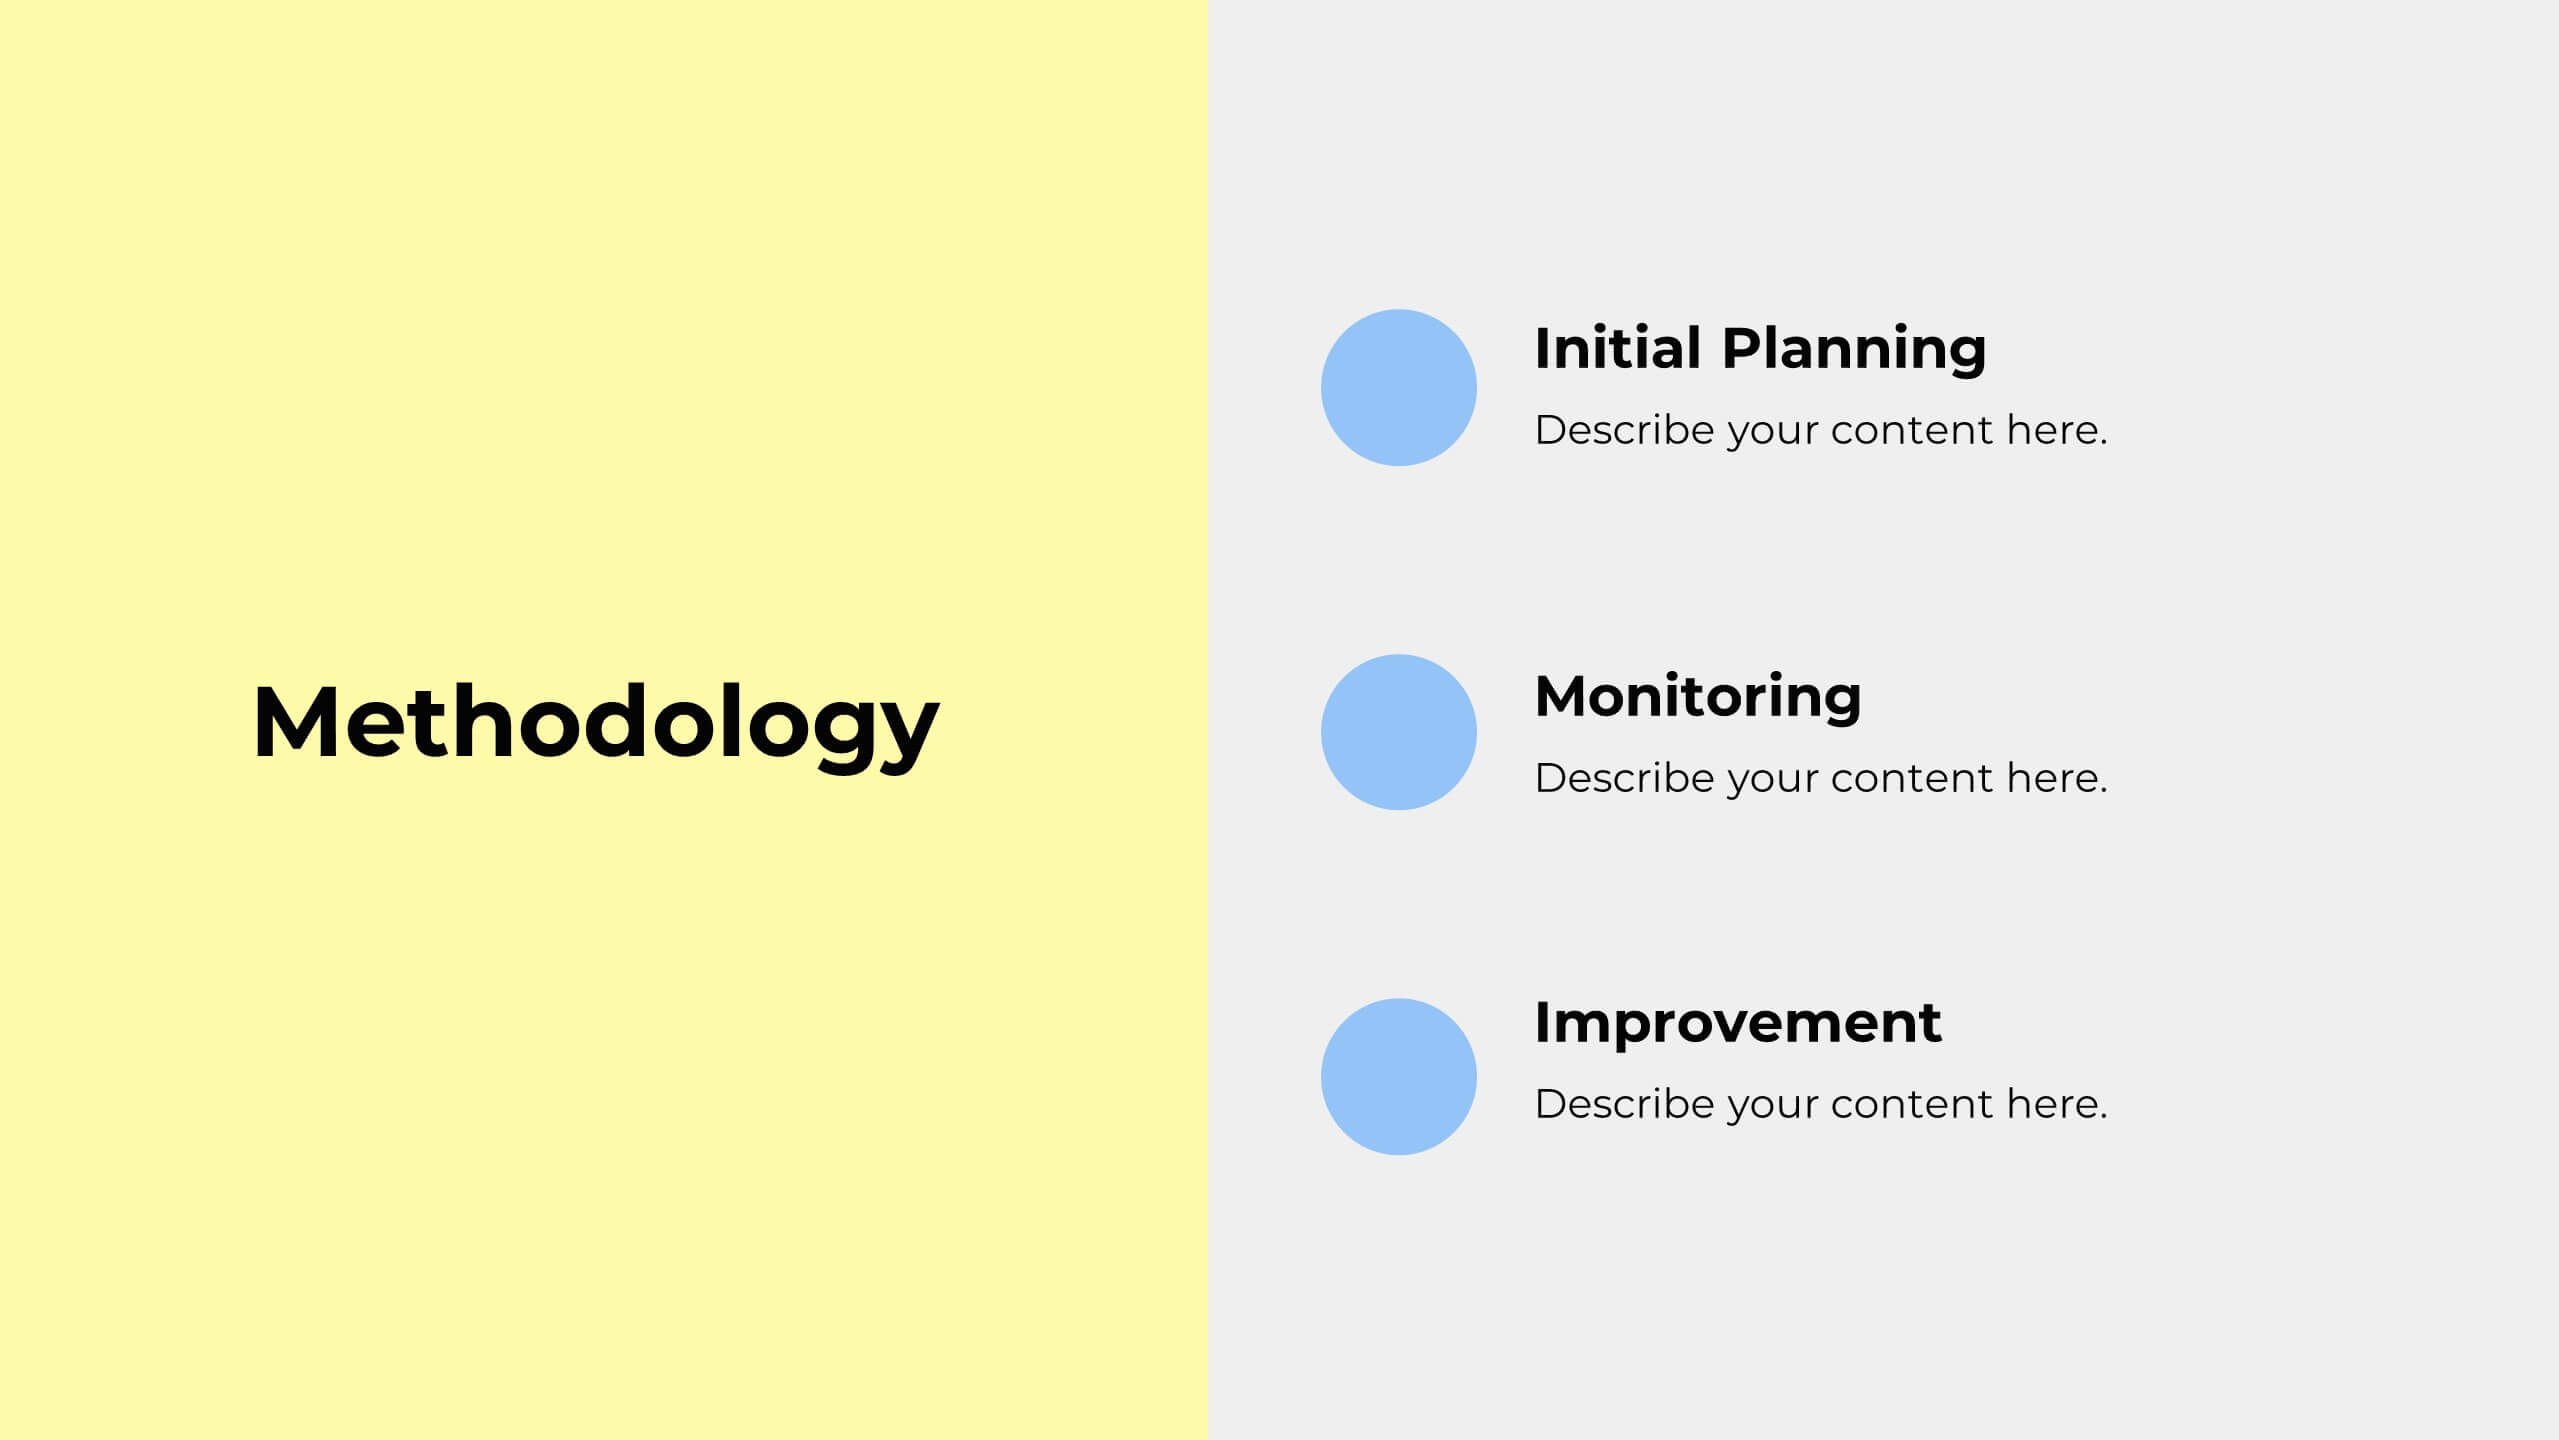
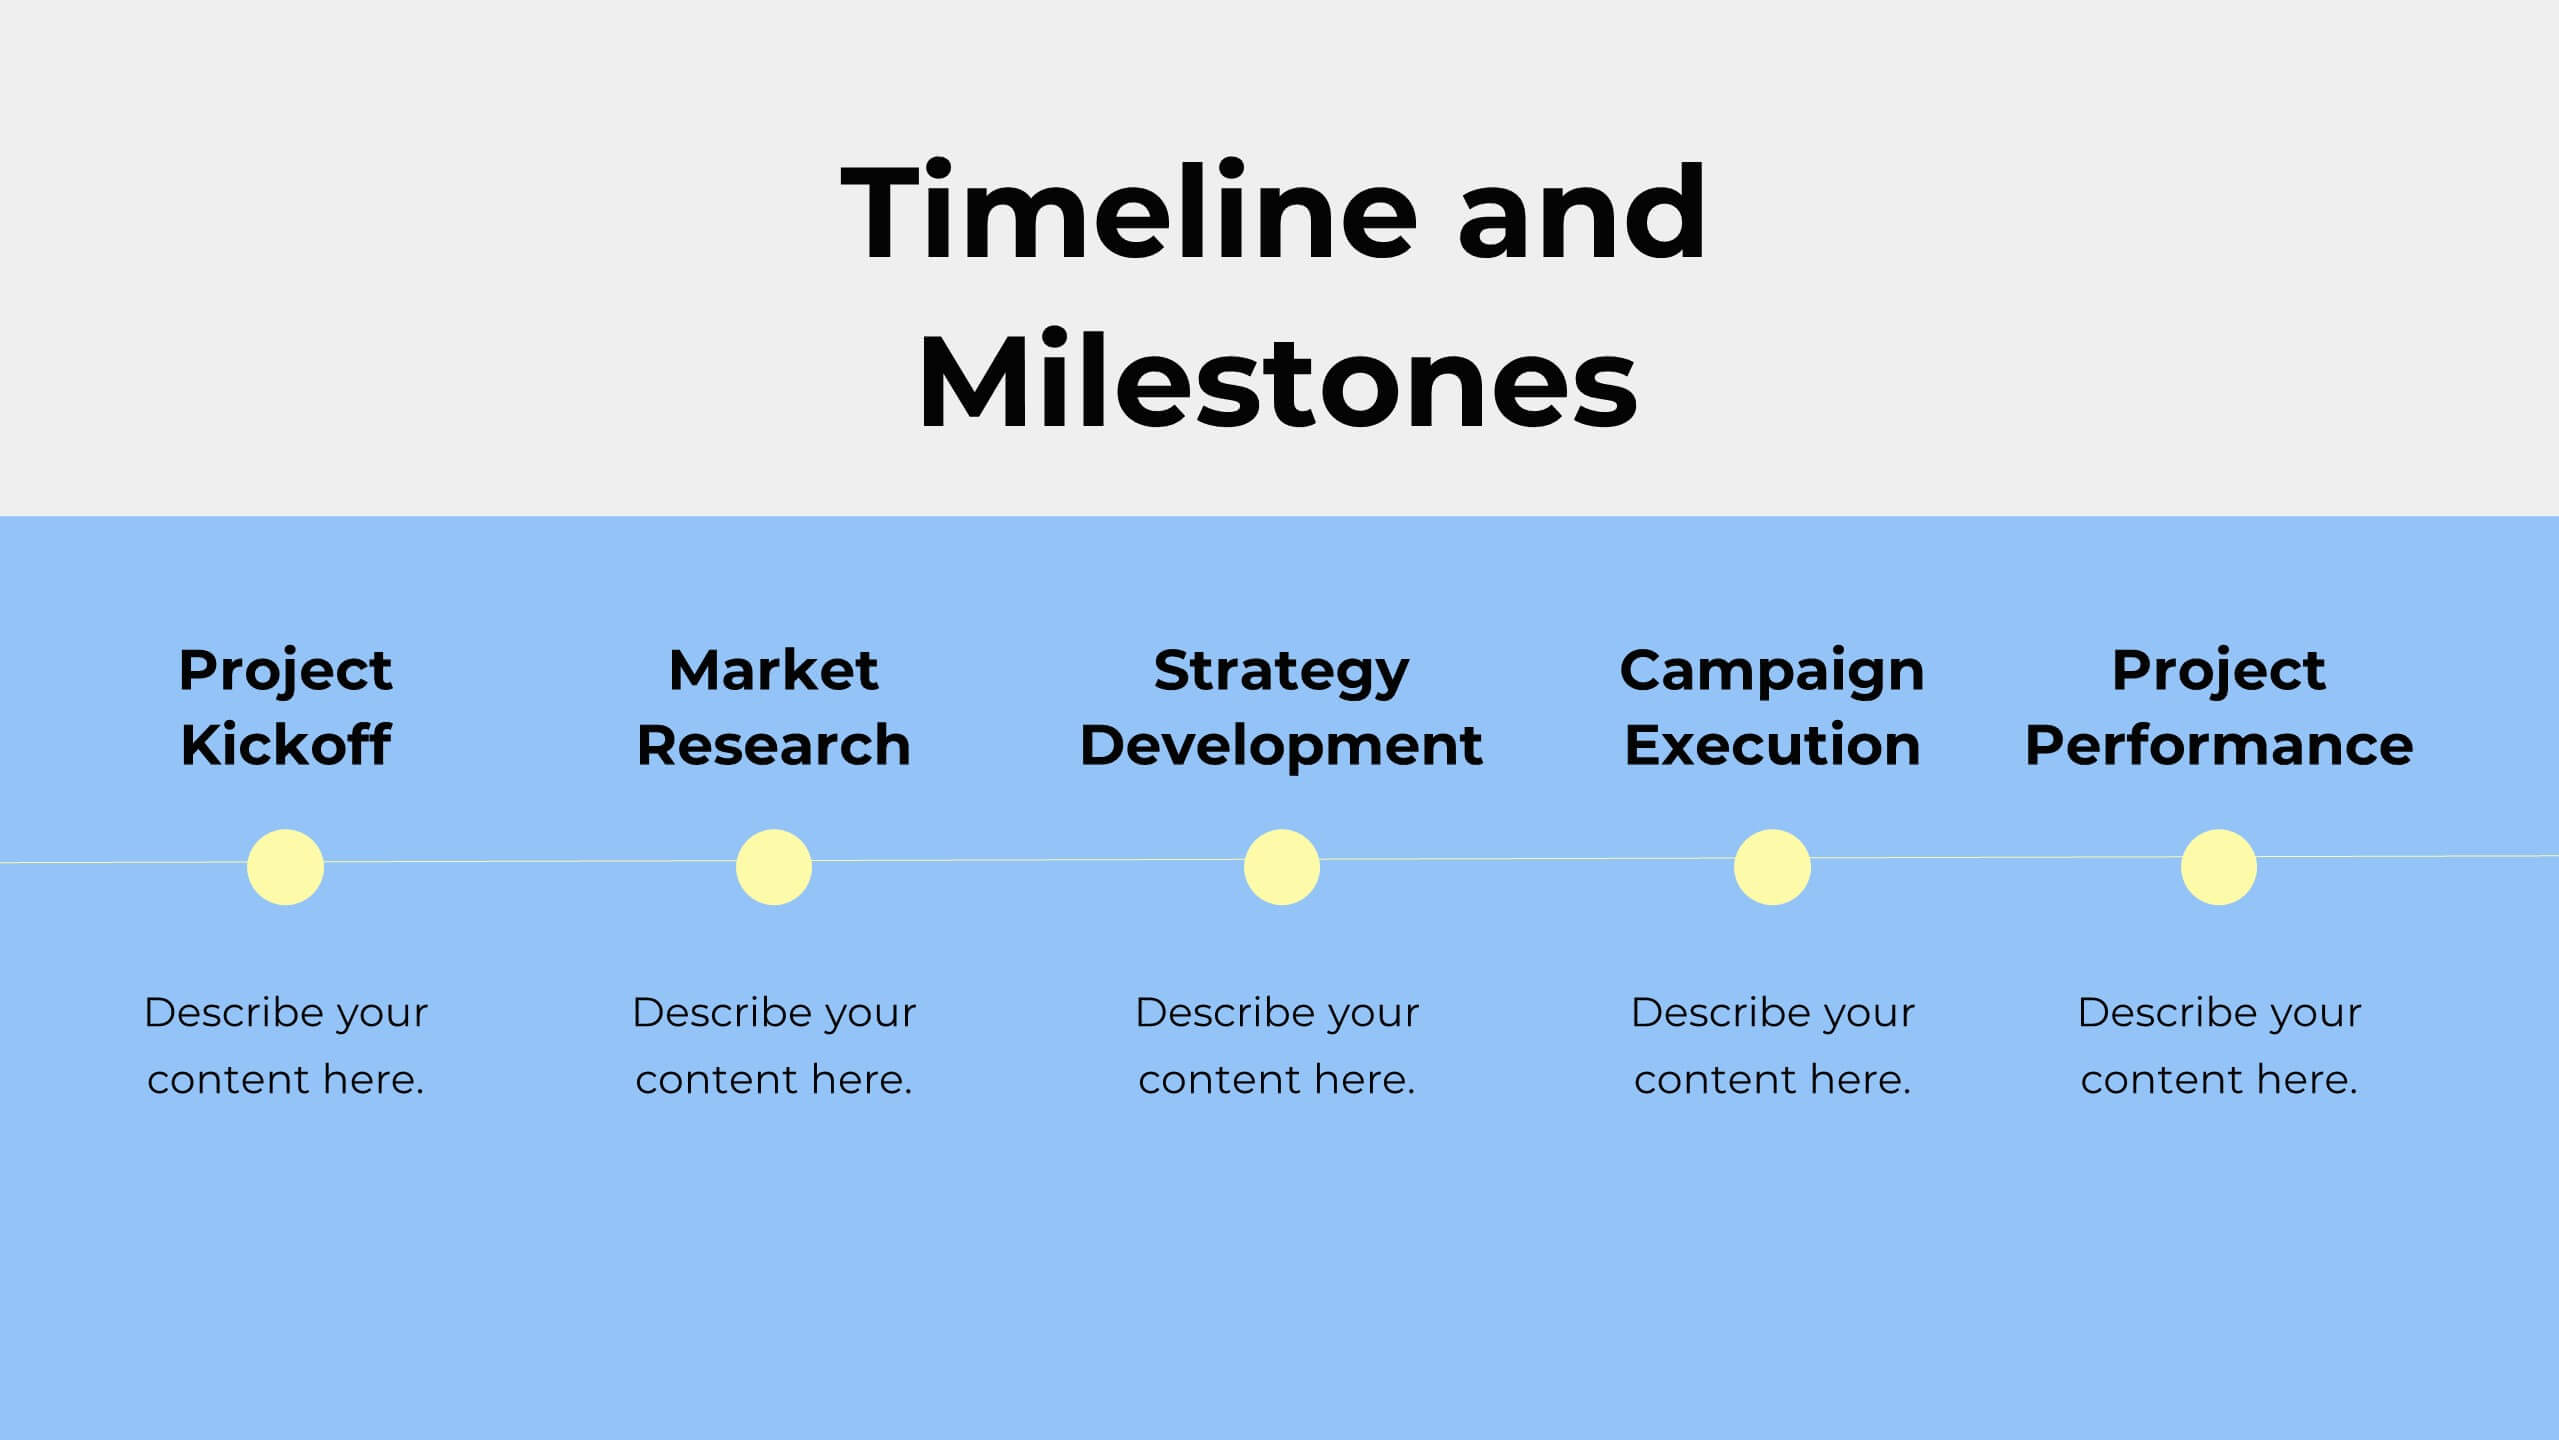
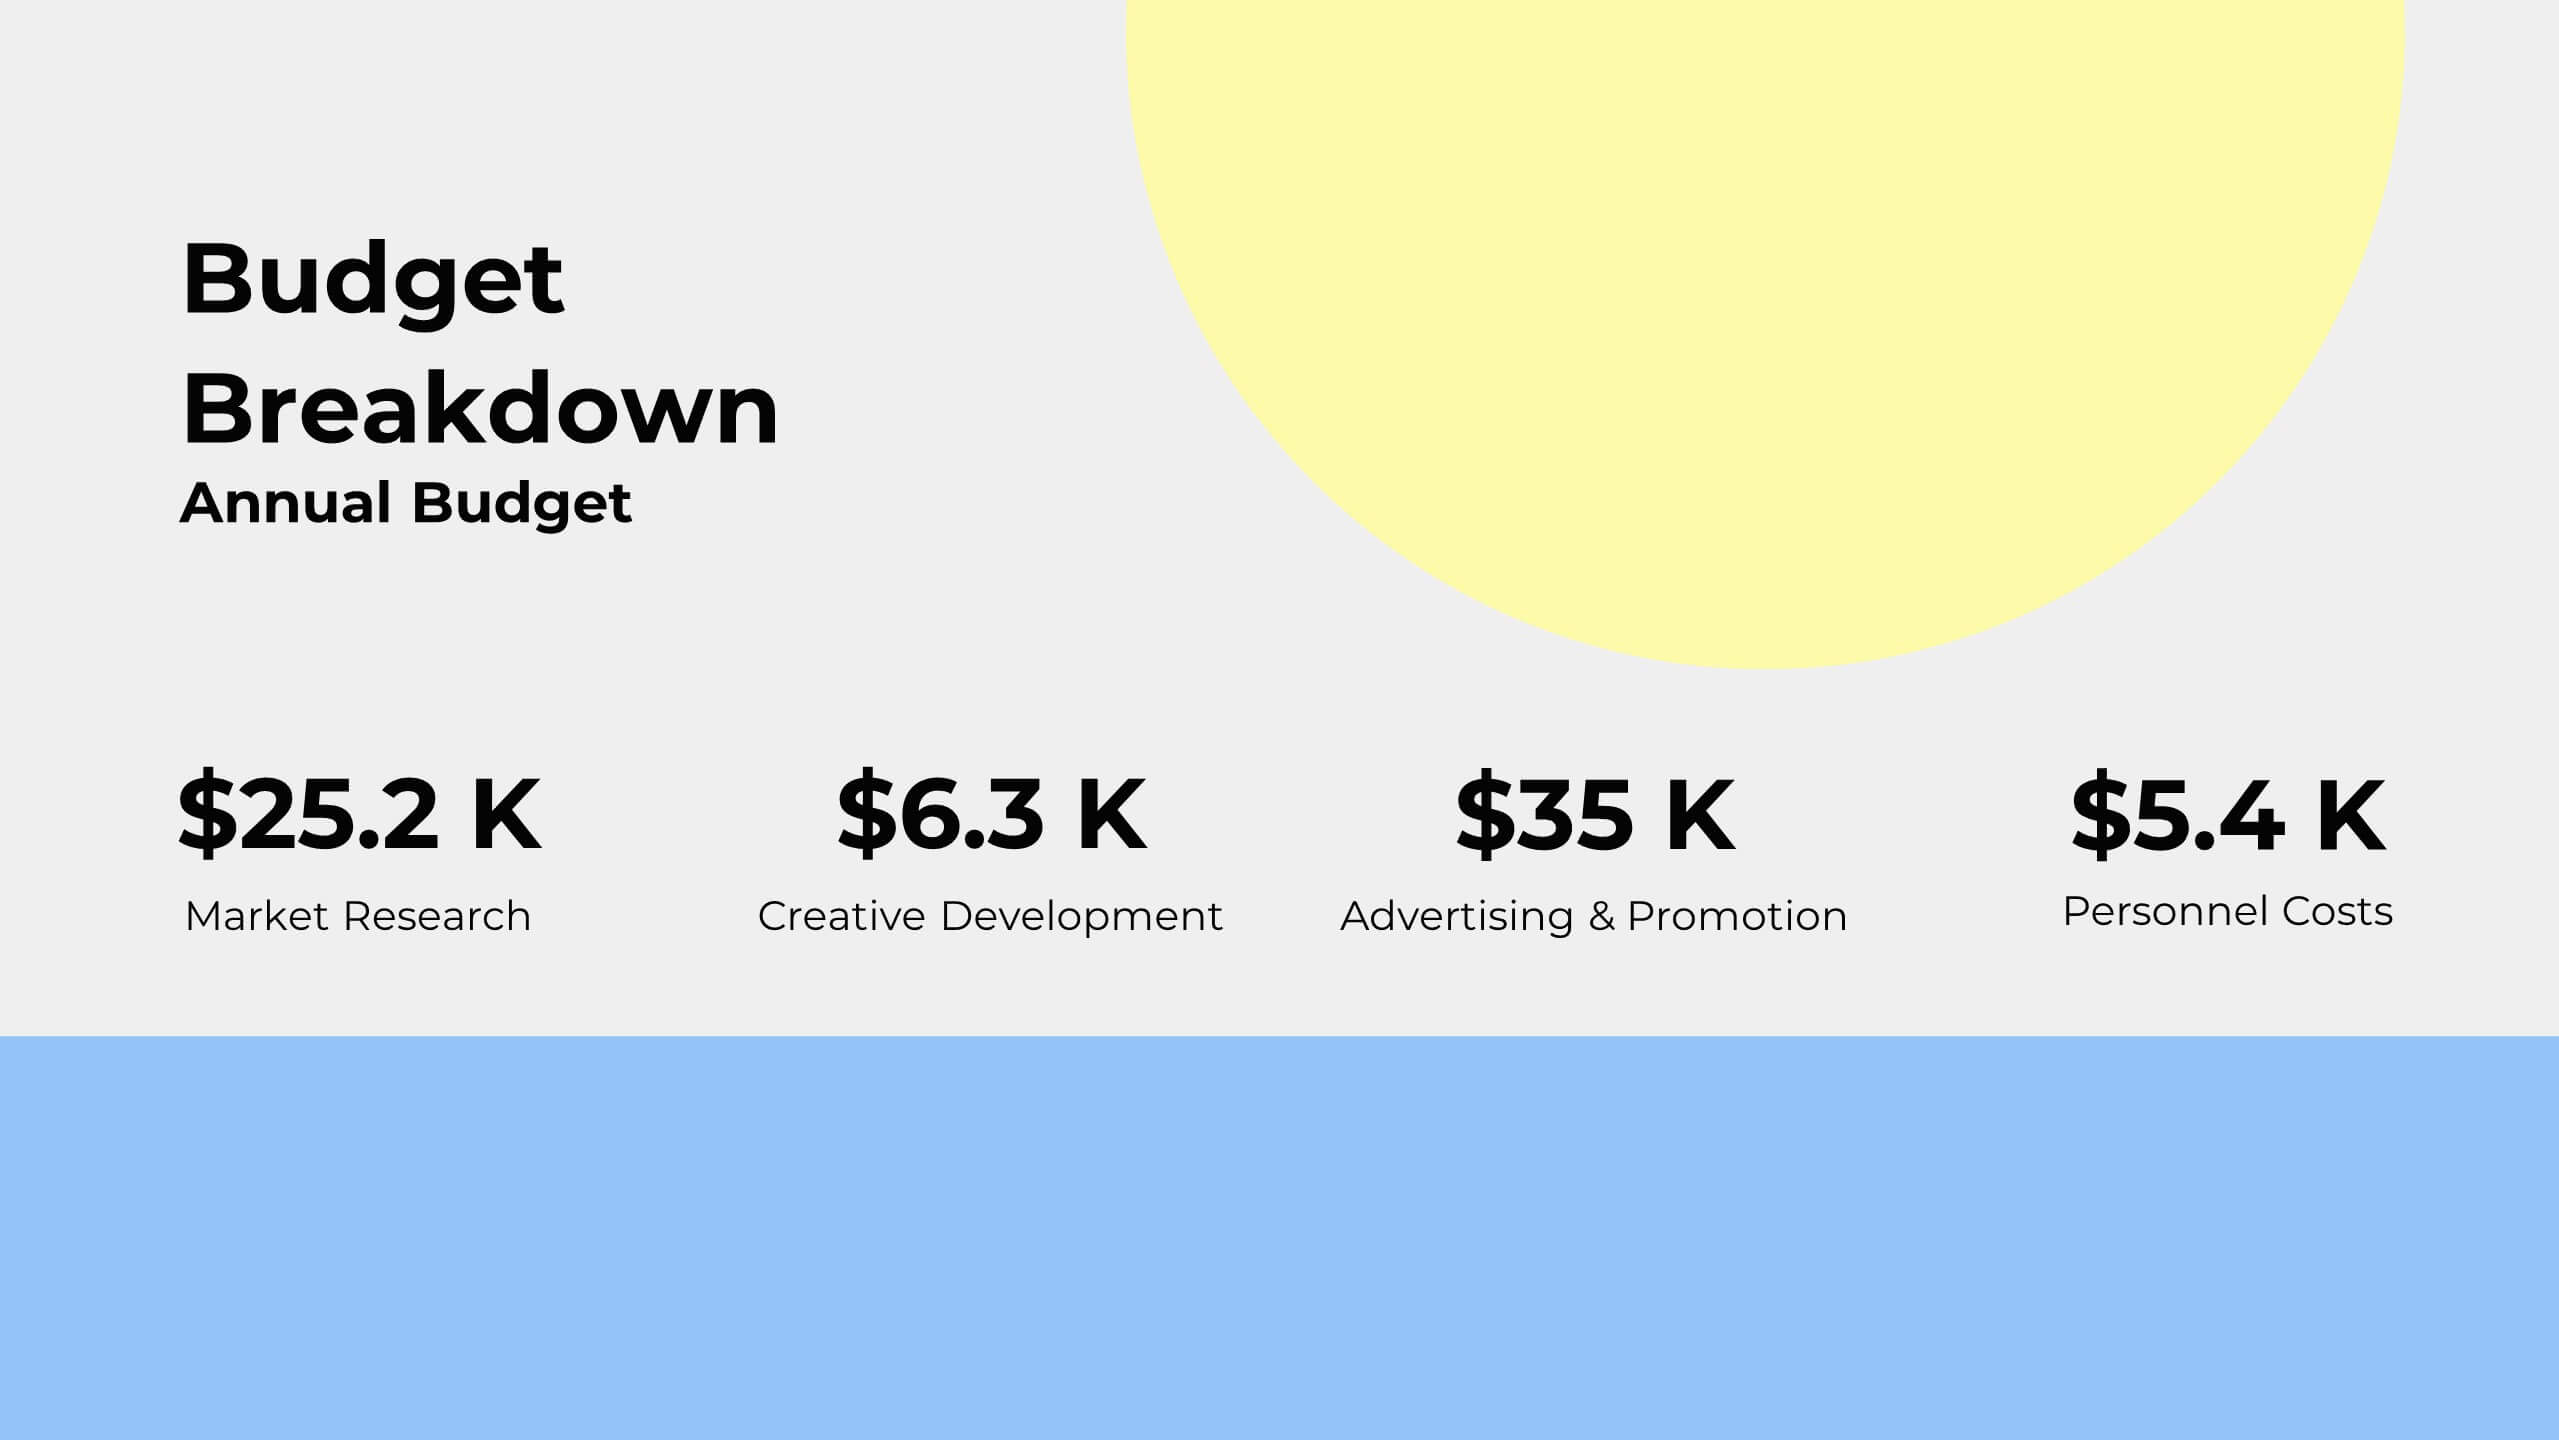
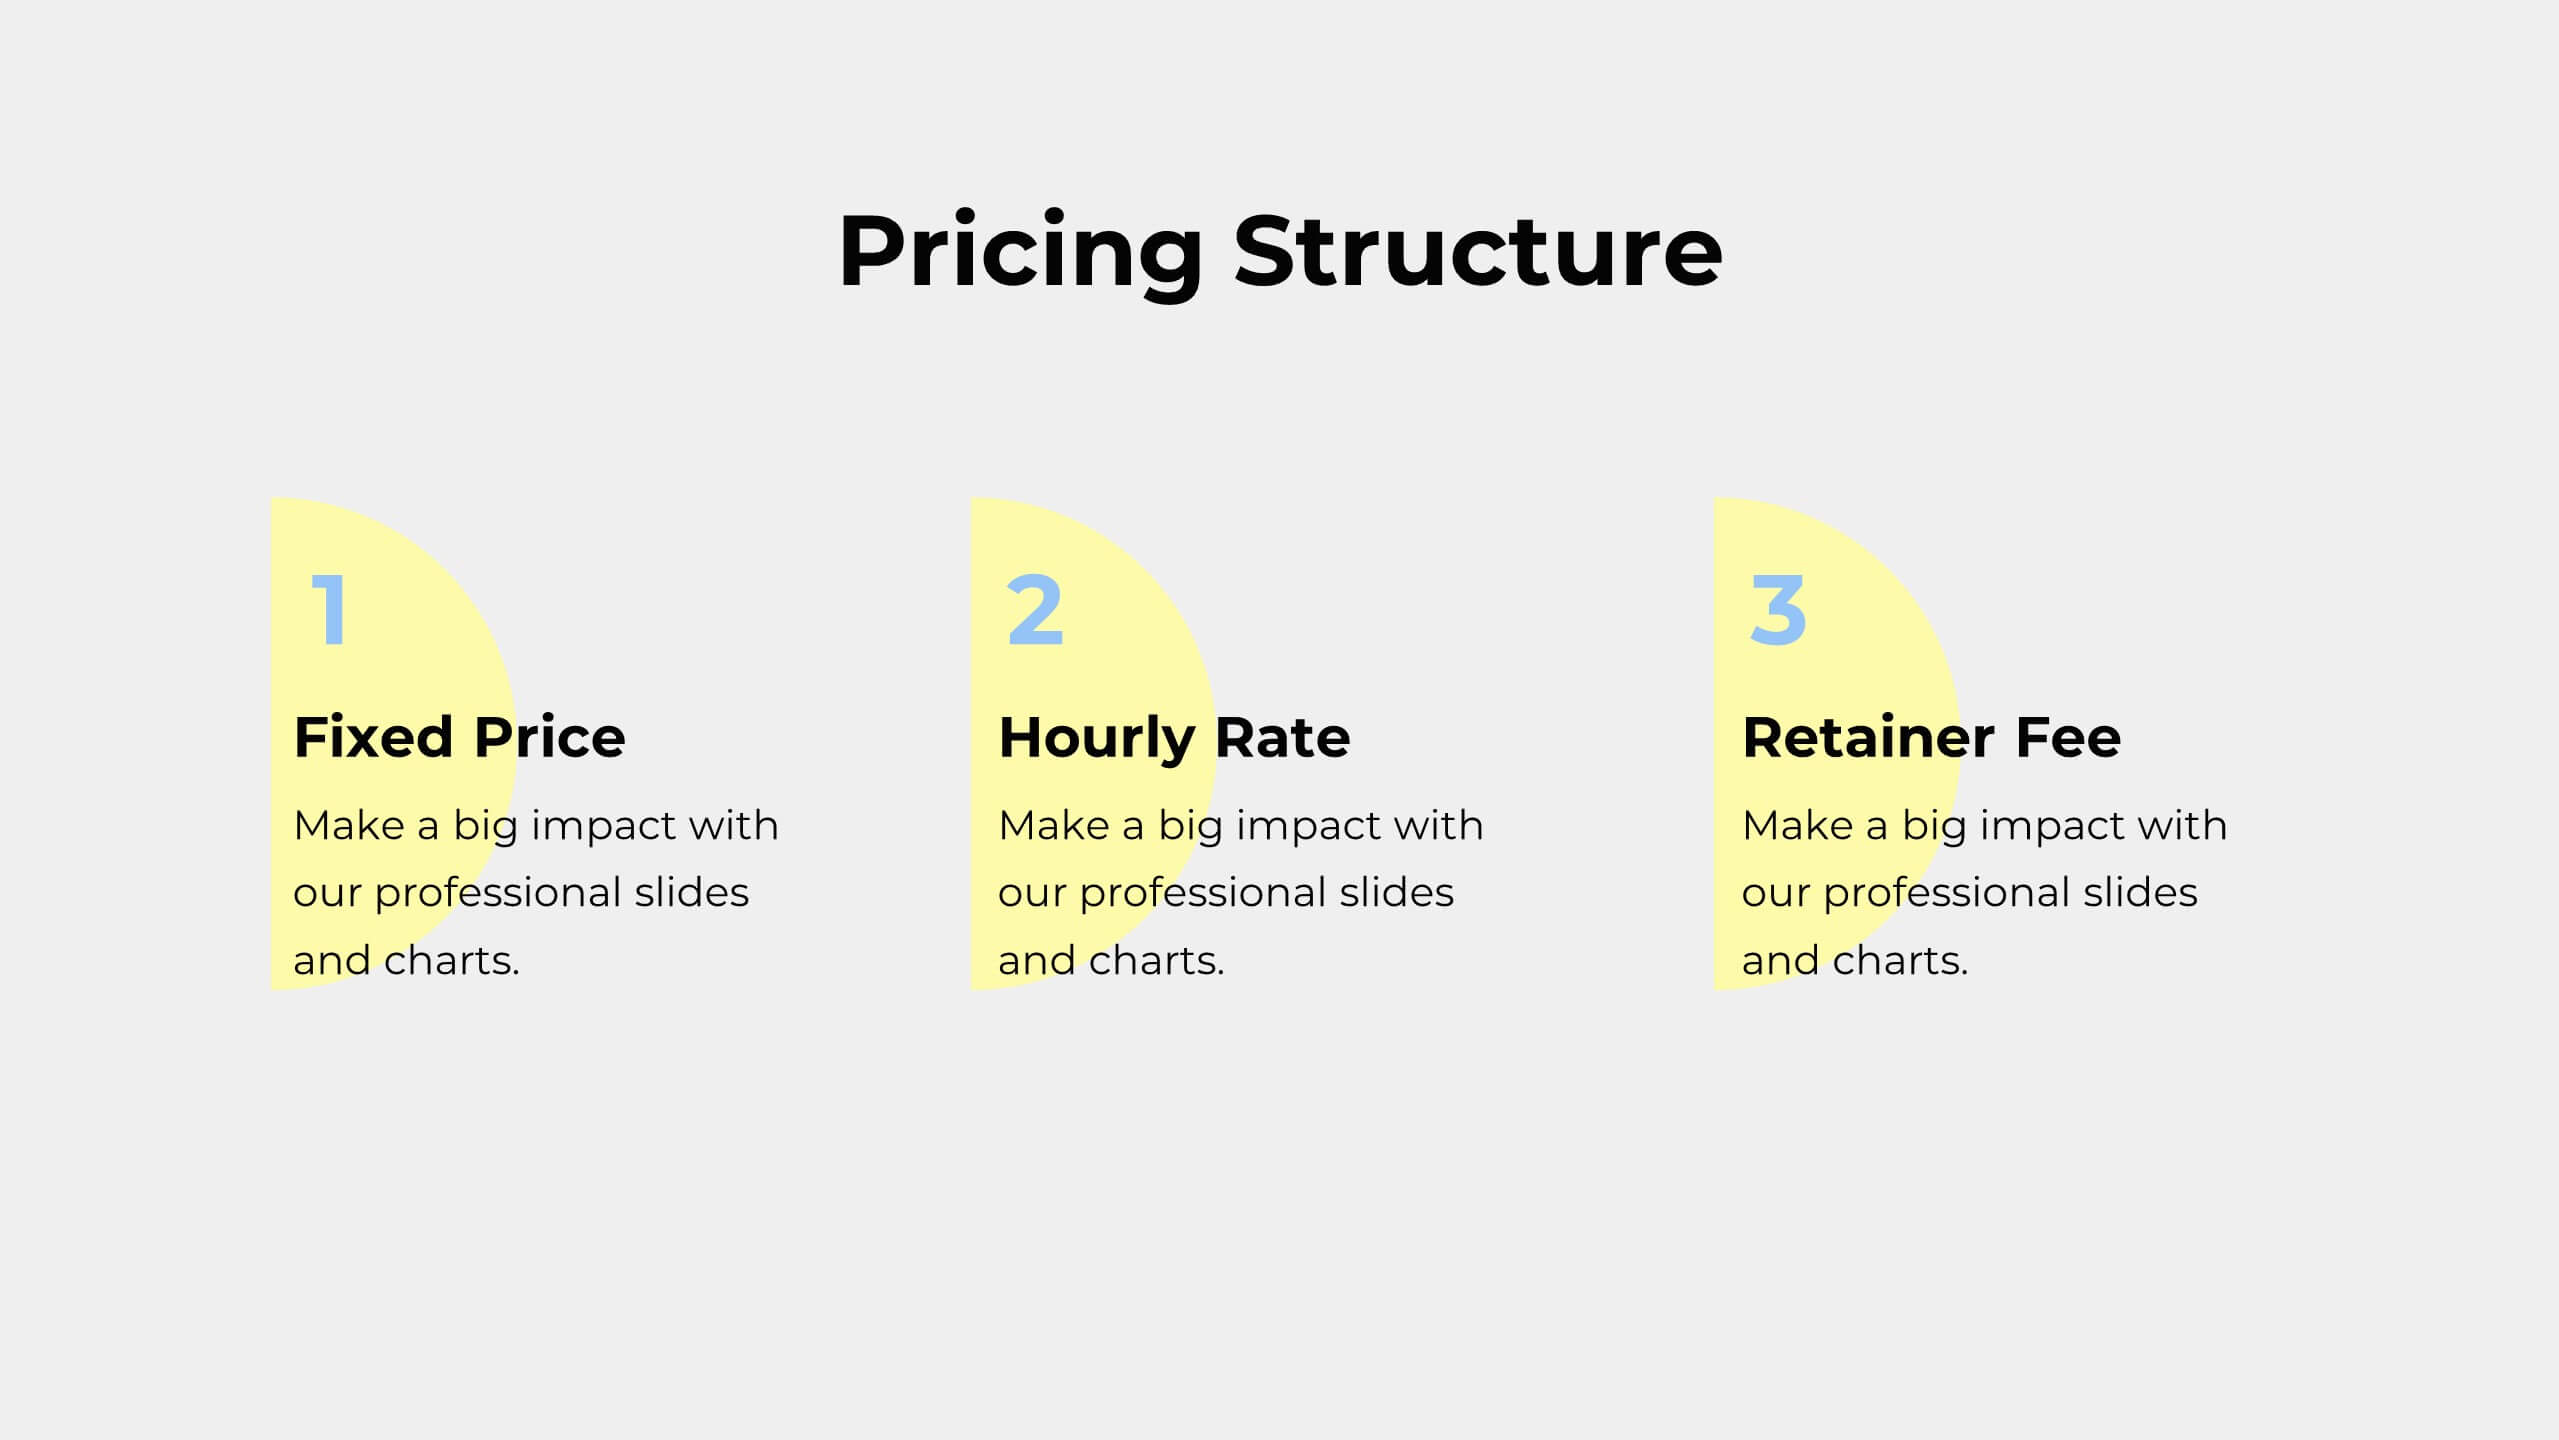
Inspire Business Proposal Presentation
Excite your audience with a compelling business proposal! This template includes sections for objectives, scope of work, timeline, budget, and more. Present your business plan clearly and effectively. Compatible with PowerPoint, Keynote, and Google Slides, it’s designed to impress stakeholders and secure approval for your project. Transform ideas into reality today!


22 diapositivas
Eclipser Qualitative Research Findings Presentation
This Qualitative Research Findings Presentation is designed to effectively showcase research insights with a clean and modern layout. It covers key areas such as research objectives, methodology, data analysis, findings, and recommendations. Fully customizable and compatible with PowerPoint, Keynote, and Google Slides for seamless editing and professional results.