


Características


¿Tienes alguna pregunta?
Recomendar


5 diapositivas
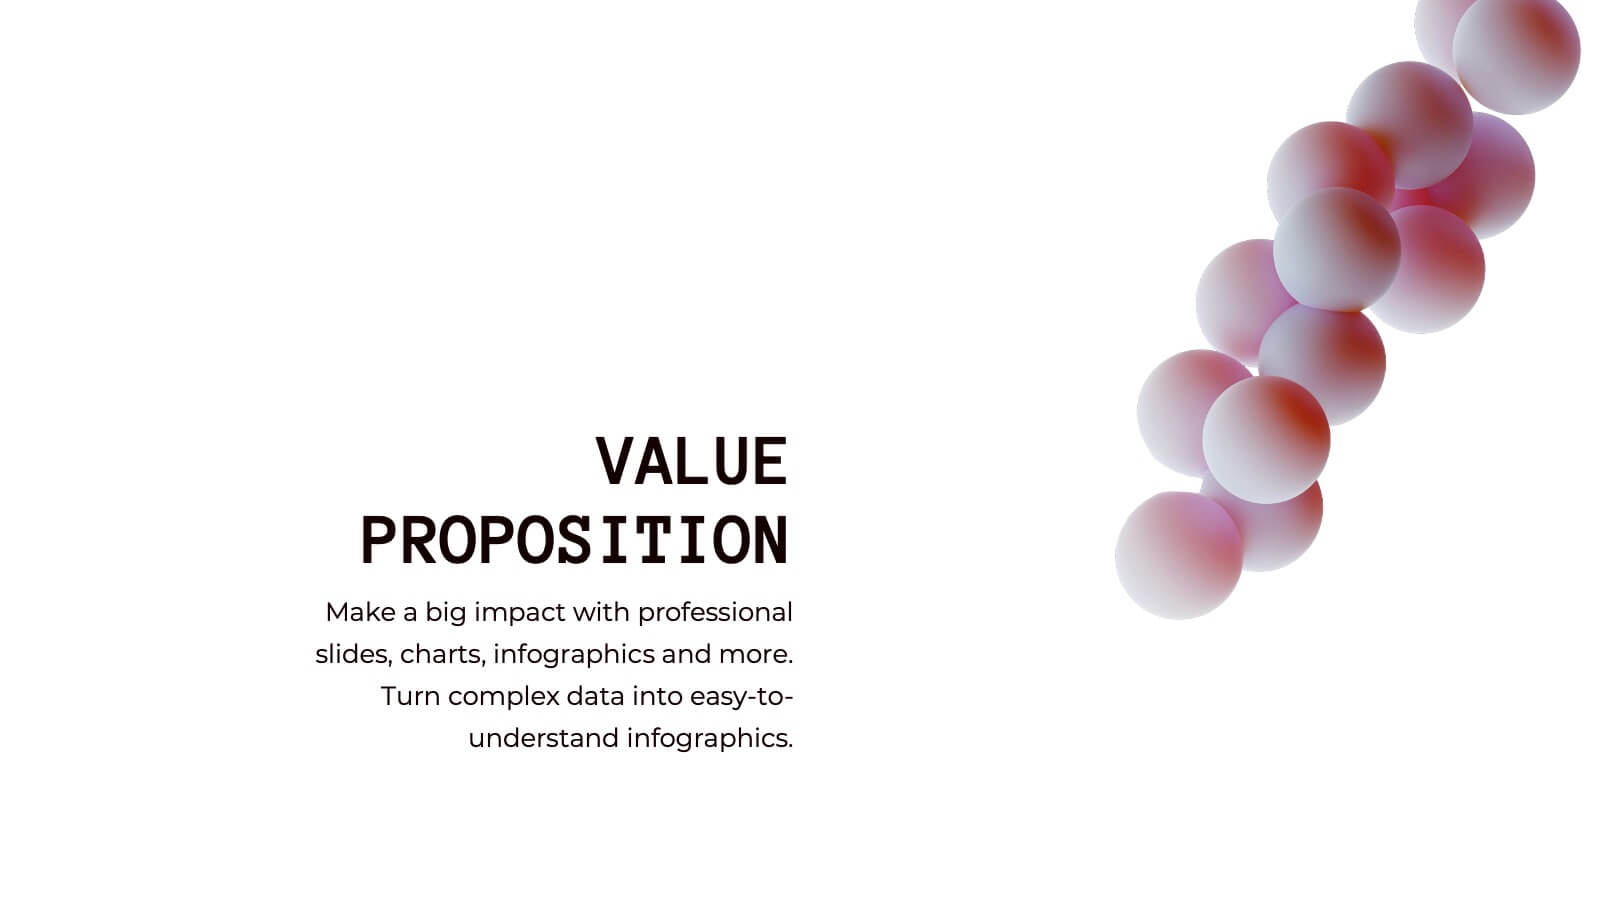
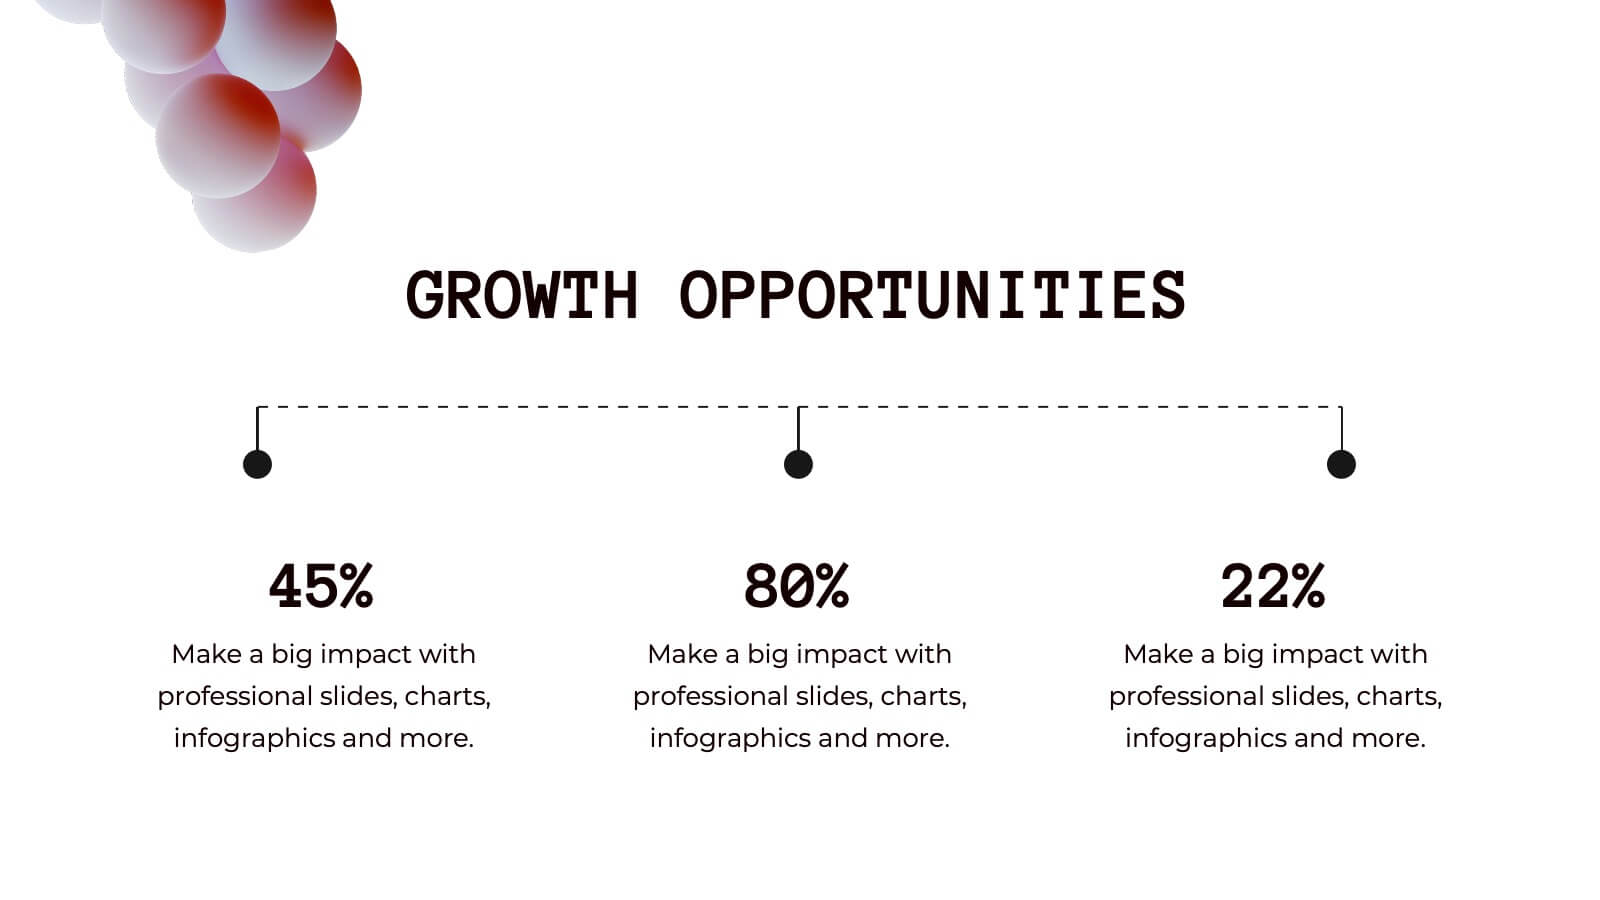
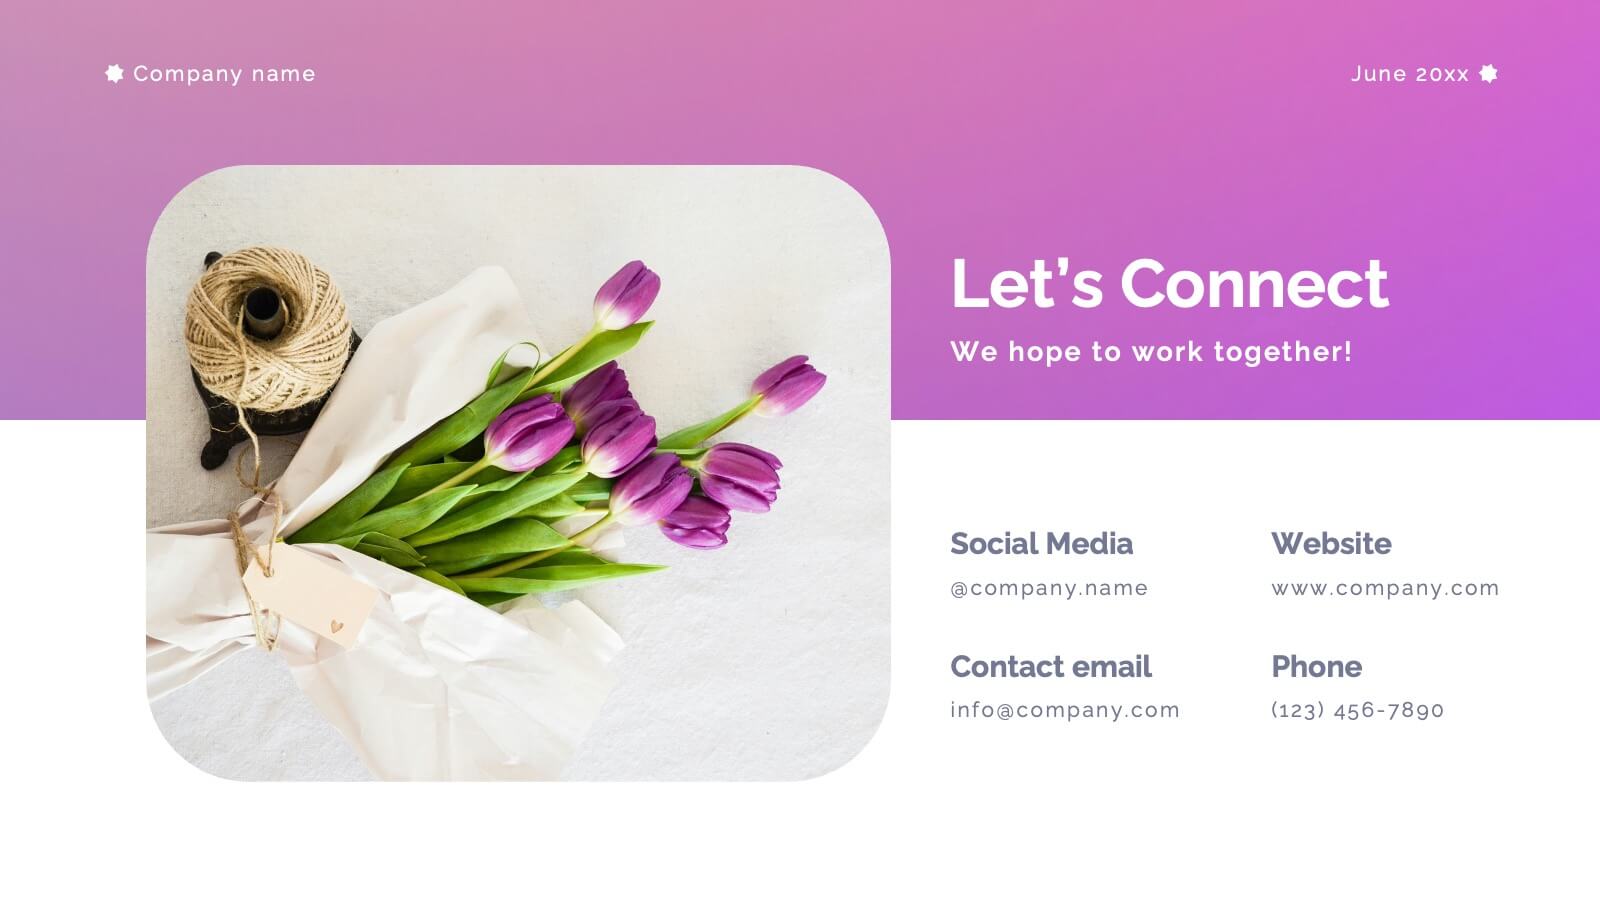
Statistical Insights for Business Growth Presentation
Showcase key business statistics with impact using this radial chart-style presentation slide. Ideal for visualizing growth percentages, progress tracking, or survey results, this design helps break down five distinct insights with matching callouts. Perfect for analytics reports, performance dashboards, and stakeholder updates. Fully customizable in PowerPoint, Keynote, and Google Slides.


4 diapositivas
Budget Projection with Predictive Analysis Presentation
Visualize future financial outcomes with clarity using the Budget Projection with Predictive Analysis Presentation. This modern funnel-style layout helps break down key stages of budget forecasting, making it easy to communicate progressions and data-driven insights. Perfect for financial planning, reporting, or strategic reviews. Fully editable in PowerPoint, Google Slides, Keynote, and Canva.


3 diapositivas
Sustainabilitiy Management Plan Framework Presentation
Turn your sustainability goals into a clear, actionable plan with this dynamic presentation design. Ideal for showcasing environmental strategies, performance metrics, and corporate responsibility initiatives, it combines clarity with visual balance to engage audiences. Fully editable and compatible with PowerPoint, Keynote, and Google Slides for seamless customization and delivery.


7 diapositivas
Goals Infographic Presentation Template
A goals infographic is a set of goals, objectives, or plans, often used for personal or organizational planning and development. This template allows you to include information about your specific goals, the steps required to achieve them, the timeline for completion, and any relevant metrics or targets. The purpose of our goals infographic is to help you provide a clear and concise overview of what is to be accomplished, and help you keep focus on achieving those goals. This well-designed infographic can help you prioritize and track progress, and can serve as a visual reminder.


5 diapositivas
Innovation Framework Presentation
Turn bold ideas into structured success with this engaging presentation design. Perfect for mapping creative processes, innovation systems, and project development stages, it helps present ideas clearly and visually. Fully editable and easy to customize, this presentation is compatible with PowerPoint, Keynote, and Google Slides for effortless use.

21 diapositivas
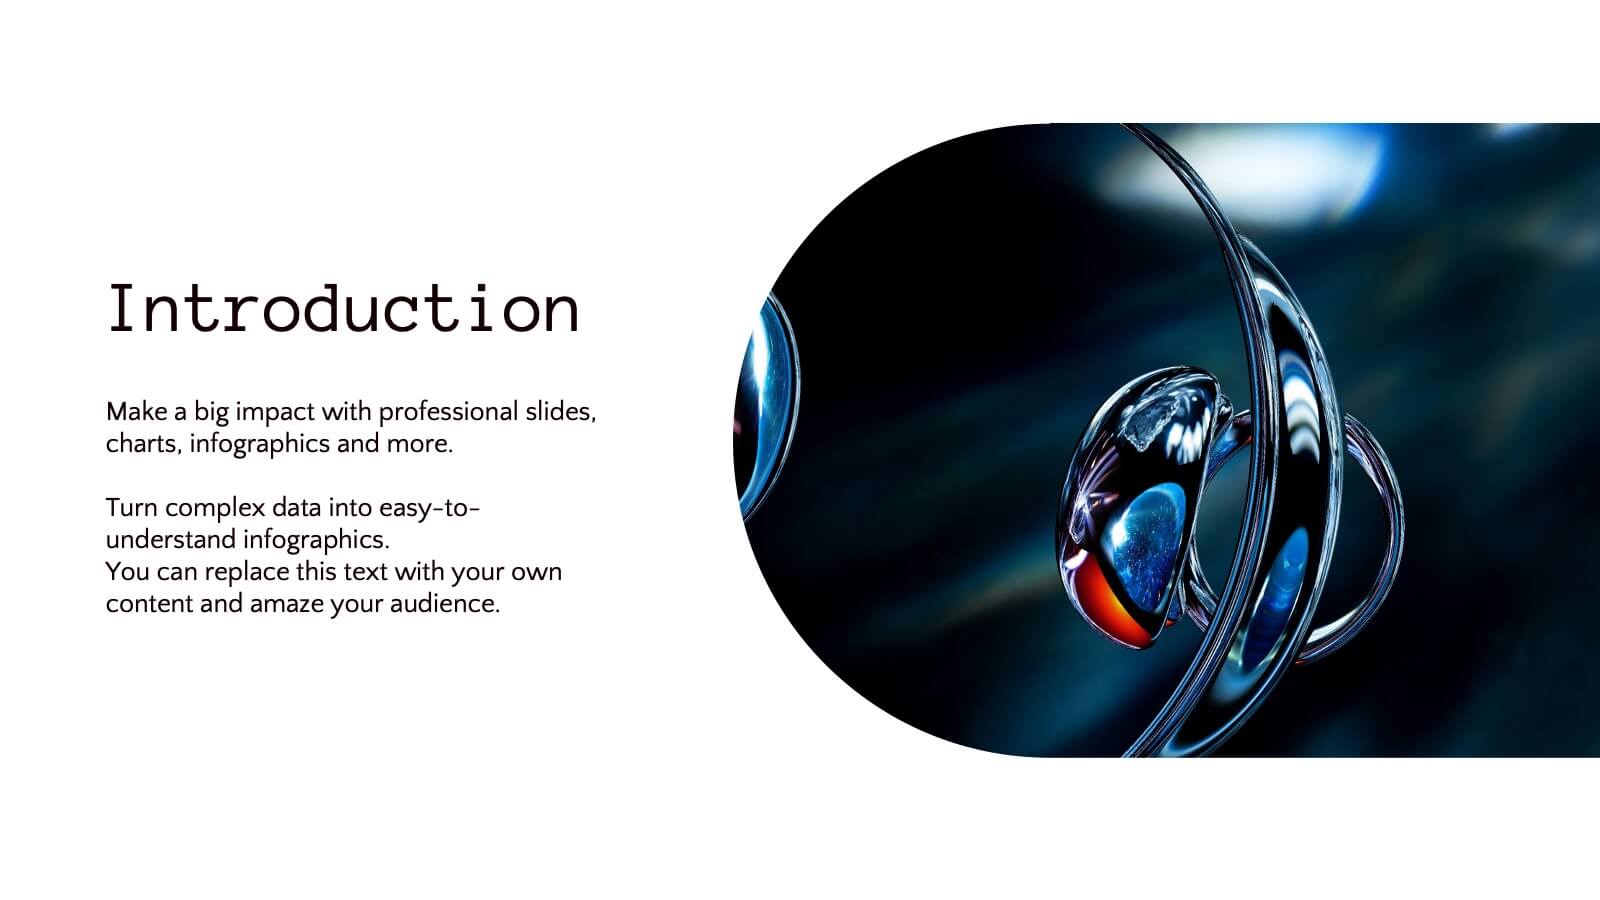
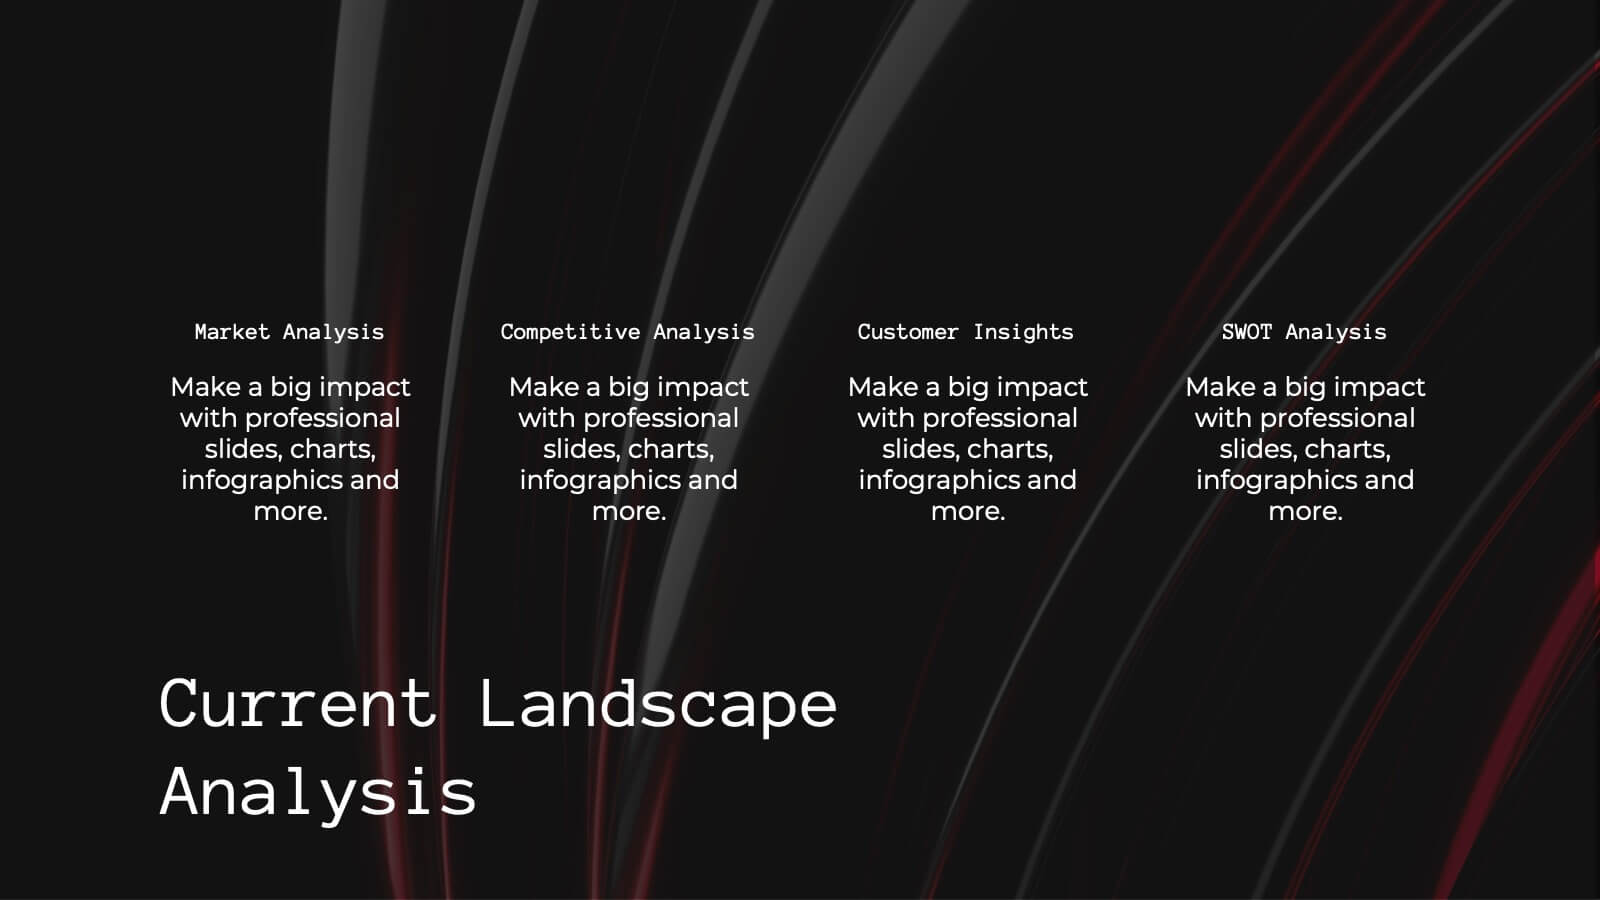
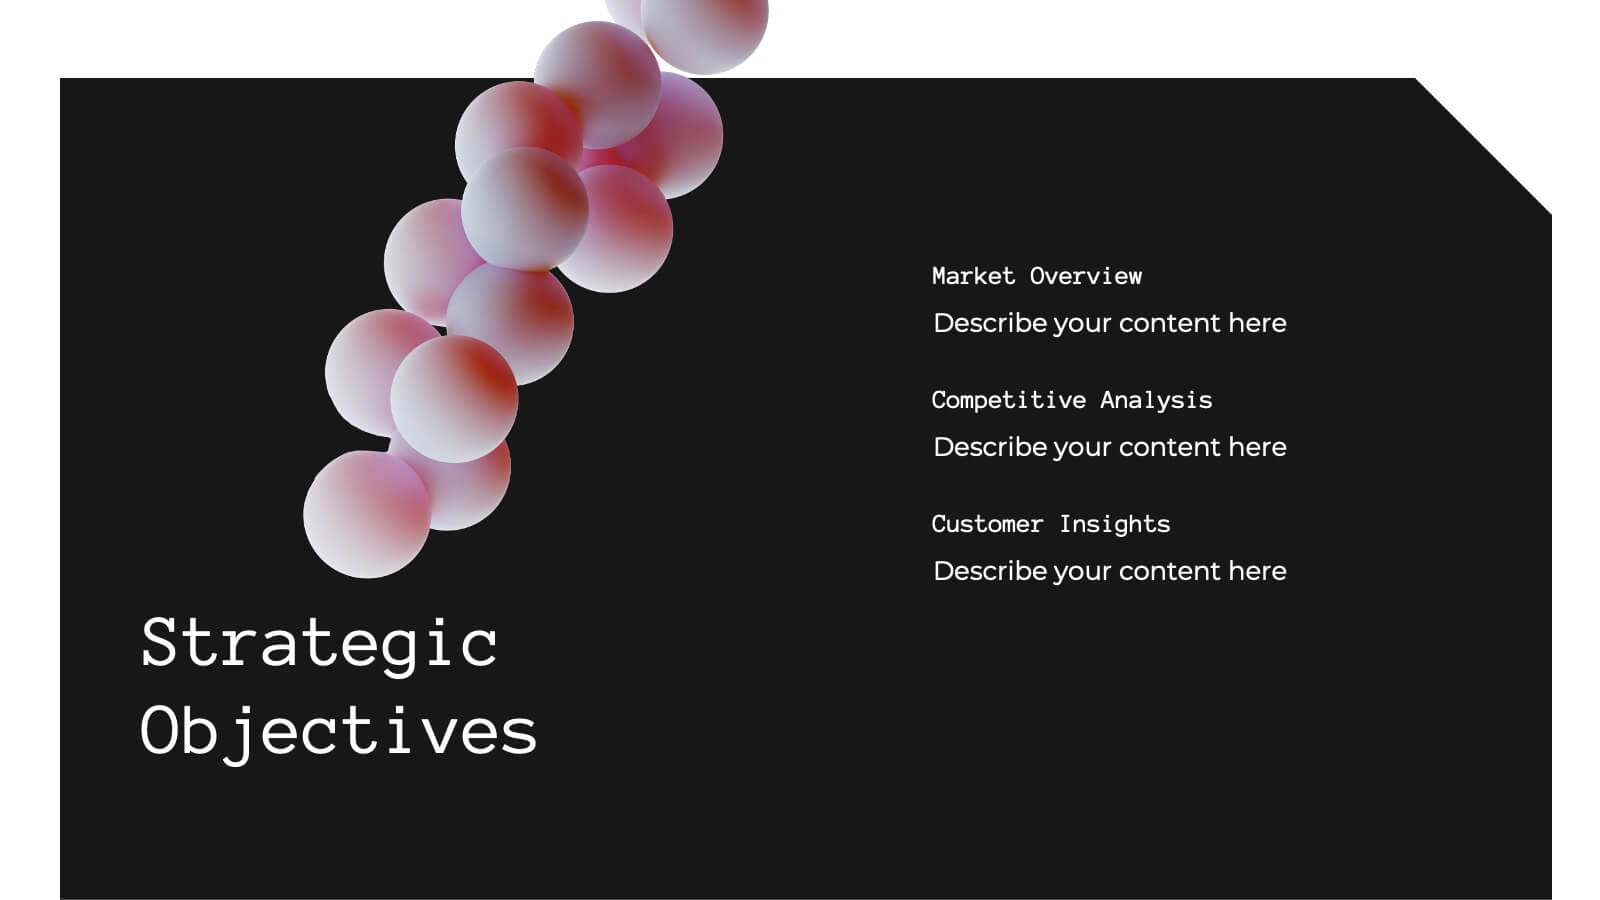
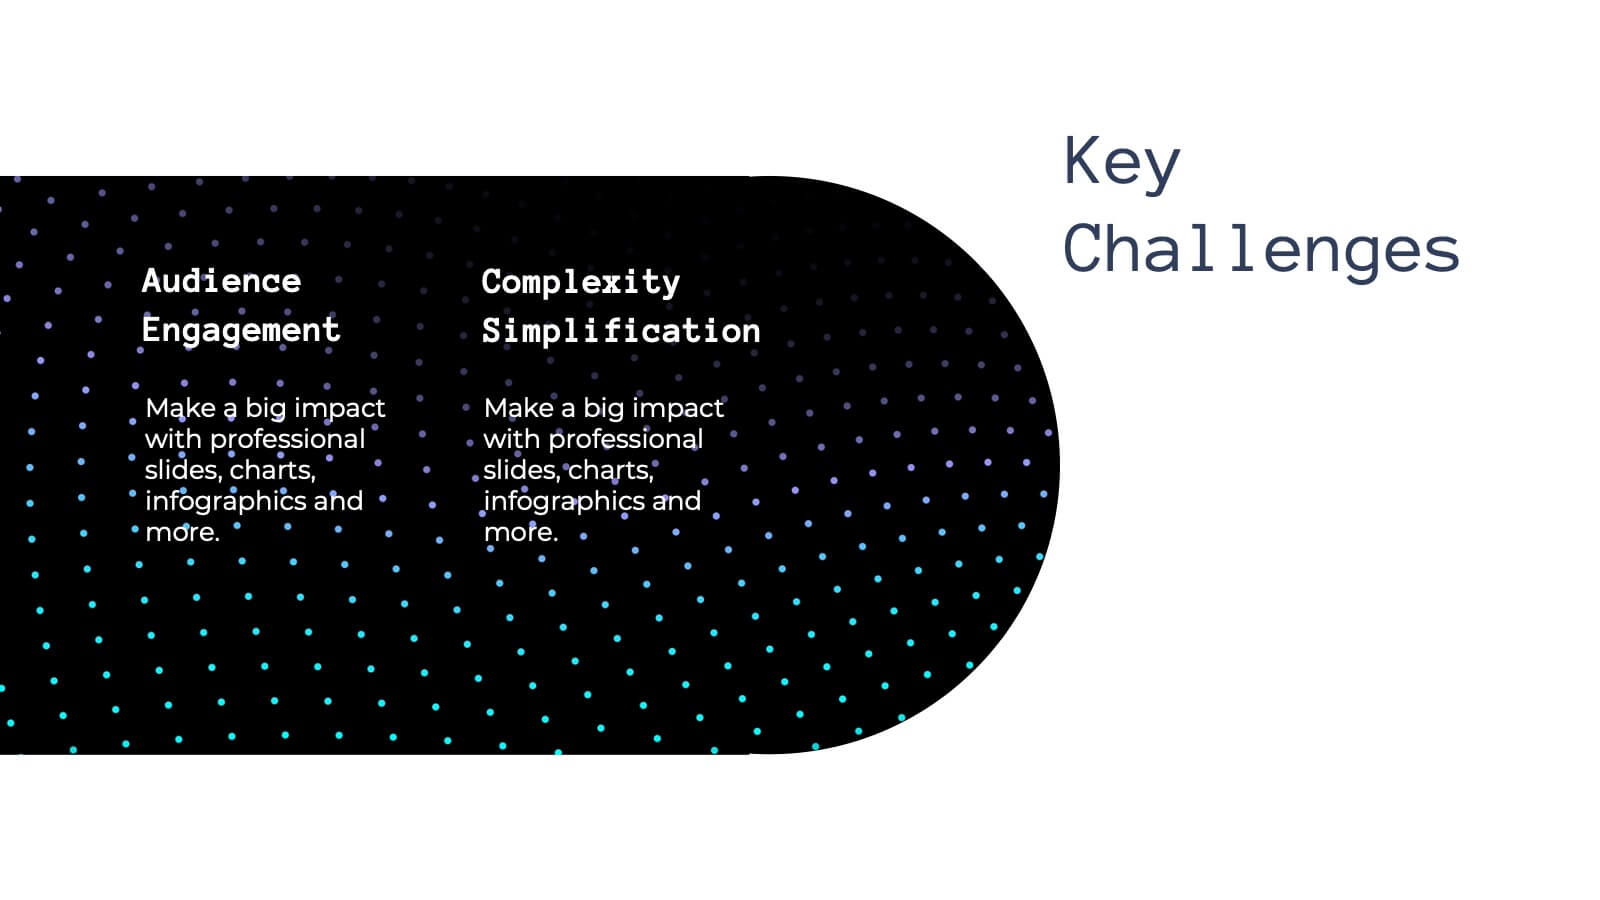
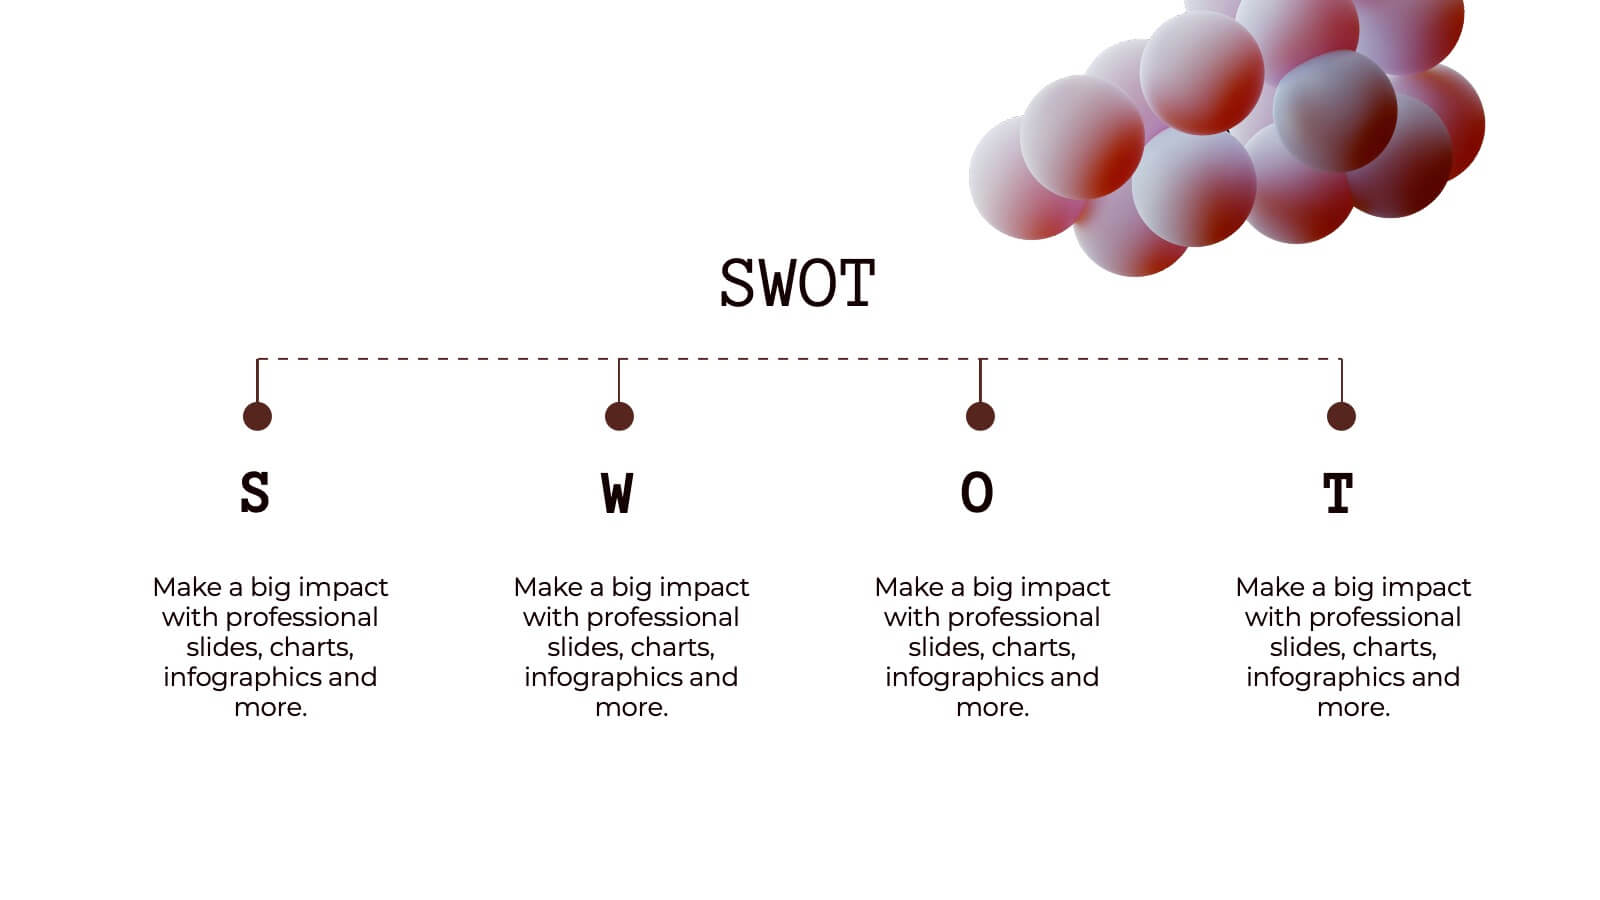
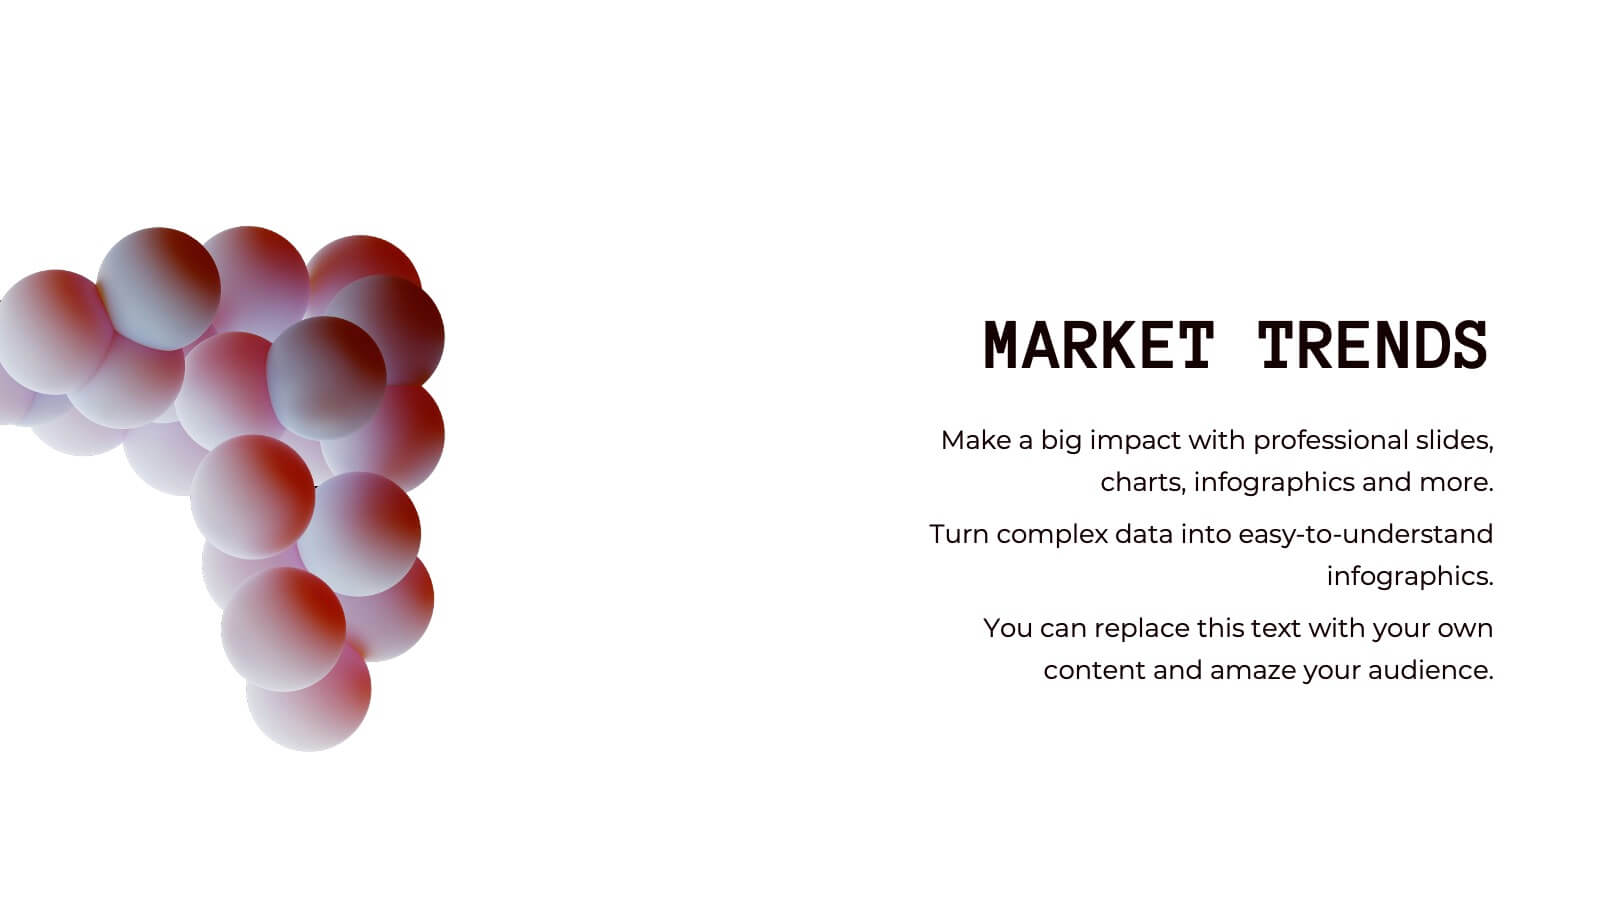
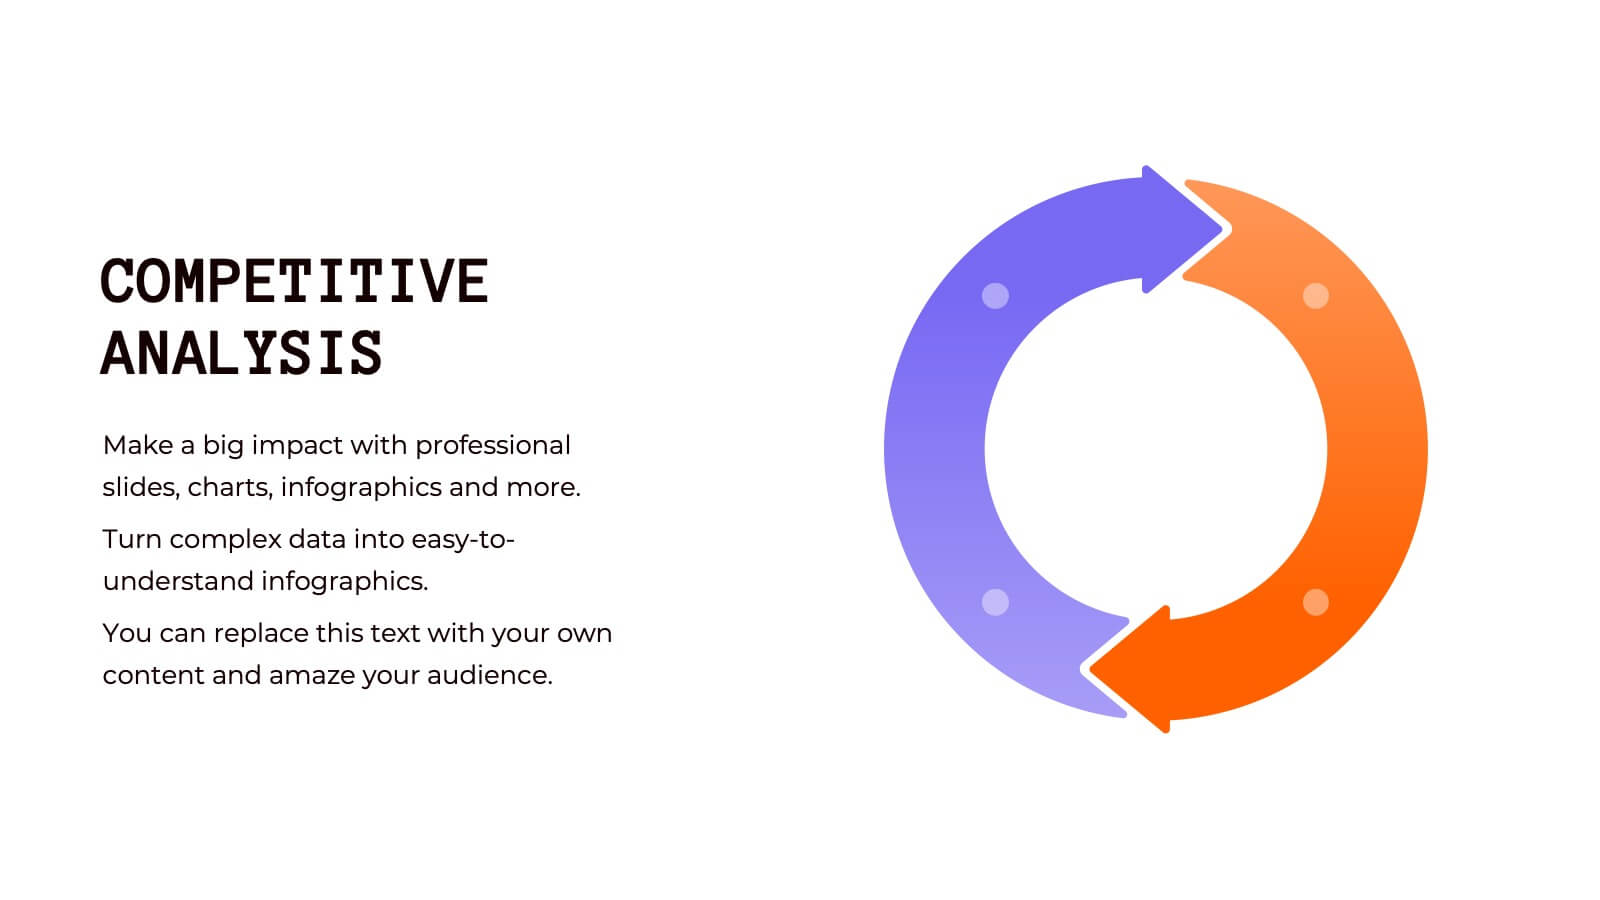
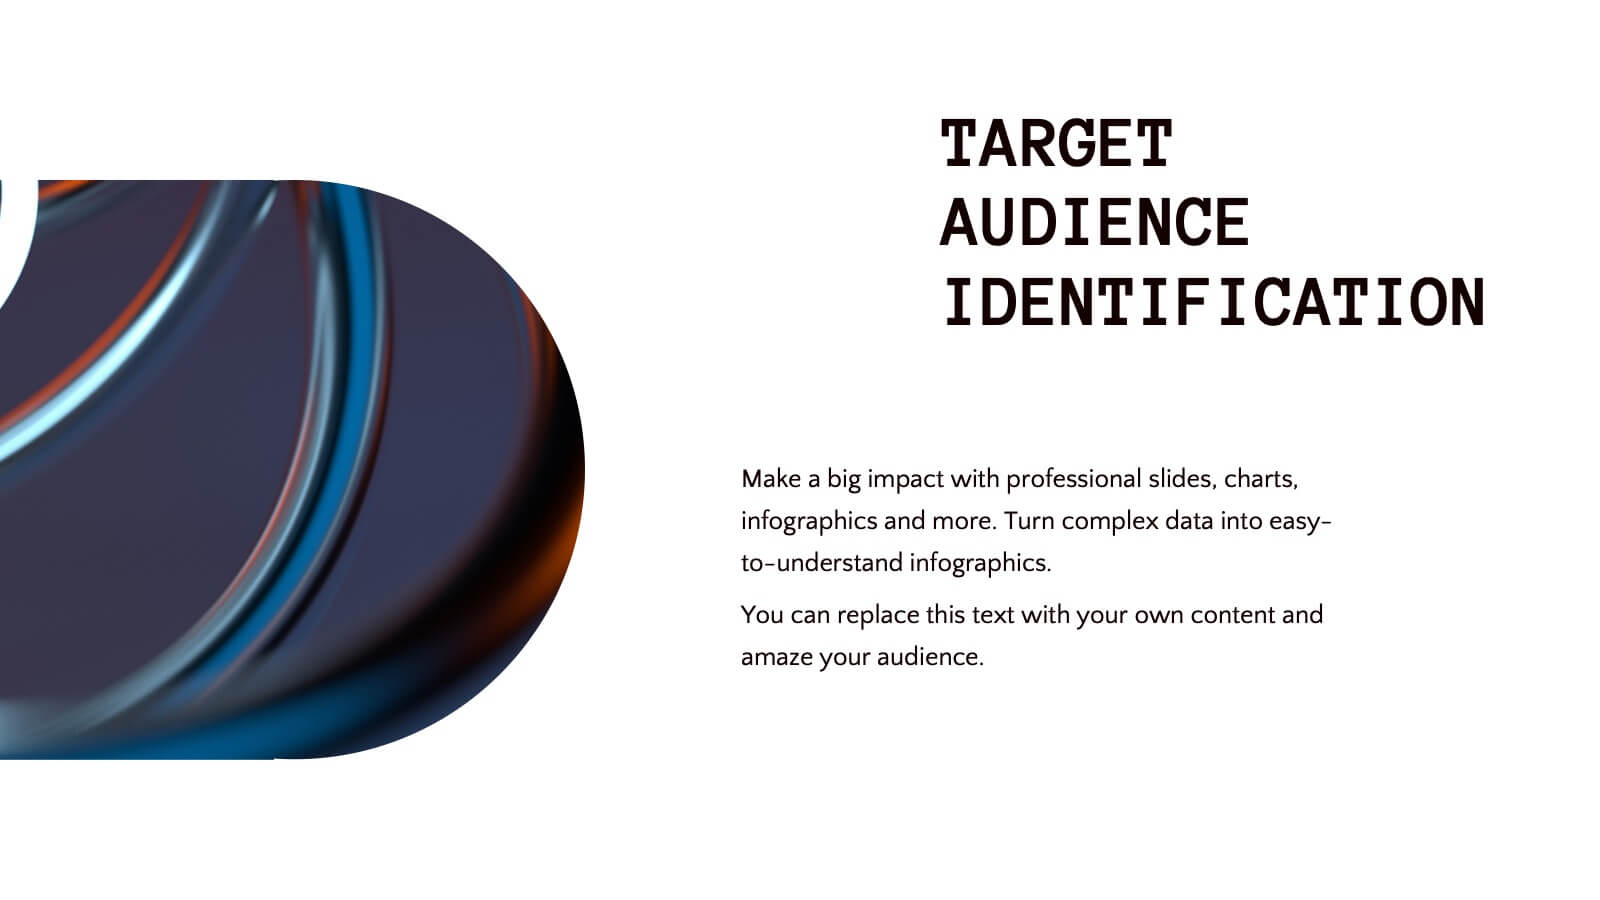
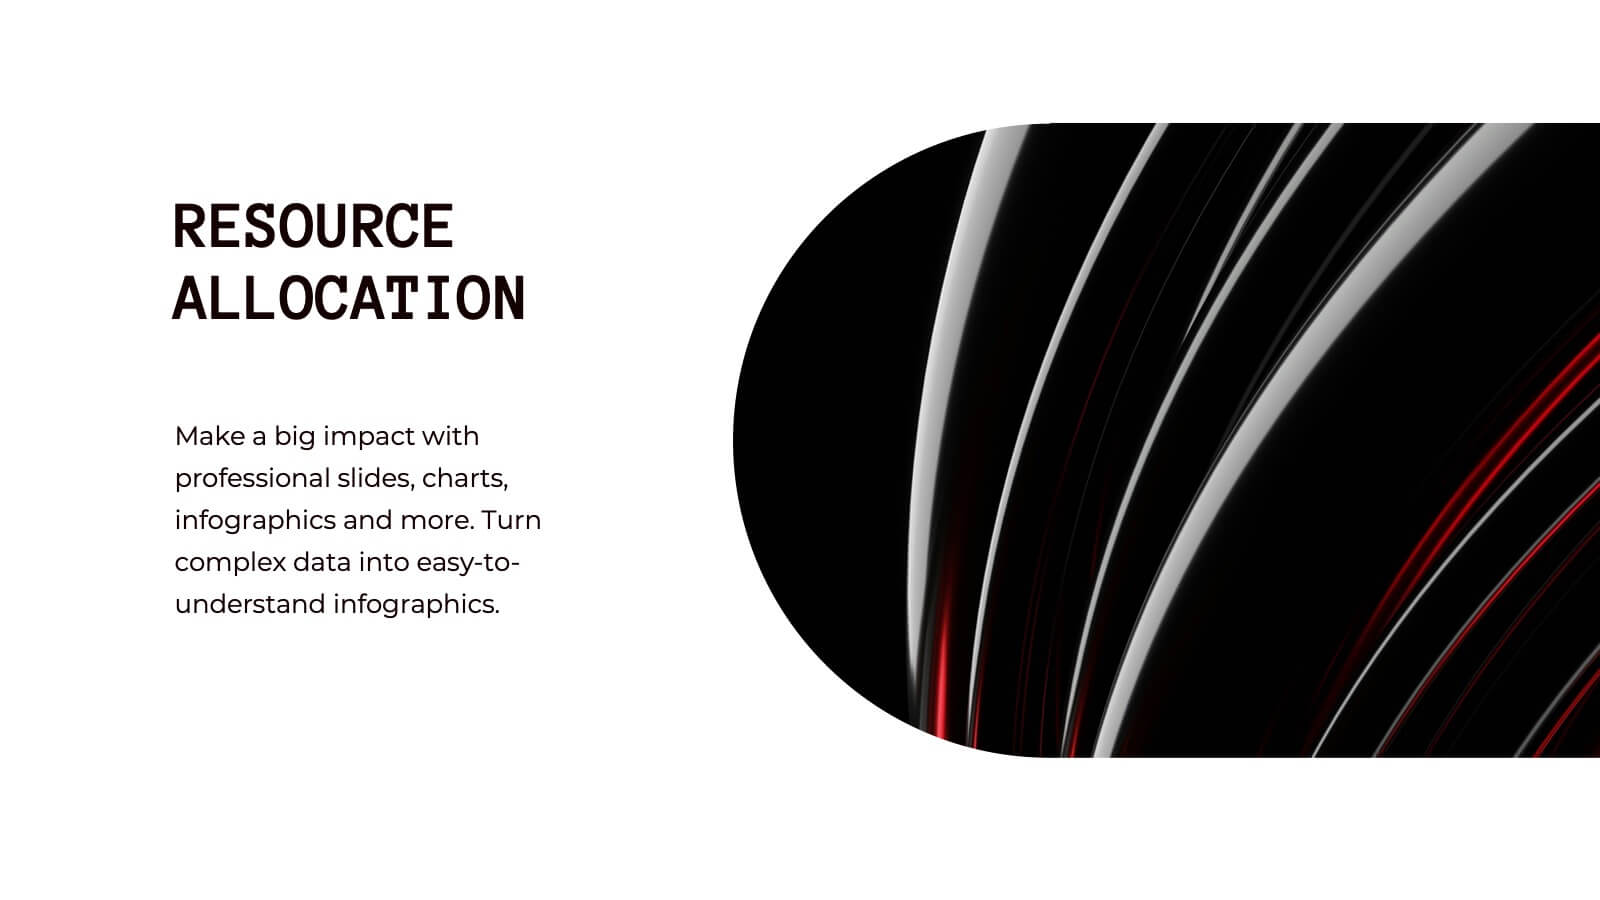
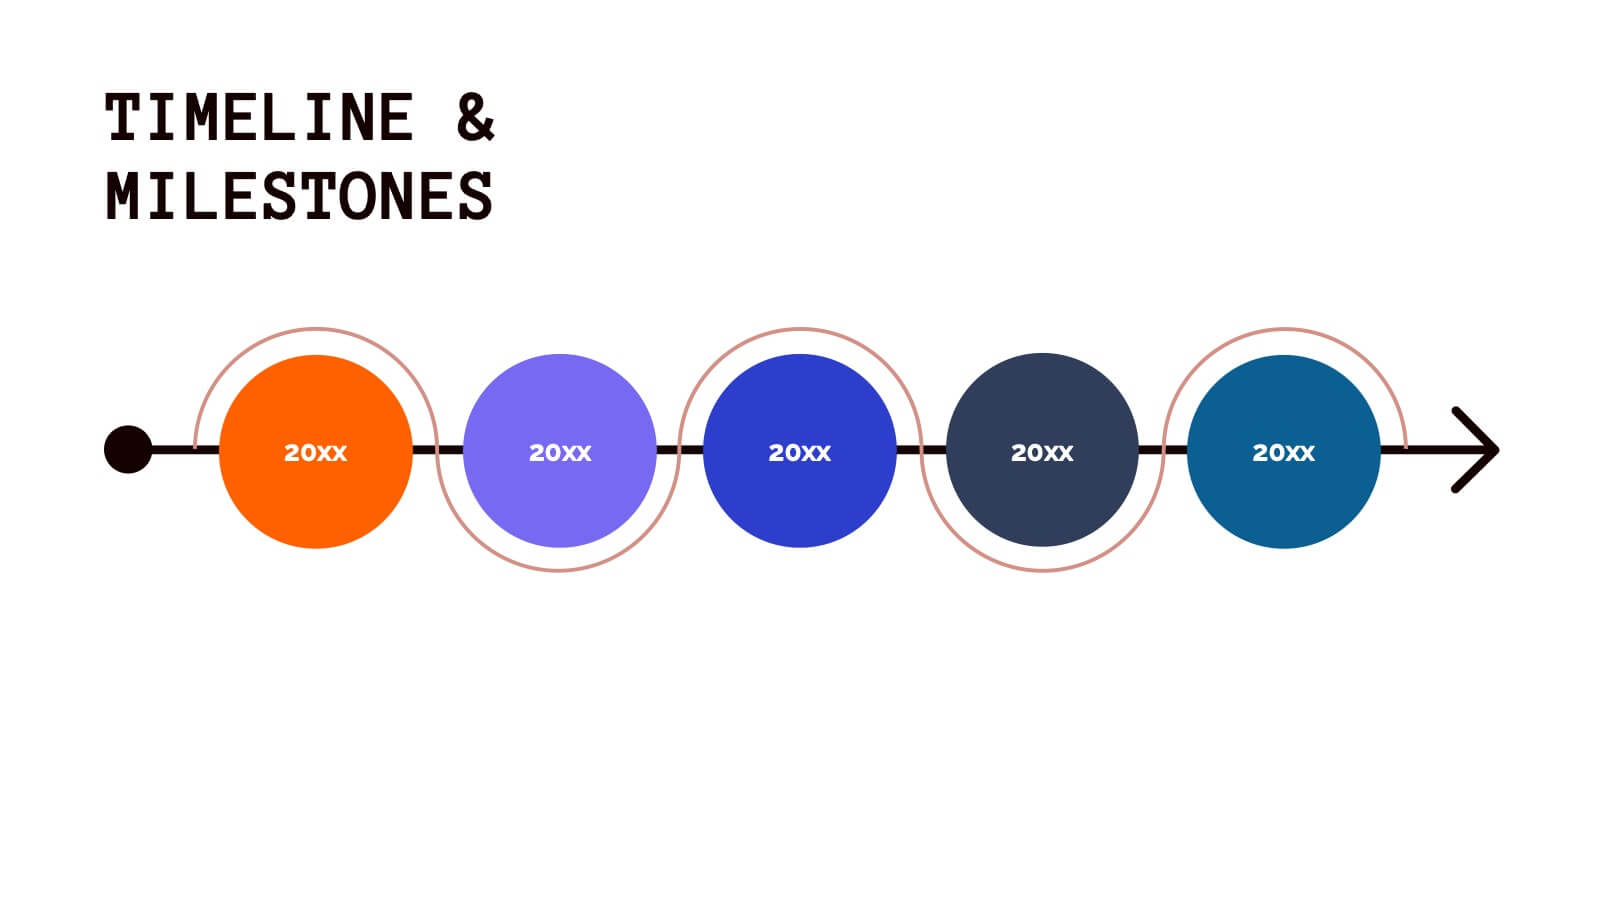
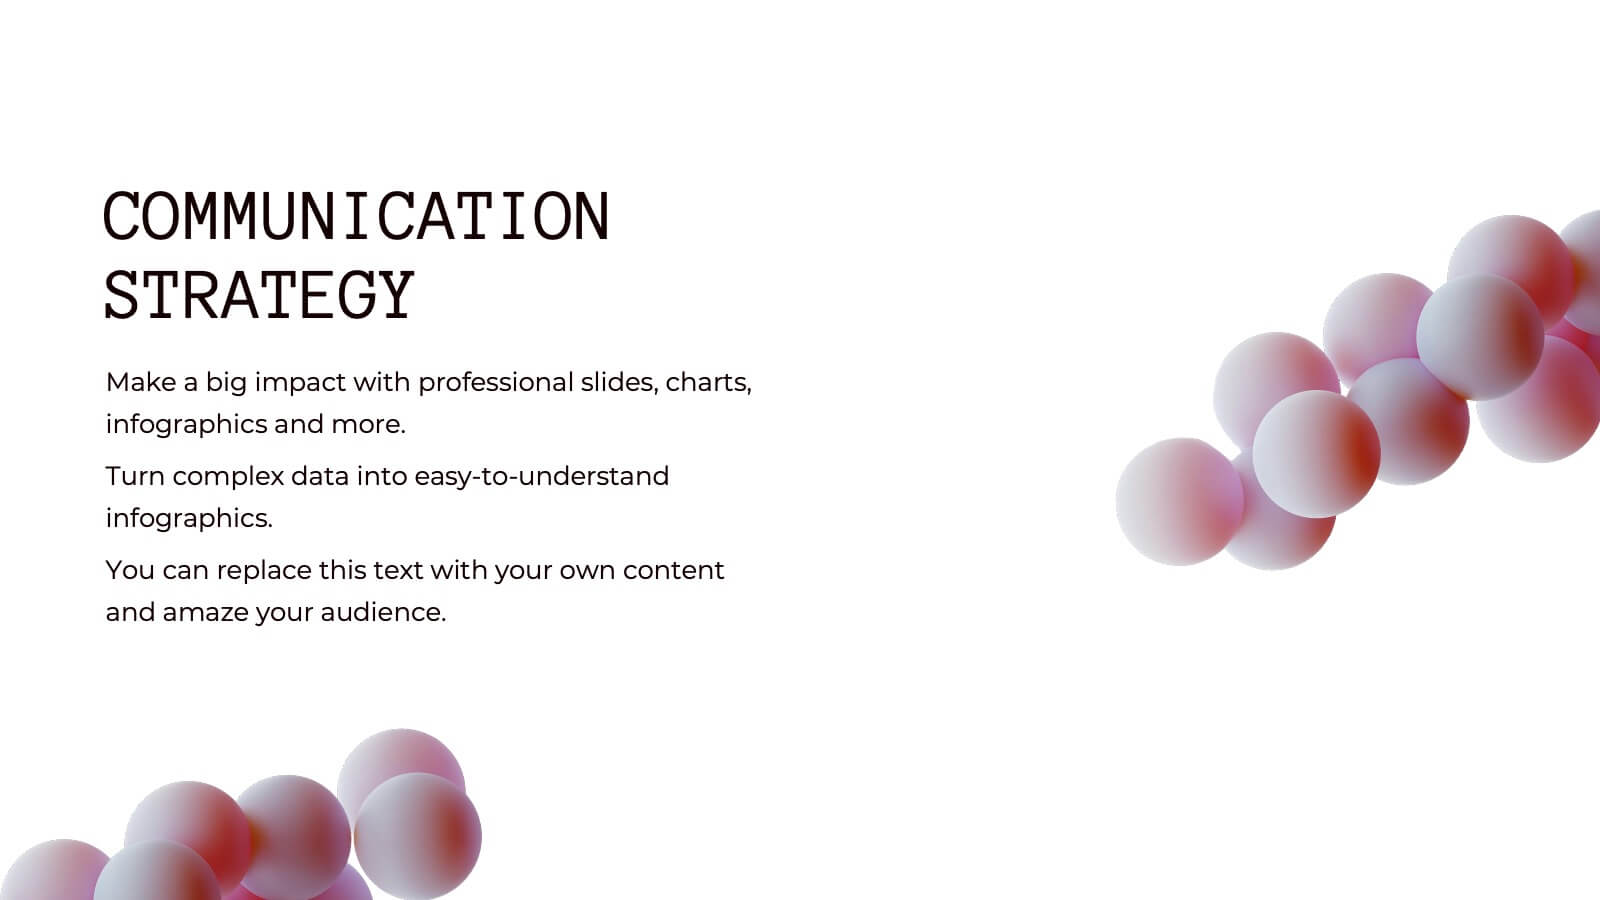
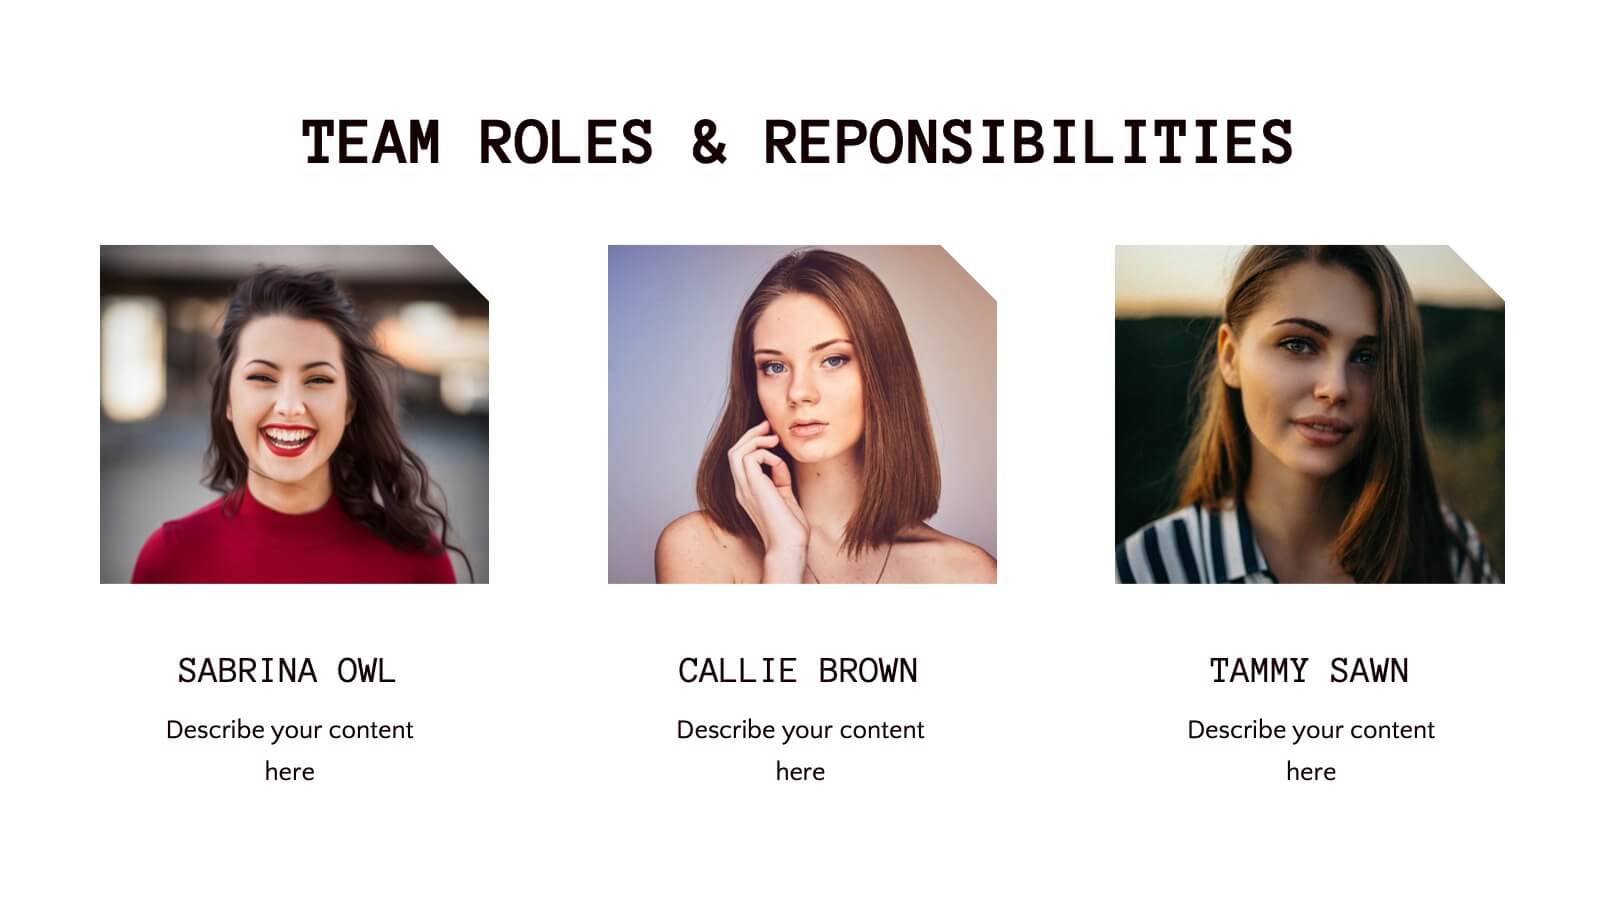
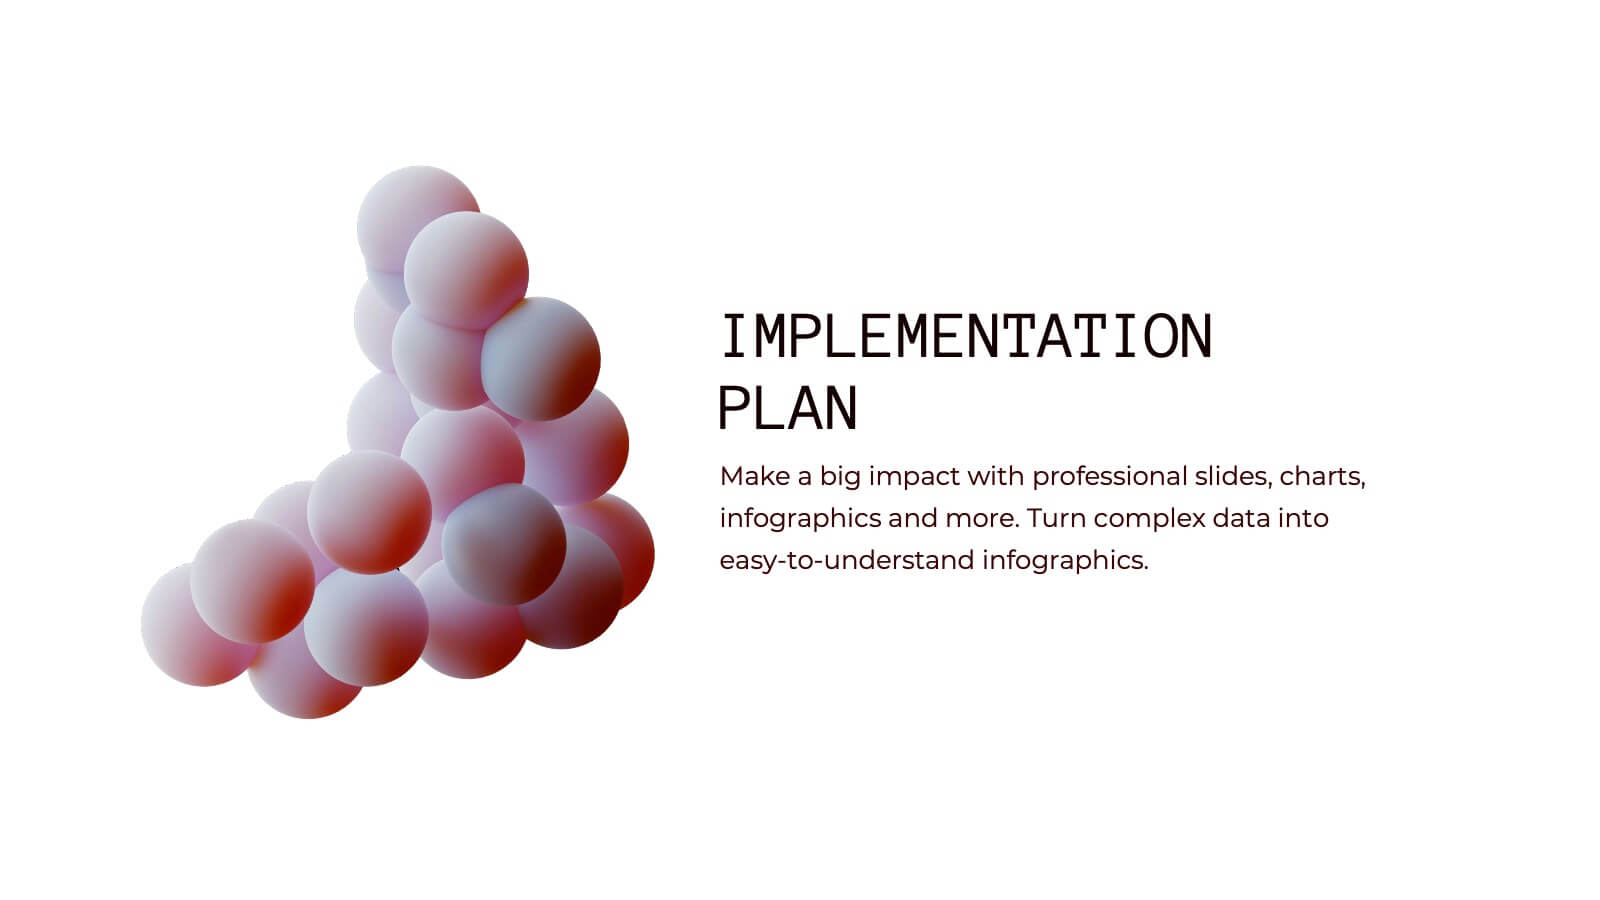
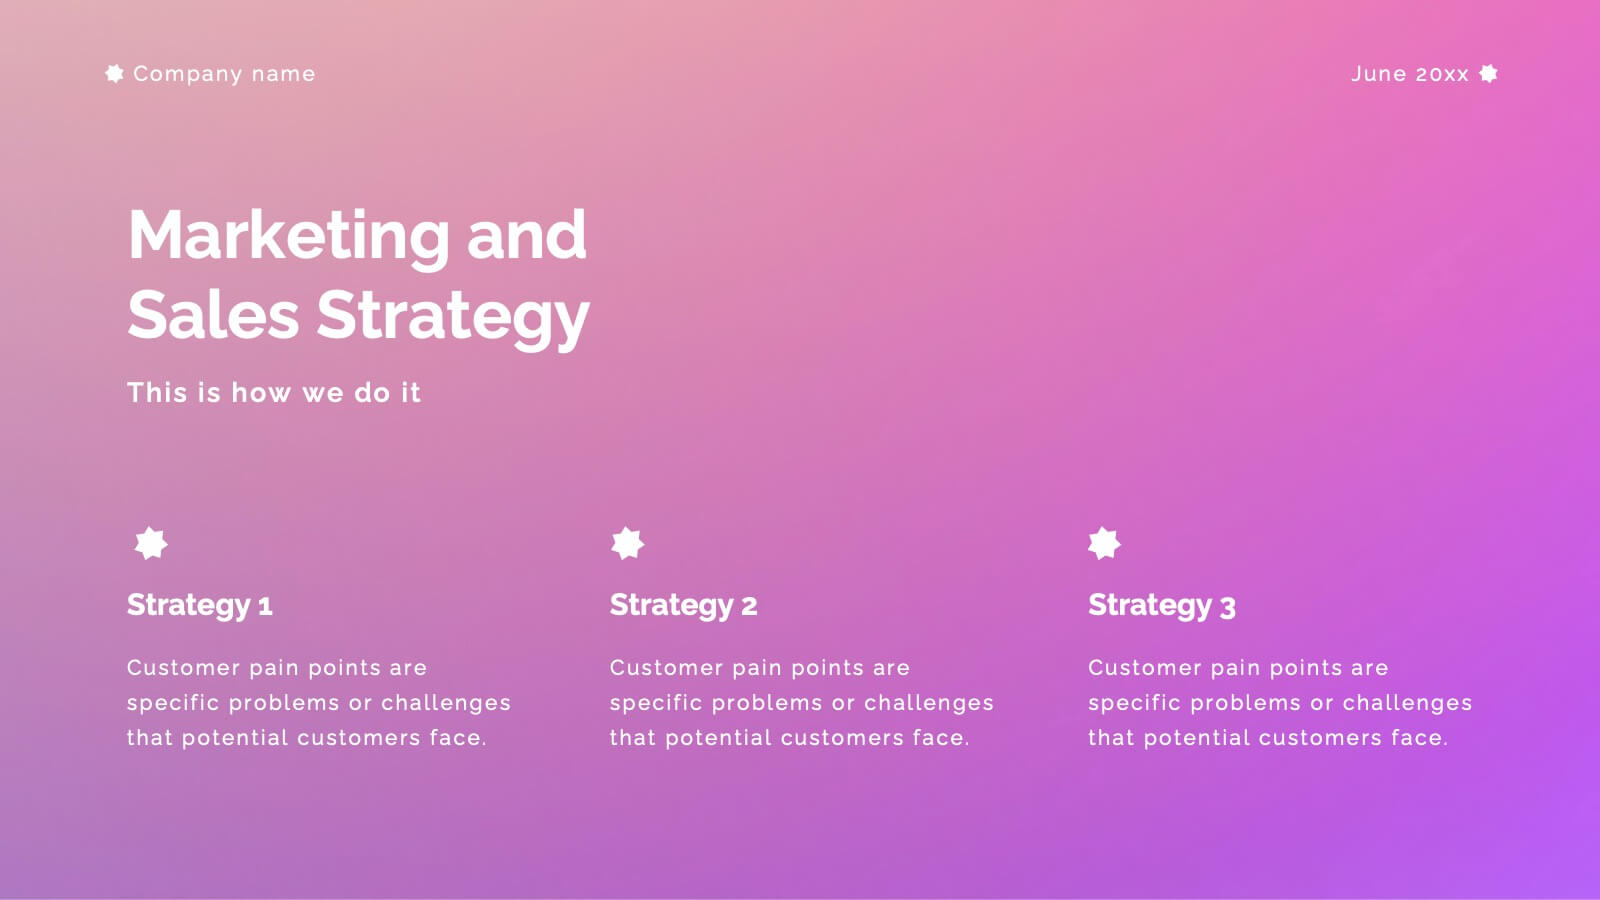
Mermaid Corporate Strategy Proposal Presentation
Present your corporate strategy with confidence using this sleek, modern proposal template! It covers strategic objectives, market trends, SWOT analysis, and resource allocation, ensuring a comprehensive overview of your plan. Fully customizable and compatible with PowerPoint, Keynote, and Google Slides, this template is ideal for launching new initiatives and achieving business goals.


4 diapositivas
Virtual Collaboration and WFH Tools Presentation
Supercharge your workflow with a clean visual that brings your digital workspace to life! This presentation template focuses on streamlining communication and productivity through key virtual collaboration tools and remote work essentials. It’s perfect for outlining platforms, strategies, or tools that boost efficiency. Fully compatible with PowerPoint, Keynote, and Google Slides.


7 diapositivas
McKinsey 7S Management Infographic Presentation
The McKinsey 7S model is designed to help organizations understand the various components that need to be aligned for effective performance. This Infographic is a visually engaging way to describe the 7S framework. Use it to deliver an informative message and get your ideas across clearly using the well designed graphics. This template is fully customizable to portray your company's key points and challenges in your specific business domain. It has all the elements to make a powerful business presentation and can create engaging templates with Powerpoint, Keynote, Google Slides and more.


5 diapositivas
New Hire Orientation Program
Welcome new employees with confidence using the New Hire Orientation Program Presentation. This step-by-step slide is designed to outline your company’s onboarding journey in five clear, structured stages. With labeled “Step 01” through “Step 05” banners, icon placeholders, and editable text boxes, this template is ideal for HR teams, managers, or team leads introducing company values, processes, or benefits. Available in both full-color and progressive highlight variations, it's fully customizable in PowerPoint, Keynote, and Google Slides.


5 diapositivas
Corporate Case Study Analysis Presentation
Enhance your business presentations with the Corporate Case Study Analysis Presentation template. This structured design helps visualize case studies, success stories, or business challenges in a clear, step-by-step format. Ideal for consultants, business analysts, and executives, this slide simplifies complex data into an easy-to-follow journey. Fully customizable in PowerPoint, Keynote, and Google Slides to align with your brand and insights.


5 diapositivas
Environmental and Social Sustainability Presentation
Explore the synergy of environmental protection and social responsibility with our Environmental and Social Sustainability Presentation template. This visual aid is a compelling tool for discussing key strategies in balancing ecological and social impacts, providing a roadmap for sustainable business practices. Ideal for engaging audiences in discussions about conservation and community engagement, the template is fully compatible with PowerPoint, Keynote, and Google Slides, ensuring a smooth presentation experience in any setting.


21 diapositivas
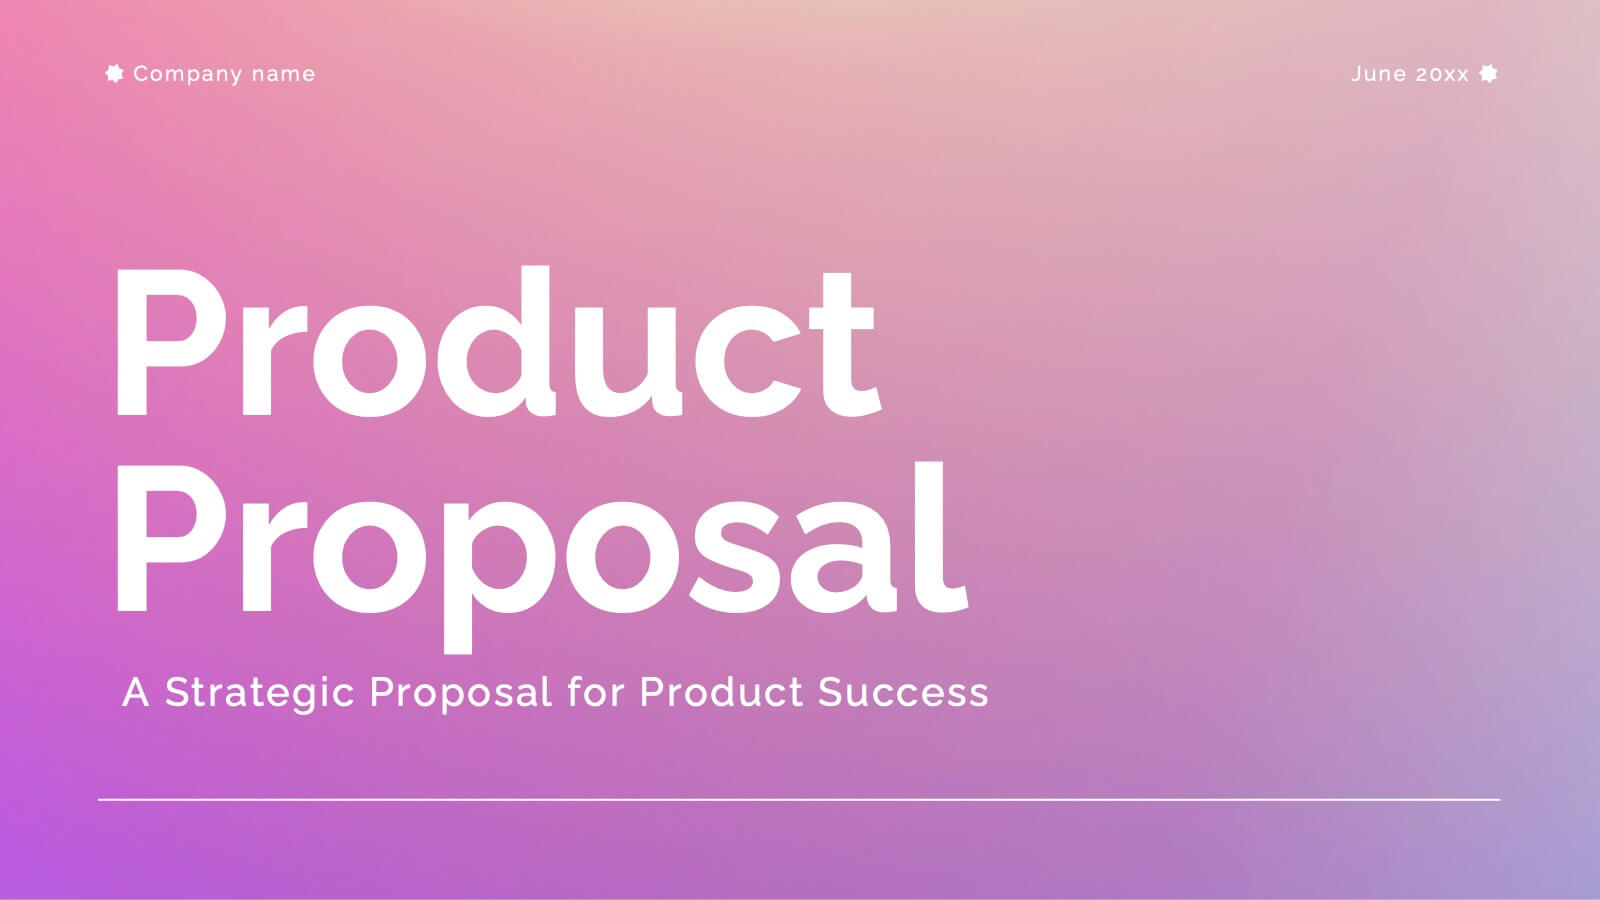
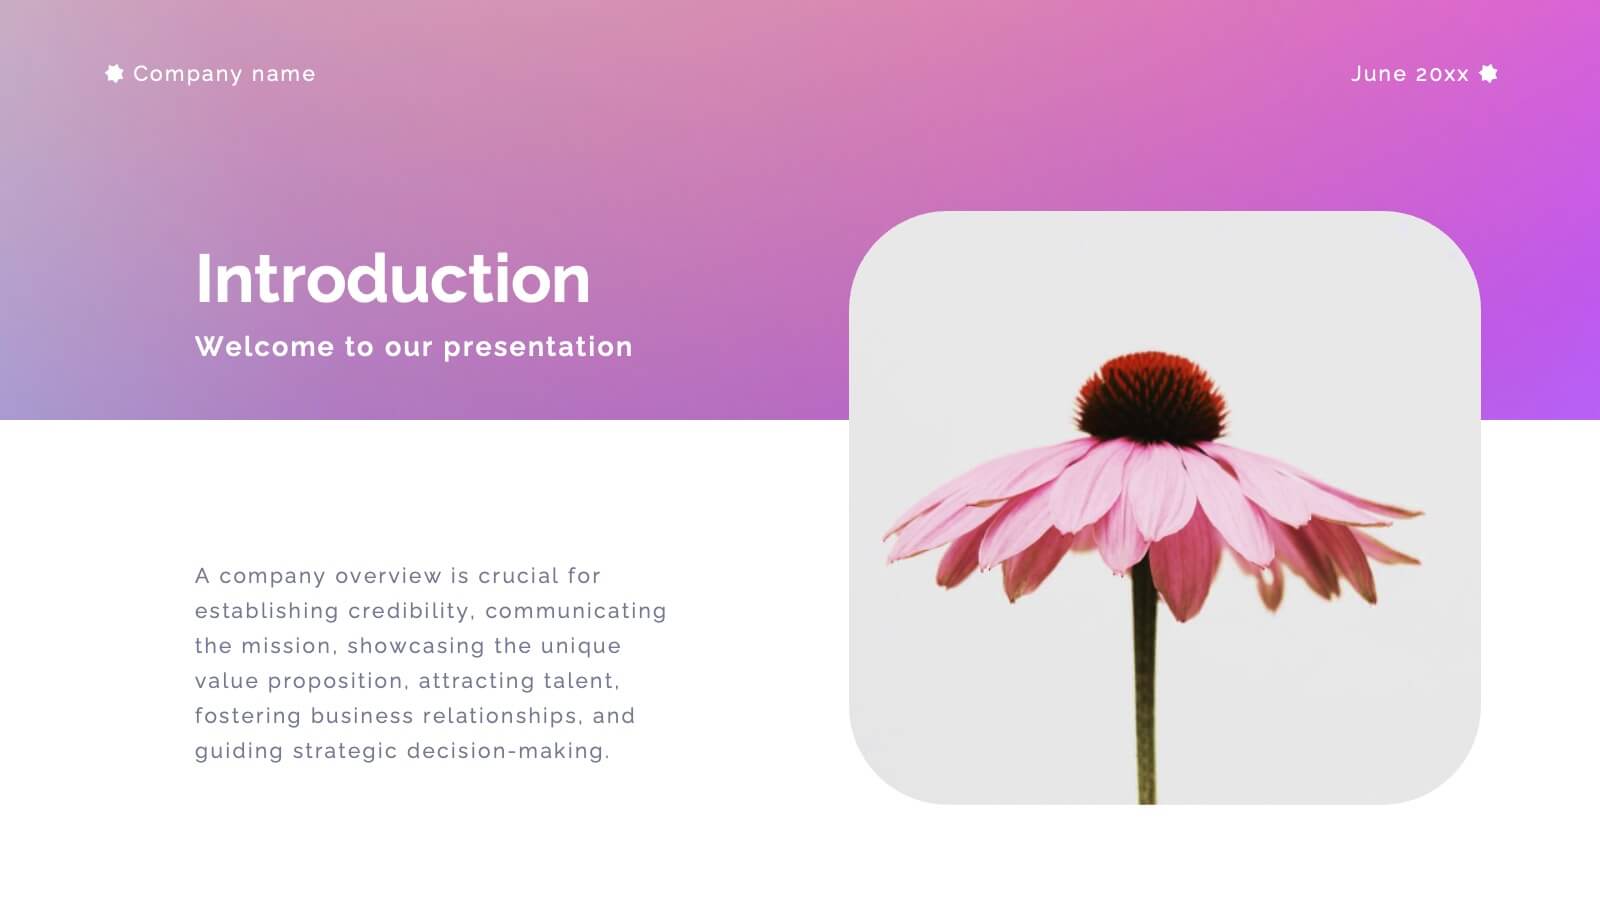
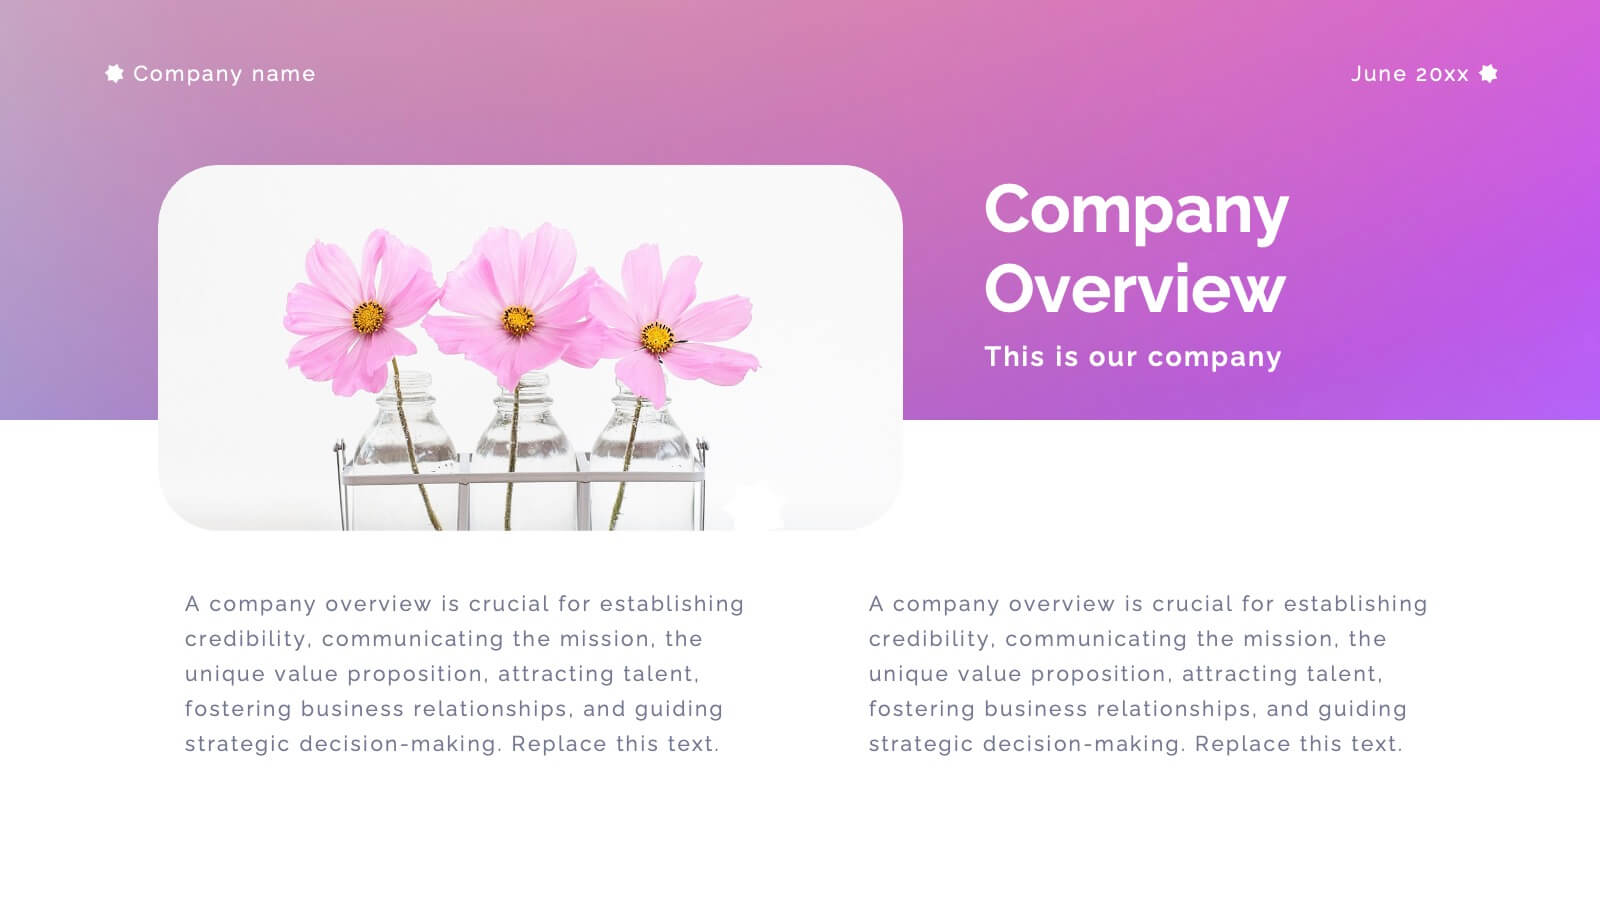
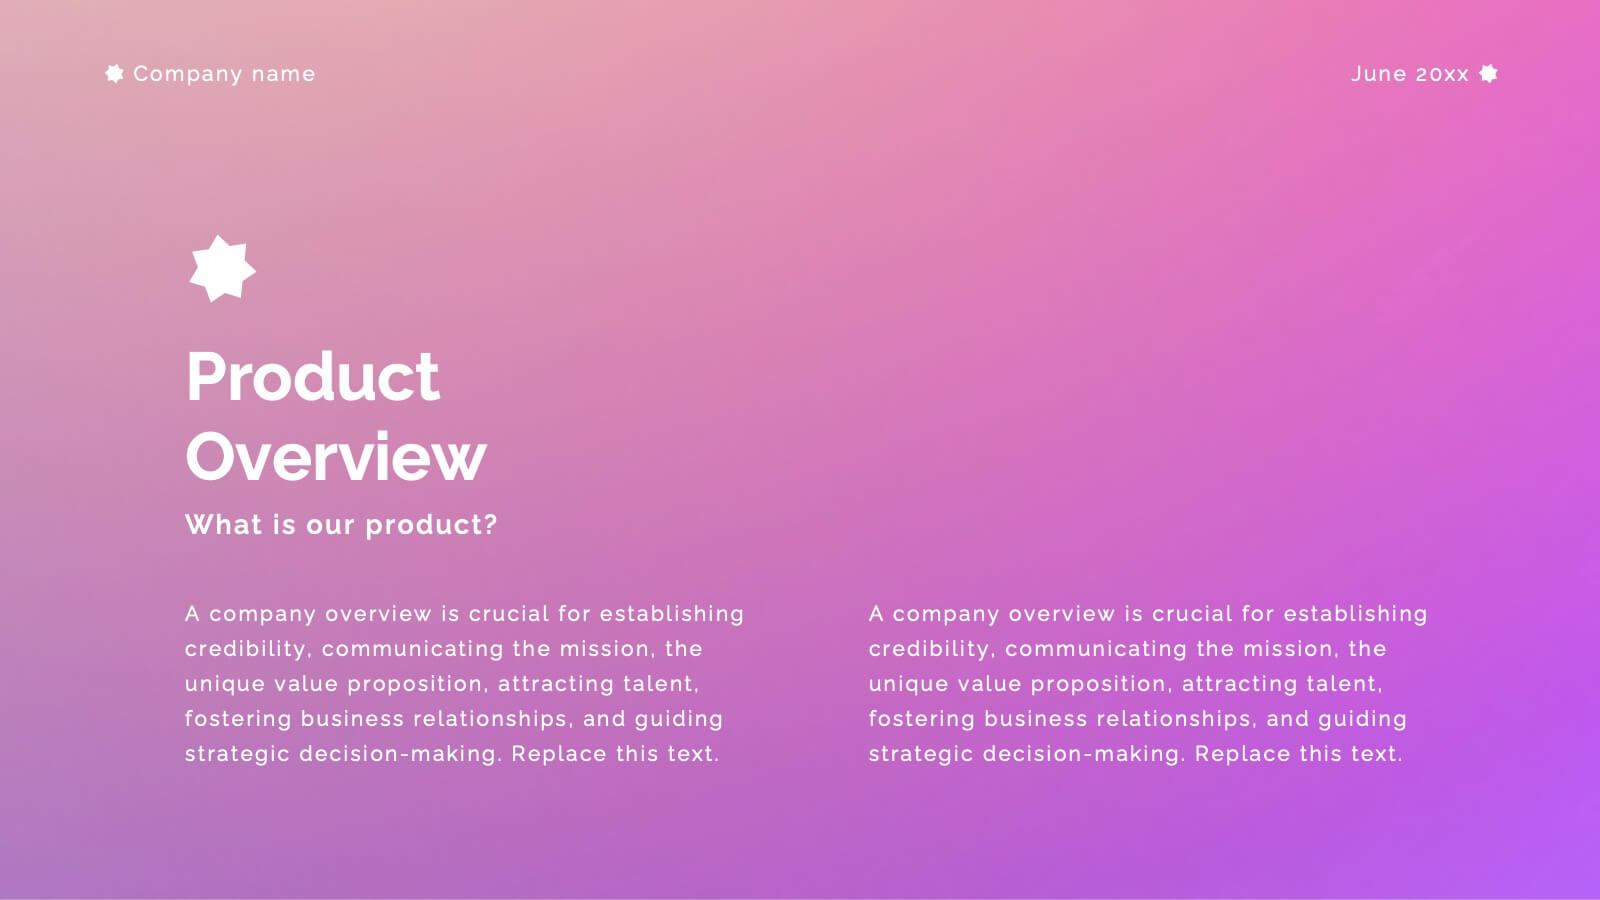
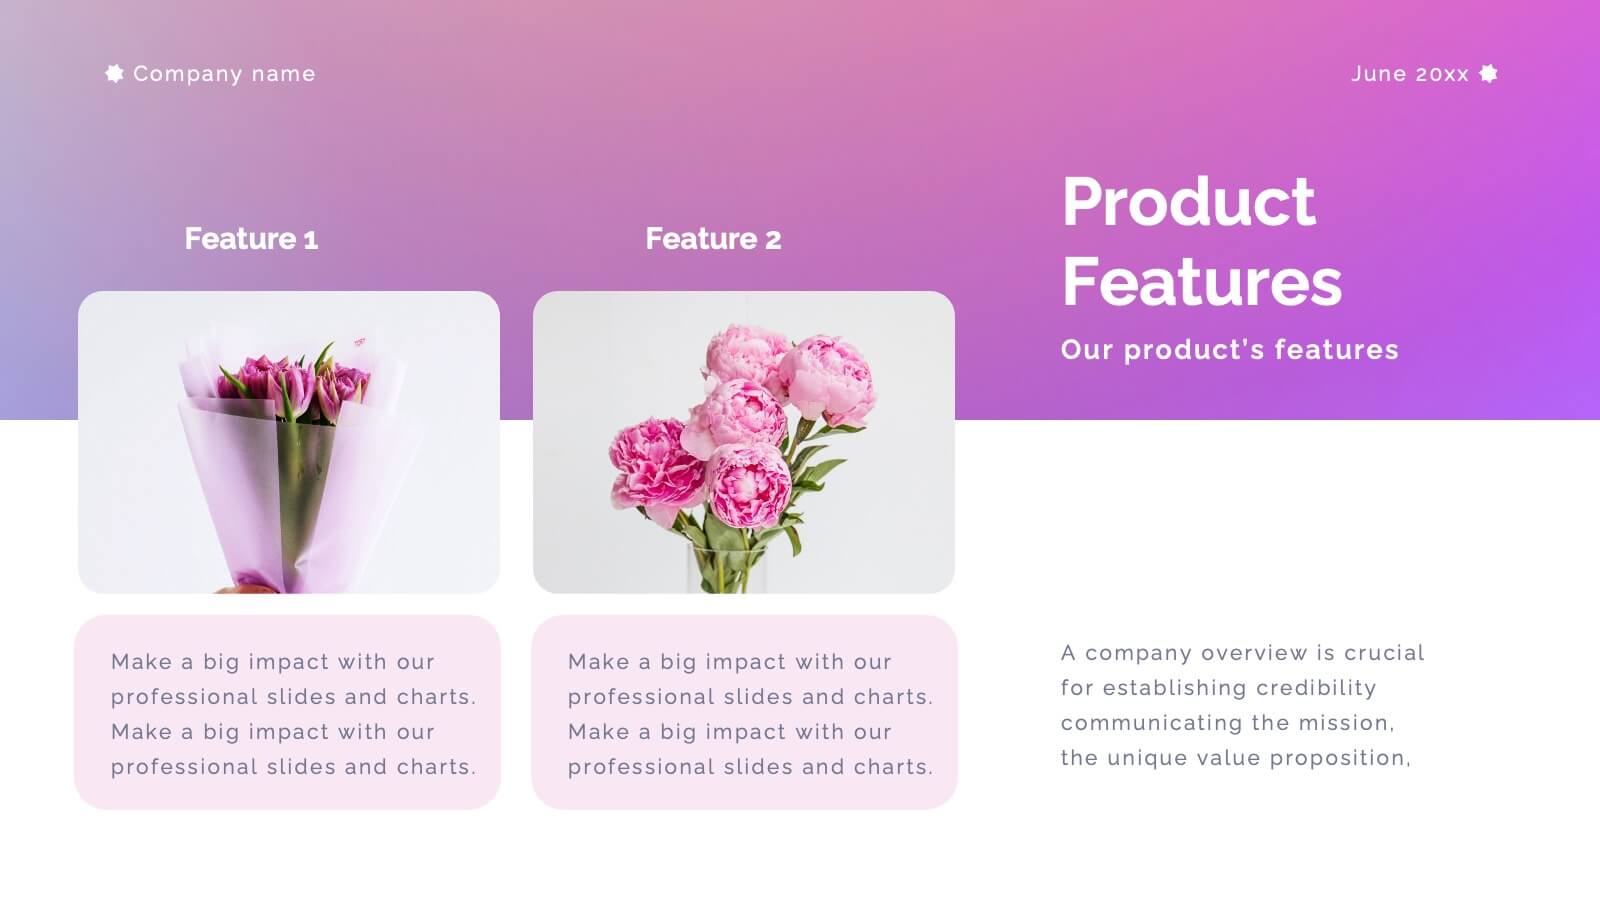
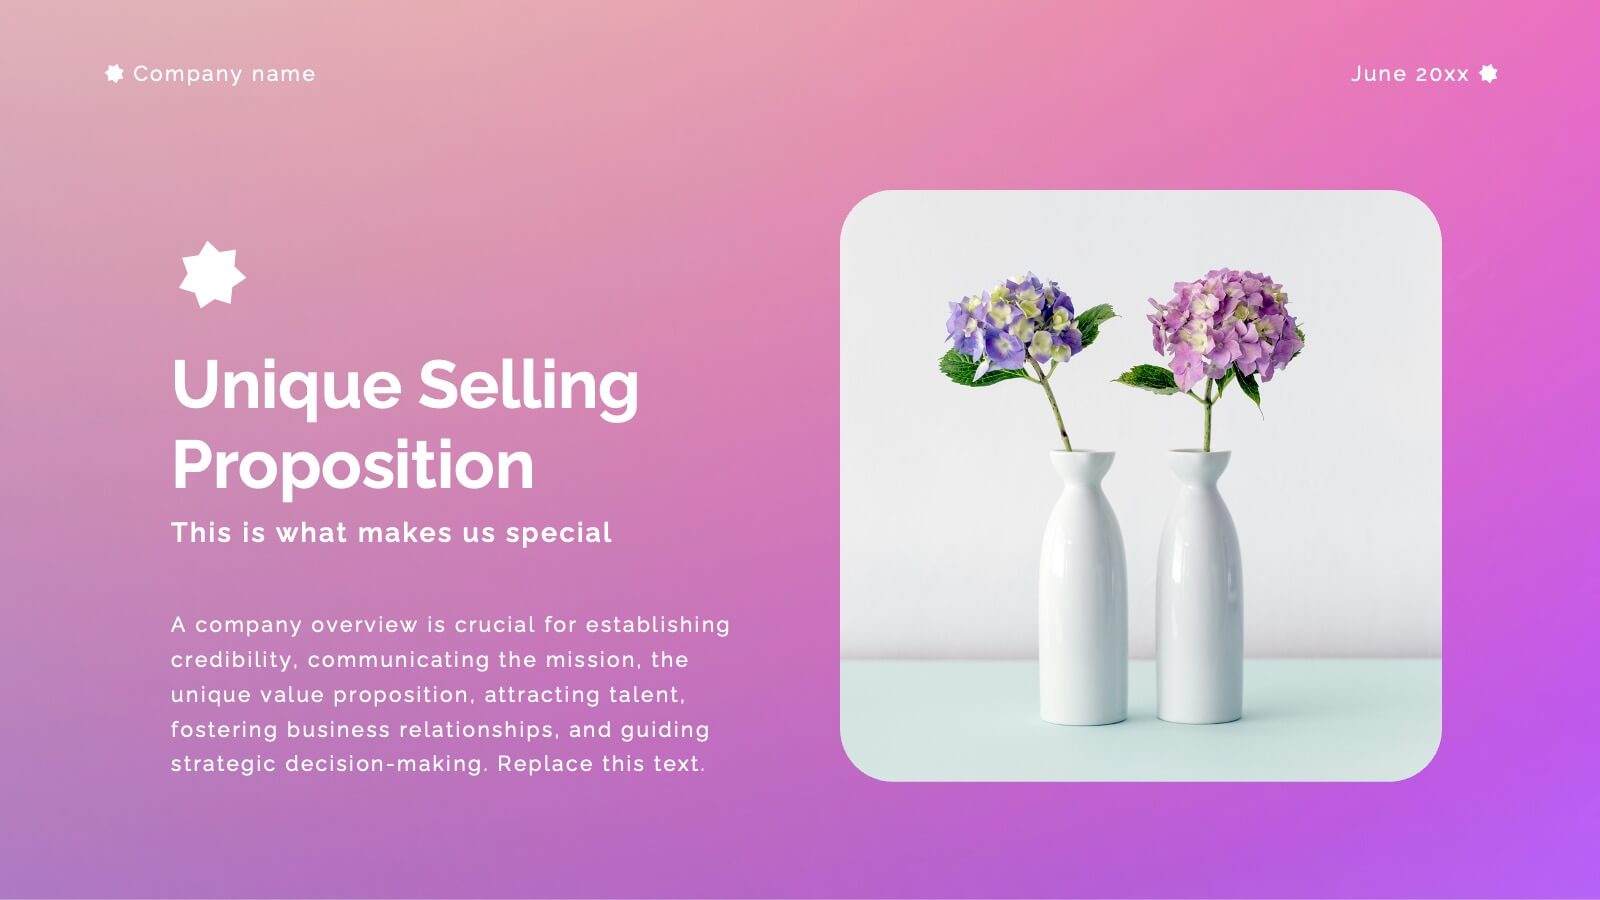
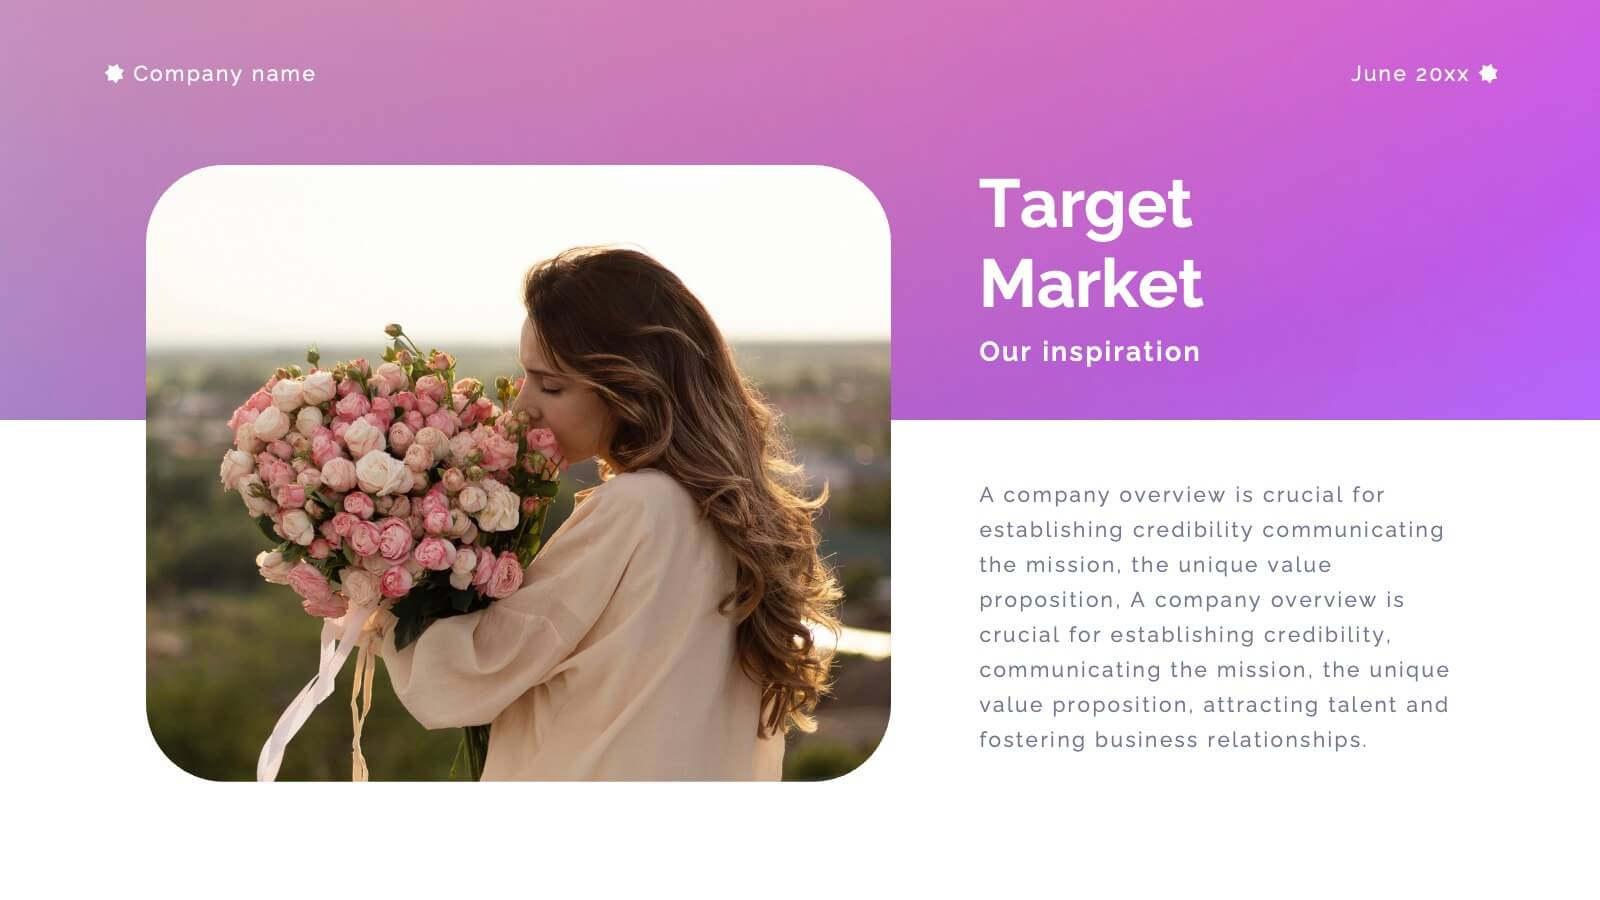
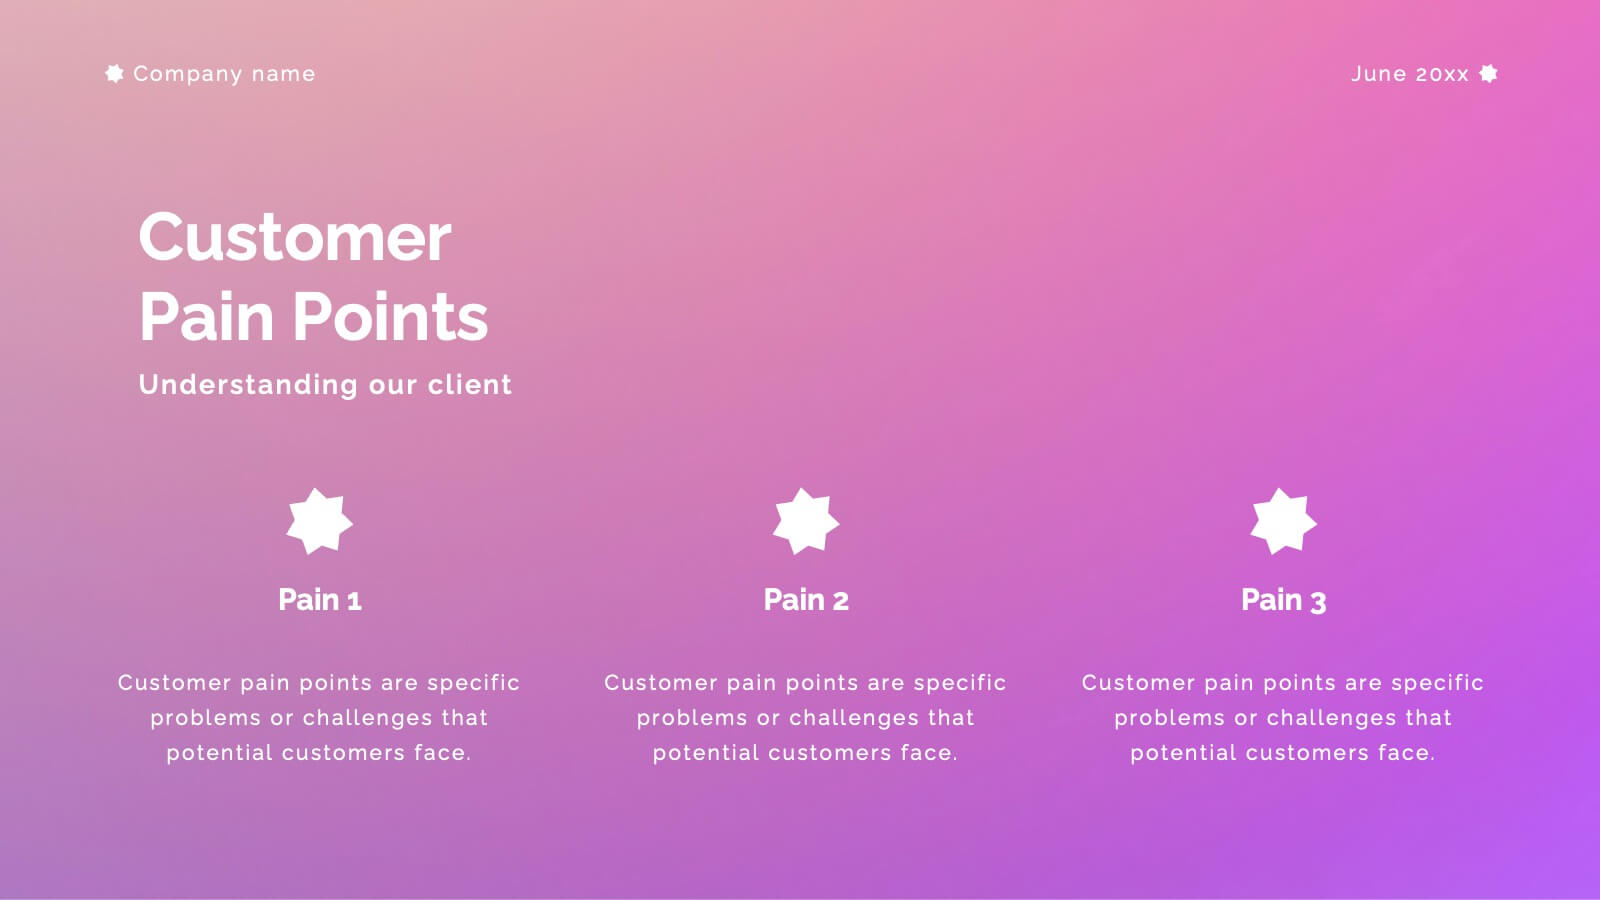
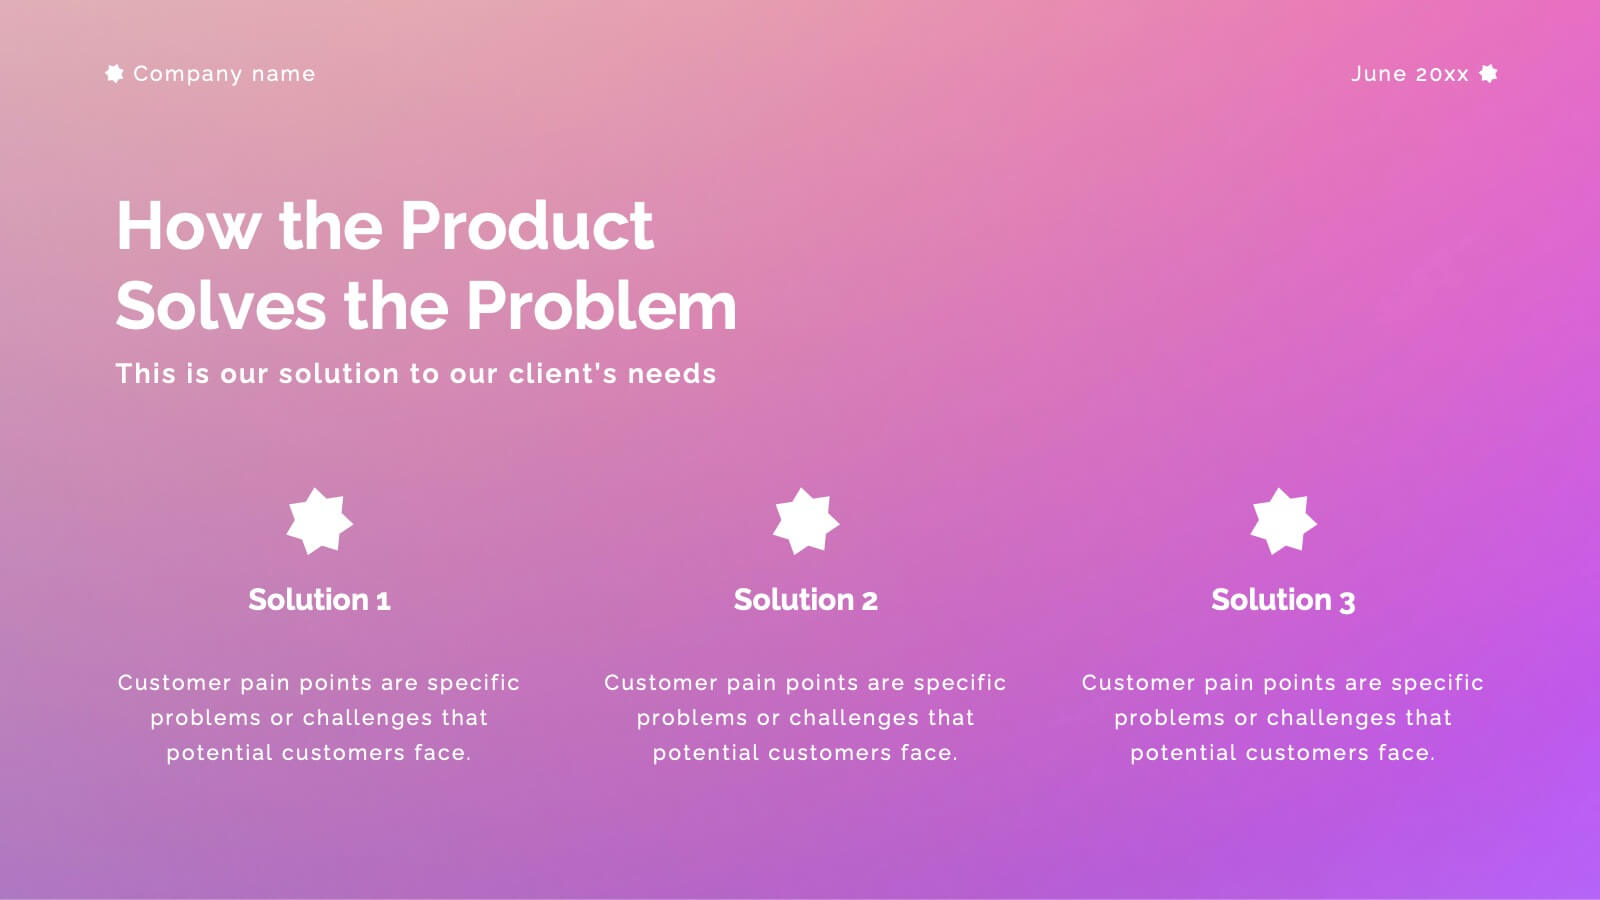
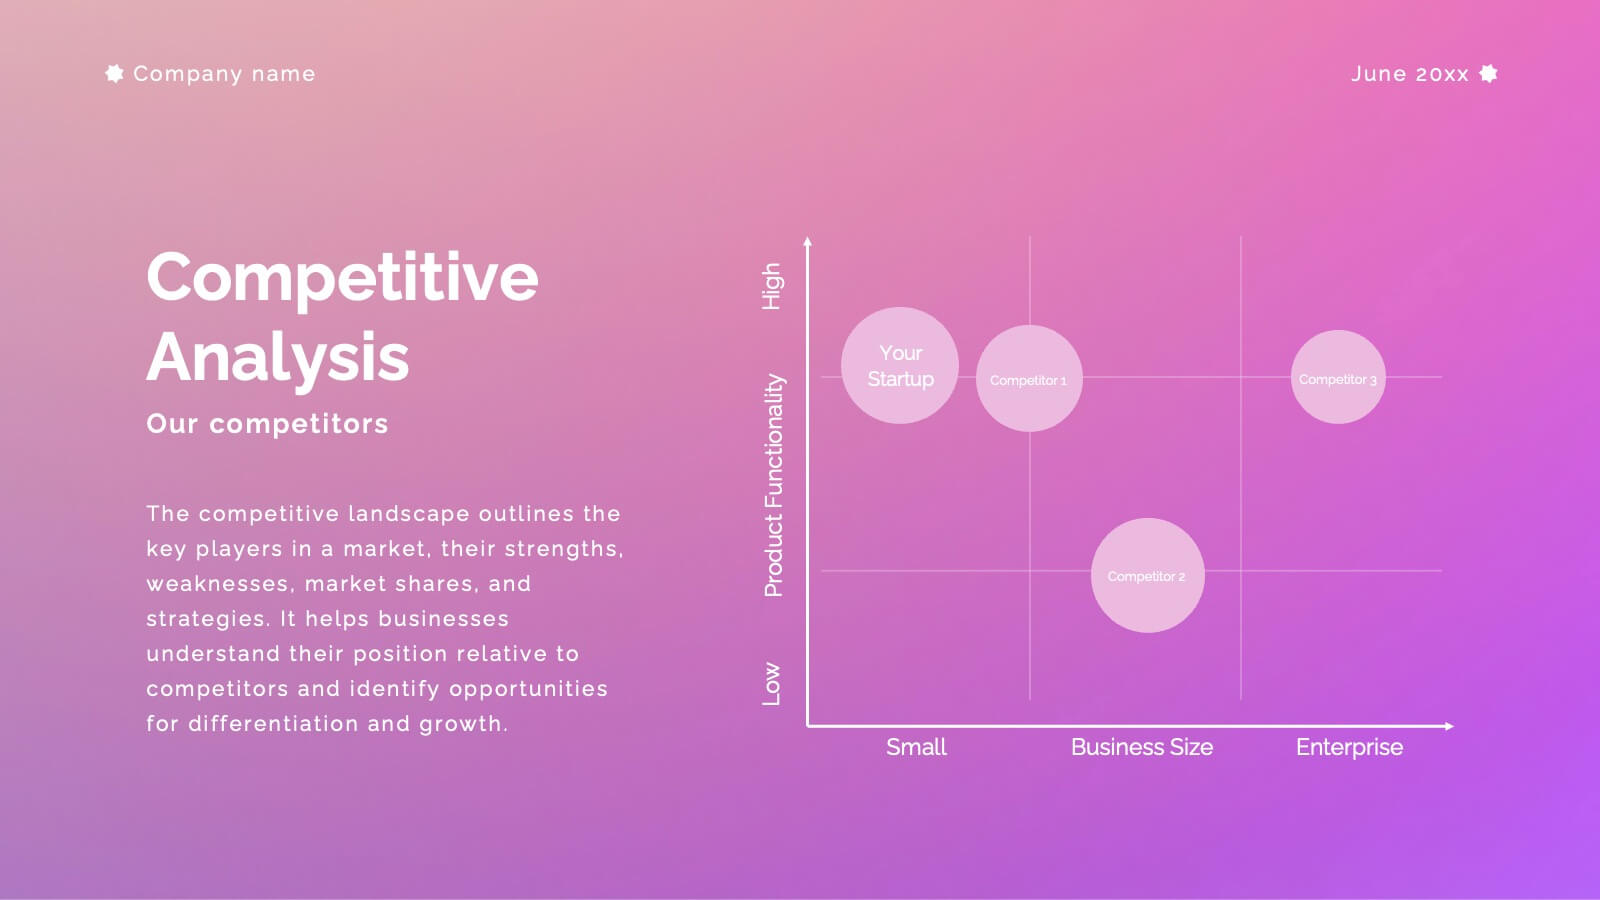
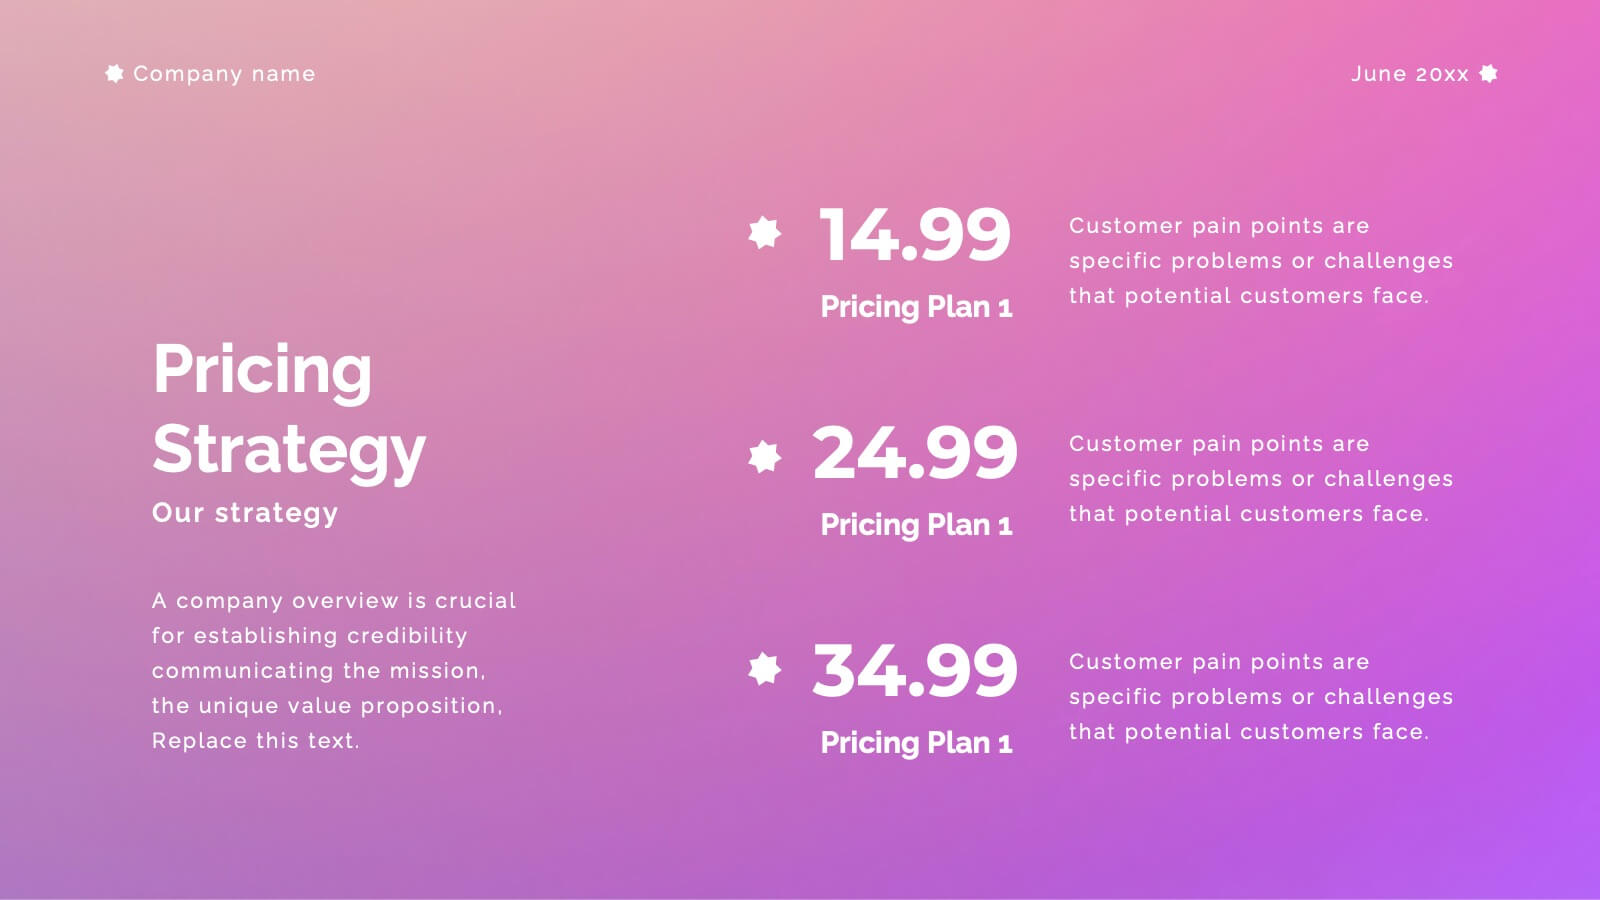
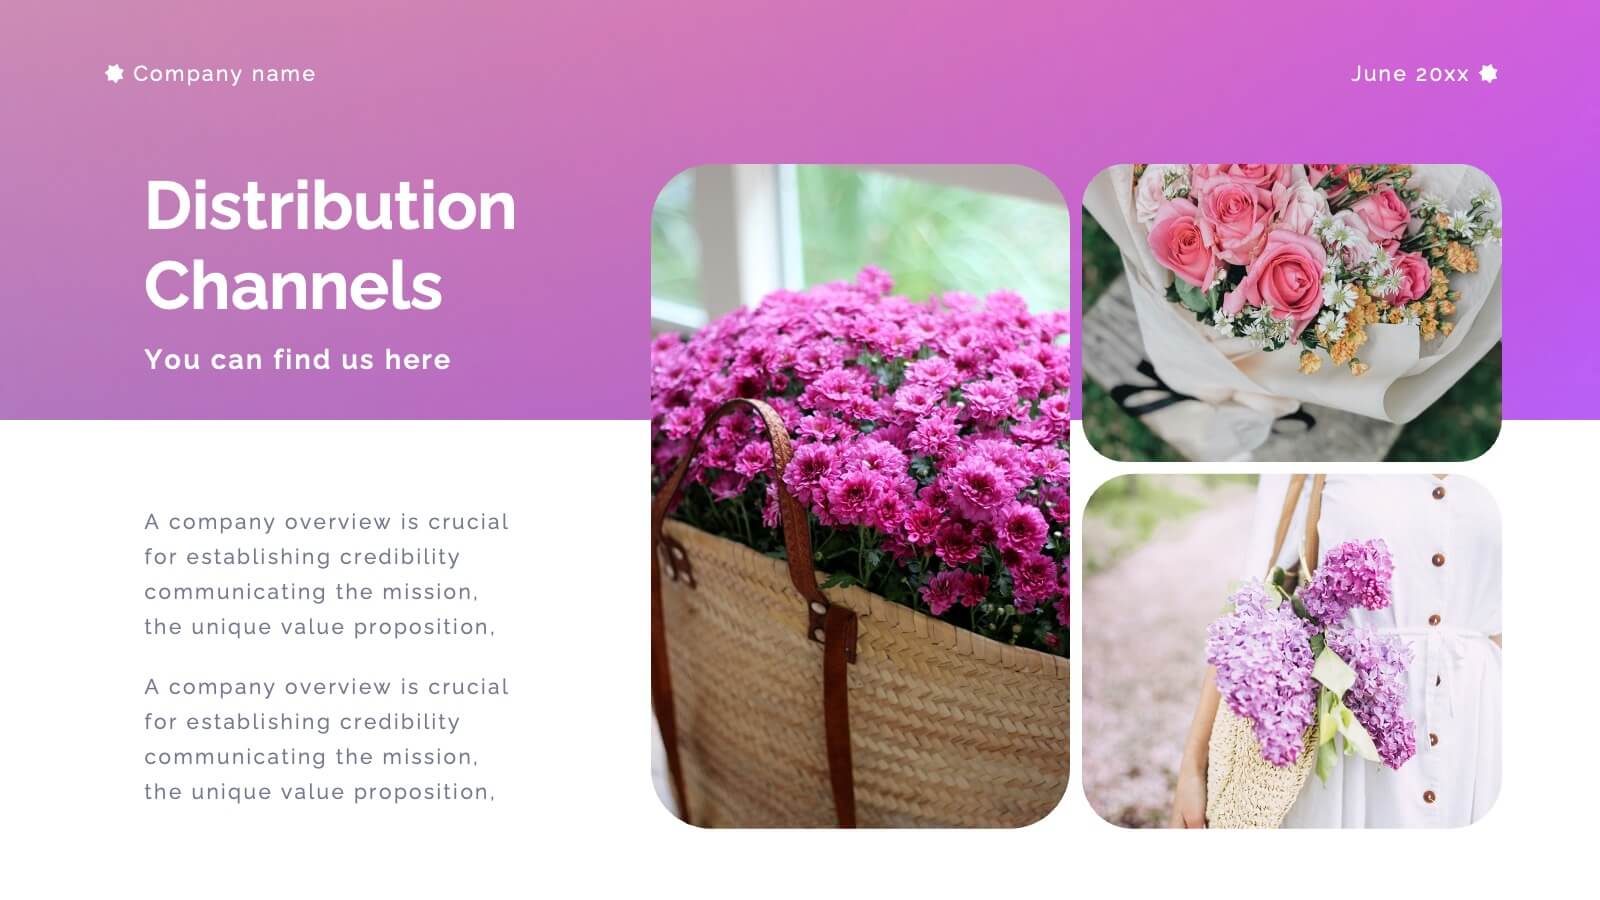
Aventurine New Product Proposal Presentation
Showcase your product in style with this vibrant and modern product proposal template! It covers everything from product features to target market, pricing strategy, and marketing plans. Designed for clarity and impact, it's perfect for pitching your product. Fully customizable, and compatible with PowerPoint, Keynote, and Google Slides for seamless presentations.


6 diapositivas
6-Step Circular Process Diagram Presentation
Bring your workflow to life with a clean circular layout that makes every phase feel connected and easy to follow. This presentation breaks complex processes into six intuitive steps, ideal for strategy, planning, or operations. Fully compatible with PowerPoint, Keynote, and Google Slides.


2 diapositivas
Jobs to Work From Home Illustrations
Empower your remote workforce with our jobs to work from home illustrations pack. These are designed to ignite the spark of remote work possibilities and bring a burst of energy to your presentations! Fully compatible with PowerPoint, Google Slides, and Keynote, they're easy to add to any presentation. Step into the world of remote work with these dynamic illustrations that capture the essence of modern work trends. Download the jobs to work from home illustrations today!


20 diapositivas
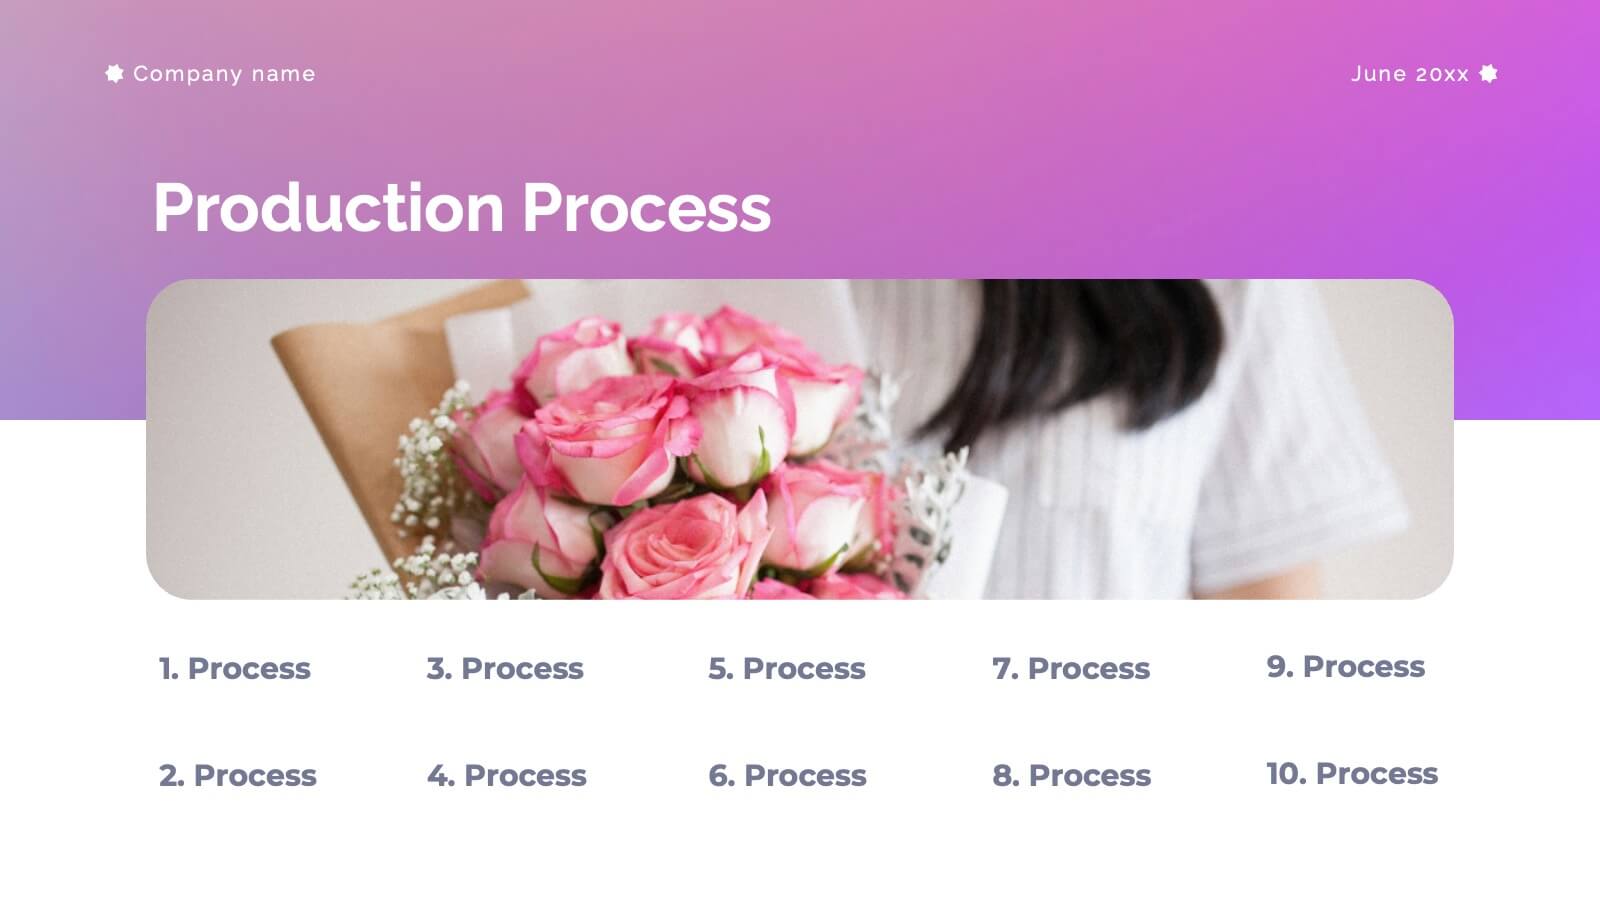
Vivid Product Development Plan Presentation
Develop your product with confidence using this detailed product development plan template! Perfect for outlining features, market analysis, and competitive advantages. Ideal for product managers and teams. Compatible with PowerPoint, Keynote, and Google Slides, this template ensures your plan is clear, professional, and comprehensive. Achieve product success today!


6 diapositivas
Modern Circle Infographic
Our Modern Circle infographic is a contemporary visual tool designed for seamless integration with Powerpoint, Keynote, and Google Slides. This infographic is particularly useful for professionals and educators looking to present information in a cyclical process or to illustrate a concept that involves interconnected elements. The design of the Modern Circle infographic is intuitive and engaging, facilitating the representation of processes, relationships, or statistics in a clear, circular format. The sleek and modern aesthetic ensures that your information is conveyed in a visually appealing manner, keeping your audience engaged and focused on the content. By utilizing this infographic, you have the ability to present complex data or concepts in a simplified form, making it accessible for all audience types. Whether you’re detailing a business cycle, demonstrating a feedback loop, or presenting a series of steps in a continuous process, the Modern Circle infographic is your go-to for adding a touch of sophistication to your presentations. Its adaptability and stylish design will enhance your ability to communicate effectively with any audience.


22 diapositivas
Etherwind Advertising Agency Proposal Presentation
This Advertising Agency Proposal Presentation Template offers a sleek and professional layout, perfect for showcasing your agency's capabilities, services, and success stories. Covering essential sections such as market analysis, strategy development, campaign execution, and client testimonials, it ensures a compelling pitch to potential clients. Designed for easy customization in PowerPoint, Keynote, and Google Slides, making it a versatile choice for agencies looking to impress their audience.