


Características


¿Tienes alguna pregunta?
Recomendar


7 diapositivas
McKinsey 7S Model Infographic Presentation Template
The McKinsey 7S model is a management framework developed by the consulting firm McKinsey & Company. The model consists of seven interdependent factors that are important for an organization's success: strategy, structure, systems, shared values, skills, staff, and style. The template can be used to visualize the 7S model hierarchy and the importance of each component to your business. This inventive presentation is designed to take an economic approach, If you’re interested in taking this strategic step to evaluating your processes and measuring performance, this presentation is for you.


23 diapositivas
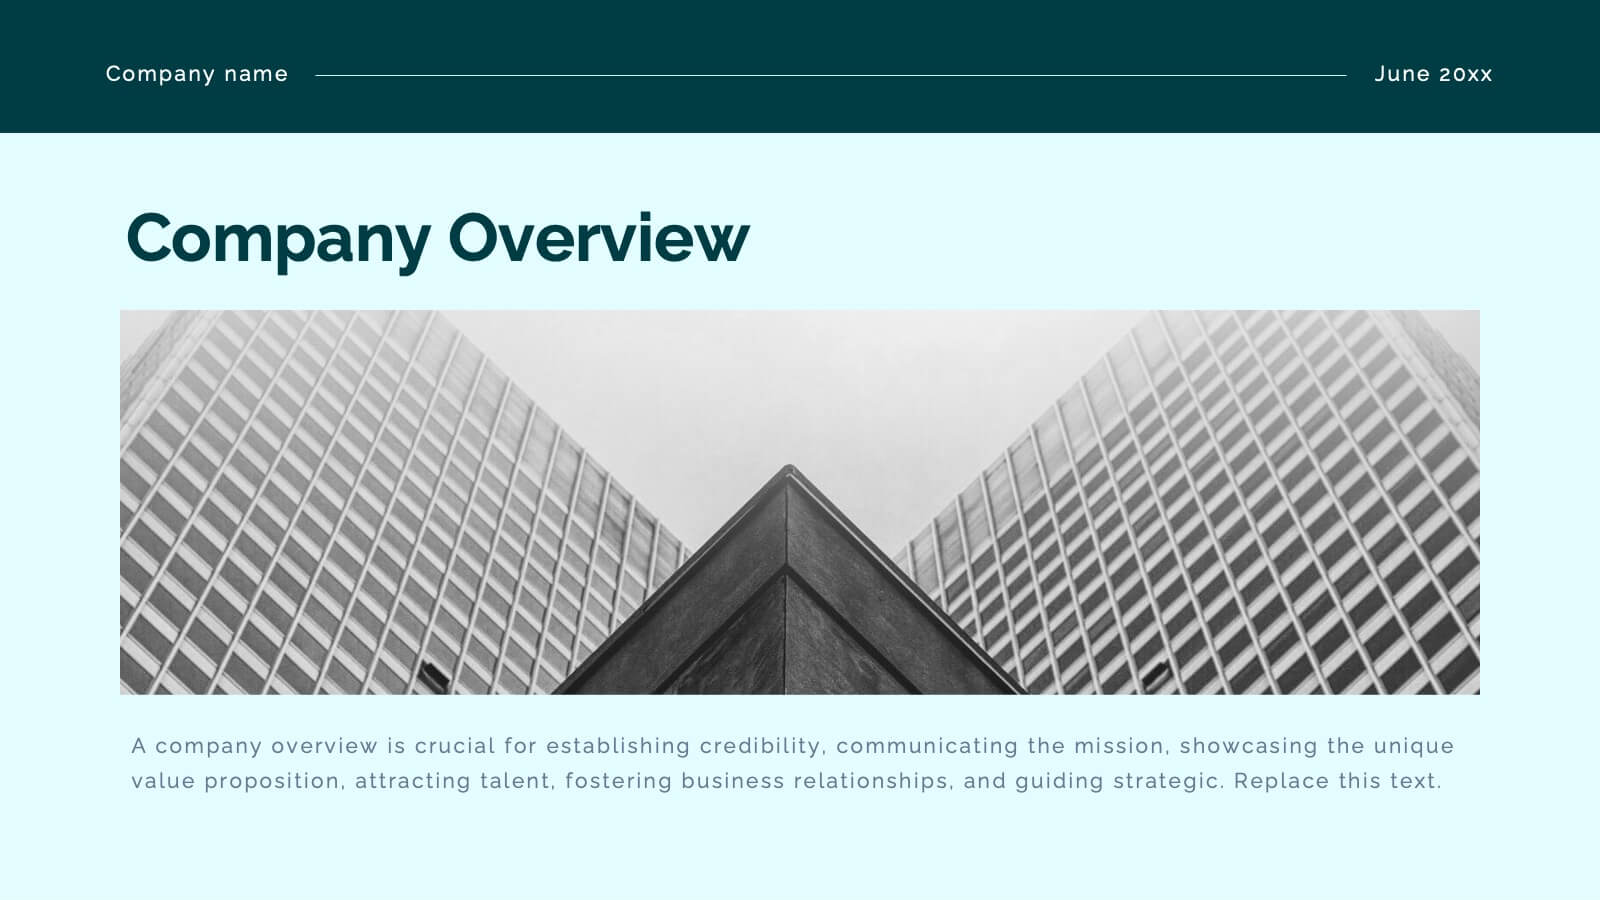
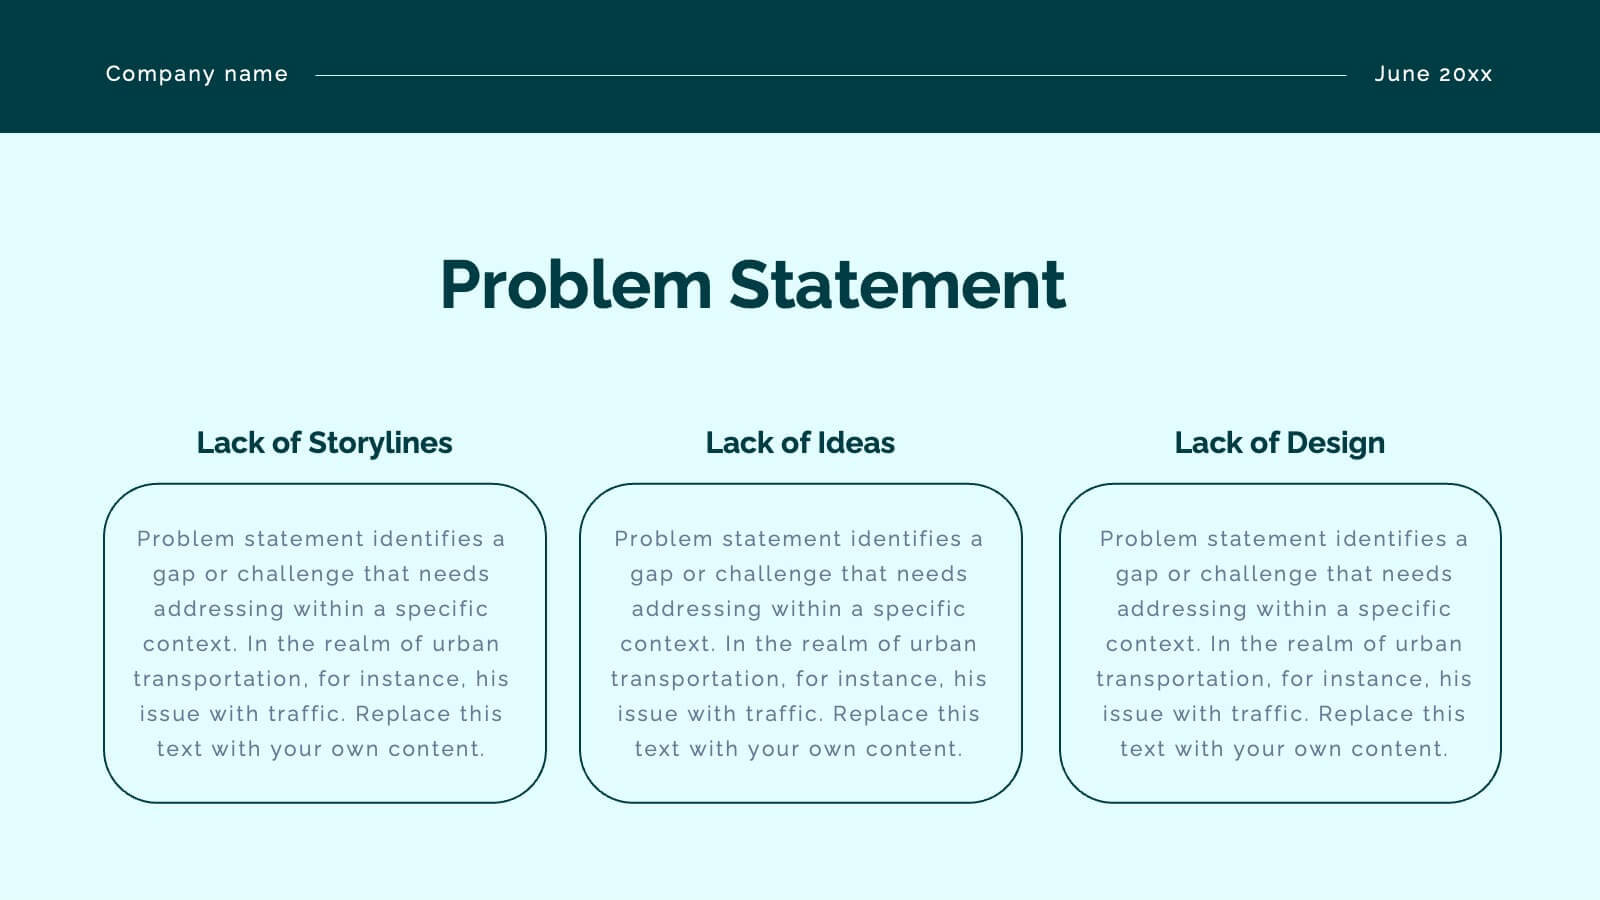
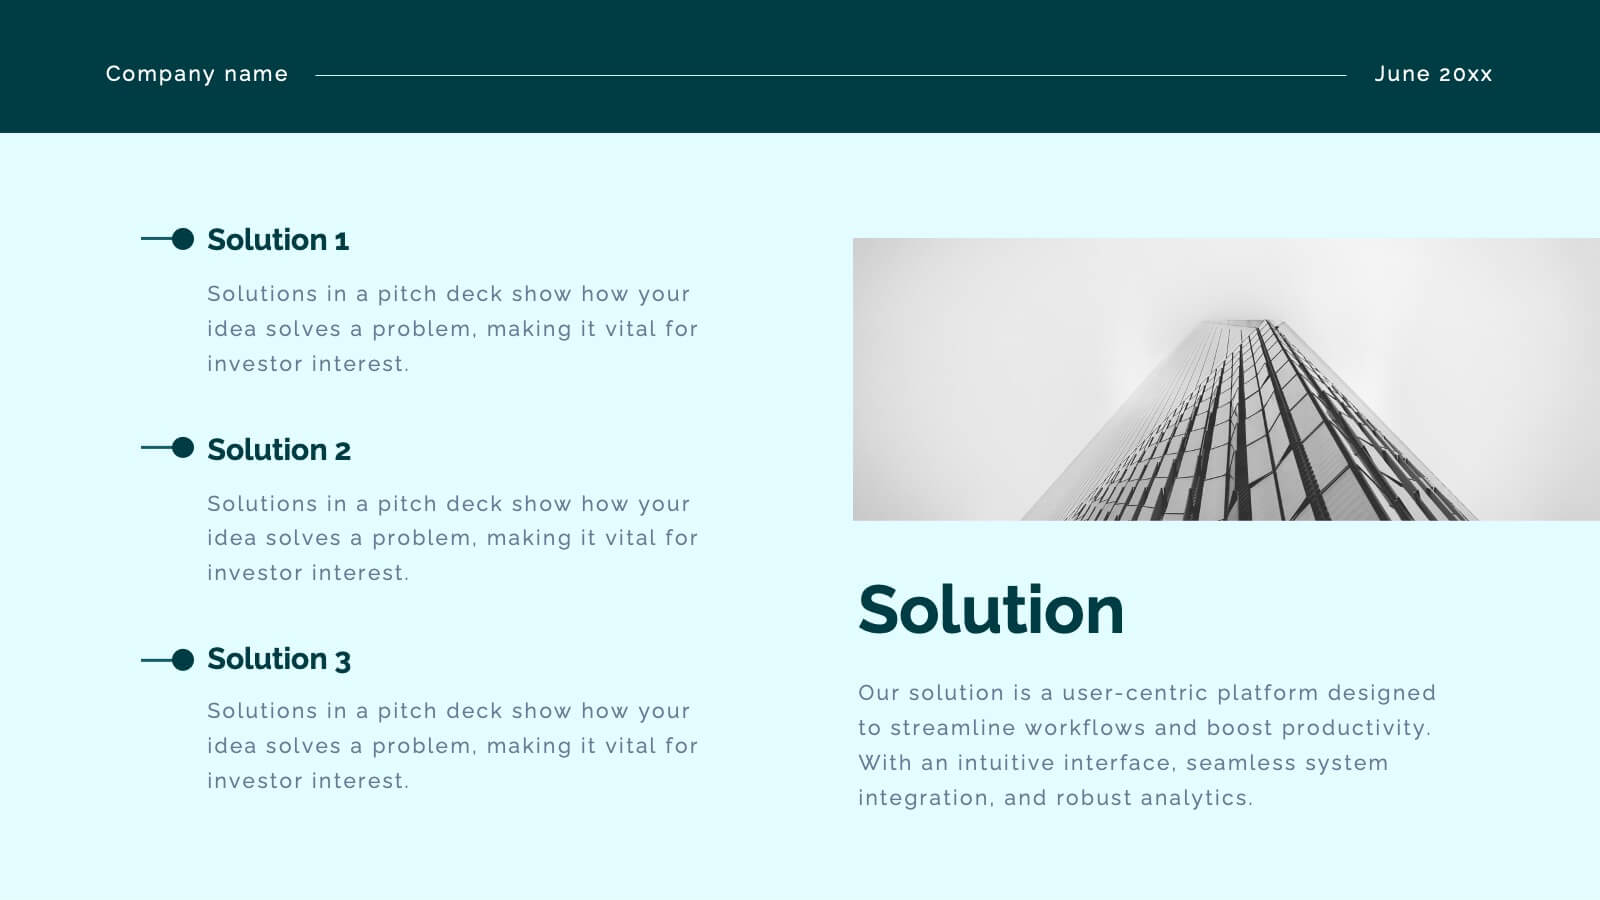
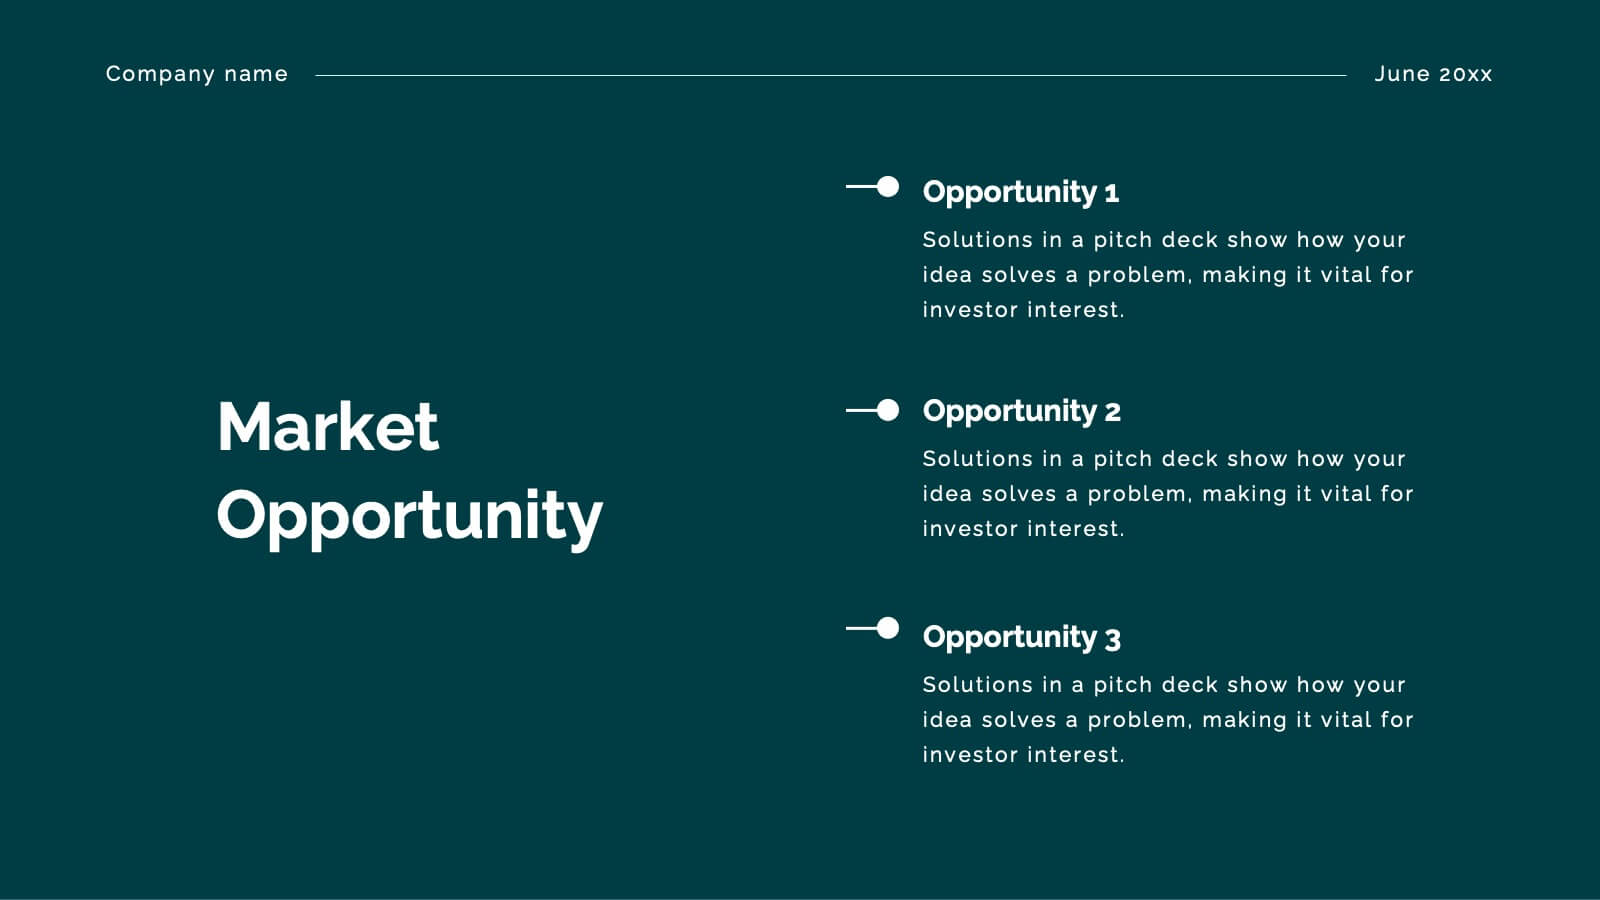
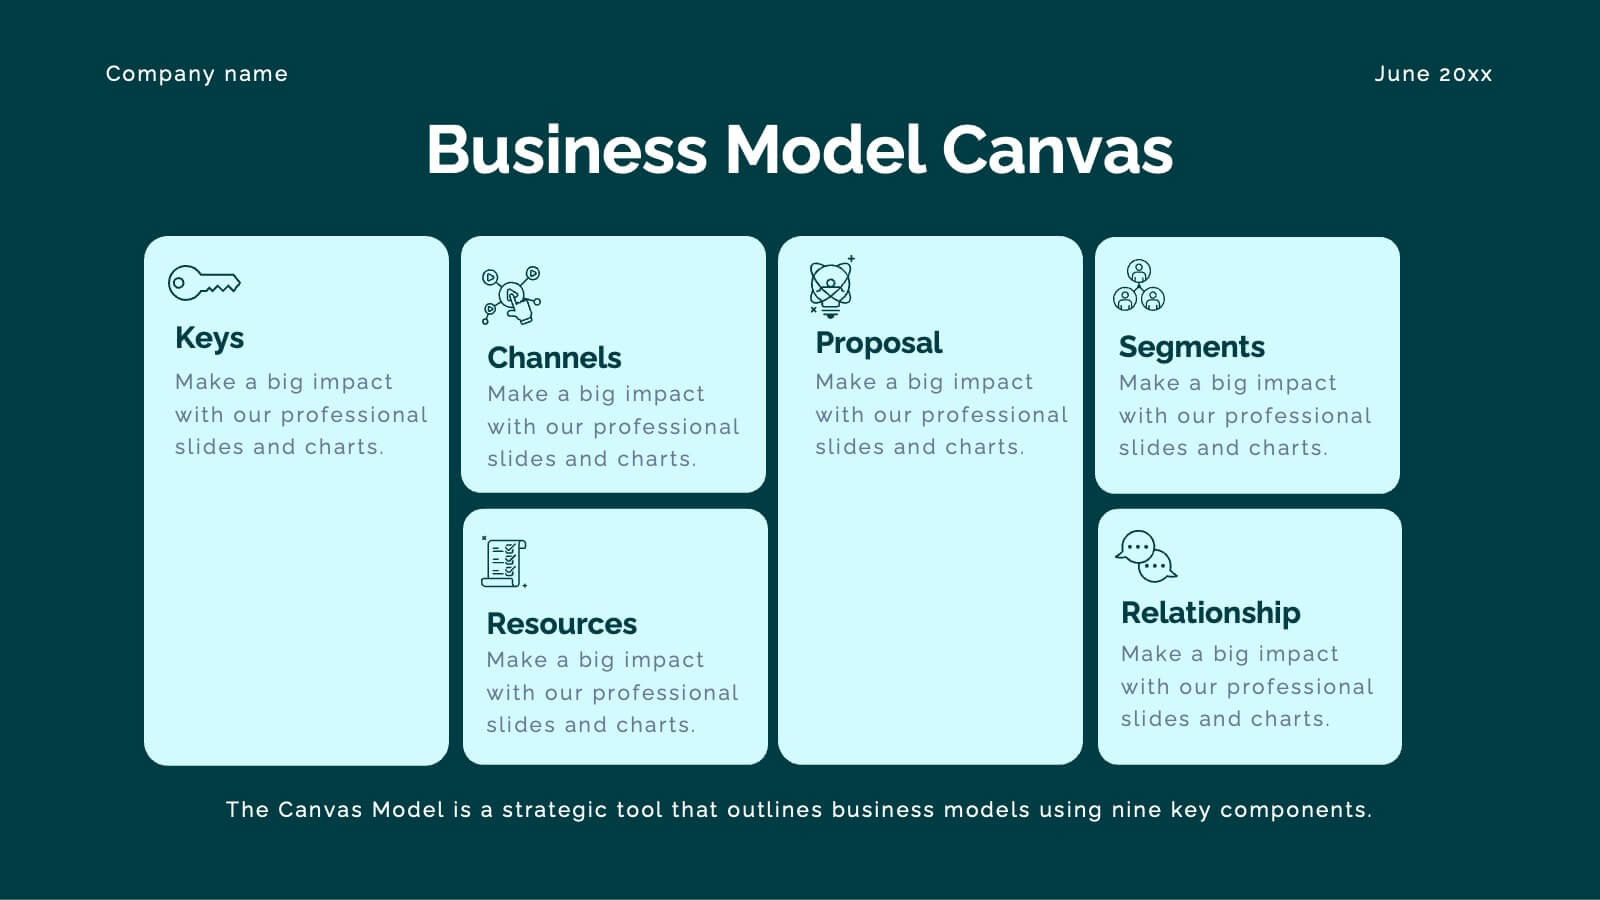
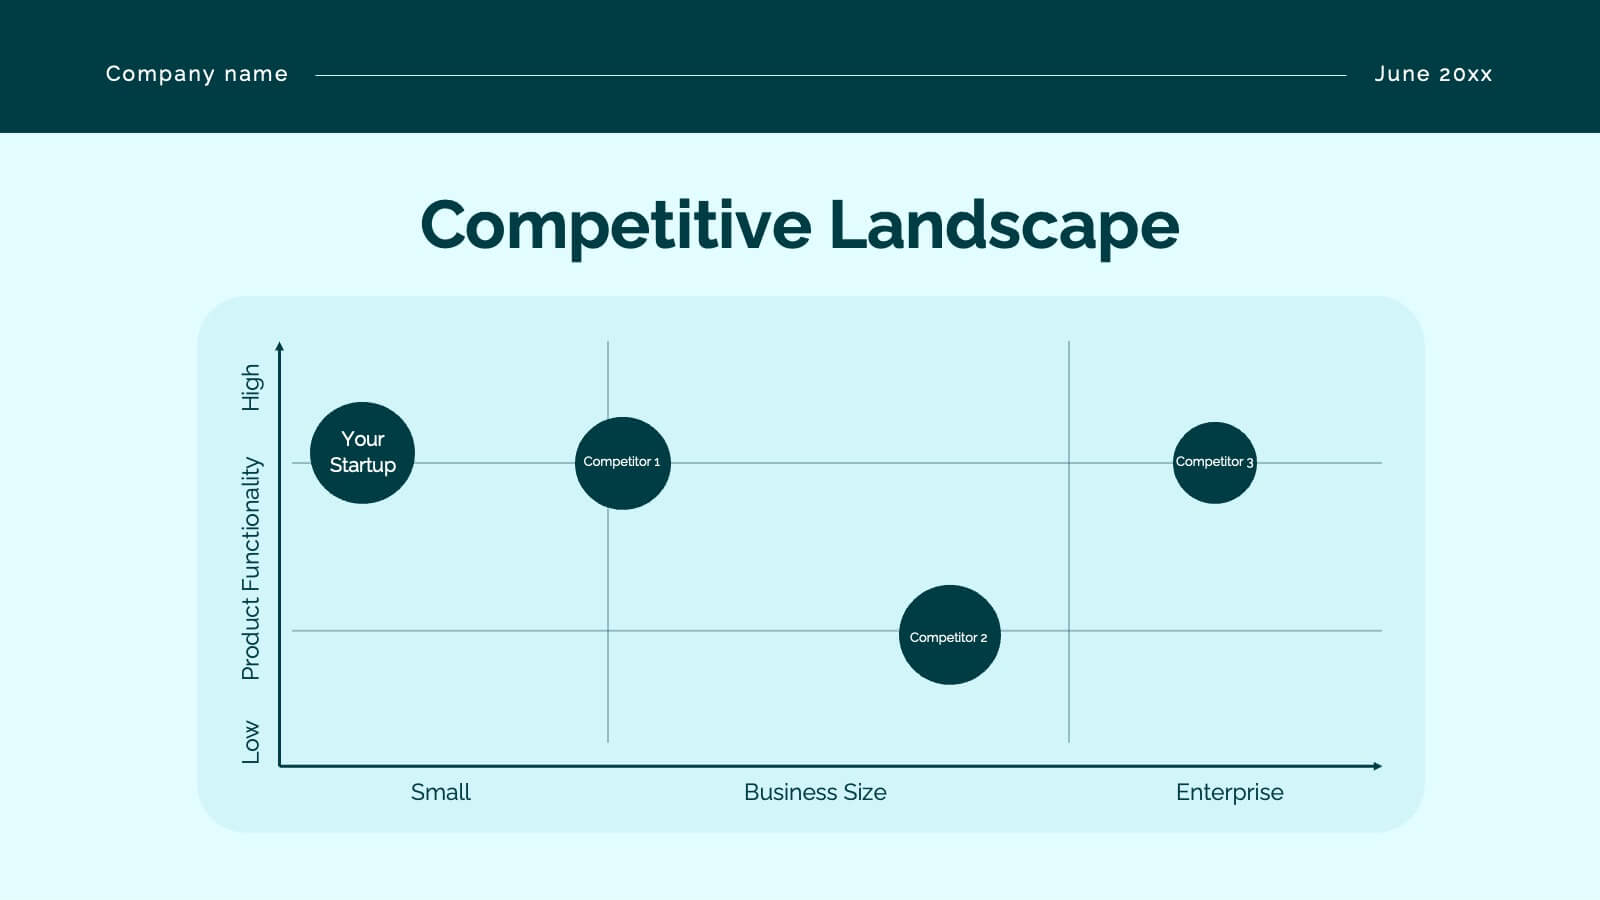
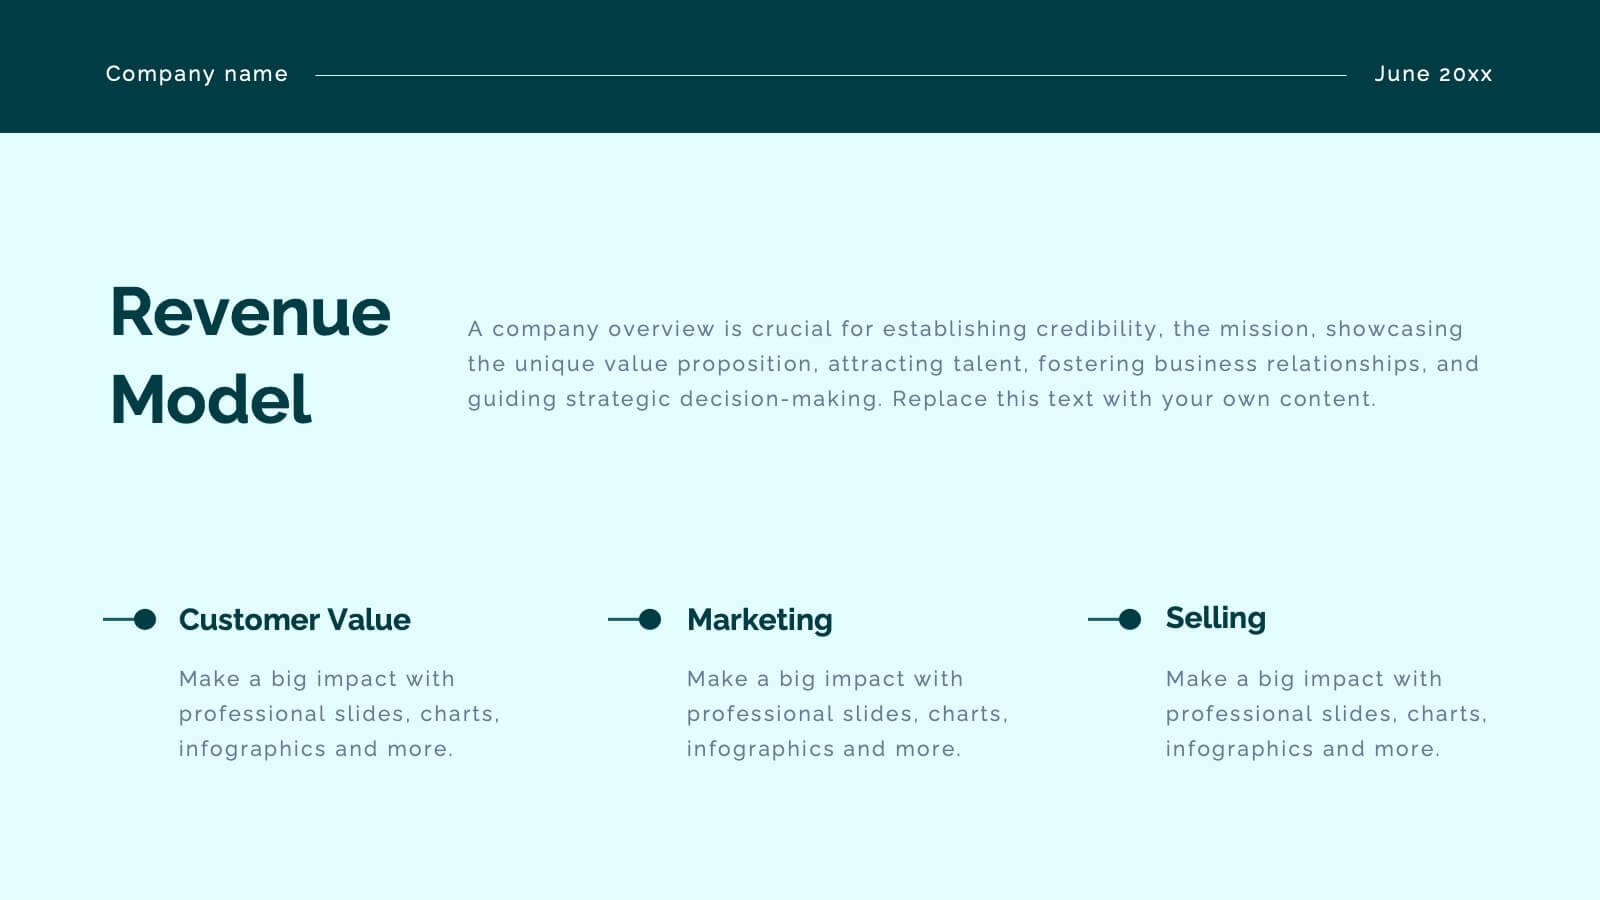
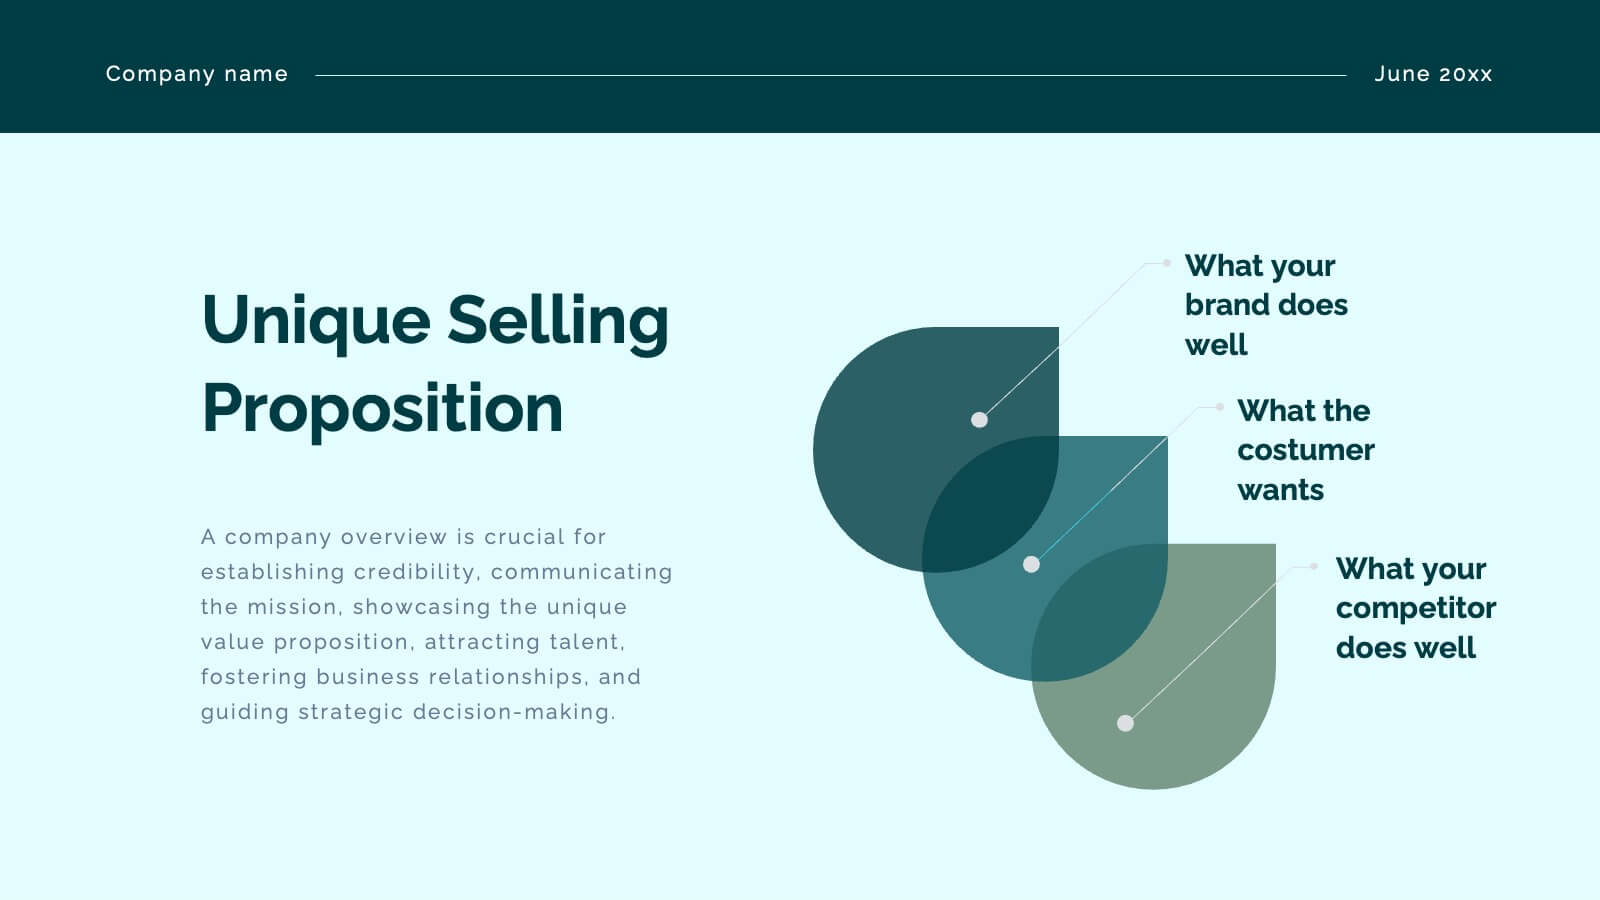
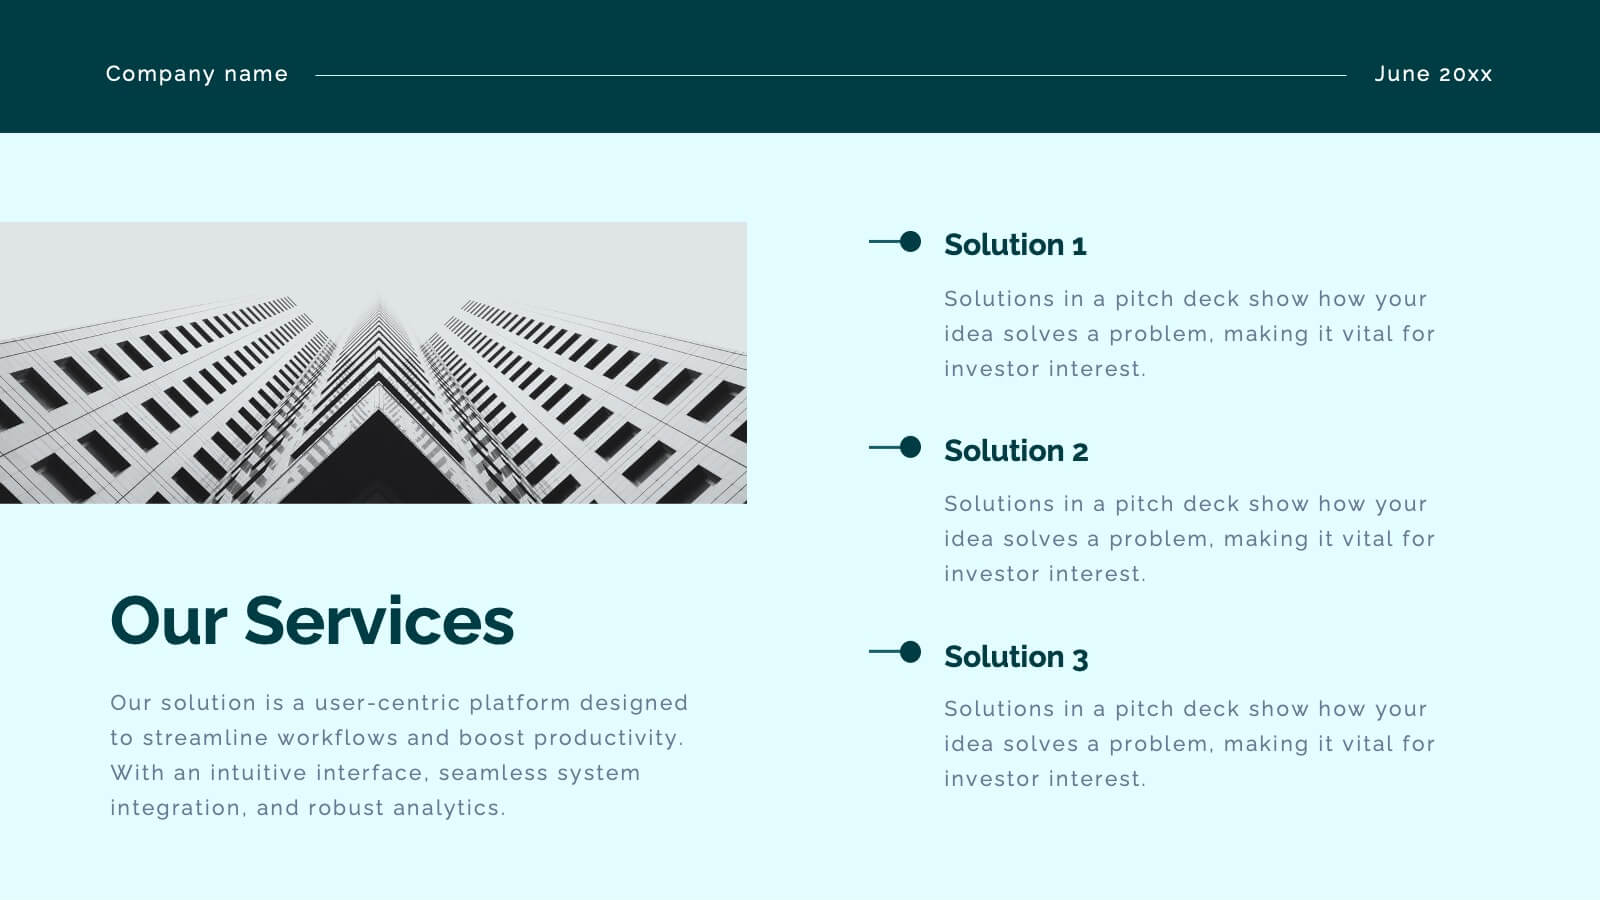
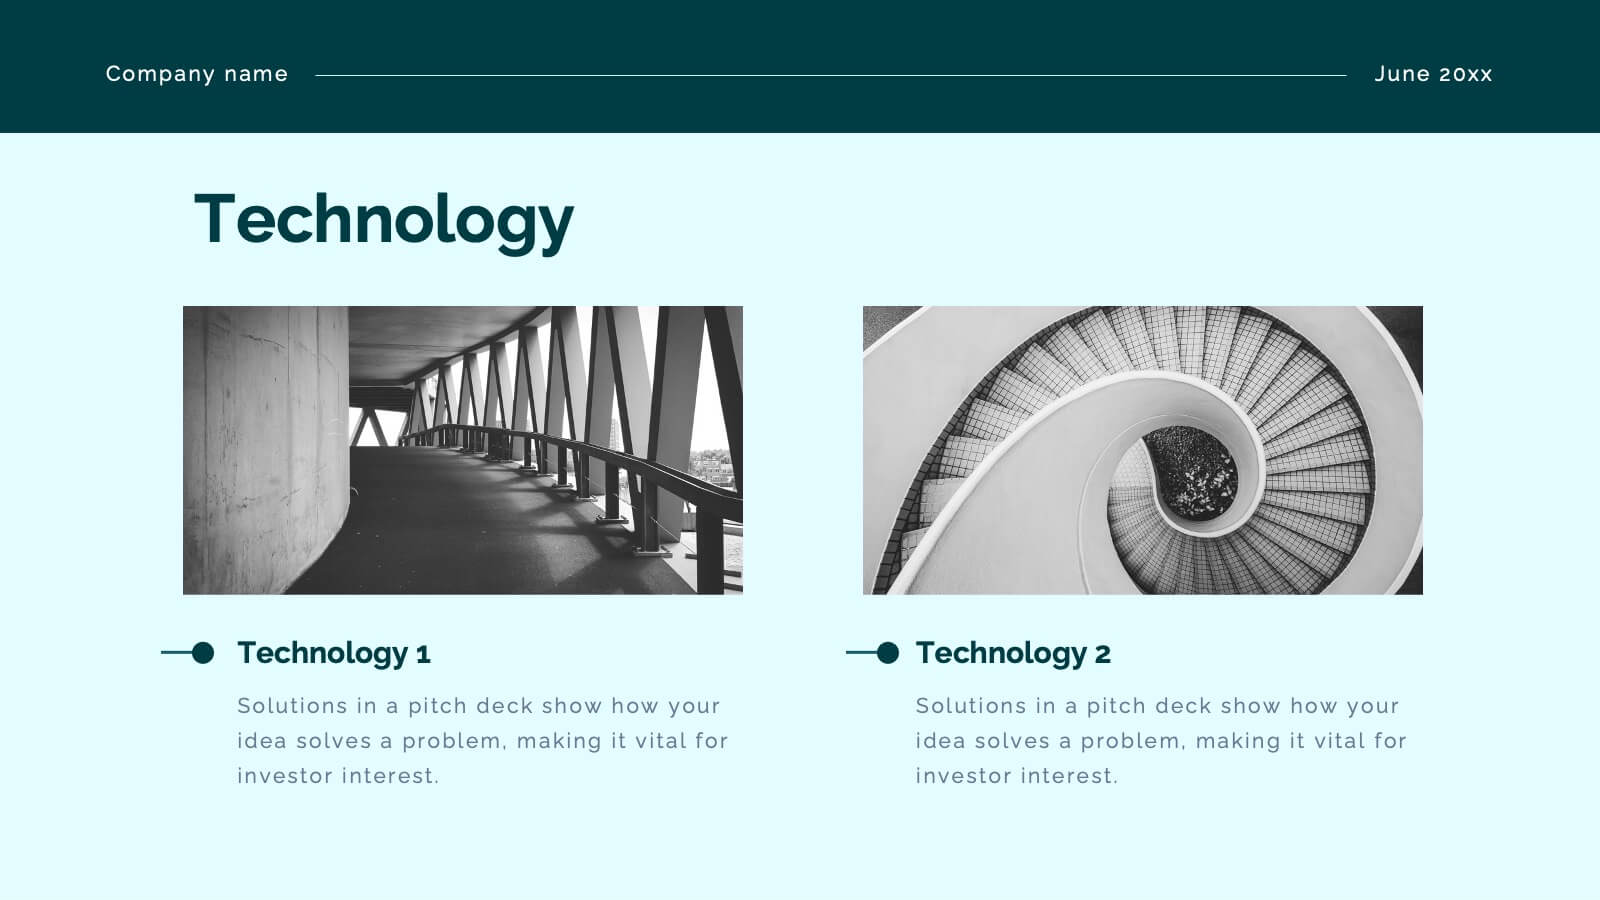
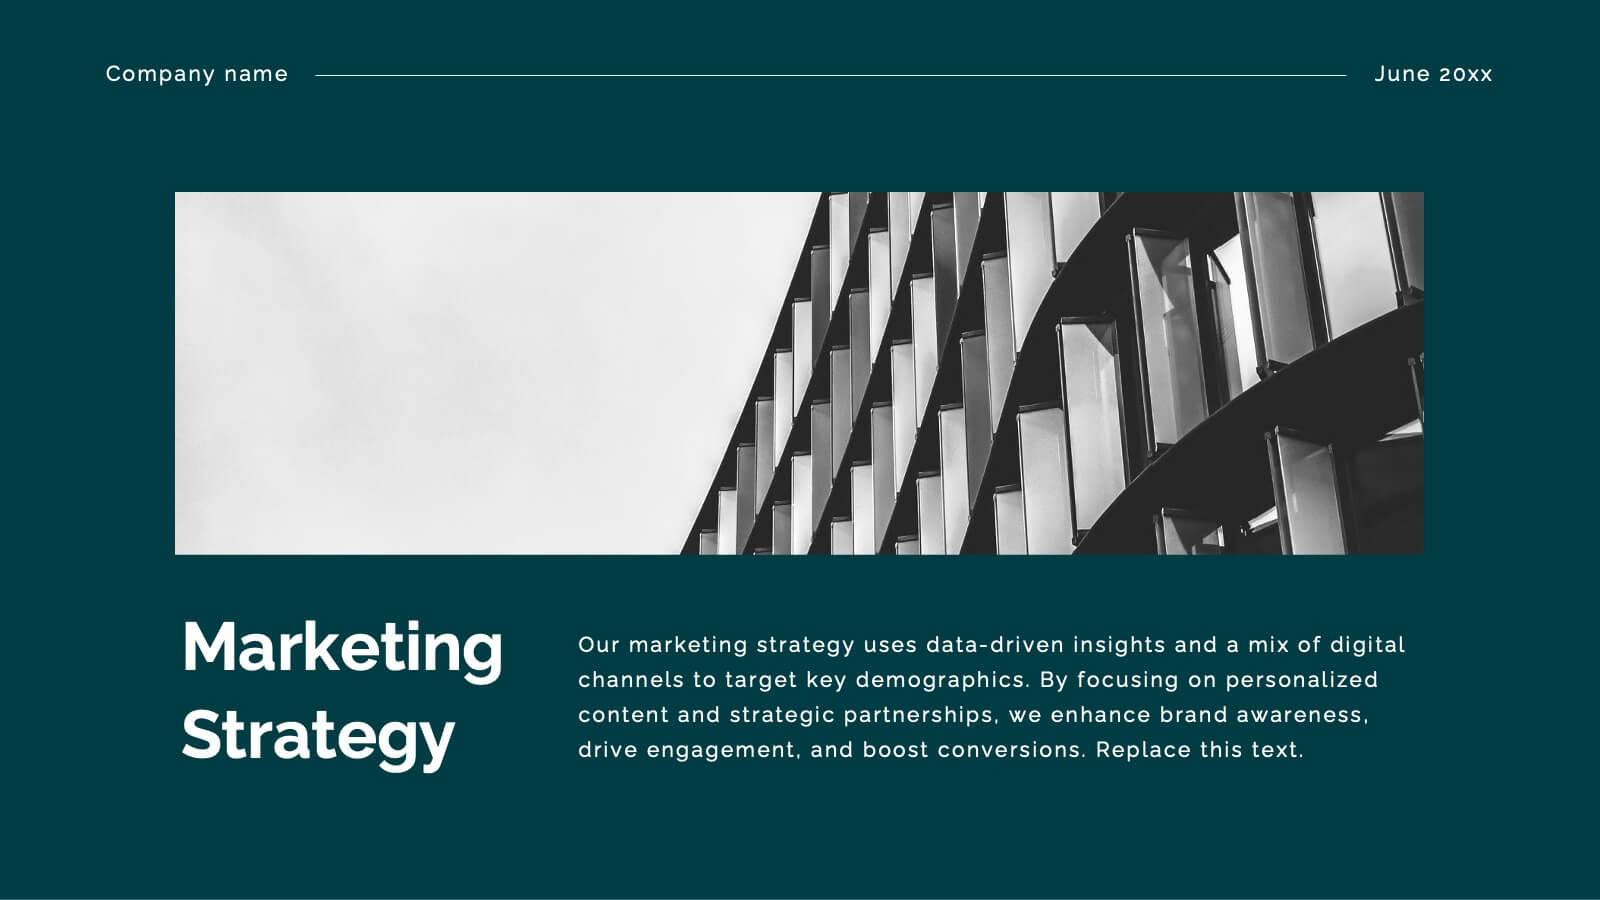
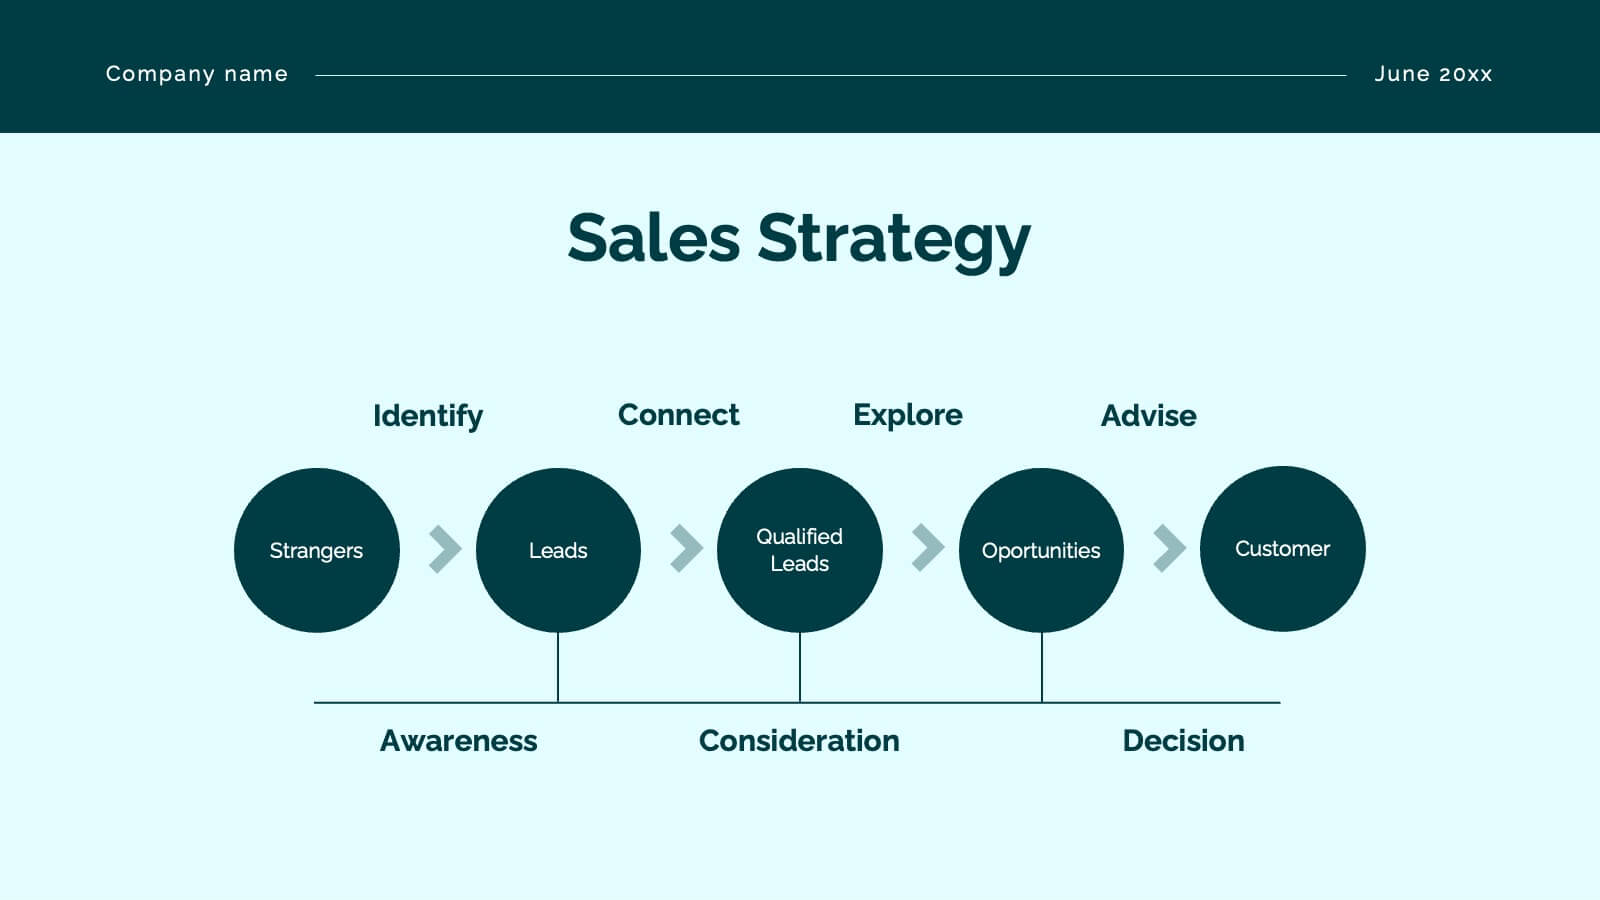
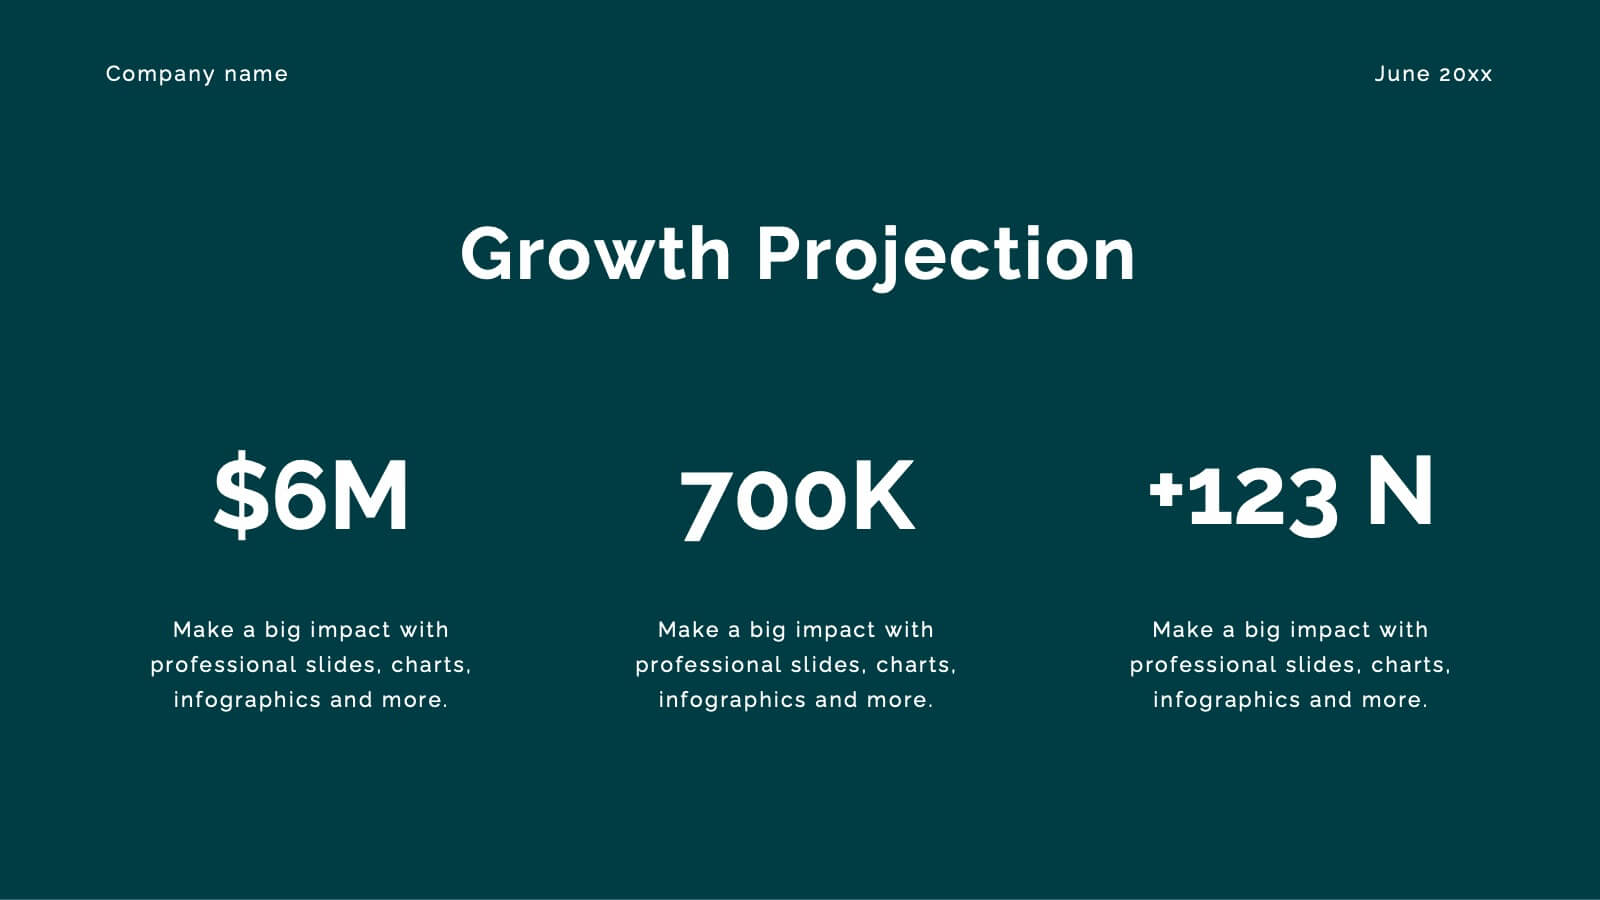
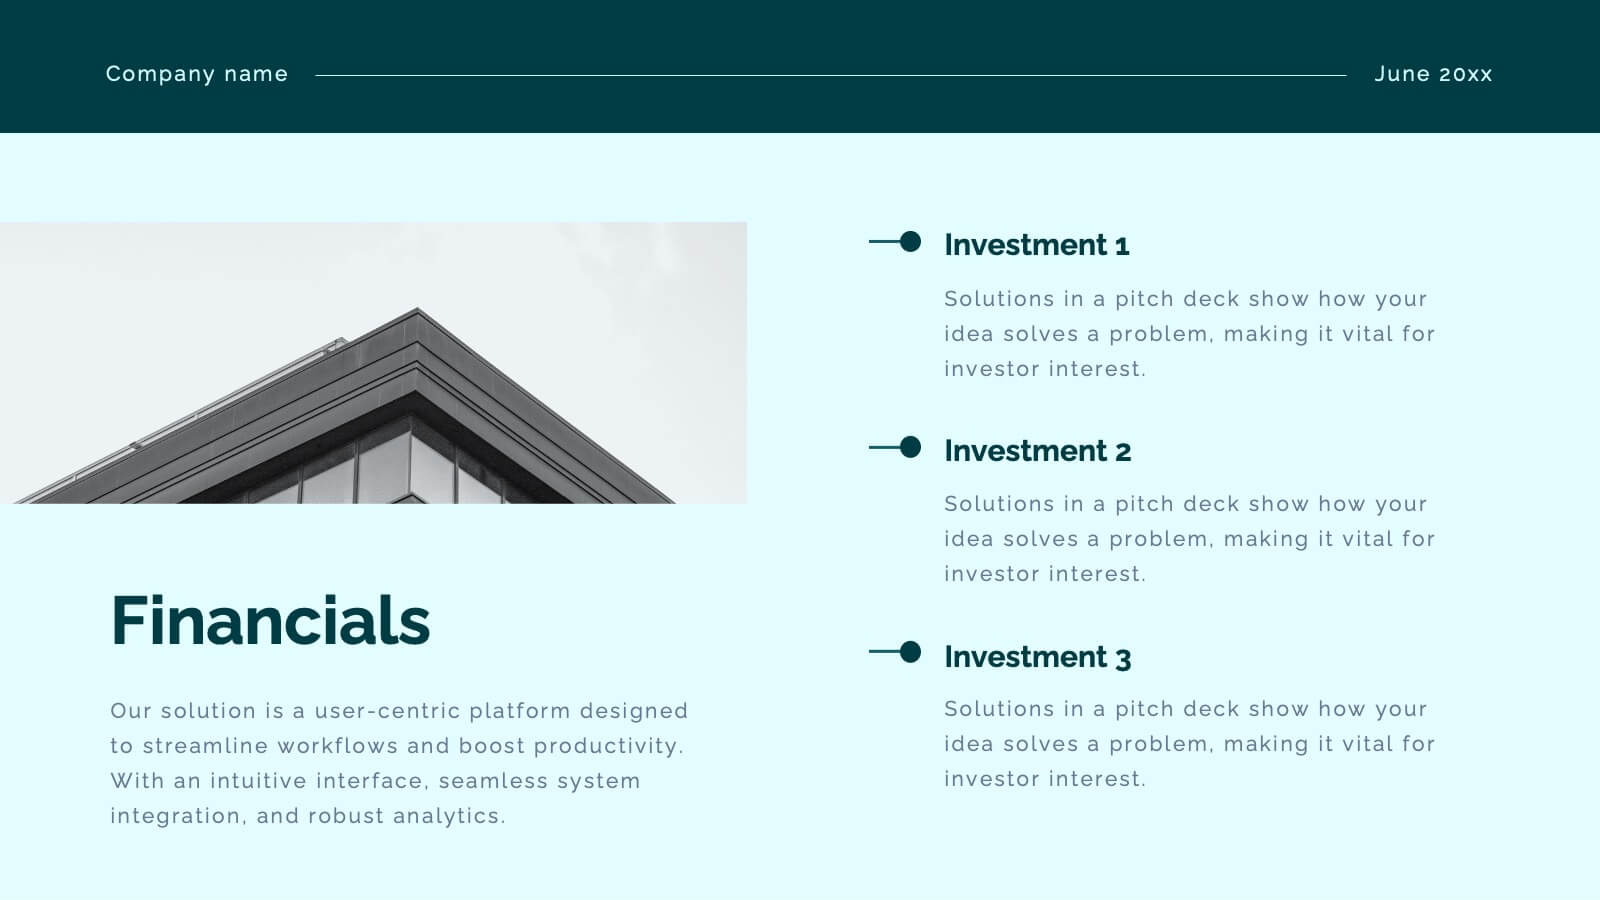
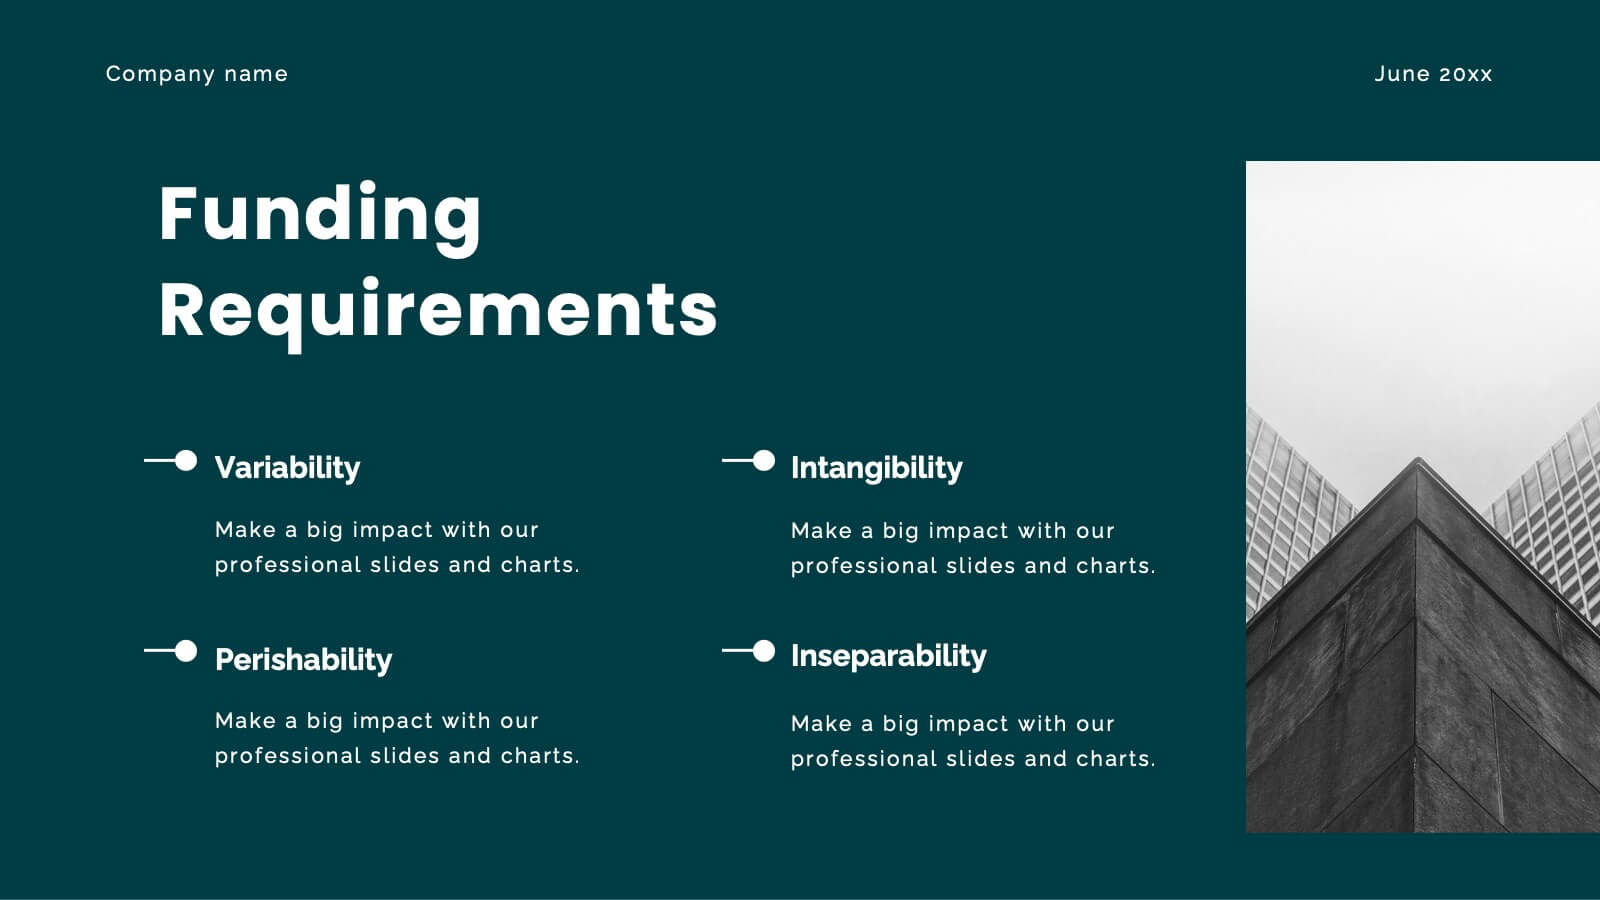
Crest Investor Pitch Presentation Presentation
Unleash your potential with this powerful pitch deck template! Tailored for presenting innovative business ideas, it features slides for company overview, market opportunity, competitive landscape, and financial projections. Clearly communicate your value proposition and impress investors with professional design and concise content. Compatible with PowerPoint, Keynote, and Google Slides for seamless presentations on any platform.


22 diapositivas
Cascade Brand Identity Presentation
Define and refine your brand with this brand identity presentation template, designed in deep blue tones. It covers all brand development aspects, from introduction to market analysis, brand values, and competitive landscape. Compatible with PowerPoint, Google Slides, and Keynote, it's ideal for creating a compelling brand narrative.


7 diapositivas
Geometric Series Infographic
Geometric series have various applications in mathematics, physics, engineering, economics, and other fields. Get ready for a joyful expedition into the world of numbers, shapes, and patterns with our geometric series infographic. This template is a celebration of mathematical elegance, presented with a burst of enthusiasm to make learning a delightful adventure. This is fully customizable and compatible with Powerpoint, Keynote, and Google Slides. This allows you to paint a vivid picture by relating geometric series to real-life scenarios. Showcase how these mathematical visuals resonates in unexpected places.


4 diapositivas
Turning Ideas into Impact Presentation
Showcase your transformation journey from concept to achievement with this bold visual layout. The three-step diagram—idea, action, success—makes it ideal for project planning, product development, or strategic execution. Easily editable in PowerPoint, Keynote, and Google Slides for pitch decks, business roadmaps, or innovation workflows. Clean, modern, and impactful.


7 diapositivas
Job Objective Infographic Presentation
A Job Objective is an introduction that summarizes an individual's career goals and objectives. This Template is designed to create a visual experience with a focus of solving your objectives, showcasing your expertise and individuality. Use this infographic to help you visually communicate your knowledge and skills with a powerful presentation. Highlight your experience, skills and key achievements. You can edit the graphics, photos, data and text in this template so that it fits your needs perfectly. All you have to do is just download this template in PowerPoint, Keynote, or Google Slides.


8 diapositivas
Effective Leadership Strategy
Visualize leadership pillars with this bold hexagonal layout designed to showcase four key components of effective leadership. Each colored segment allows you to present core strategies like vision, communication, decision-making, and team empowerment. Perfect for business training, organizational development, or executive briefings. Fully customizable in PowerPoint, Keynote, and Google Slides.


6 diapositivas
Porter's Five Forces Competitive Rivalry Infographics
Analyze competitive rivalry effectively with our Porter's Five Forces Competitive Rivalry infographic template. This template is fully compatible with popular presentation software like PowerPoint, Keynote, and Google Slides, allowing you to easily customize it to illustrate and communicate the factors influencing competitive rivalry within an industry. The Porter's Five Forces Competitive Rivalry infographic template offers a visually engaging platform to outline Michael Porter's framework for analyzing competitive dynamics, with a focus on the competitive rivalry component. Whether you're a business strategist, analyst, or anyone interested in understanding industry competition, this template provides a user-friendly canvas to create informative presentations and educational materials. Deepen your understanding of Competitive Rivalry with this SEO-optimized infographic template, thoughtfully designed for clarity and ease of use. Customize it to showcase the factors affecting rivalry, such as the number of competitors, industry growth, differentiation, and exit barriers, ensuring that your audience gains valuable insights into competitive forces at play. Start crafting your personalized infographic today to analyze and strategize for competitive advantage effectively.


10 diapositivas
Depth-Based Visual Charts in 3D Presentation
Elevate your data storytelling with the Depth-Based Visual Charts in 3D Presentation. This slide set transforms layered information into eye-catching 3D stack visuals—perfect for showcasing rankings, workflows, or strategic hierarchies. Fully editable in PowerPoint, Keynote, and Google Slides for seamless customization.


5 diapositivas
Breast Cancer Awareness Day
Raise awareness and educate with this visually impactful Breast Cancer Awareness Day template. Featuring circular infographic elements styled in a breast tissue-inspired layout, this slide design is ideal for campaigns, health education, corporate wellness events, and social initiatives. Each section can be customized with key data, statistics, or actionable messages. Fully editable in PowerPoint, Keynote, and Google Slides.


5 diapositivas
Corporate Staff Introduction and Bios Presentation
Introduce your team with clarity using the Corporate Staff Introduction and Bios Presentation. This layout is perfect for showcasing employee names, titles, photos, and brief bios in a professional format. Ideal for company overviews, internal communications, or onboarding decks. Fully editable in PowerPoint, Canva, and Google Slides.


7 diapositivas
Business Office Scenes Infographic Presentation
Office Scene Infographics can be a valuable tool for businesses or organizations that want to showcase their workplace culture or attract potential employees by providing a visual representation of what it's like to work at their company. This template is designed to provide a visual representation of different office scenarios and activities. The template is fully customizable and can be used for a variety of purposes, such as internal communication, training, marketing, and educational. It has a unique design, easy customization, and compatibility with Powerpoint, Keynote and Google Slides.


10 diapositivas
Business Model Hexagon Infographic
Break down your strategy into clear, modular components with the Business Model Hexagon Infographic Presentation. This visually engaging layout features five interlinked hexagons, each labeled and icon-marked for easy segmentation of your business pillars—such as value propositions, customer channels, key partners, and revenue streams. The vertical stack ensures a logical flow while keeping your message structured and professional. Fully editable in PowerPoint, Keynote, and Google Slides, allowing you to tailor icons, text, and colors to match your business theme.


7 diapositivas
Annual Financial Report Infographic
This easy-to-use infographic template is crafted for a straightforward Annual Financial Report. Suitable for PowerPoint, Google Slides, and Keynote, it features diverse charts like bar graphs, pie charts, and tables for illustrating financial data such as sales growth, product earnings, and expenses. The professional blue and grey color palette is ideal for a corporate setting, while simple icons and clear spaces for text ensure information is digestible. This template is perfect for financial analysts and business managers who need to present complex fiscal data in a clear, visually appealing way.


6 diapositivas
Startup Investment Infographics
The "Startup Investment" infographic template is a sleek and persuasive tool, perfectly crafted for PowerPoint, Keynote, and Google Slides. This template is a crucial asset for entrepreneurs, investors, and business consultants who are keen on presenting the essentials of startup financing, investment strategies, and growth opportunities in an impactful way. This template efficiently encapsulates the startup investment landscape, highlighting key areas like funding stages, investor types, valuation methods, and return on investment. It's designed to articulate the dynamics of startup funding, making it an invaluable tool for pitch presentations, investor meetings, and financial planning discussions. The design is as dynamic as the startup ecosystem itself, with a color scheme that is both vibrant and professional. This not only makes the presentation visually compelling but also signifies the energy, innovation, and potential associated with startup investments. Whether used in a boardroom, a startup incubator, or an investment seminar, this template ensures that your insights into "Startup Investment" are communicated with clarity, confidence, and visual appeal.


4 diapositivas
SaaS Pricing Comparison Chart Presentation
Make pricing comparisons exciting with this bold, side-by-side layout designed to instantly spotlight key differences. Whether you’re showcasing SaaS plans or product tiers, this chart template lets you present value and features clearly. Fully editable and easy to customize in PowerPoint, Keynote, and Google Slides for polished pricing presentations.


7 diapositivas
Strategic Matrix Comparison Framework Presentation
Easily compare business risks, priorities, or strategic choices with this matrix comparison framework. Featuring editable grids for mapping likelihood and impact, it’s perfect for decision-making and performance analysis. Highlight key categories using color-coded segments. Fully customizable and compatible with PowerPoint, Google Slides, and Keynote for professional presentations.