


Características


¿Tienes alguna pregunta?
Recomendar


12 diapositivas
Investment Strategy Presentation
The "Investment Strategy Presentation" template is designed for effectively mapping out and displaying various investment strategies. It uses a multi-colored light bulb graphic, which symbolizes ideas and innovation in investment planning, making it visually appealing and easy to understand. Each segment of the light bulb is labeled with letters A through F, representing different aspects or phases of an investment strategy that can be tailored to specific objectives or points of discussion. This format helps in presenting complex financial data or strategies in a straightforward manner that can be easily grasped by audiences, making it an ideal choice for financial analysts, investors, or corporate strategy meetings.


12 diapositivas
Startup Investor Pitch Deck Presentation
Craft a compelling pitch with this Startup Investor Pitch Deck template. Featuring a structured layout, it helps showcase your startup’s vision, market potential, and financial projections. Designed for clarity and engagement, this template ensures a persuasive investor presentation. Fully compatible with PowerPoint, Keynote, and Google Slides for seamless customization.


5 diapositivas
Cross-Functional Team Collaboration Presentation
Visualize multi-department synergy with the Cross-Functional Team Collaboration Presentation. Ideal for mapping collaborative structures, workflows, or project roles across divisions. This layout emphasizes alignment and cooperation between teams. Easily customizable in PowerPoint, Keynote, and Google Slides—perfect for strategy sessions, management briefings, or team onboarding presentations.


4 diapositivas
Regional Economic Evolution in Asia Map Presentation
Track economic progress across Asia with this regional growth map. Each country is paired with a progress bar for visual comparison of growth indicators. Ideal for data-driven insights, economic reviews, or development updates. Editable in PowerPoint, Keynote, and Google Slides for seamless customization and professional, geography-based presentations.


5 diapositivas
Topic Web Mind Mapping
Visualize your ideas with clarity and structure using the Topic Web Mind Mapping Presentation. Perfect for brainstorming, educational planning, or strategic thinking, this layout helps you centralize a core concept and expand with five supporting branches. Customize easily in PowerPoint, Keynote, or Google Slides to fit any topic or audience.


21 diapositivas
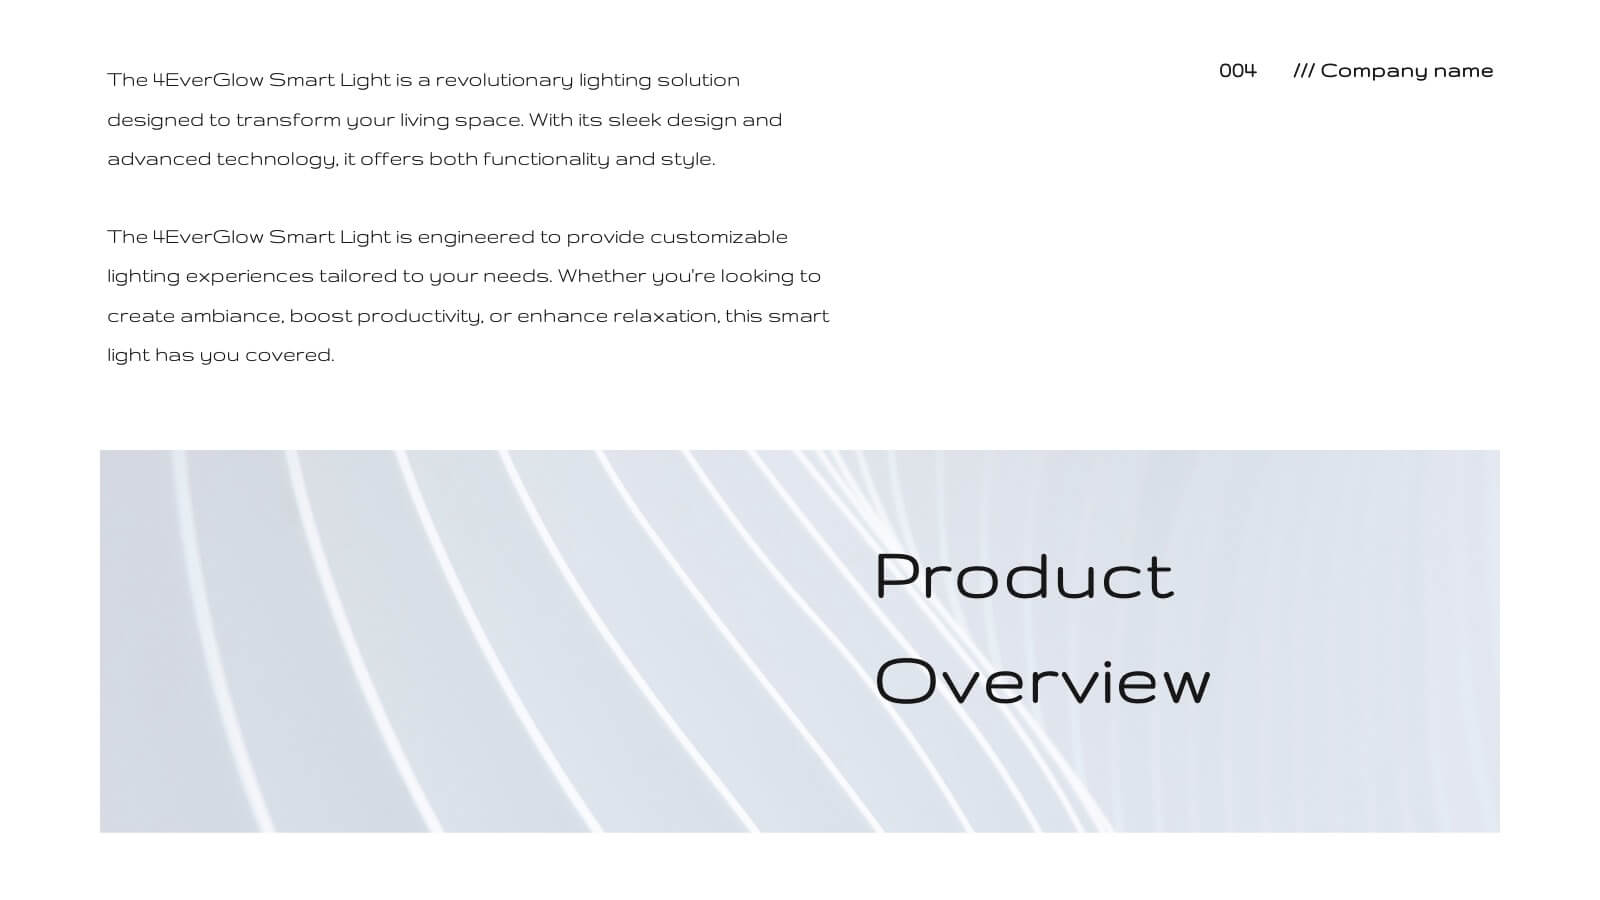
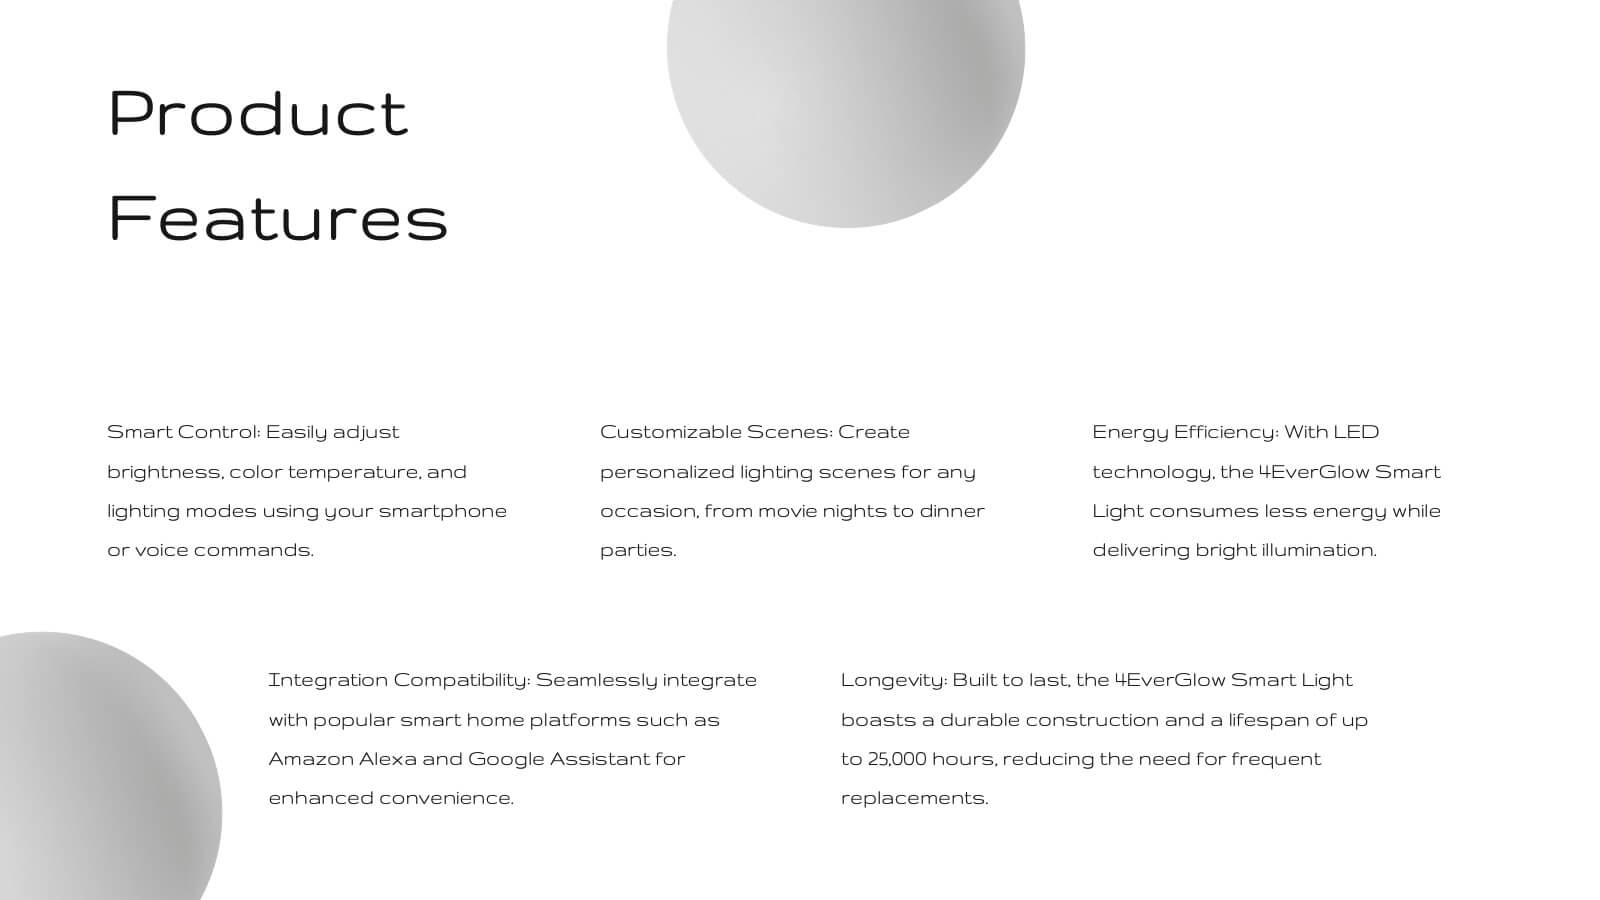
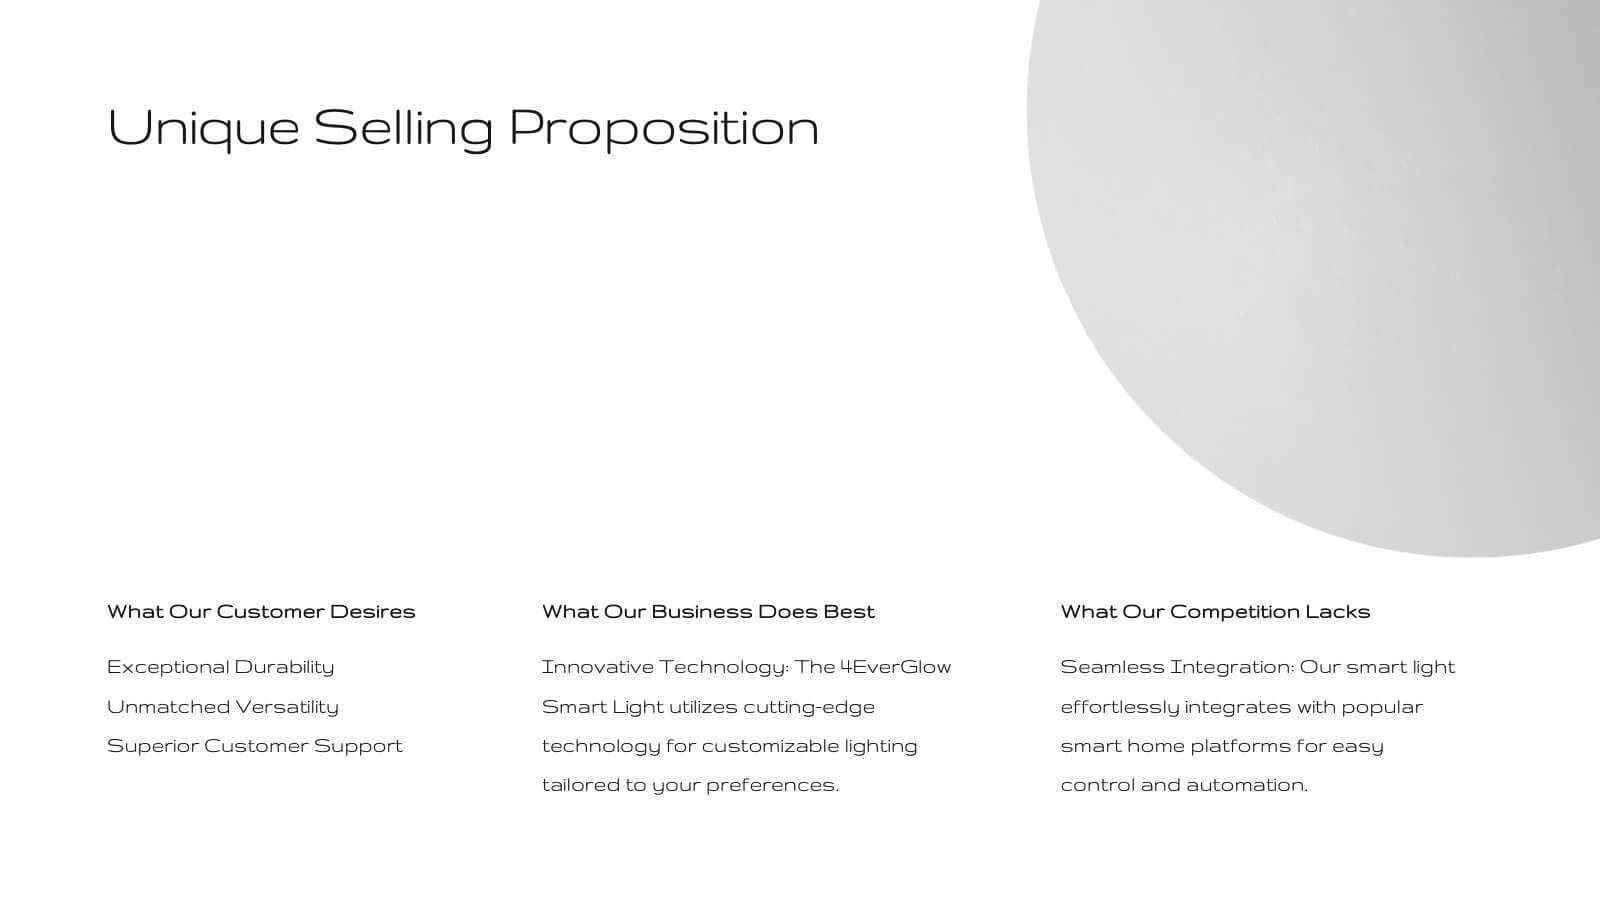
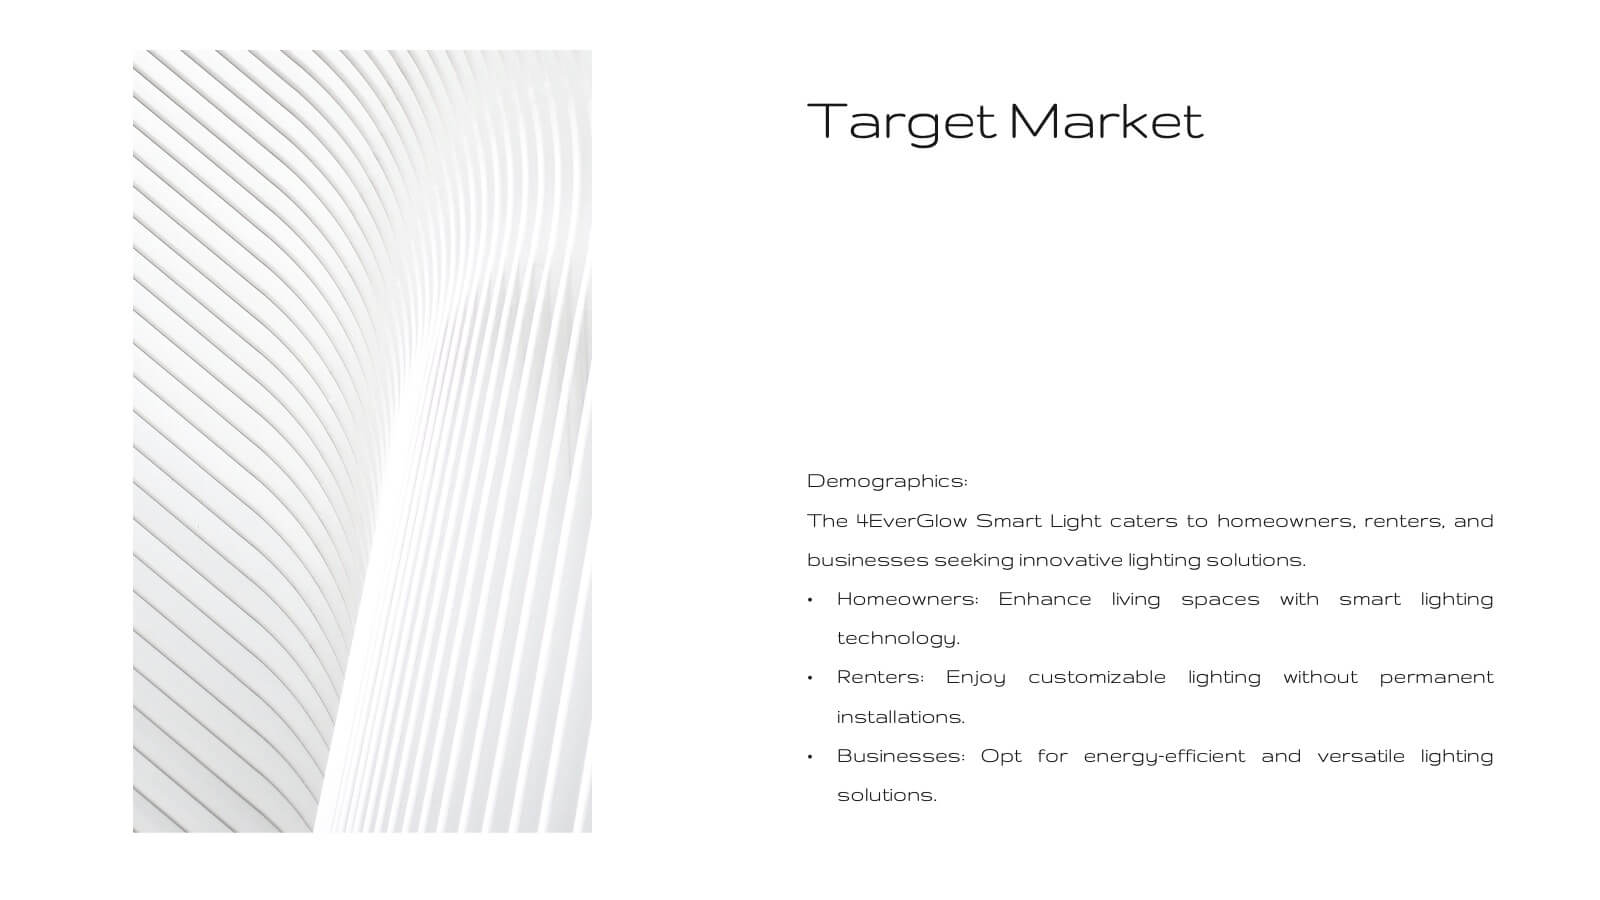
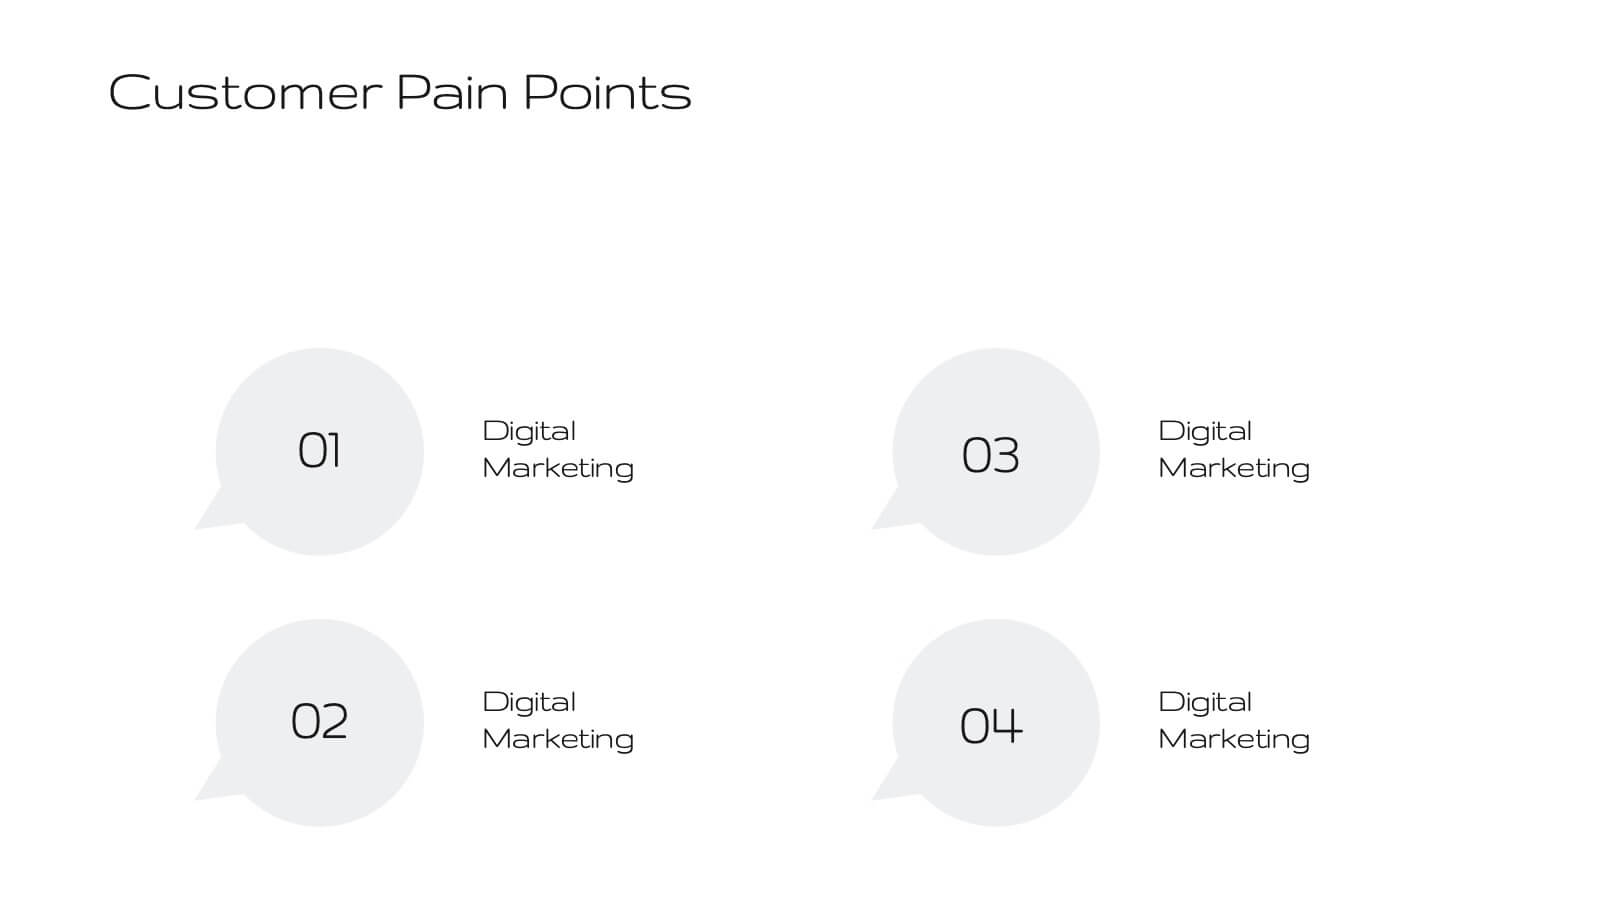
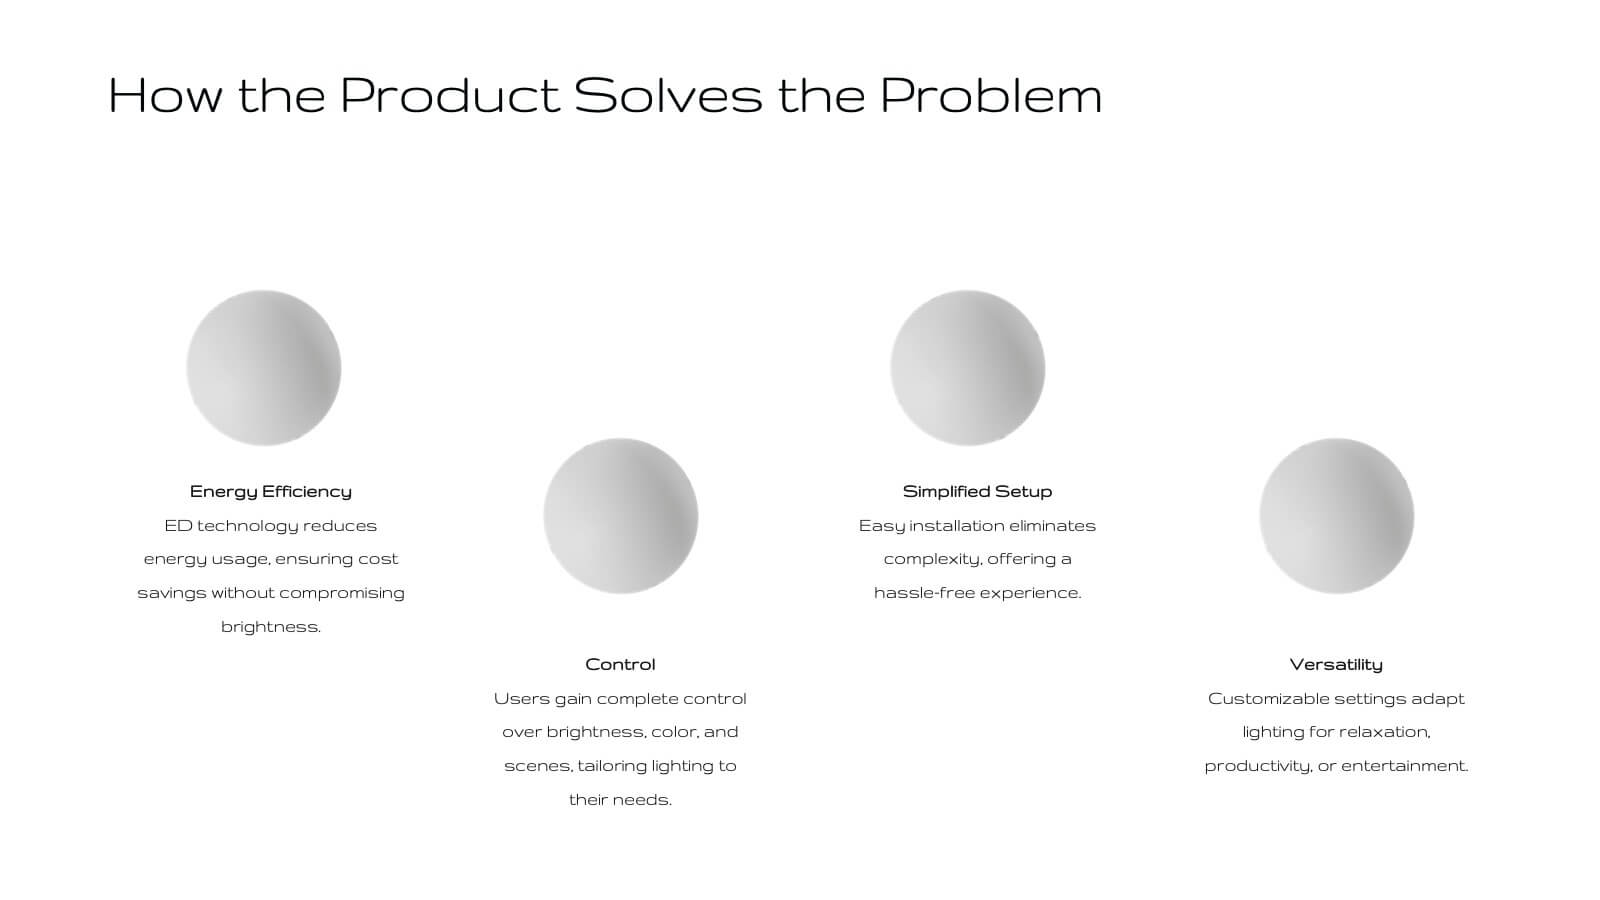
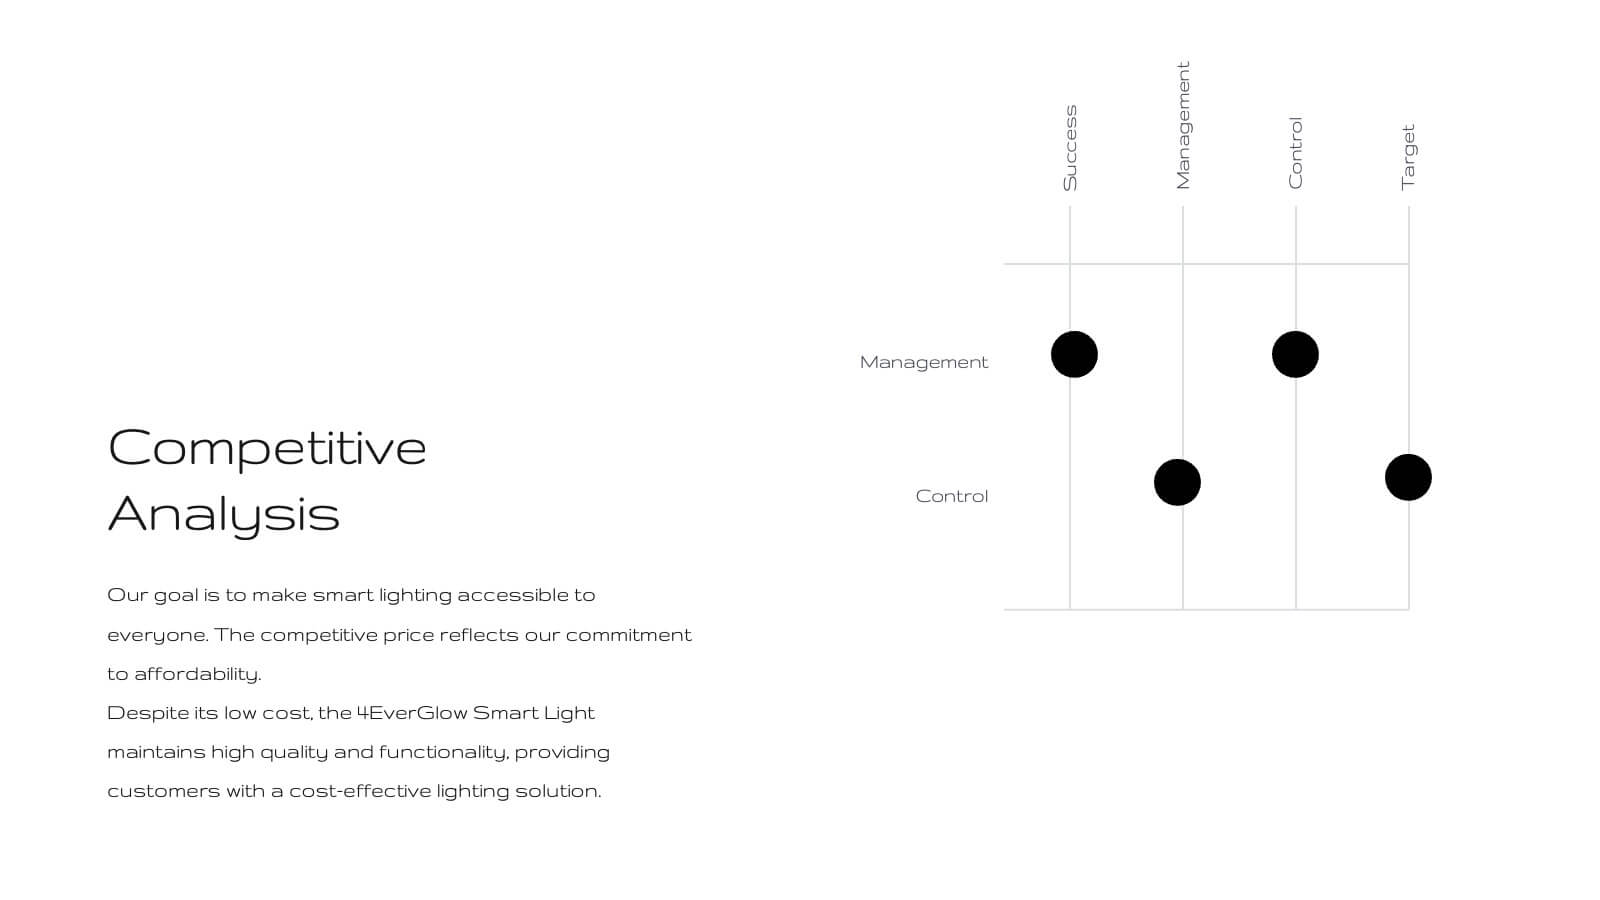
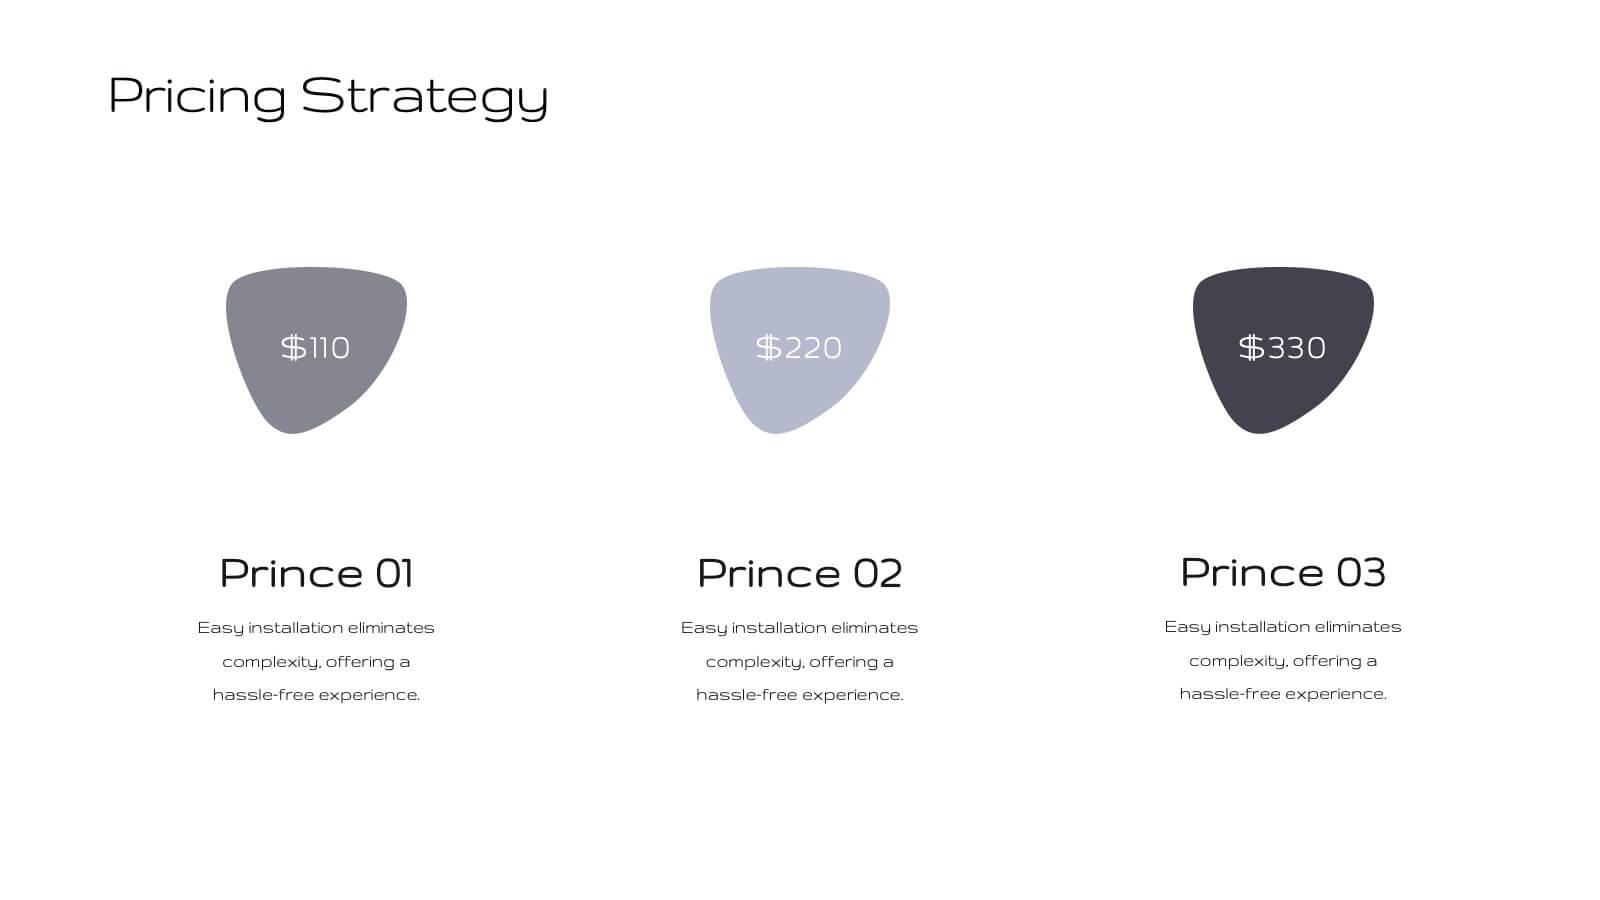
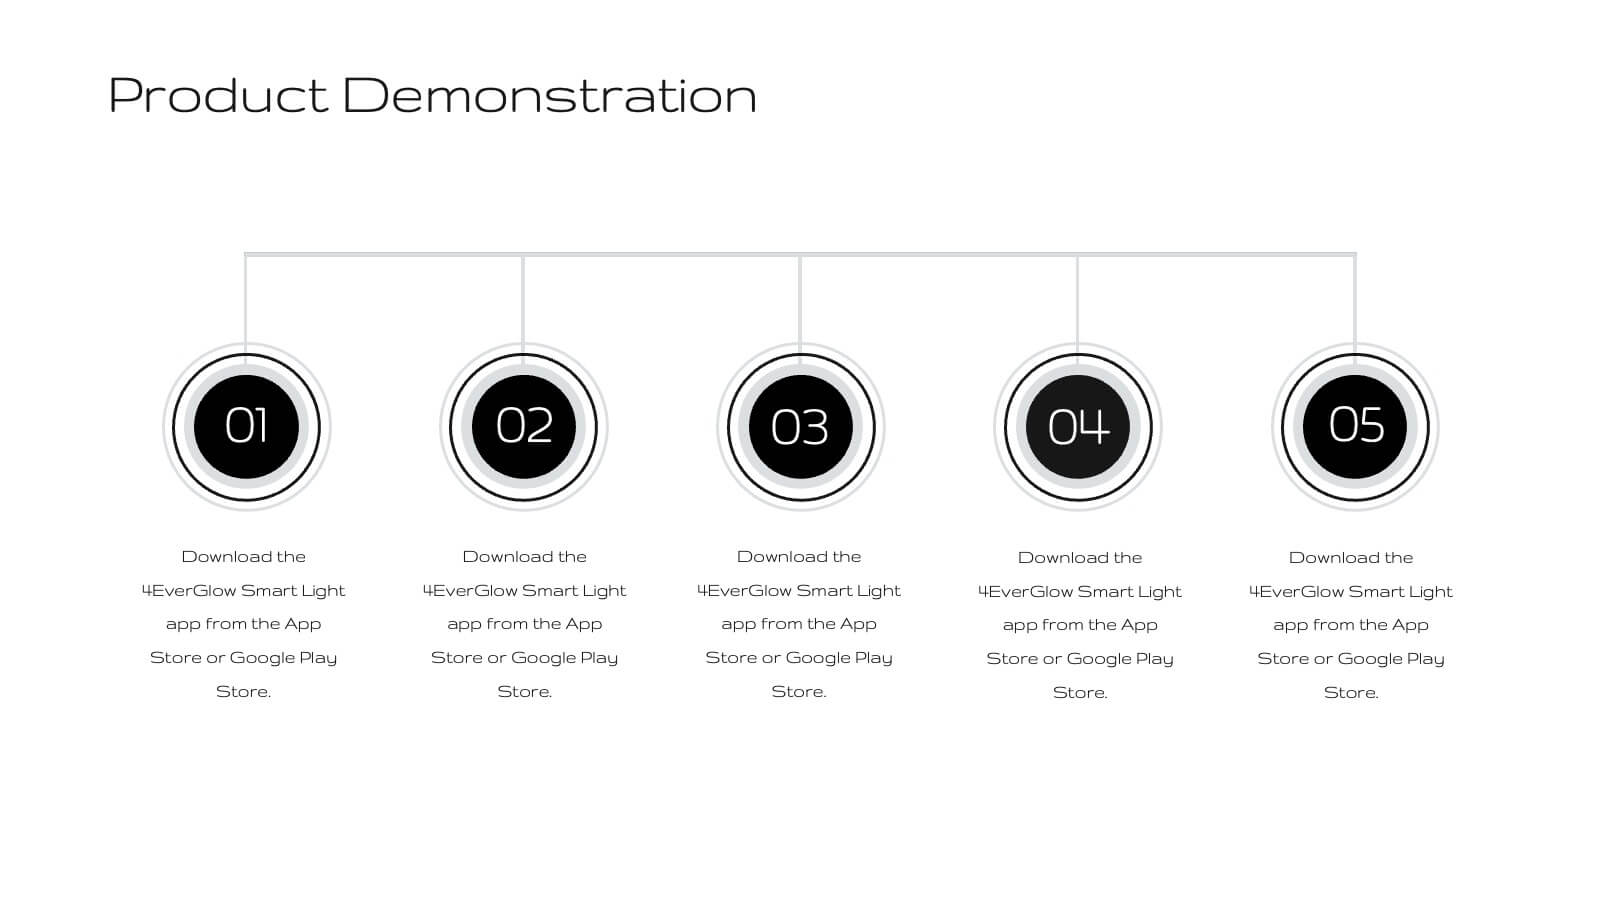
Fortuna Product Development Plan Presentation
Unveil your product's potential with this elegant, minimalist presentation template. Perfect for detailing product development, features, and market strategies, it features a clean design that emphasizes clarity and professionalism. Highlight key aspects like customer pain points, competitive analysis, and pricing strategies to captivate your audience. Compatible with PowerPoint, Keynote, and Google Slides, it ensures seamless presentations on any platform.


5 diapositivas
Actionable Steps for Team Execution Presentation
Highlight progress and key insights with the Actionable Steps for Team Execution Presentation. This vertically stacked arrow slide uses five colorful blocks ascending upward to represent steps, milestones, or growth metrics. Each step includes space for a title and description to clearly outline tasks or performance trends. Ideal for showcasing team roadmaps, strategic plans, or KPIs. Compatible with PowerPoint, Keynote, and Google Slides.


5 diapositivas
Food Business Pitch Deck Presentation
Bring your food concept to life with a lively, story-driven presentation that highlights flavor, creativity, and business potential. This slide design helps you explain your menu vision, branding approach, and restaurant strategy in a clean and engaging format. Fully compatible with PowerPoint, Keynote, and Google Slides.


4 diapositivas
Customer Type Identification Strategy Deck Presentation
Visualize your customer segmentation strategy with this layered targeting slide. Perfect for identifying different customer types based on behavior or loyalty levels, this layout uses a human silhouette and concentric zones to highlight proximity to the core user. Fully editable and compatible with PowerPoint, Keynote, and Google Slides.


3 diapositivas
Visual Breakdown with Tree Diagram Format Presentation
Illustrate growth stages, concepts, or layered development with the Visual Breakdown with Tree Diagram Format Presentation. This creative design uses three tree icons—seedling, sapling, and mature tree—to represent progression or hierarchy. Ideal for timelines, product evolution, or strategic planning. Fully editable in PowerPoint, Keynote, and Google Slides.


7 diapositivas
Process Solution Infographic
Streamline intricate workflows with our process solution infographic. Anchored in a pristine white base and infused with varying shades of professional blue, our template elegantly delineates step-by-step solutions and systematic approaches. Decked with meticulous infographics, representative icons, and versatile image placeholders, it transforms complexities into a navigable visual journey. Masterfully curated for Powerpoint, Keynote, or Google Slides. An invaluable asset for process managers, business analysts, strategists, or any organization keen on optimizing workflows. Navigate processes with confidence; let each slide chart the path to optimized solutions.


6 diapositivas
Next Steps Outline for Project Teams Presentation
Keep your team aligned and motivated with a clear visual roadmap that outlines every upcoming milestone. Perfect for presenting project phases, workflow updates, or strategic goals, this slide ensures everyone knows what’s next. Fully compatible with PowerPoint, Keynote, and Google Slides for seamless editing and presentation versatility.


21 diapositivas
Planetar Startup Strategy Presentation
This Startup Strategy Presentation offers a modern and structured layout to showcase your startup’s mission, vision, market analysis, and financial projections. Designed for entrepreneurs and investors, it includes sections on customer needs, growth plans, and milestones. Fully customizable and compatible with PowerPoint, Keynote, and Google Slides.


31 diapositivas
Astralis Brand Strategy Report Presentation
Present your brand strategy effectively with this well-structured presentation template. This comprehensive design covers all essential aspects, including vision and positioning, identity components, brand guidelines, and touchpoints. It is perfect for showcasing how your brand stands out, communicates, and connects with its audience. Highlight your unique selling points, ensure visual consistency with color palettes, and emphasize your brand's voice through tailored sections. This template is easy to customize and works seamlessly across PowerPoint, Google Slides, and Keynote, ensuring accessibility for all. Empower your brand strategy discussions with a professional and polished design.


26 diapositivas
Salus Rebranding Project Plan Presentation
This rebranding project plan template offers a clear framework for presenting brand identity transformation. Covering brand values, identity components, target audience, positioning, and guidelines, it’s ideal for companies refreshing their brand. Compatible with PowerPoint, Keynote, and Google Slides, it ensures a streamlined, professional presentation of your rebranding strategy.


5 diapositivas
Business Model Canvas Overview Presentation
Streamline your business strategy with the Business Model Canvas Overview Presentation. Designed for entrepreneurs, startups, and strategists, this template visualizes key partners, activities, value propositions, customer segments, revenue streams, and more. Fully editable for PowerPoint, Keynote, and Google Slides, ensuring a structured and professional business plan presentation.


4 diapositivas
End Slide with Strategic Reflection Presentation
Wrap up your presentation with purpose using the End Slide with Strategic Reflection Presentation. Designed to highlight final insights, priorities, or key outcomes, this template features a visual pyramid layout ideal for summarizing growth, goals, or performance tiers. Fully editable in Canva, PowerPoint, and Google Slides for easy customization.