


Características


¿Tienes alguna pregunta?
Recomendar


5 diapositivas
Level-Based Authority Chart Presentation
Display organizational hierarchy with clarity using this level-based authority chart. The pyramid layout highlights reporting tiers, perfect for showcasing leadership roles, department levels, or team structures. Fully customizable in Canva, PowerPoint, or Google Slides—ideal for managers, HR professionals, and business consultants looking to present structured authority in a clean format.


10 diapositivas
Project Launch in 4 Structured Phases Presentation
Present your roadmap with clarity using this four-phase launch diagram. Designed for planning, strategy, or product rollout presentations, each step is illustrated in a 3D layered format with editable text sections. Fully customizable in PowerPoint, Keynote, and Google Slides—ideal for project managers and teams outlining sequential development or launches.


20 diapositivas
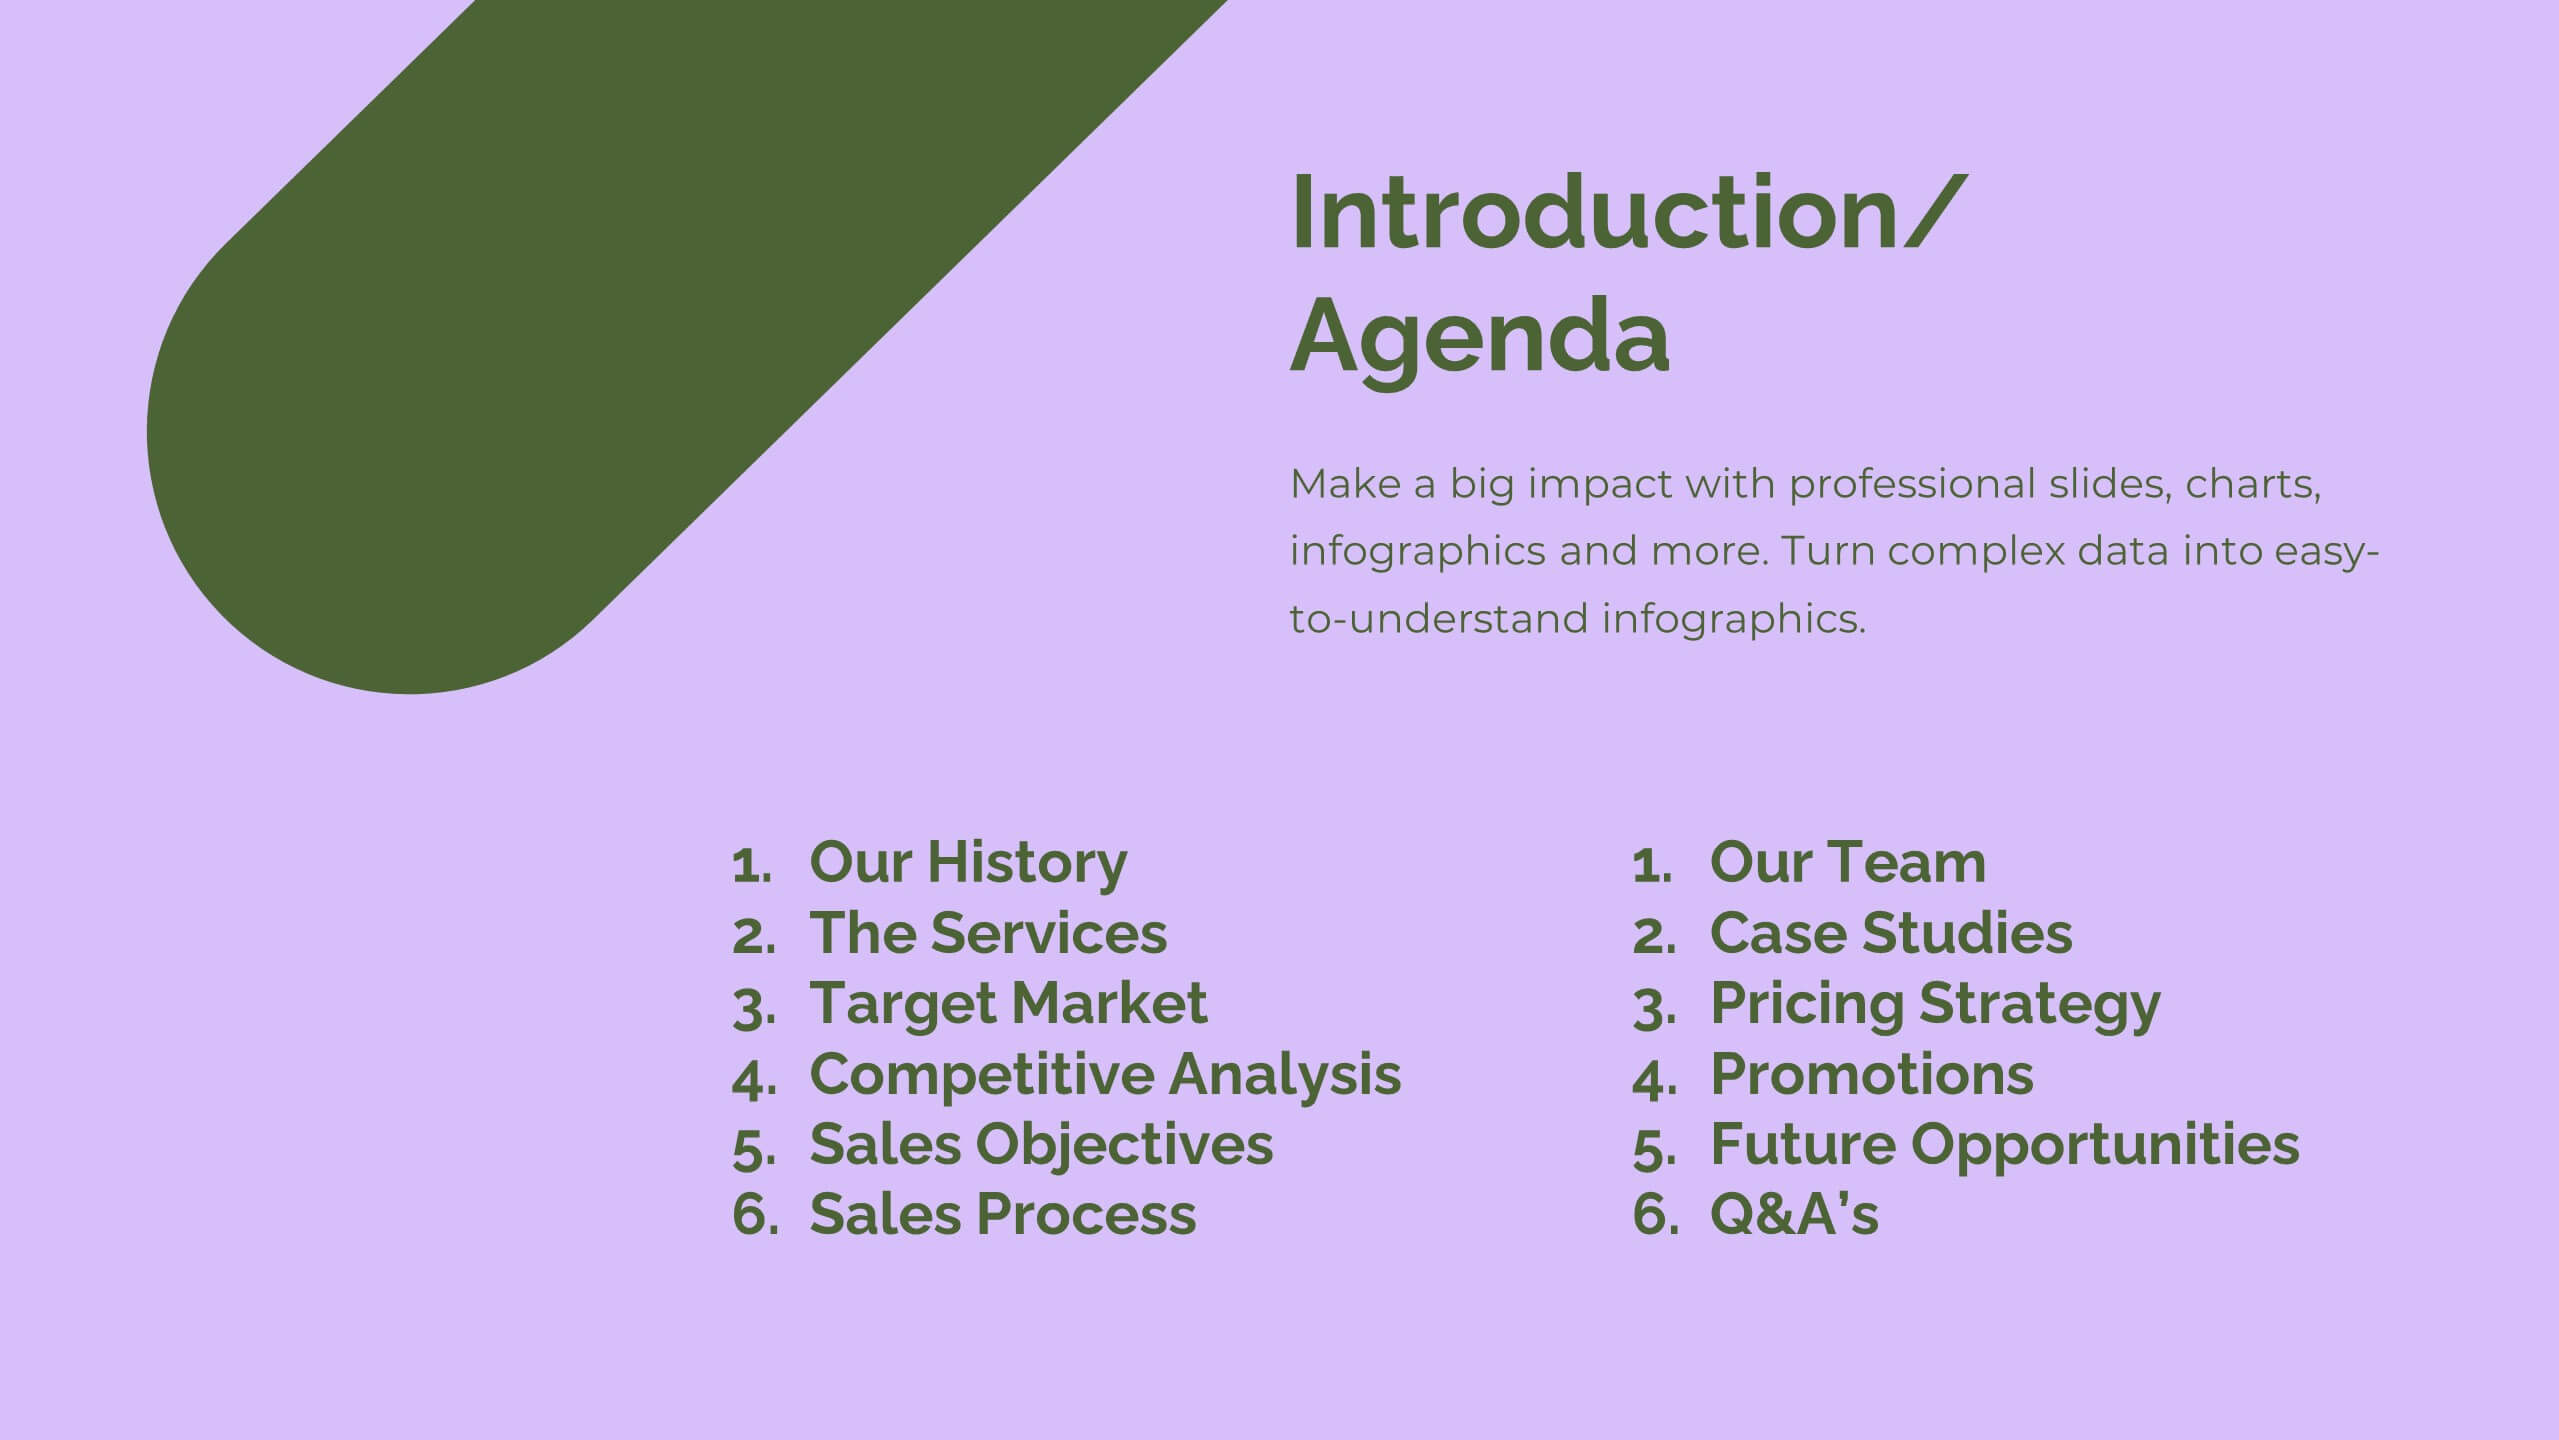
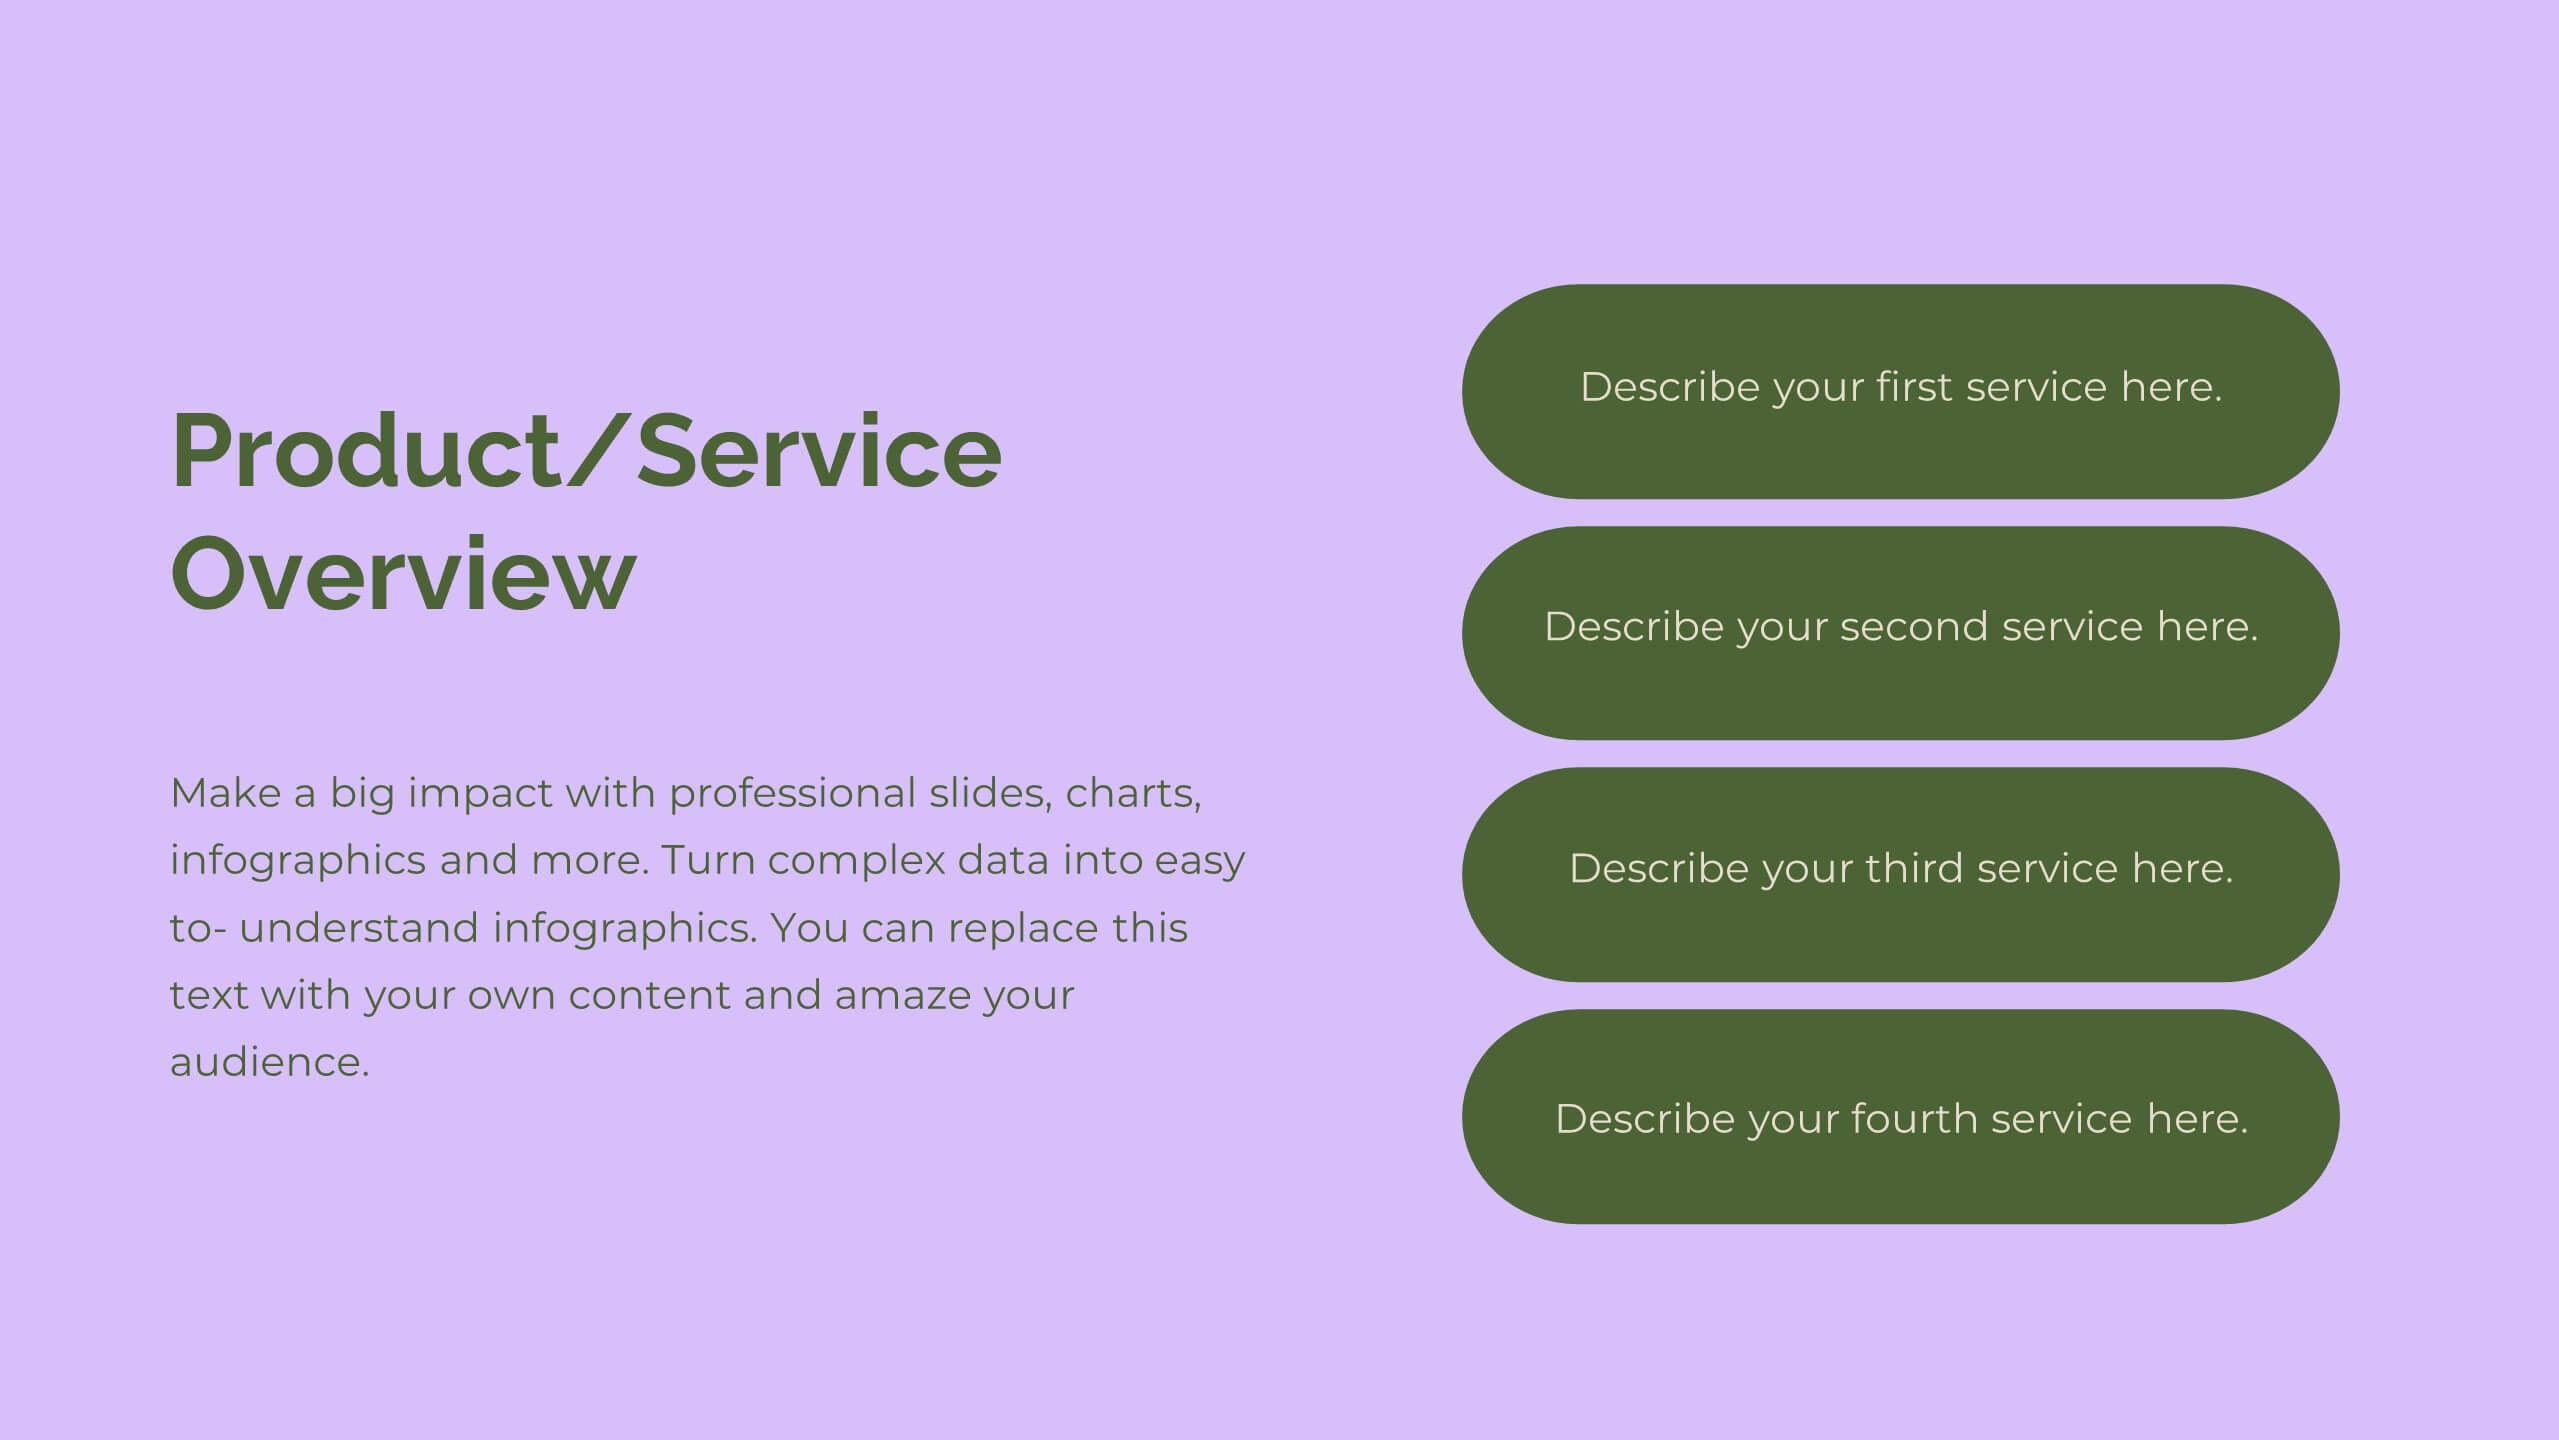
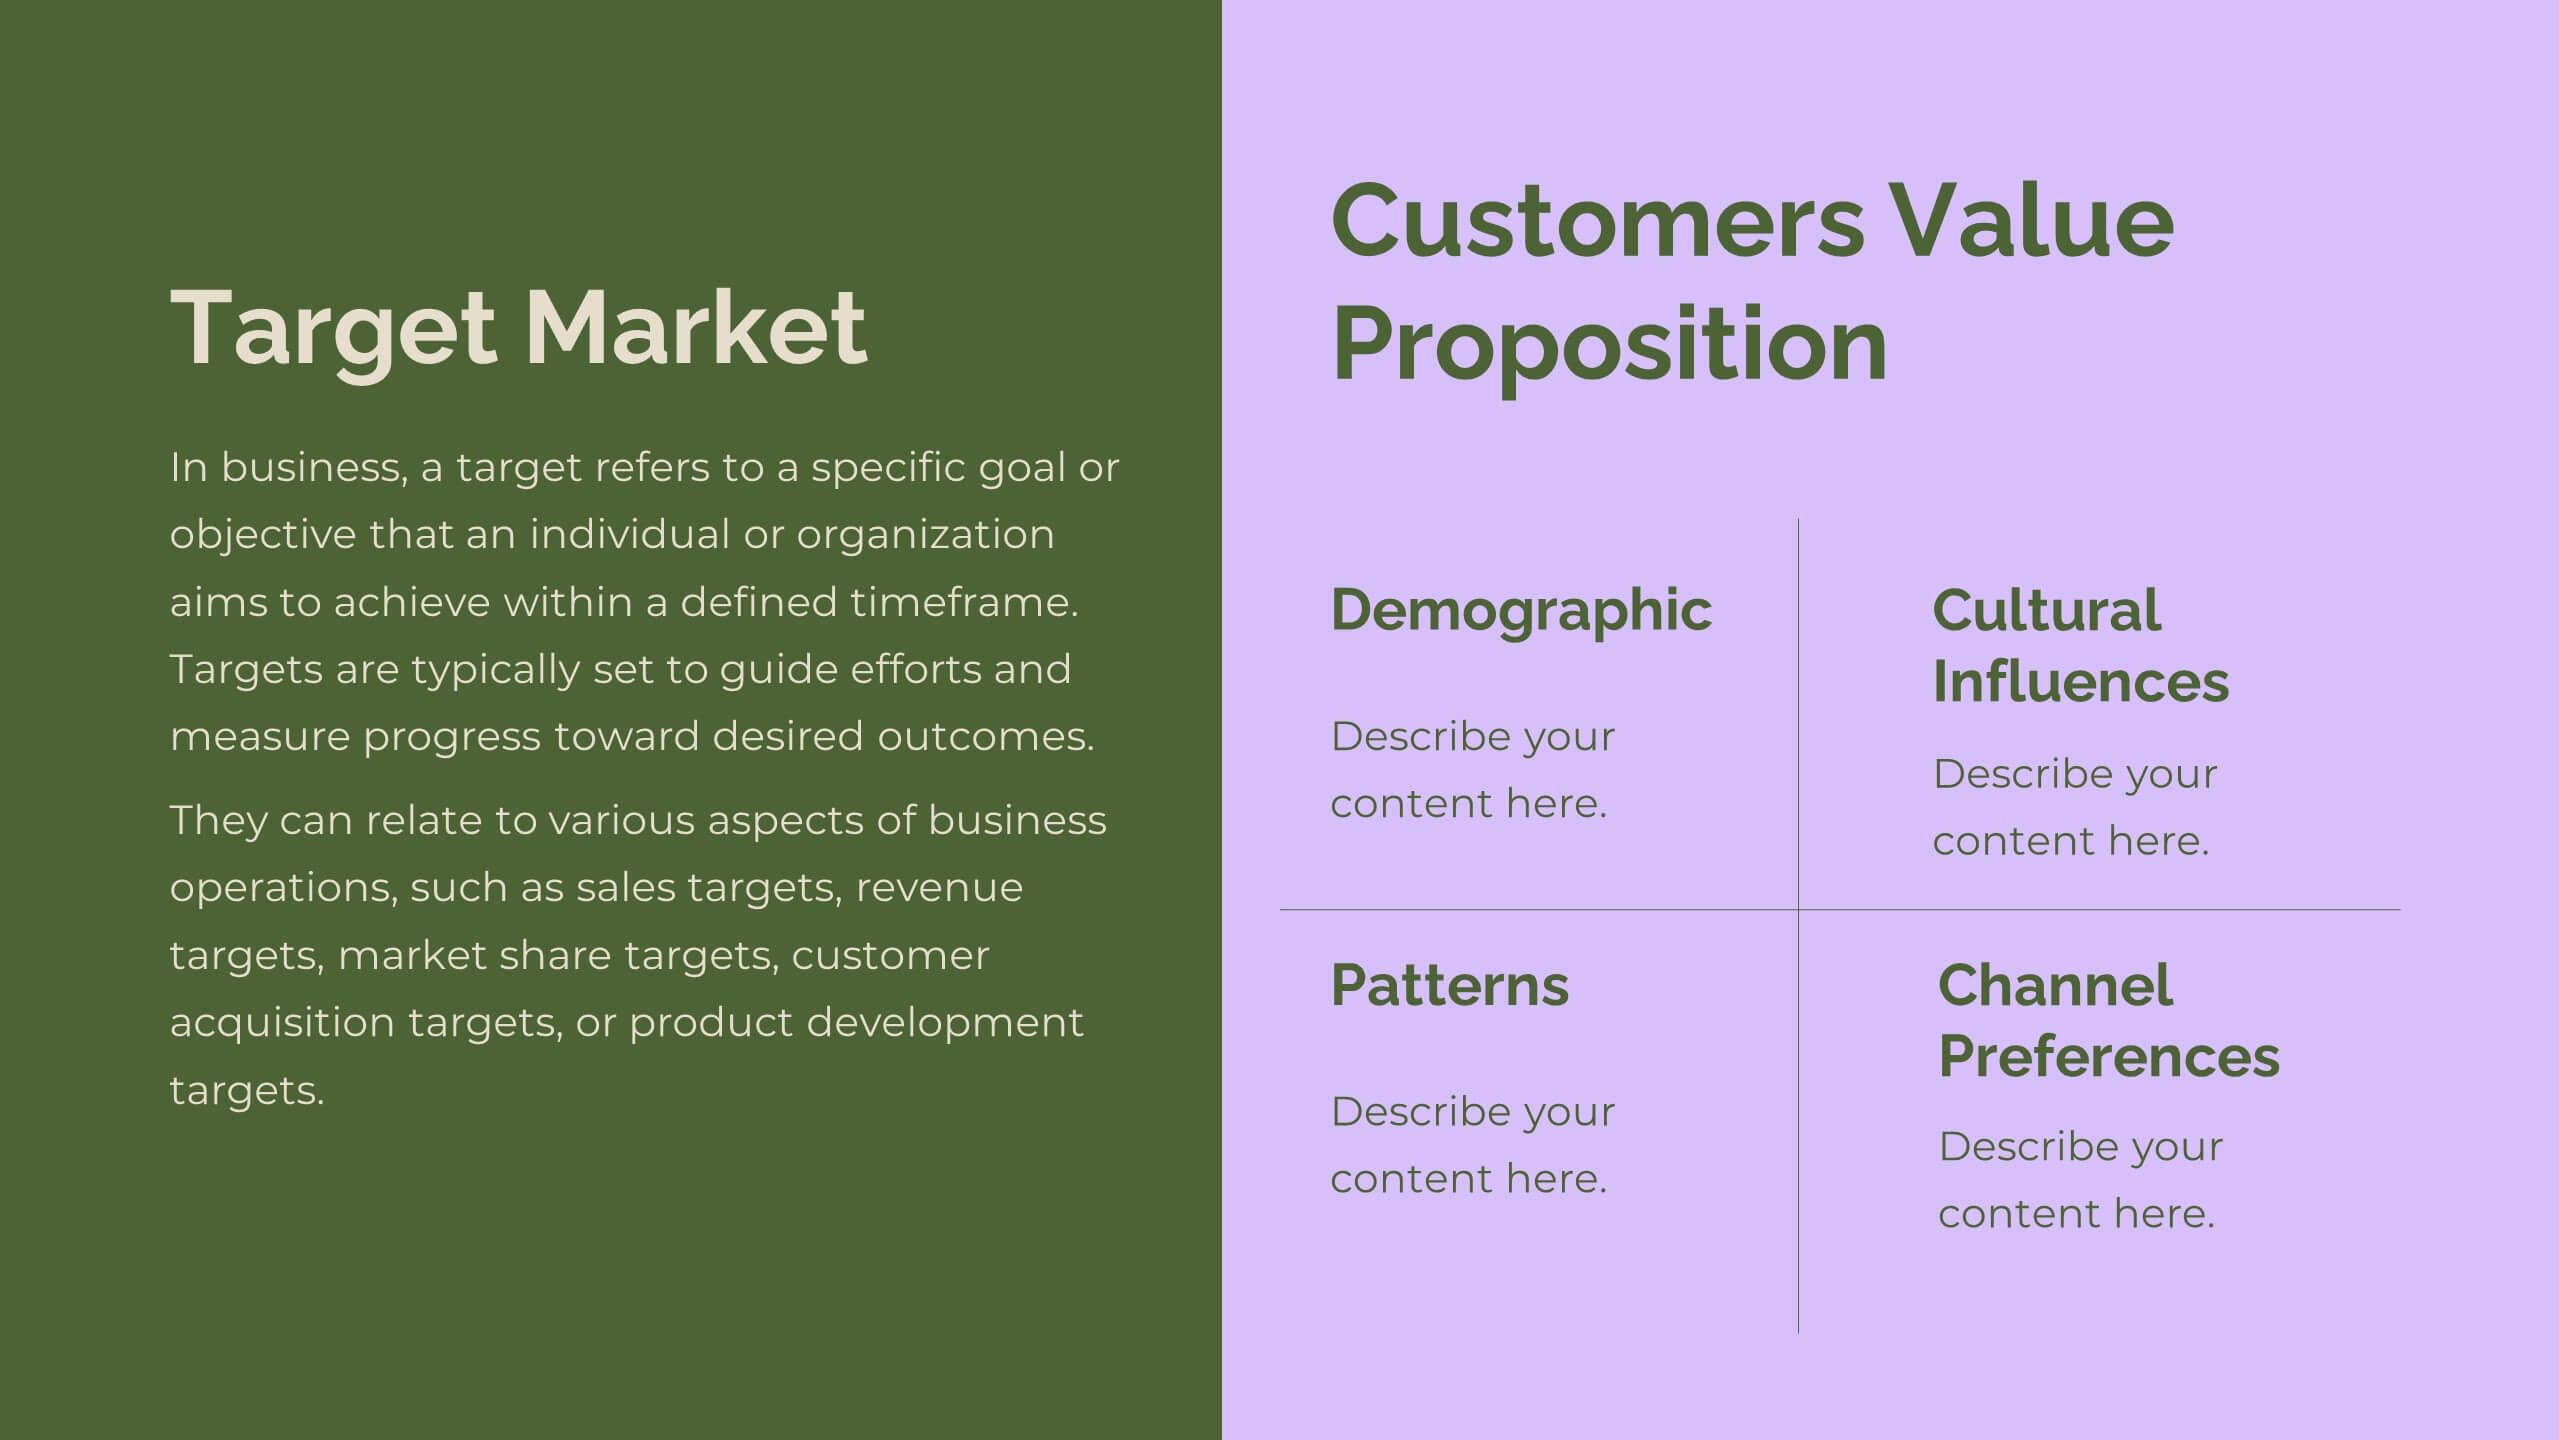
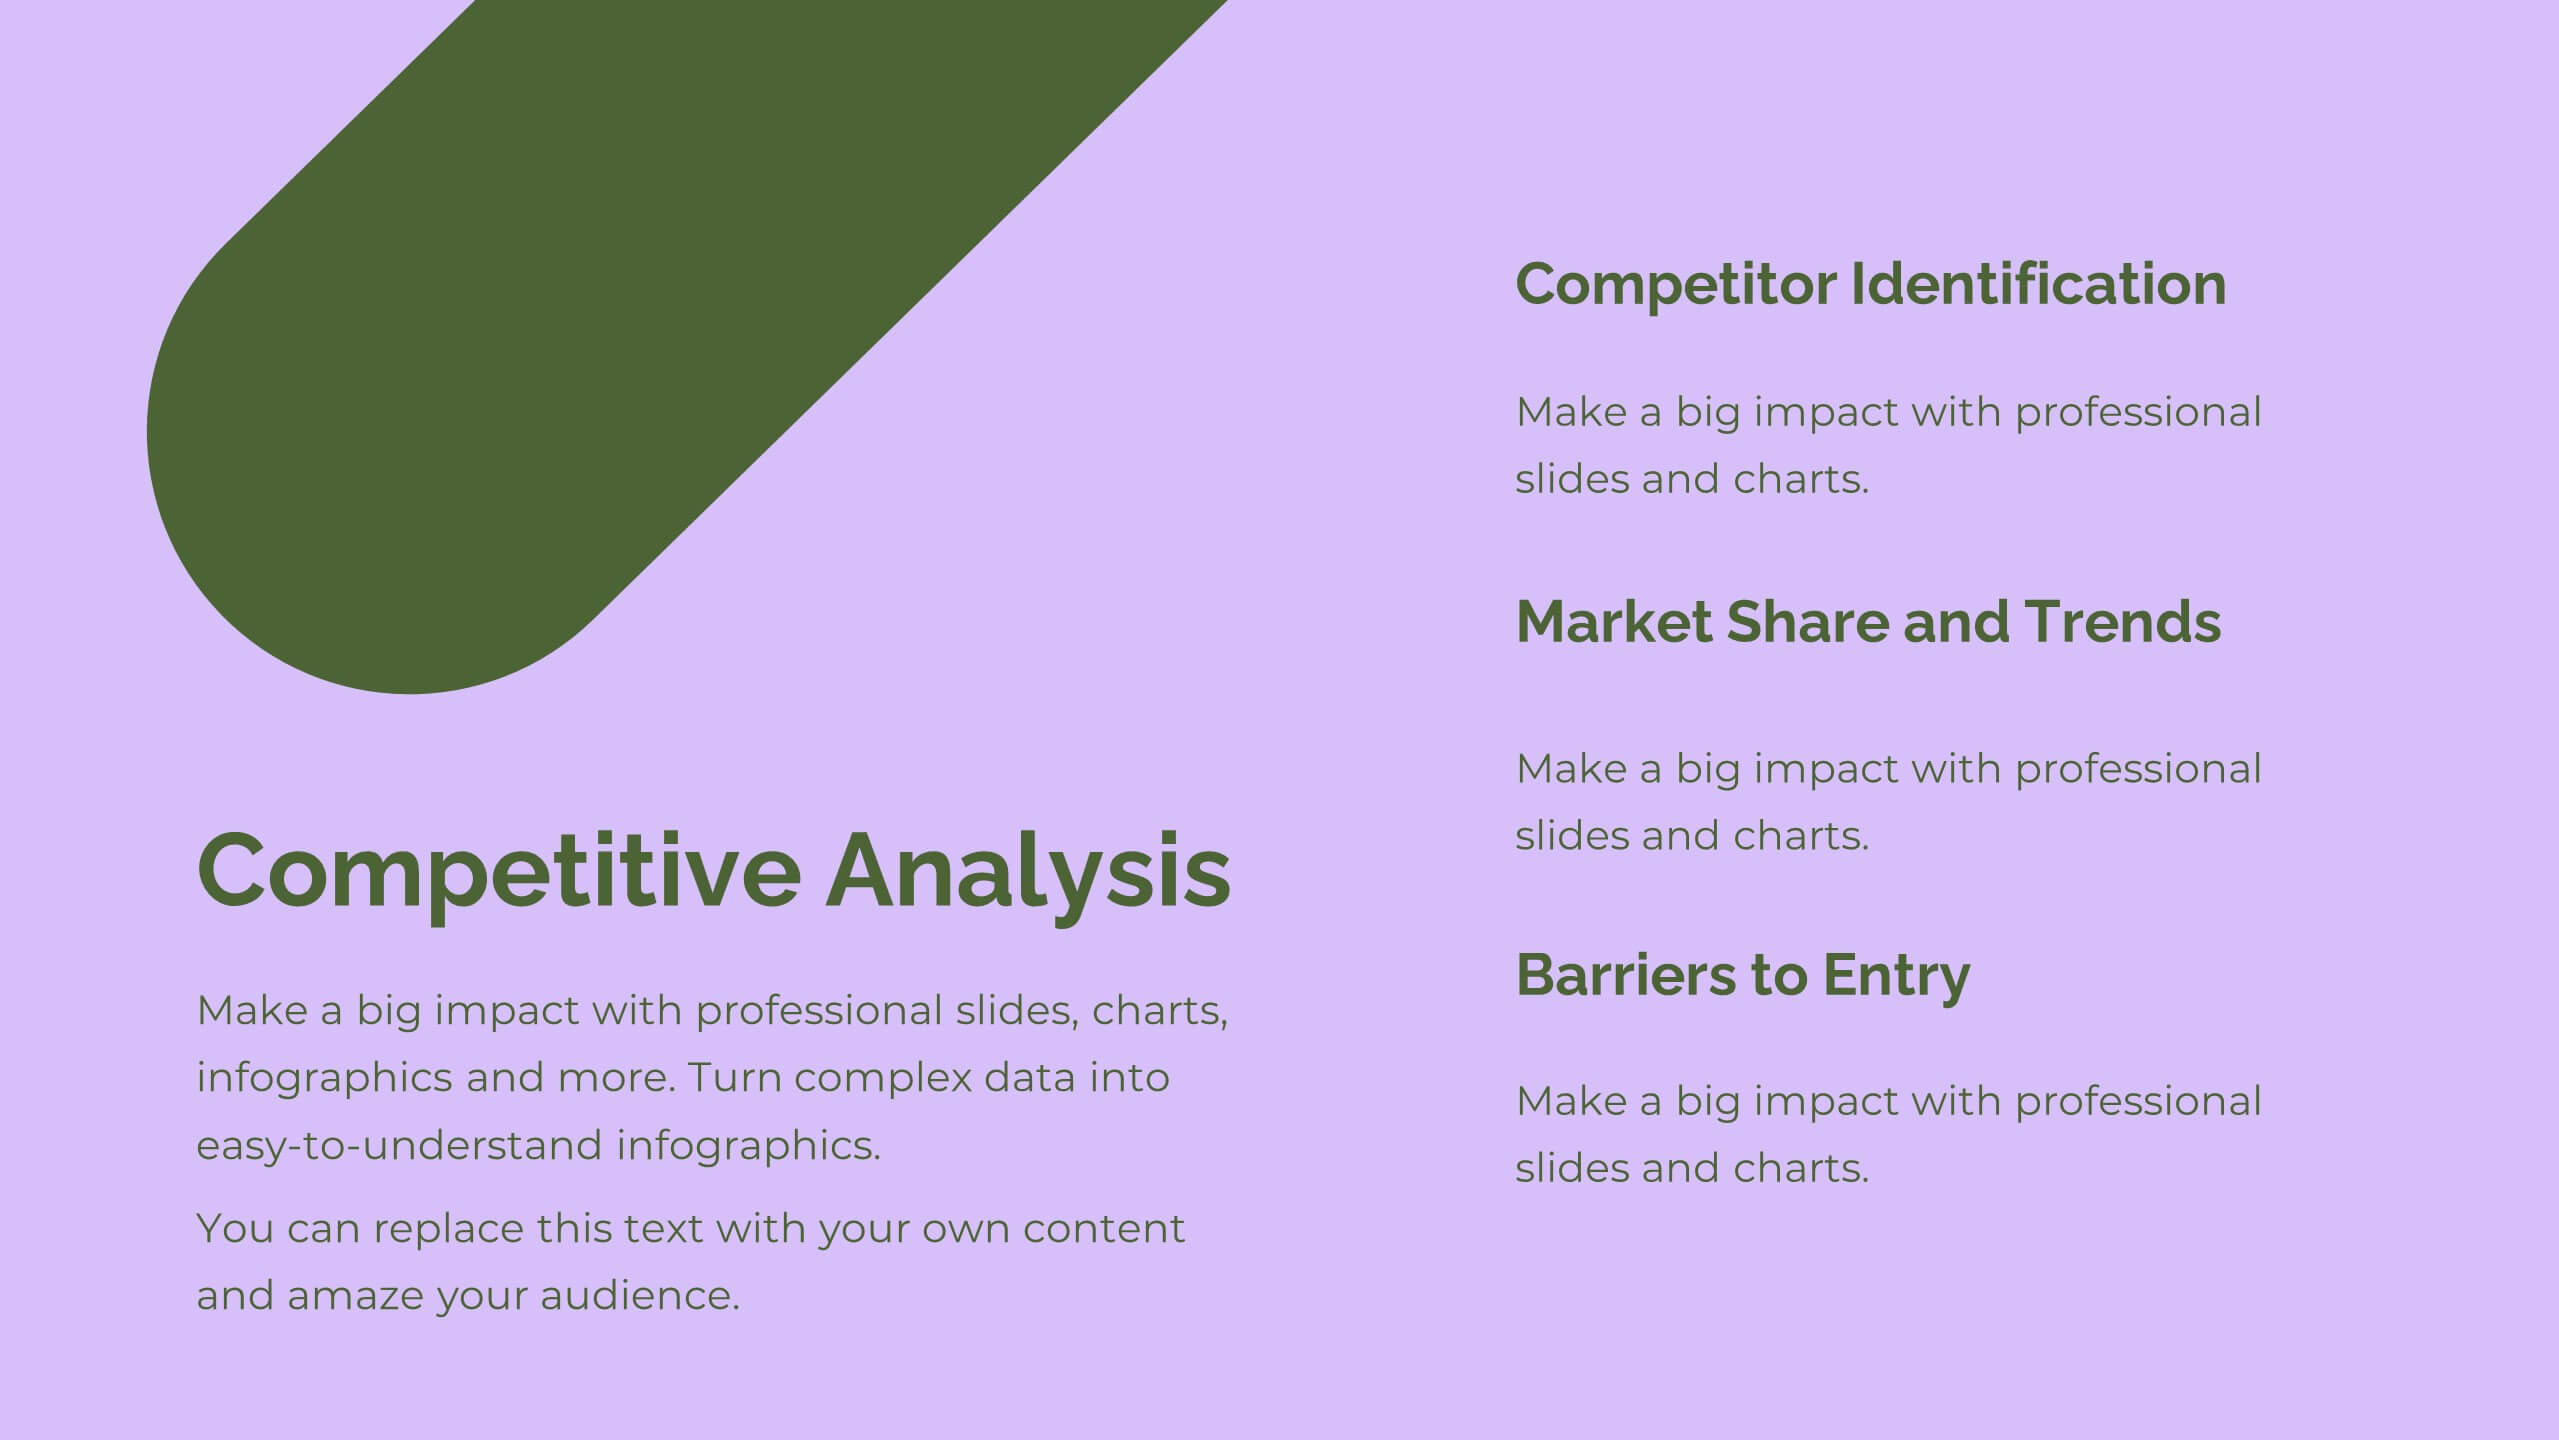
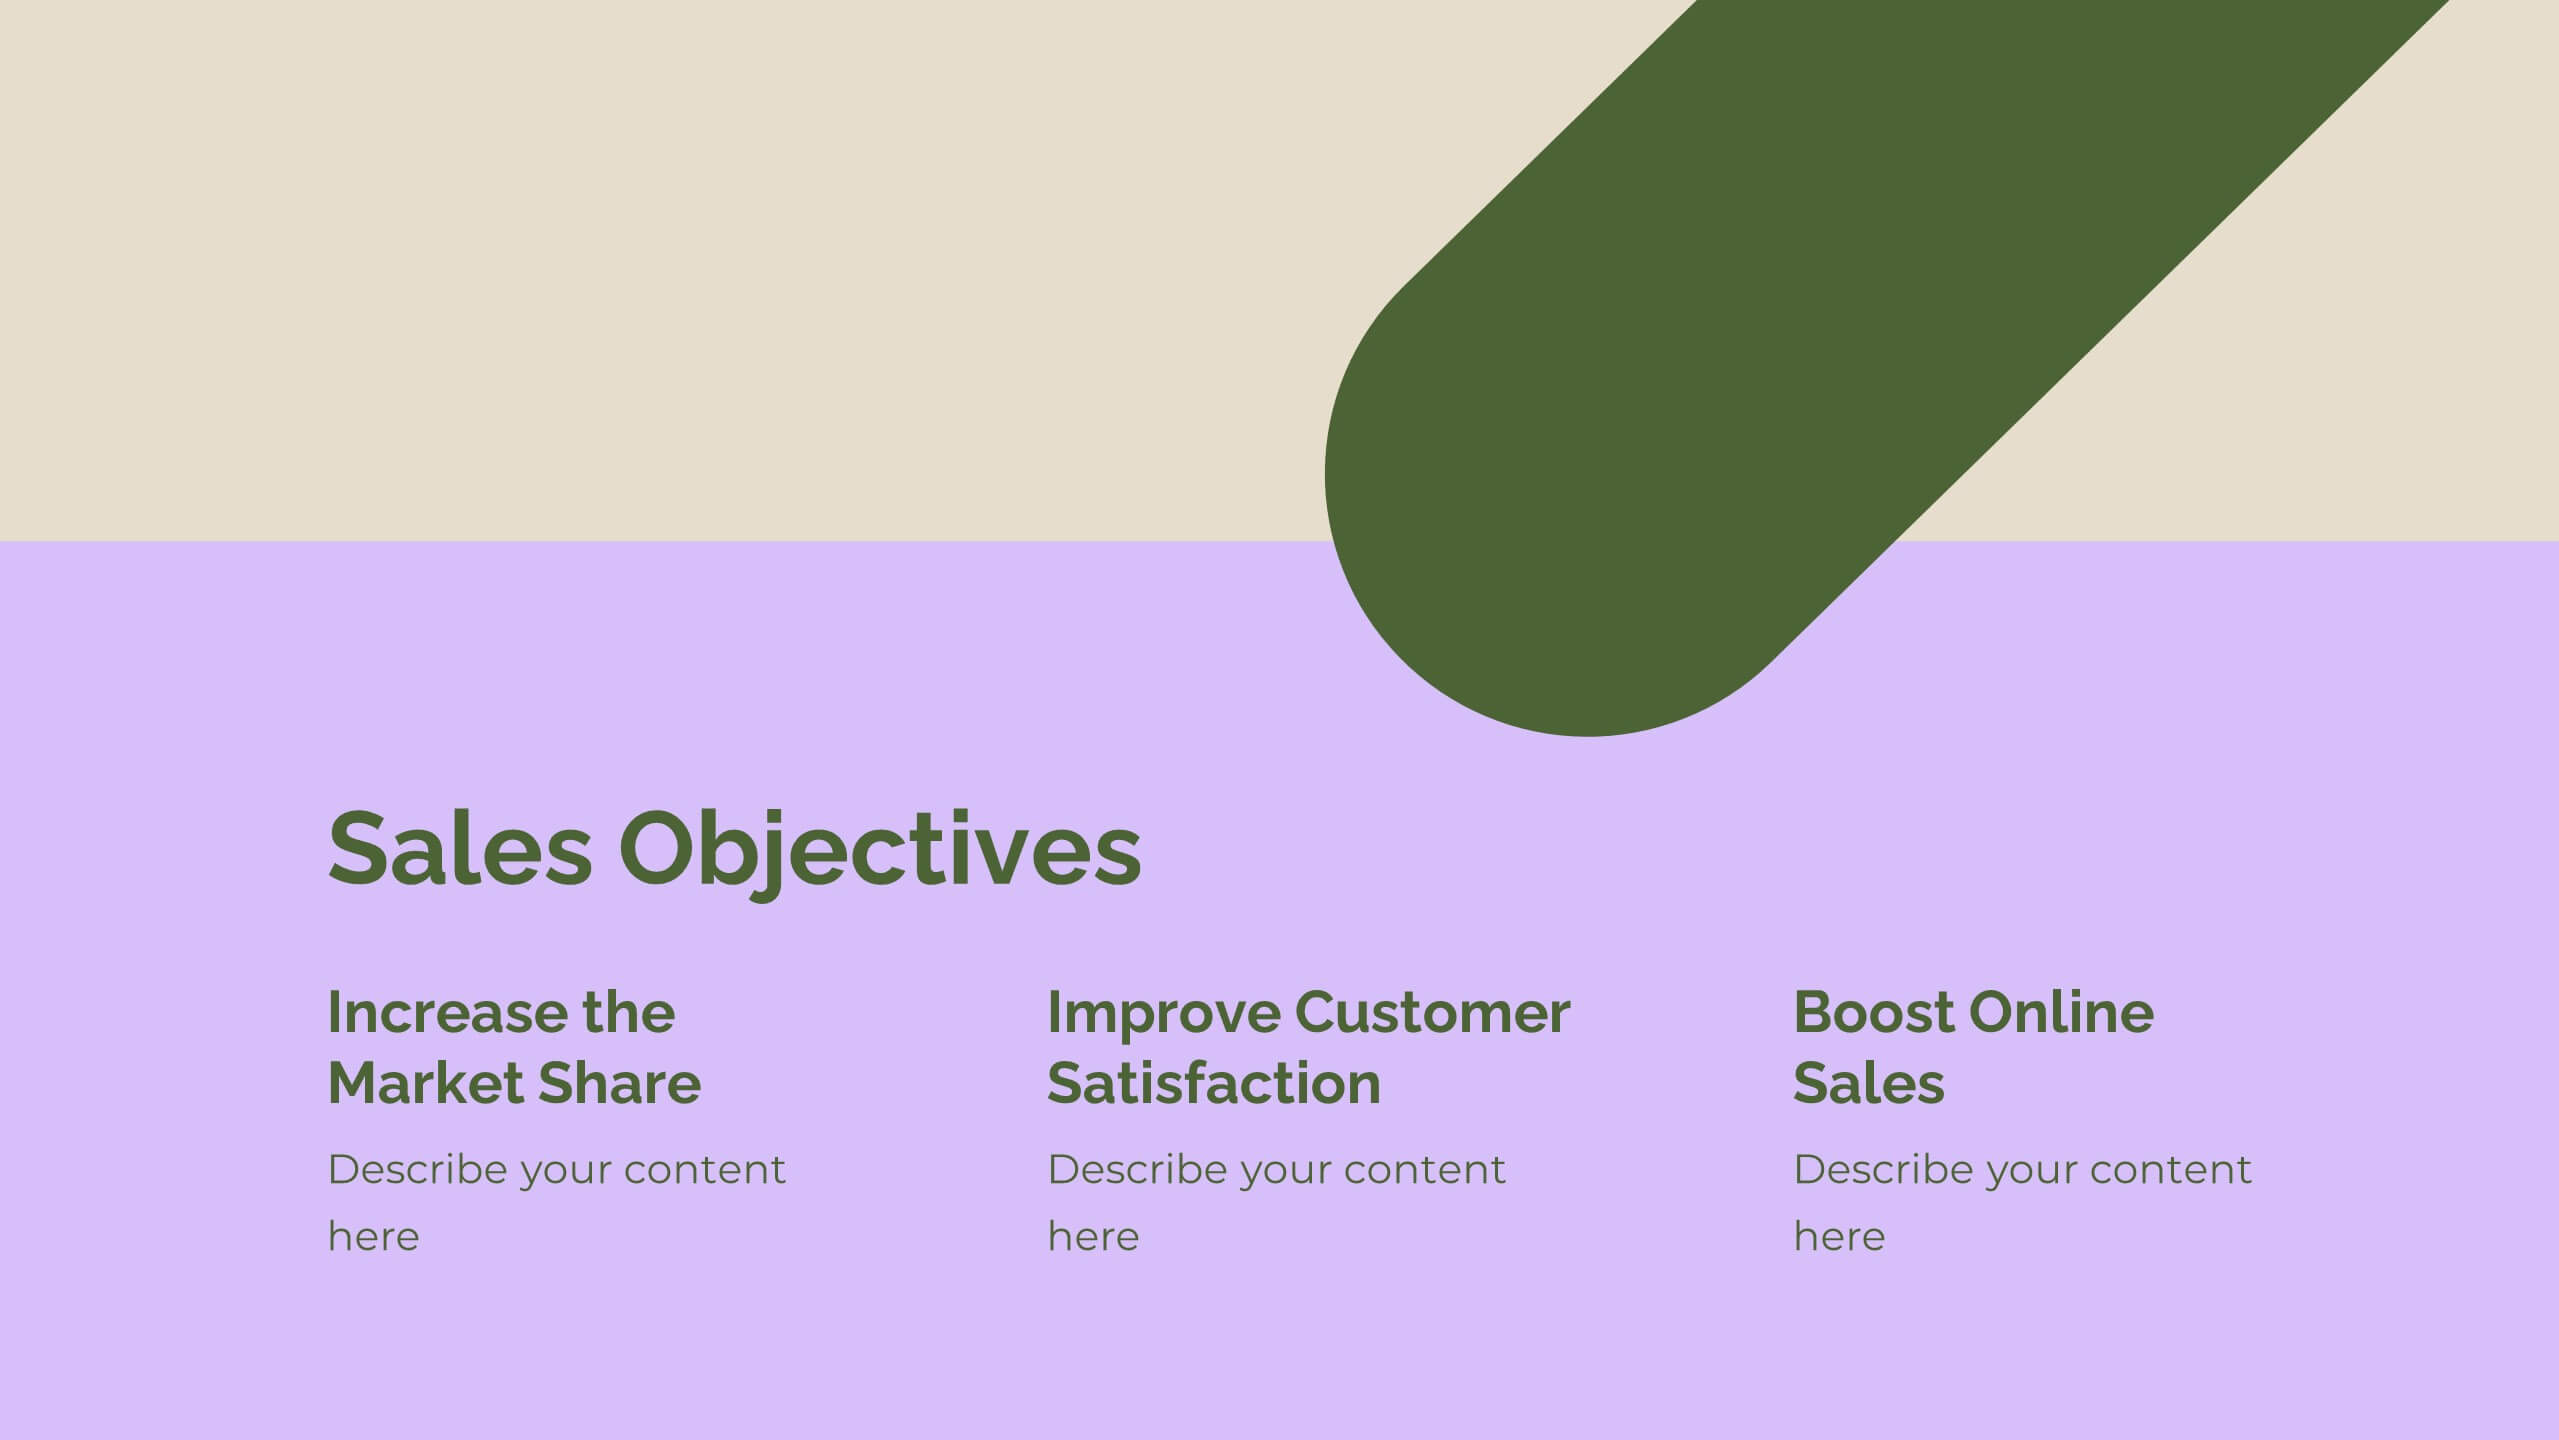
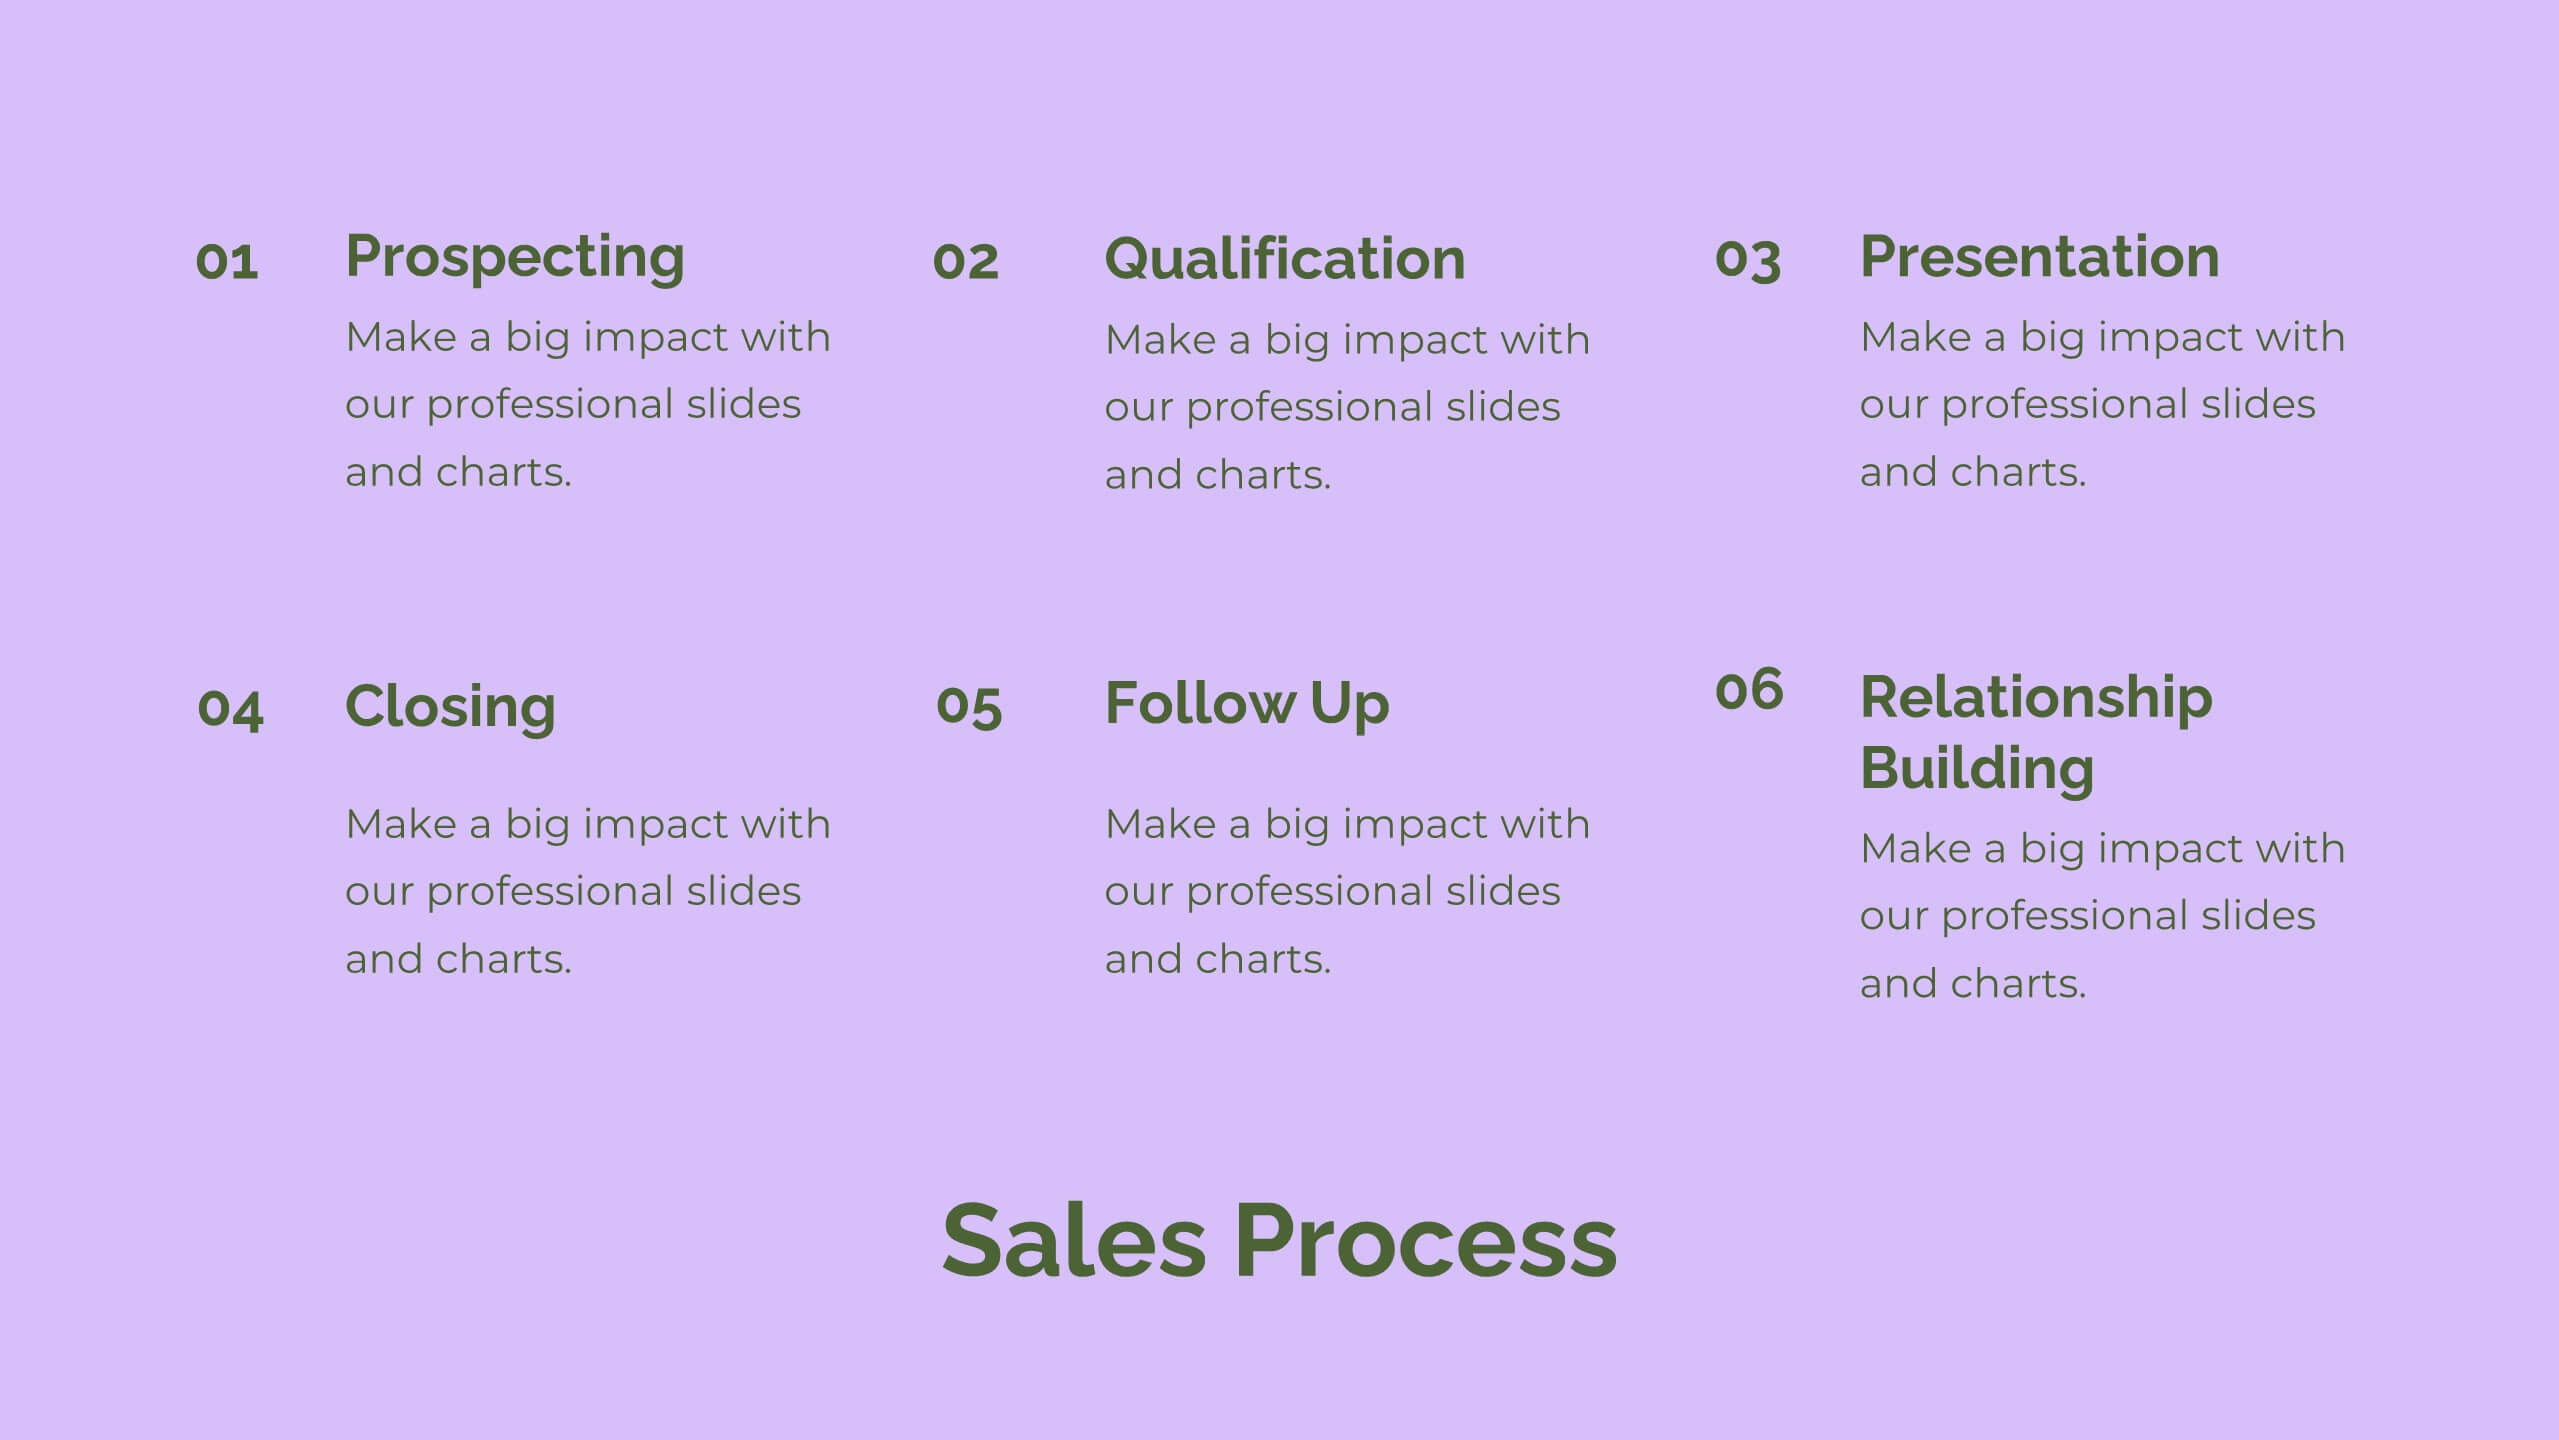
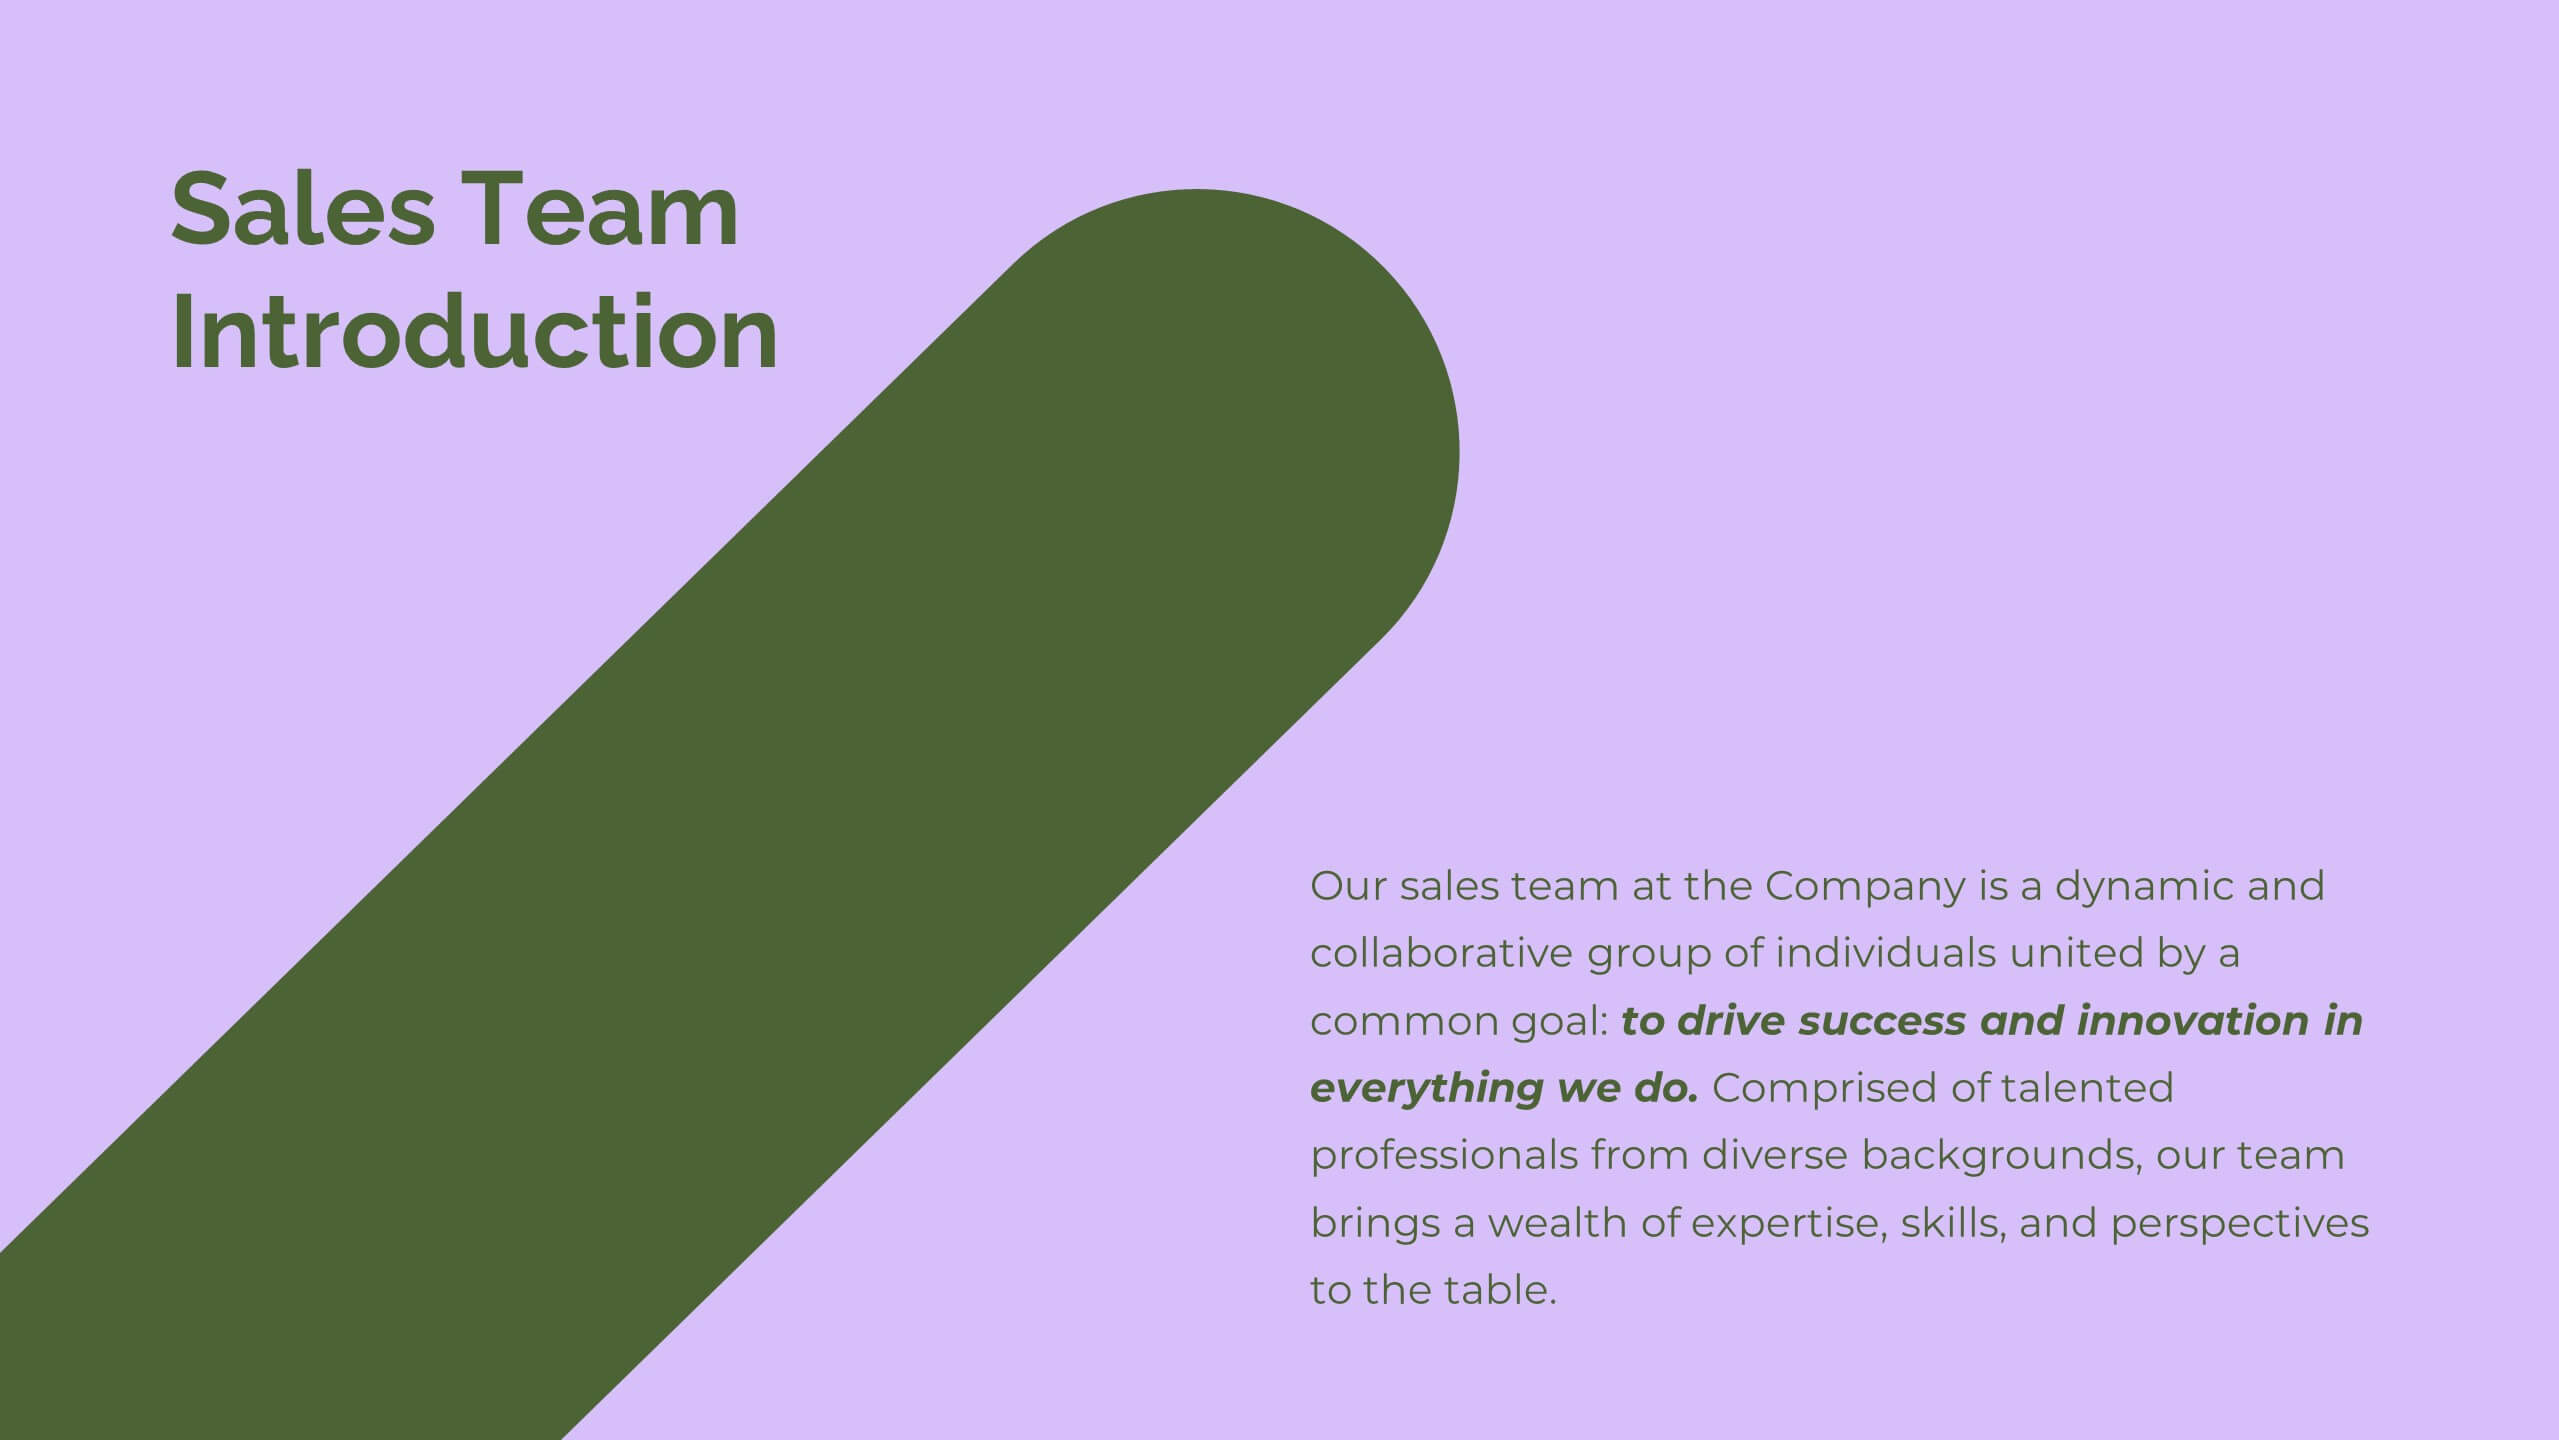
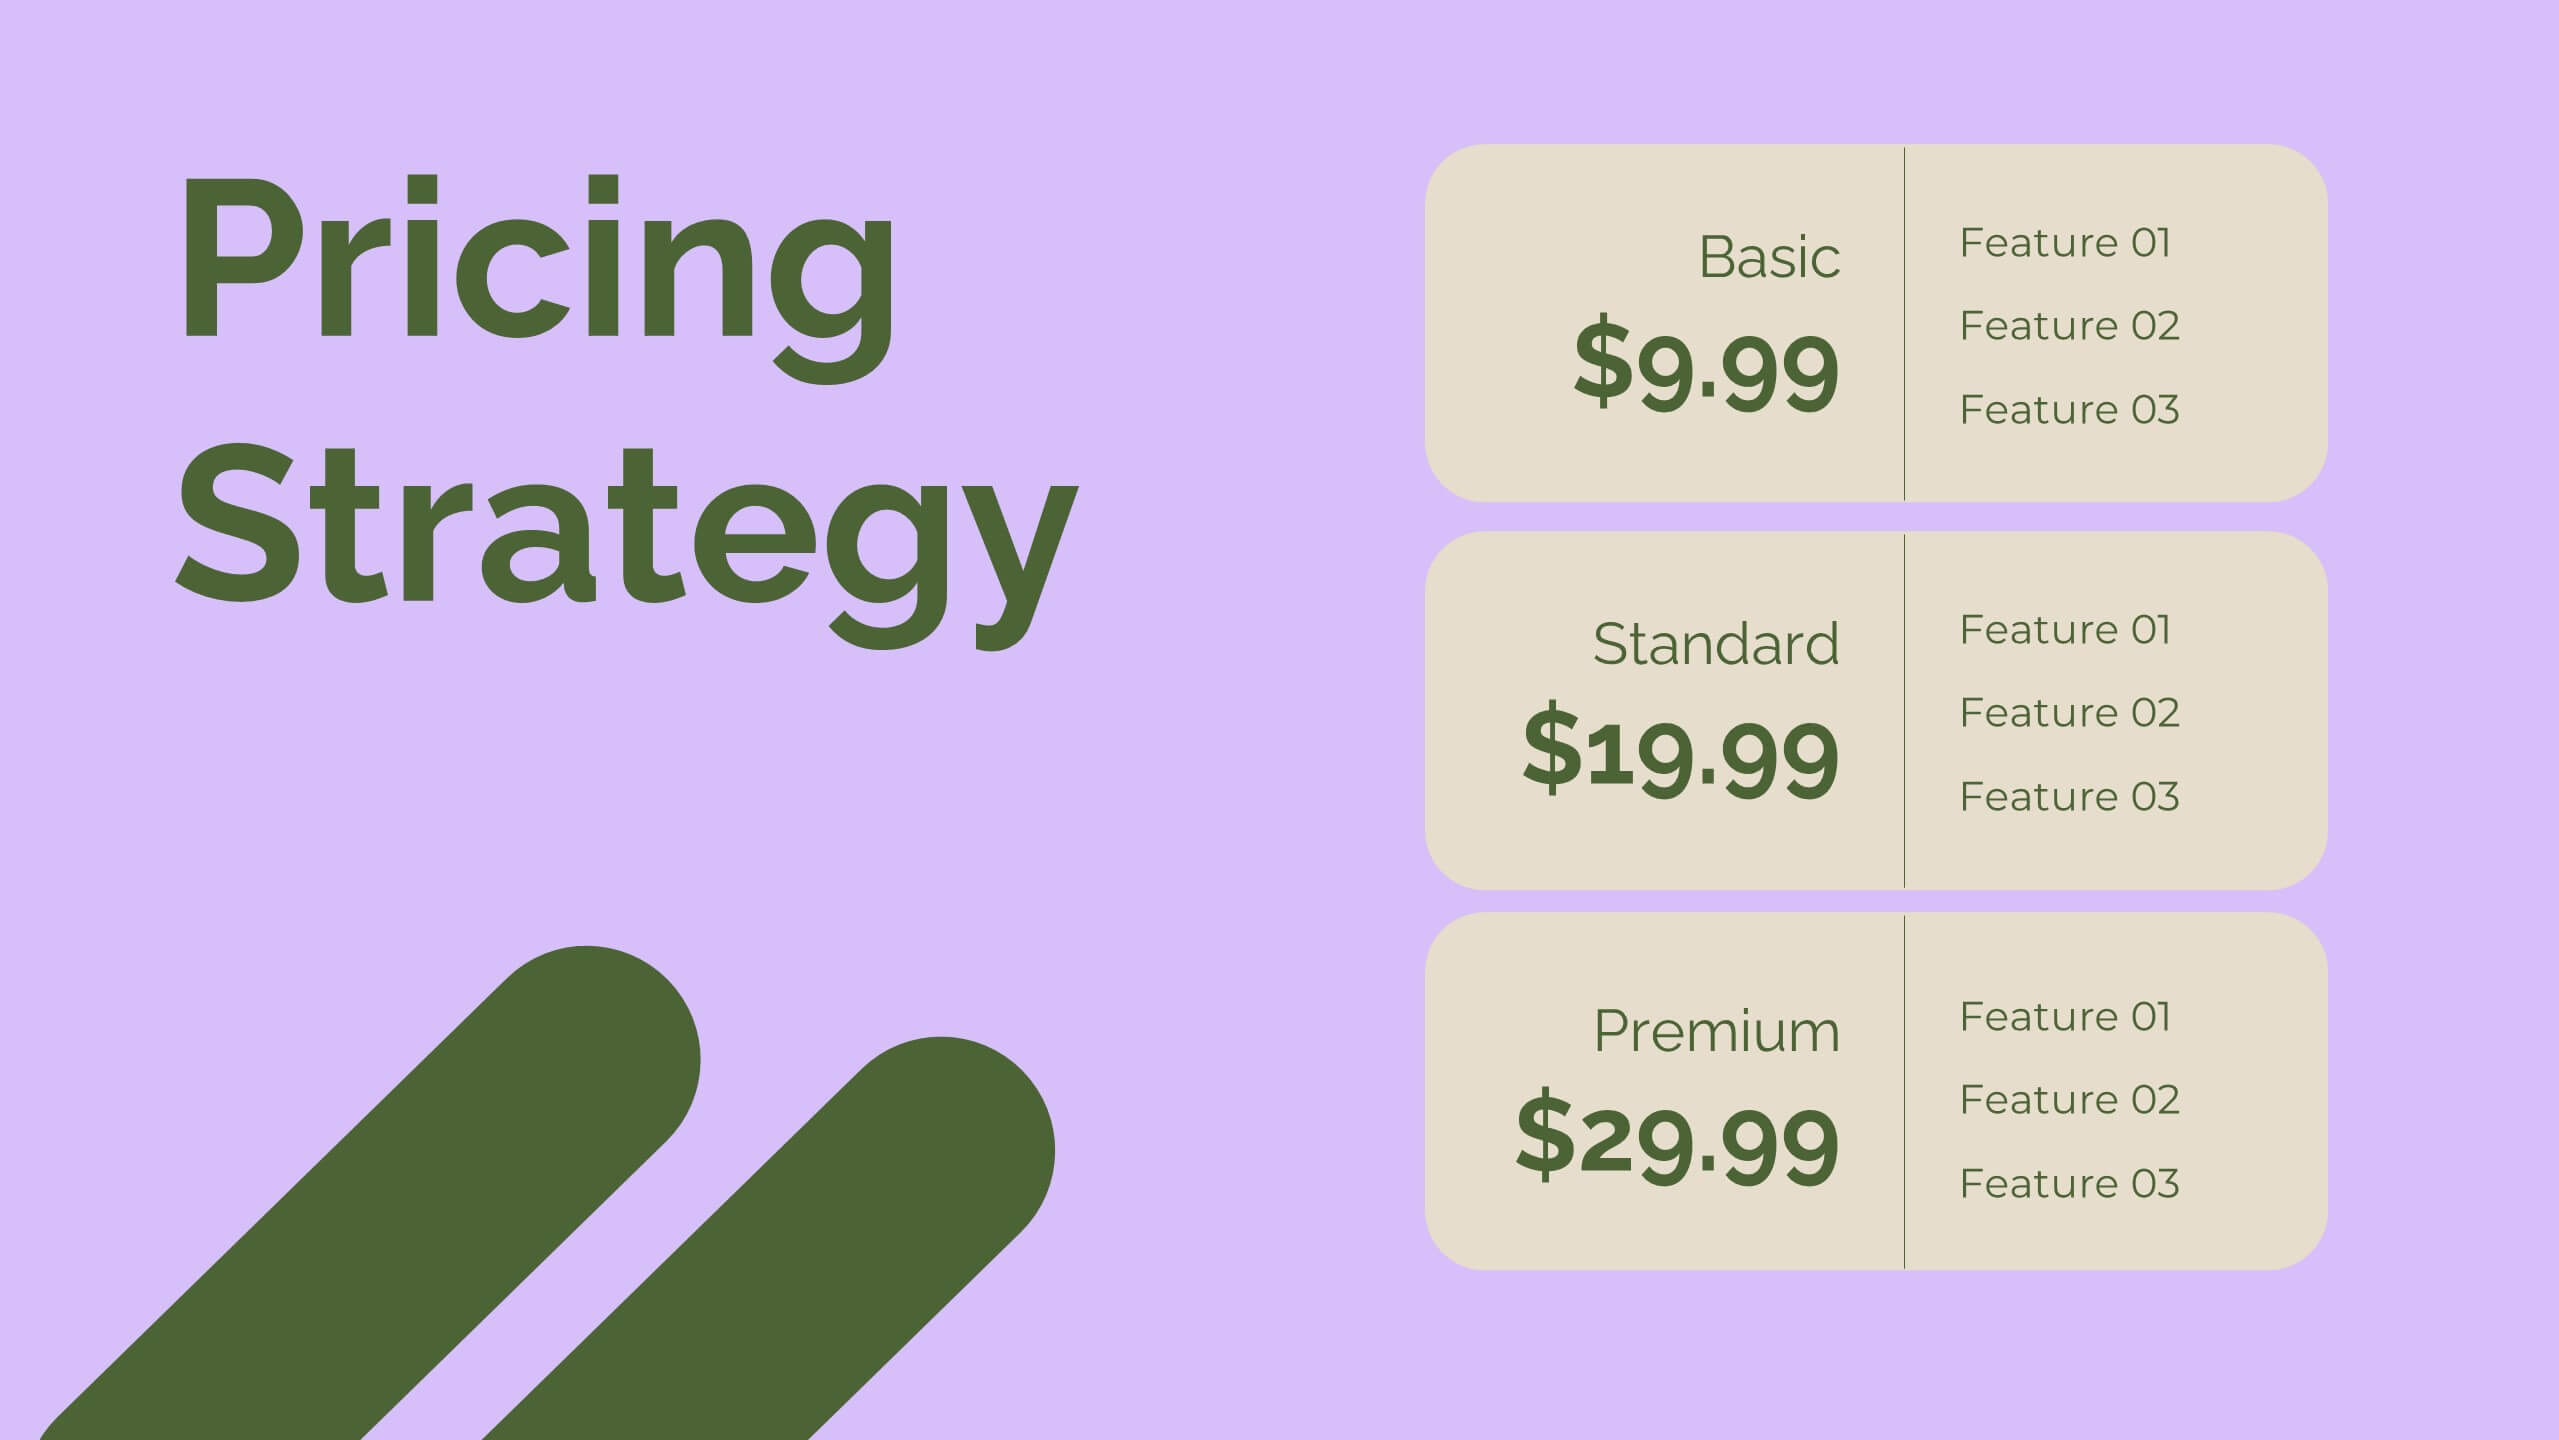
Glint Sales Strategy Presentation
Boost your sales performance with this dynamic sales strategy template! Perfect for presenting your company overview, product details, and competitive analysis, it includes slides for sales objectives, pricing strategy, and performance metrics. Engage your team with vibrant visuals and clear, structured content. Compatible with PowerPoint, Keynote, and Google Slides for seamless presentations on any platform.


23 diapositivas
Imaginix Digital Strategy Presentation
Plan and execute your business strategy with this sleek and modern template. Covering key areas such as SWOT analysis, competitive landscape, performance metrics, and implementation plans, it’s perfect for professionals aiming to optimize digital initiatives. Fully customizable and compatible with PowerPoint, Keynote, and Google Slides.


7 diapositivas
Executive Summary Infographic Presentation Template
An Executive Summary is a document that provides an overview of the main points of a larger report. It is often written to share with individuals who may not have time to review the entire report. The executive summary provides a summary that sets out what's in the report, who it is written for, what it covers and why it's important. Use this template to create a powerful summary, which makes it easier to communicate your engagement results and outline your most important points. This template was designed to suggest a number of ways to enhance your executive summary and make it more persuasive.


5 diapositivas
Target Audience Analysis Slide Presentation
Discover who your audience truly is with this clear and visually balanced layout designed to simplify audience insights. Perfect for marketing plans, presentations, and strategy reports, it helps you visualize key demographics and behaviors effortlessly. Fully customizable and compatible with PowerPoint, Keynote, and Google Slides for easy editing.


5 diapositivas
Renewable Energy Sector Infographics
Illuminate your audience's knowledge with our renewable energy sector infographics. Radiating with vibrant shades of orange, yellow, and blue, this creative, vertical template breathes life into data and trends in the clean energy realm. Compatible with Powerpoint, Keynote, and Google Slides. Whether you're an environmental advocate or an academic researcher, these infographics, embellished with relevant graphics and icons, serve as a catalyst for enlightening discussions. From solar power breakthroughs to wind energy statistics, these visual aids are geared to power impactful presentations and reports in the renewable energy sector.


4 diapositivas
Business Operations Office Theme Presentation
Make your workflow feel effortless with this sleek, illustrated office layout designed to simplify complex business operations. Ideal for presenting processes, responsibilities, or resource planning, the clean visuals and structured format help communicate your message clearly. Fully editable and compatible with PowerPoint, Keynote, and Google Slides for seamless customization.


3 diapositivas
Market Size and Scaling Insights Presentation
Understand your market potential with the Market Size and Scaling Insights Diagram. This visually engaging template helps you analyze market segments, growth trends, and scaling opportunities with clarity. Ideal for business strategists, analysts, and investors, this slide ensures a concise and professional presentation of key market data. Fully customizable and compatible with PowerPoint, Keynote, and Google Slides.


20 diapositivas
Aether Marketing Research Report Presentation
The Marketing Research Report Presentation Template offers a sleek design with 20 fully customizable slides, ideal for presenting in-depth marketing insights. This template features sections for industry analysis, consumer behavior, emerging technologies, and marketing trends like SEO, social media, and influencer strategies. It also highlights e-commerce trends, personalization, sustainability, and storytelling techniques. The modern black-and-gold gradient aesthetic adds sophistication, making it perfect for professional reports. Compatible with PowerPoint, Keynote, and Google Slides, this template ensures a polished and engaging presentation experience.


8 diapositivas
Business Growth with TAM SAM SOM Framework Presentation
Illustrate Your Market Expansion Strategy with this Business Growth with TAM SAM SOM Framework presentation template. Clearly differentiate Total Addressable Market (TAM), Serviceable Available Market (SAM), and Serviceable Obtainable Market (SOM) to help businesses, entrepreneurs, and investors make informed growth decisions and target market opportunities. This visually engaging and fully customizable template is compatible with PowerPoint, Keynote, and Google Slides, making it ideal for business planning, market research, and investor presentations.


6 diapositivas
Business Process Checklist Overview Presentation
Simplify your workflow presentations with the Business Process Checklist Overview Presentation. This circular layout is ideal for outlining five sequential or cyclical steps in a business process, featuring icon-labeled checkpoints and editable titles. Each step is visually marked with subtle checkmarks, making it perfect for status tracking, task progression, or implementation plans. Clean, professional, and fully customizable in PowerPoint, Keynote, and Google Slides.


6 diapositivas
Bubble Map Ideas Infographics
Visualize your ideas creatively with our Bubble Map Ideas infographic template. This template is fully compatible with popular presentation software like PowerPoint, Keynote, and Google Slides, allowing you to easily customize it to brainstorm and organize your concepts using a bubble map format. The Bubble Map Ideas infographic template offers a visually engaging platform to brainstorm and categorize ideas, concepts, and relationships in a structured and visually appealing manner. Whether you're a creative thinker, project manager, or educator, this template provides a user-friendly canvas to create informative presentations and visualizations of your ideas. Elevate your idea generation and organization with this SEO-optimized Bubble Map Ideas infographic template, thoughtfully designed for clarity and ease of use. Customize it to map out your ideas, prioritize them, and identify key connections, ensuring that your creative process becomes more organized and productive. Start crafting your personalized infographic today to bring your ideas to life.


20 diapositivas
Whisper Creative Portfolio Presentation
The Creative Portfolio Presentation Template is a visually striking 20-slide design, ideal for showcasing your professional work or services. It features slides for introductions, about us, portfolio overviews, and individual project highlights. Key sections include philosophy, style, creative process, client testimonials, awards, and pricing structures. The vibrant yellow and pink gradient elements provide a modern, creative flair that grabs attention. Fully customizable and compatible with PowerPoint, Keynote, and Google Slides, this template is perfect for designers, agencies, and freelancers aiming to present their work professionally and uniquely.


10 diapositivas
Buyer Persona Journey Presentation
Understand your audience better with the Buyer Persona Journey Presentation. This intuitive layout showcases the key stages of your ideal customer’s experience—from discovery to decision-making. Great for marketing campaigns, product development, and sales alignment. Fully editable and compatible with PowerPoint, Keynote, and Google Slides.


26 diapositivas
Creative Home Office Setups Presentation
Transform your workspace into an inspiring and productive haven with this engaging presentation on creative home office setups. Covering ergonomic design, aesthetic organization, tech essentials, and personalized decor, this template helps you present ideas that enhance efficiency and comfort. Fully customizable and compatible with PowerPoint, Keynote, and Google Slides for a seamless experience.


5 diapositivas
Medical Systems and Drug Research Overview Presentation
Present critical insights with this heart-themed infographic, ideal for showcasing medical systems, drug development stages, or treatment data. The visual layout supports four key points with a clear, engaging style. Fully customizable in PowerPoint, Keynote, and Google Slides—perfect for researchers, healthcare analysts, and pharmaceutical presentations.