


Características


¿Tienes alguna pregunta?
Recomendar


4 diapositivas
Company Vision and Long-Term Goals Presentation
Present your company’s future with clarity and impact using this Company Vision and Long-Term Goals slide. Featuring a bar chart-style graphic with ascending growth stages, this template allows you to showcase strategic milestones, business values, or development phases. Each bar is paired with icons and editable text to highlight specific goals, making it ideal for leadership meetings, strategic planning, or investor pitches. Clean, modern, and customizable in PowerPoint, Keynote, and Google Slides.


7 diapositivas
Demographic Segmentation Infographic Presentation
A Demographic Infographic is designed to provide a quick and easy-to-understand snapshot of the key demographic trends and insights. This Template is easy to edit and intuitive, so you can create a stunning presentation in minutes. With this template, you can focus on your content and the design. It's a multipurpose template which means it can be used for different topics: business, education, marketing, and more. You can use this as a template to explain concepts related to your studies, statistics or market research. This template is compatible with Powerpoint, Keynote and Google Slides.


26 diapositivas
Minimalist Architecture Company Profile Presentation
Introducing our Minimalist Architecture Company Profile template, the ideal choice for your architecture firm's presentation needs. This template exudes professionalism and modernity. It's the perfect canvas to showcase your architectural expertise and design process. Compatible with Powerpoint, Keynote, and Google Slides. Whether your firm specializes in residential, commercial, or industrial architecture, this template will help you convey your professionalism and design expertise. Elevate your architectural company to new heights with this sleek template.
5 diapositivas
Performance Progress Tracking Presentation
Monitor performance with precision using this Performance Progress Tracking template. This visually engaging dashboard helps you track progress across multiple stages, from planning to testing. With interactive bar graphs and percentage indicators, you can evaluate real-time performance, identify bottlenecks, and make data-driven decisions. Fully customizable for PowerPoint, Keynote, and Google Slides, ensuring seamless adaptability.


20 diapositivas
Creative Marketing Proposal Presentation
Elevate your business proposals with this sleek marketing proposal template, designed in dynamic purple tones. It comprehensively covers everything from company overview to pricing structures, making it perfect for detailing your marketing strategies effectively. Compatible with PowerPoint, Google Slides, and Keynote, it's ideal for professionals aiming to impress clients and secure projects.


6 diapositivas
Communication Plan Infographic
A communication plan is a strategic document that outlines how an organization or project team intends to communicate with various stakeholders. This infographic template is designed with a structured approach to deliver consistent and effective messages to ensure that all viewers are informed, engaged, and aligned. This template outlines the strategies and tactics for effectively conveying information within an organization or to a target audience. Compatible with Powerpoint, Keynote, and Google Slides. This serves as a quick reference guide for effective communication strategies and help your audience understand the key elements of your plan.


7 diapositivas
Communication Infographic Presentation Template
Communication Infographics are a more professional way of presenting facts and a great way to share your marketing strategy and goals with your team. Our template includes a variety of infographic elements, including bullet points, call to actions and persuasive slogans. This template design is ideal for presentations on subjects such as content marketing, sales, social media strategy, and many more. Our Communication Template includes graphic illustrations, slides and text boxes for your topics. In this template you can easily add your own text and images to create a meaningful presentation.


21 diapositivas
Talestra Startup Pitch Deck Presentation
Make a strong first impression with this clean and modern startup pitch deck. Covering key areas such as mission and vision, market analysis, business model, growth plan, and financial overview, it's designed to captivate investors and stakeholders. Fully customizable and compatible with PowerPoint, Keynote, and Google Slides.


21 diapositivas
Fluorion Startup Strategy Presentation
Kickstart your business with this modern and professional Startup Strategy Presentation Template. Designed to help entrepreneurs, startups, and business owners present their vision, goals, and strategies effectively. This template includes 21 fully customizable slides covering essential sections such as mission and vision, market analysis, business model, financial overview, and growth plan. Compatible with PowerPoint, Keynote, and Google Slides for seamless editing and presentation.


20 diapositivas
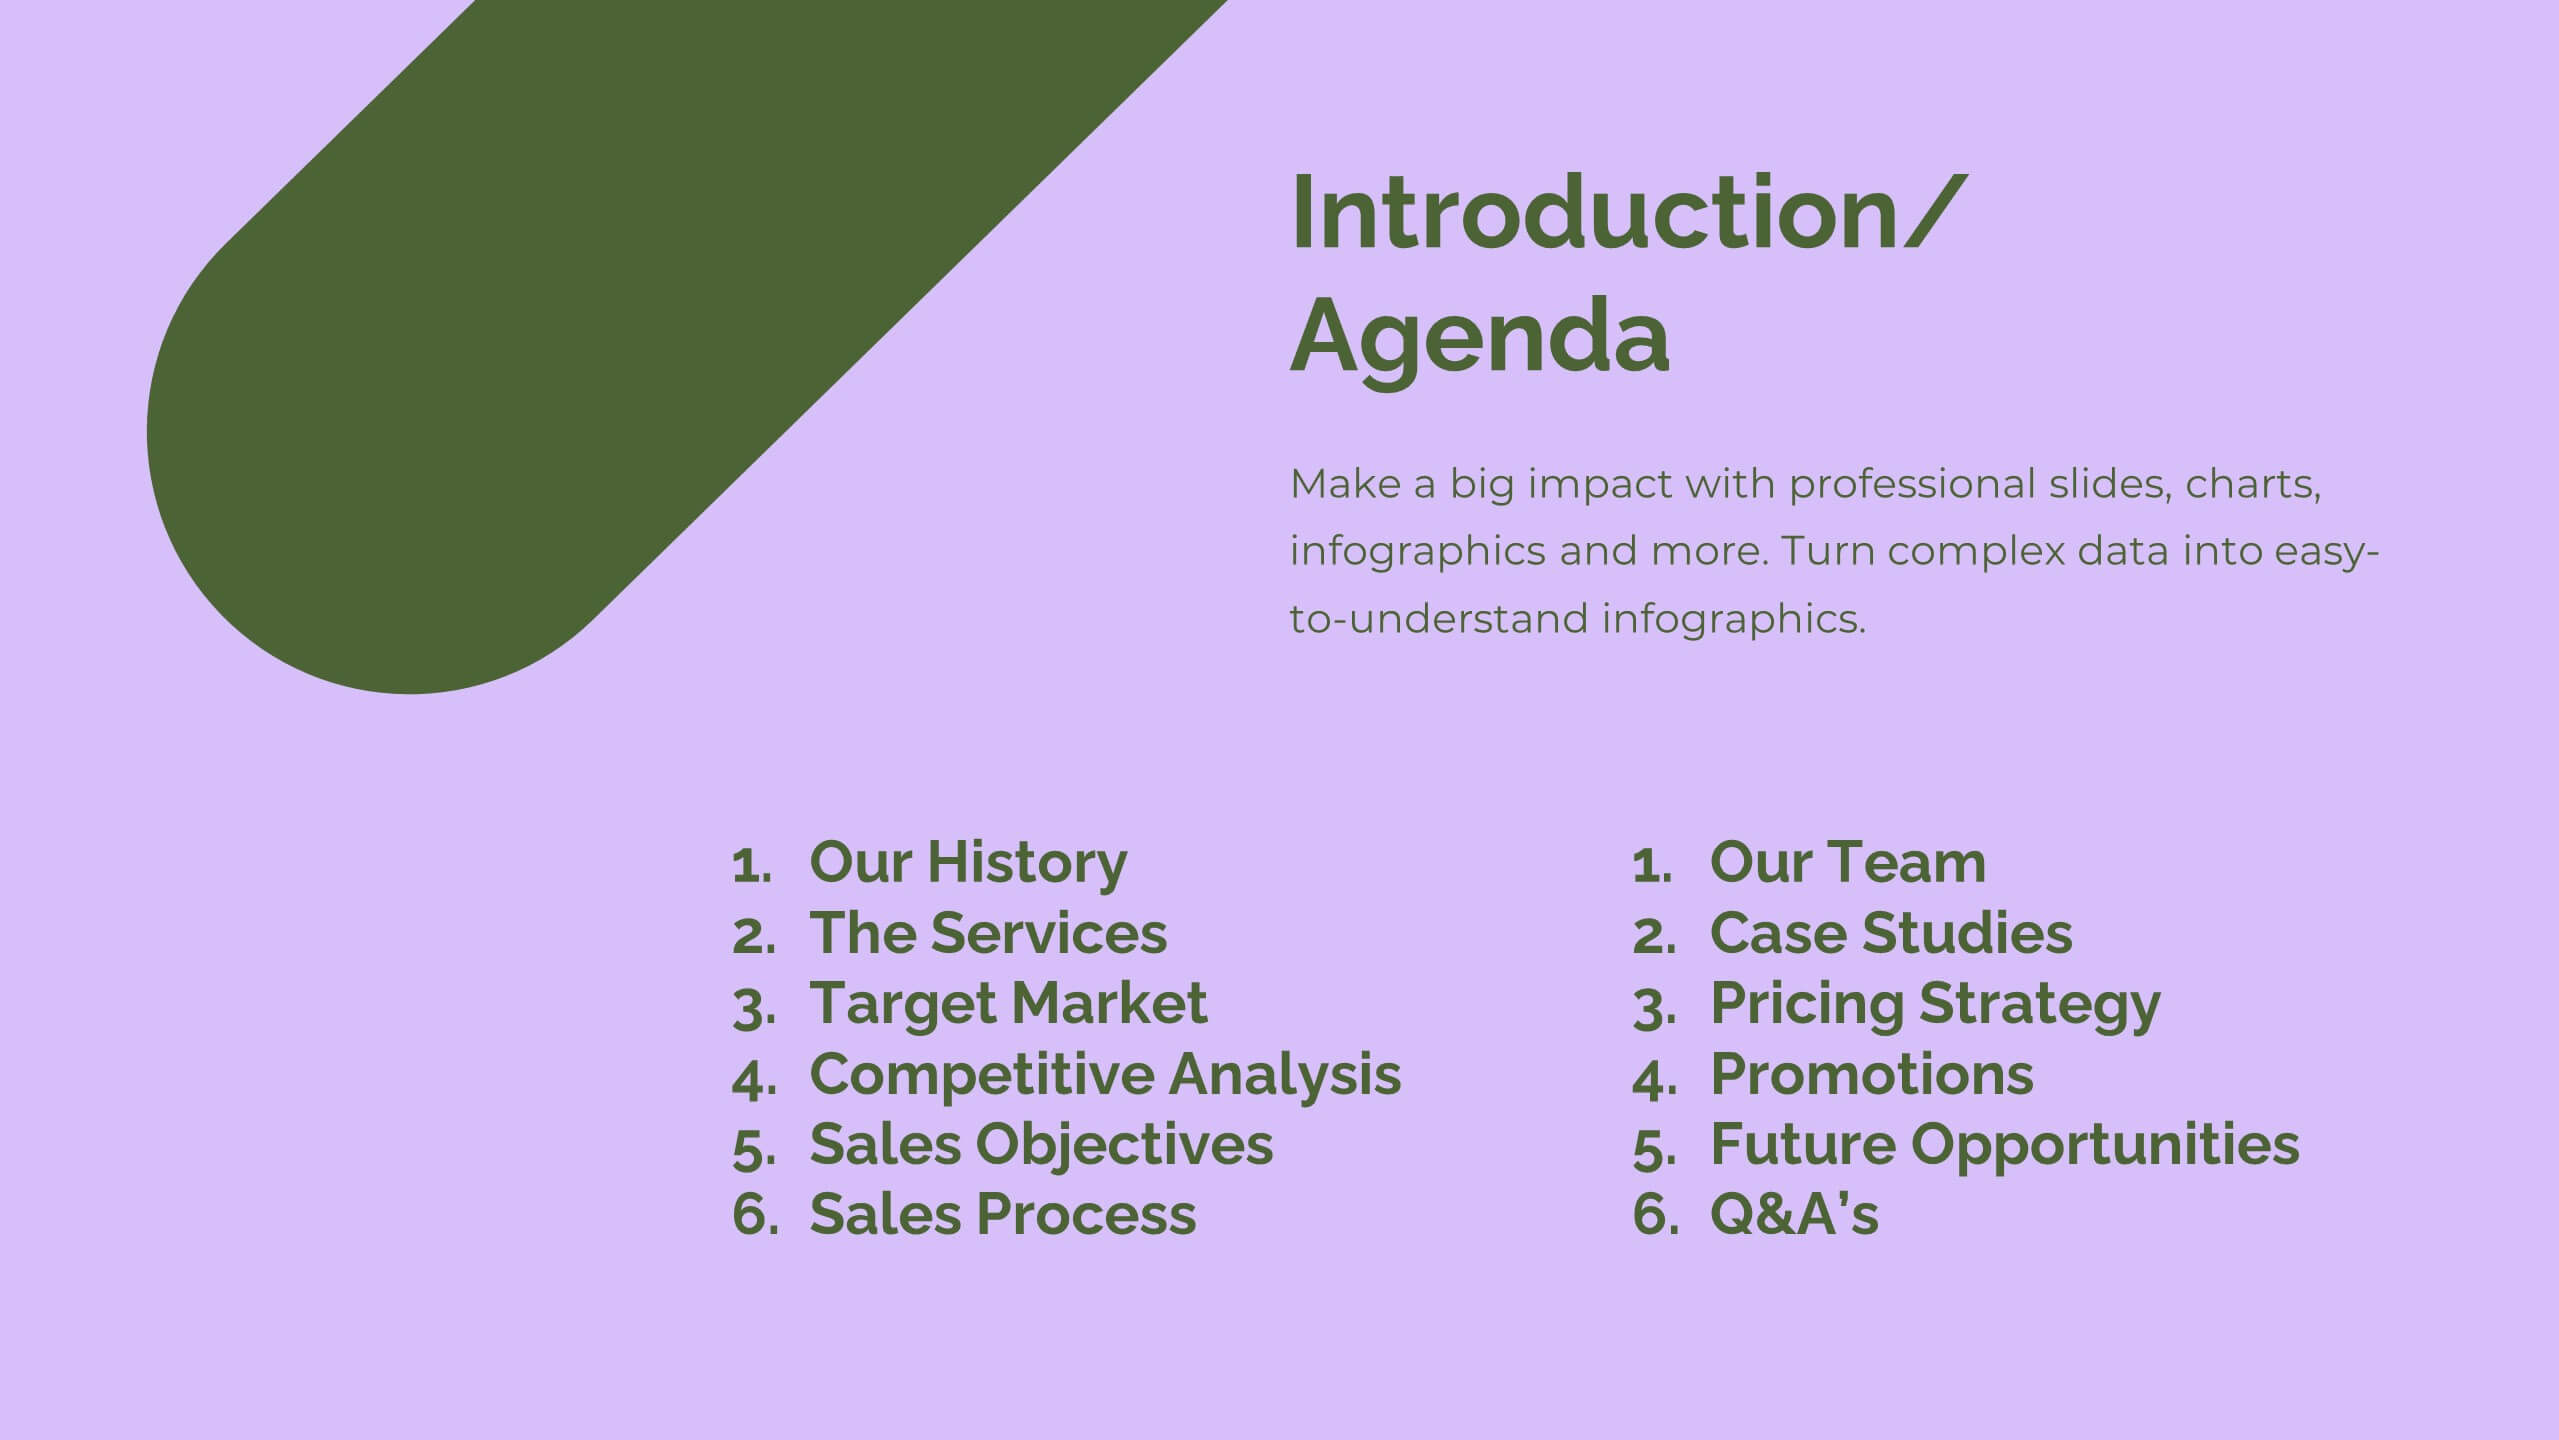
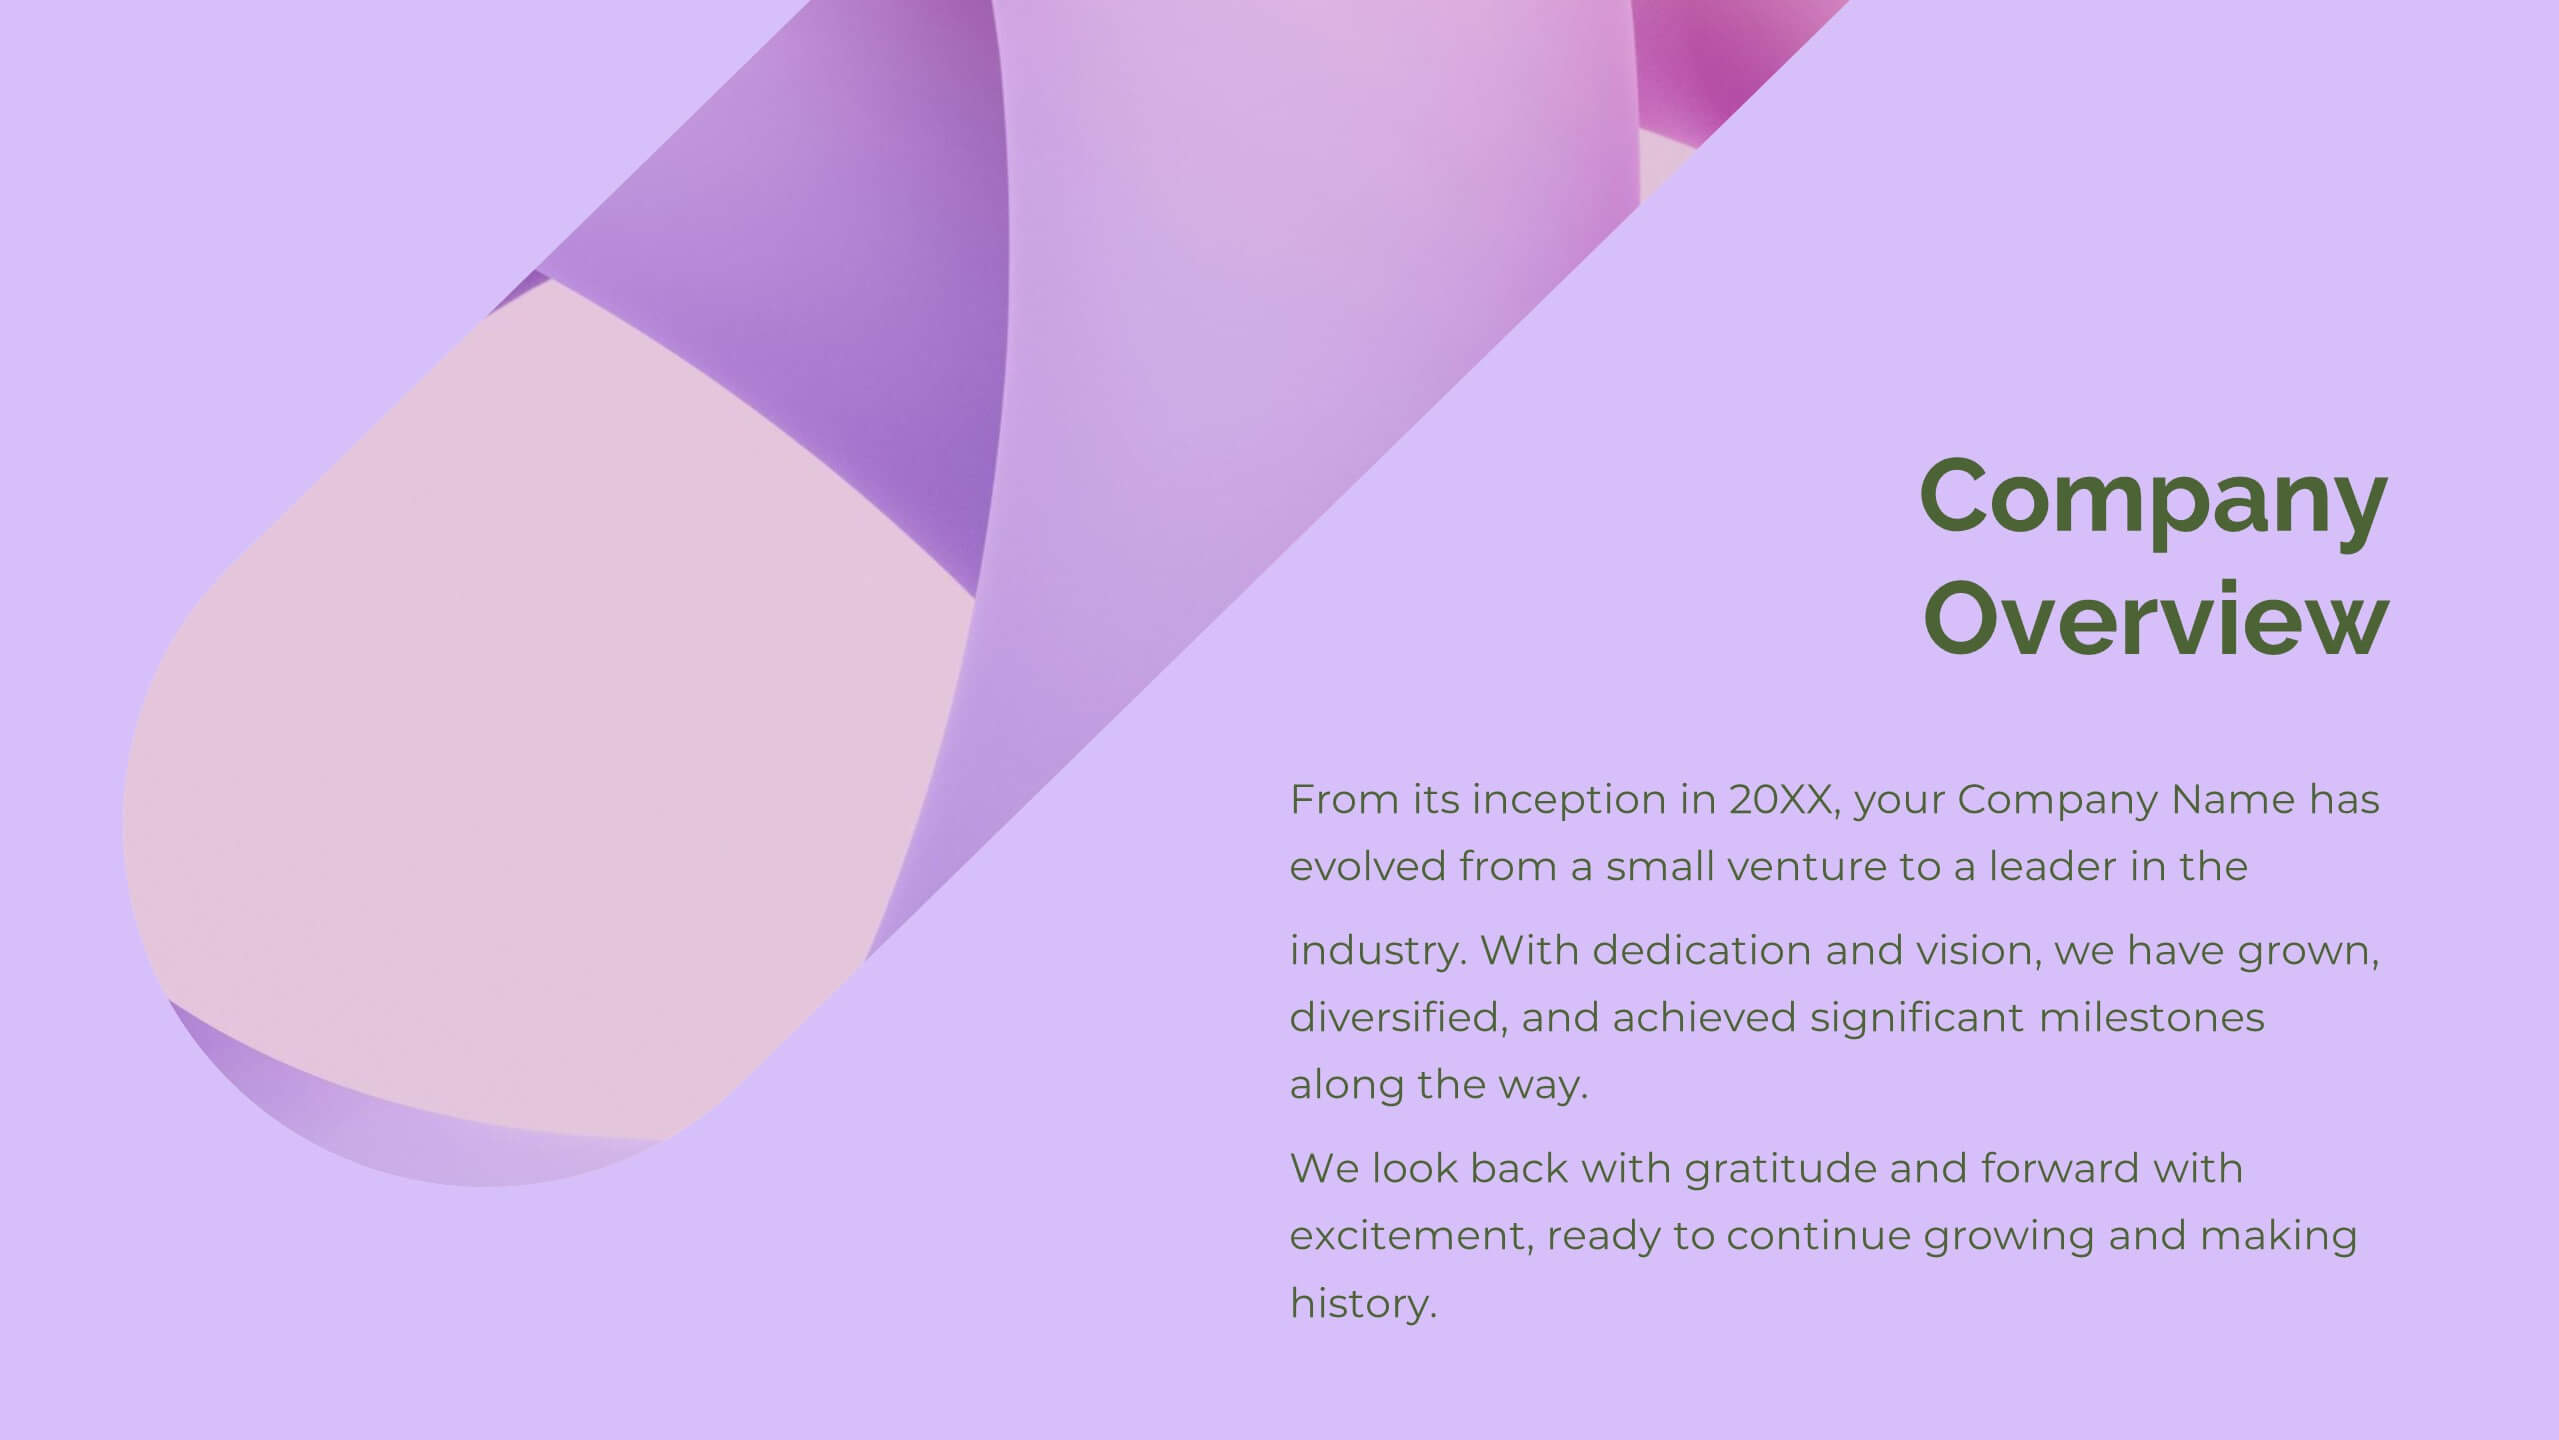
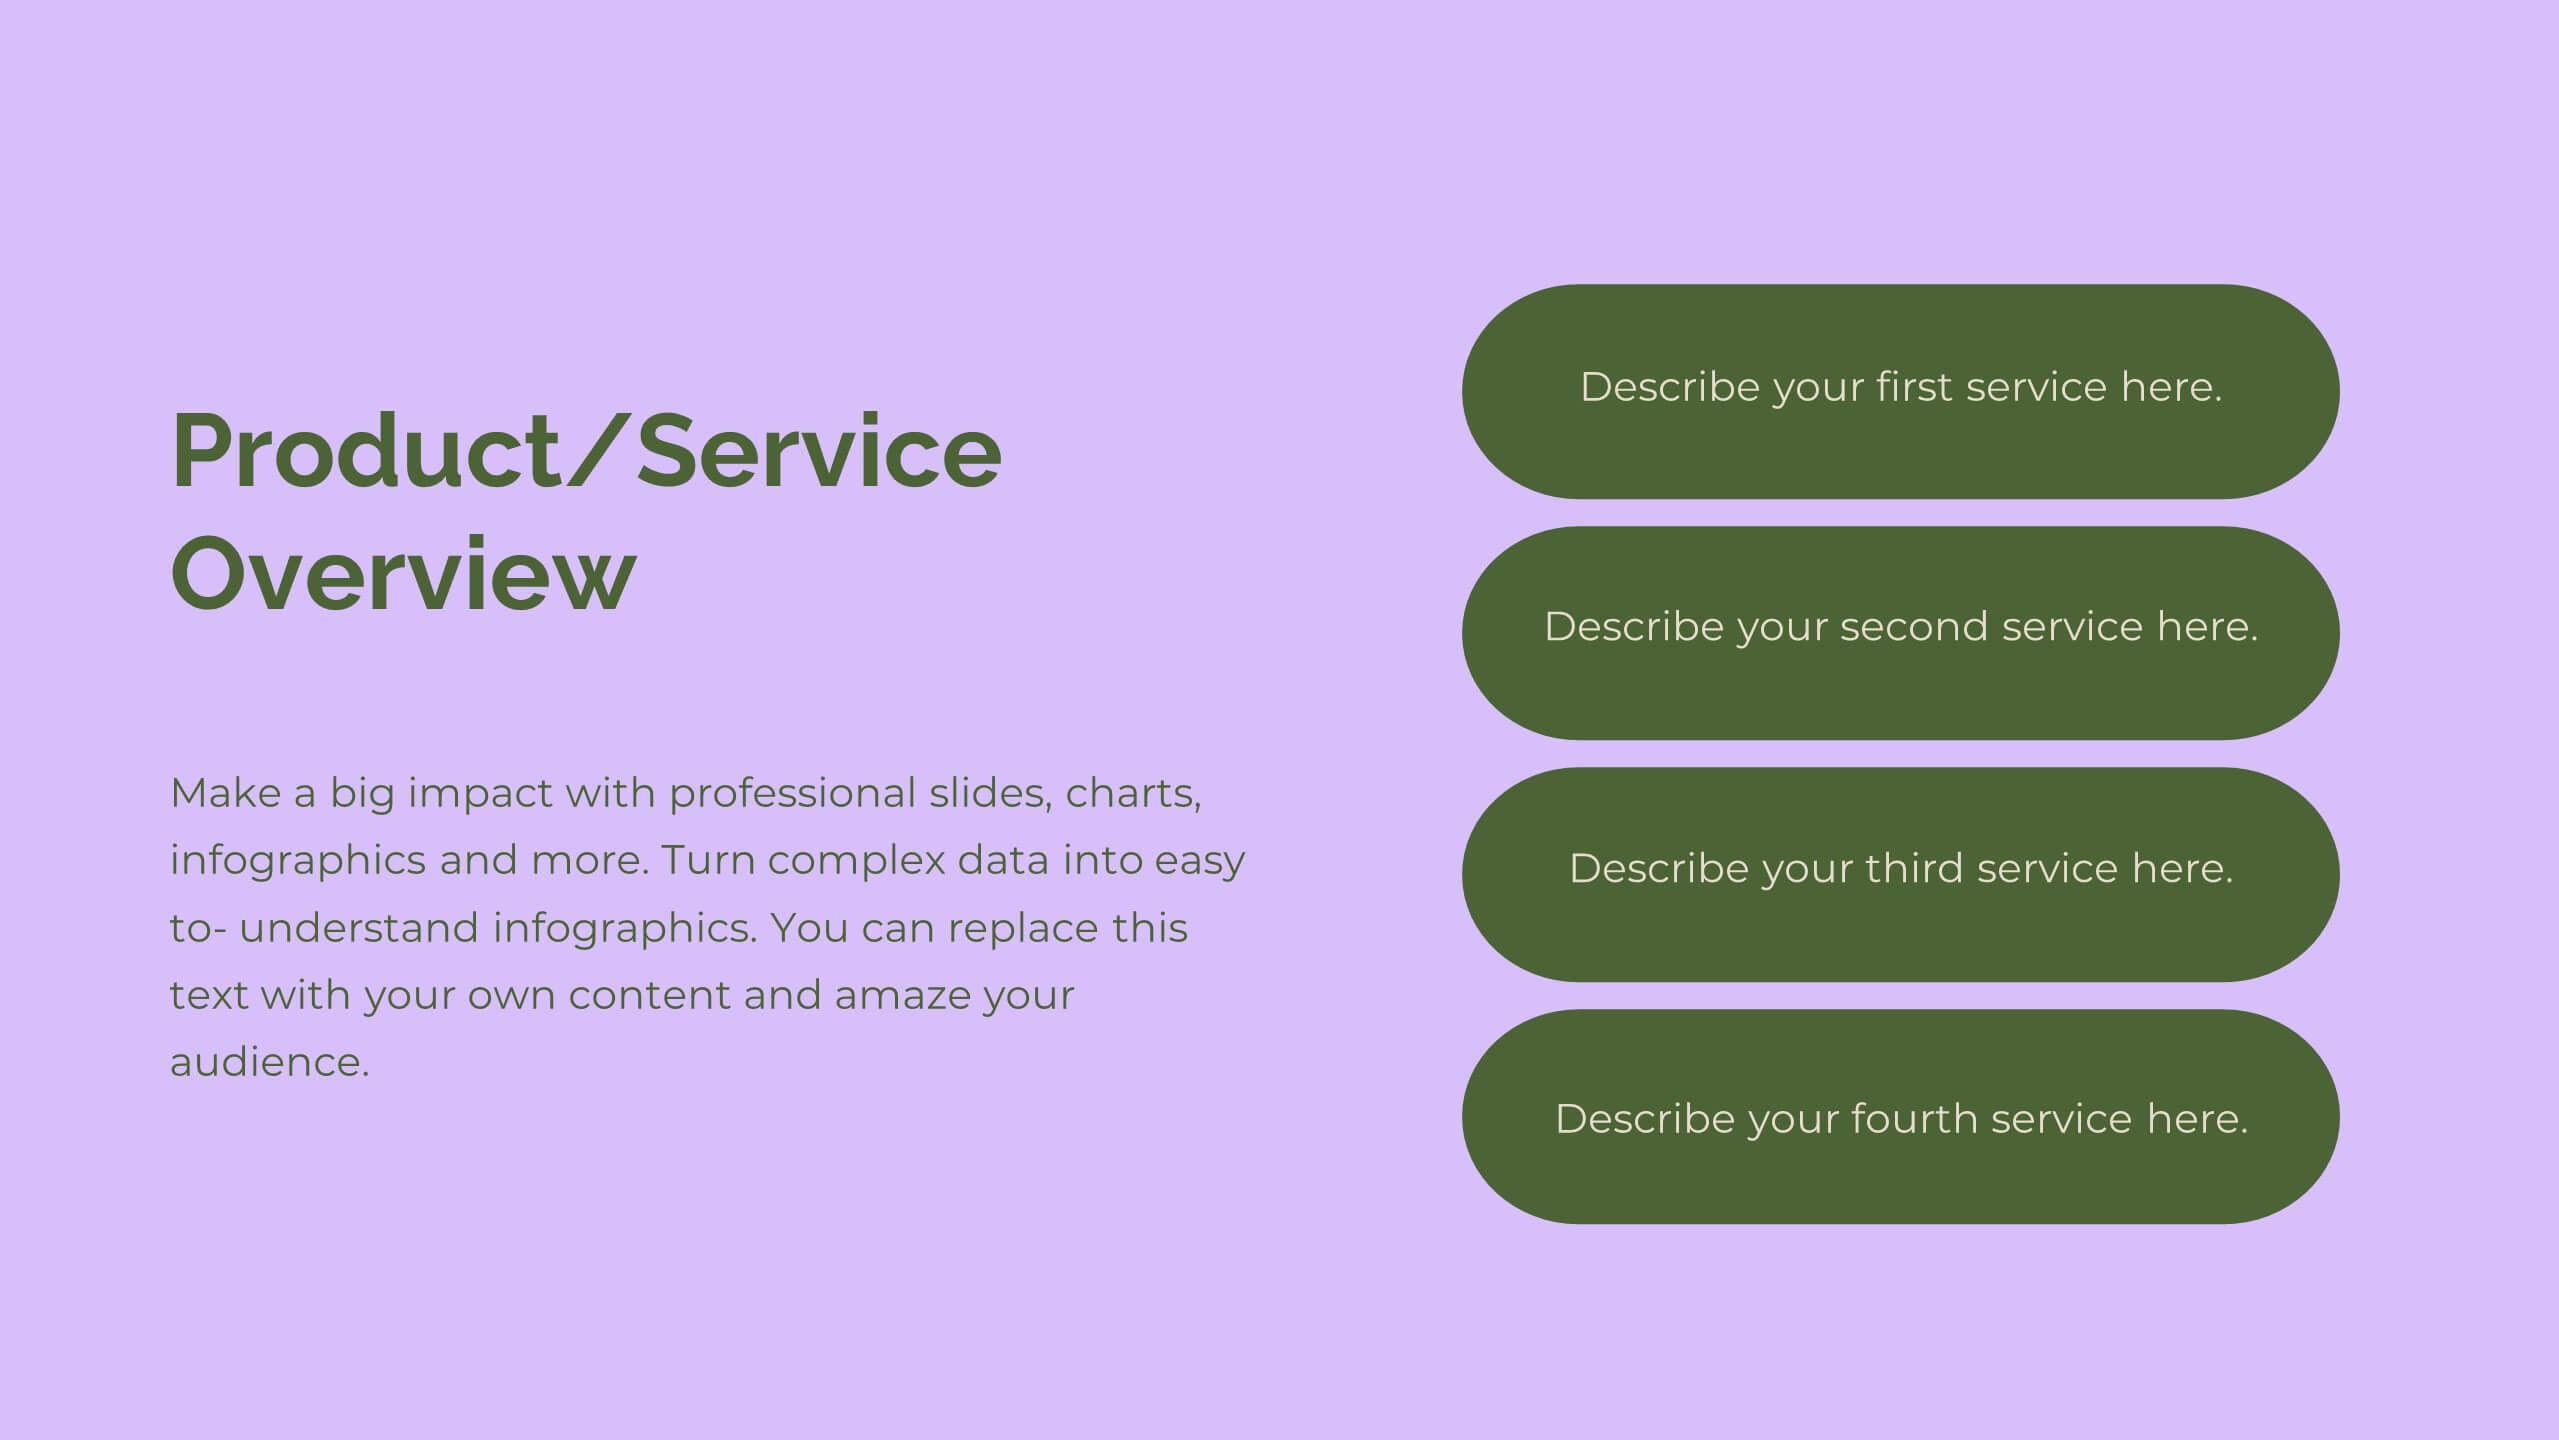
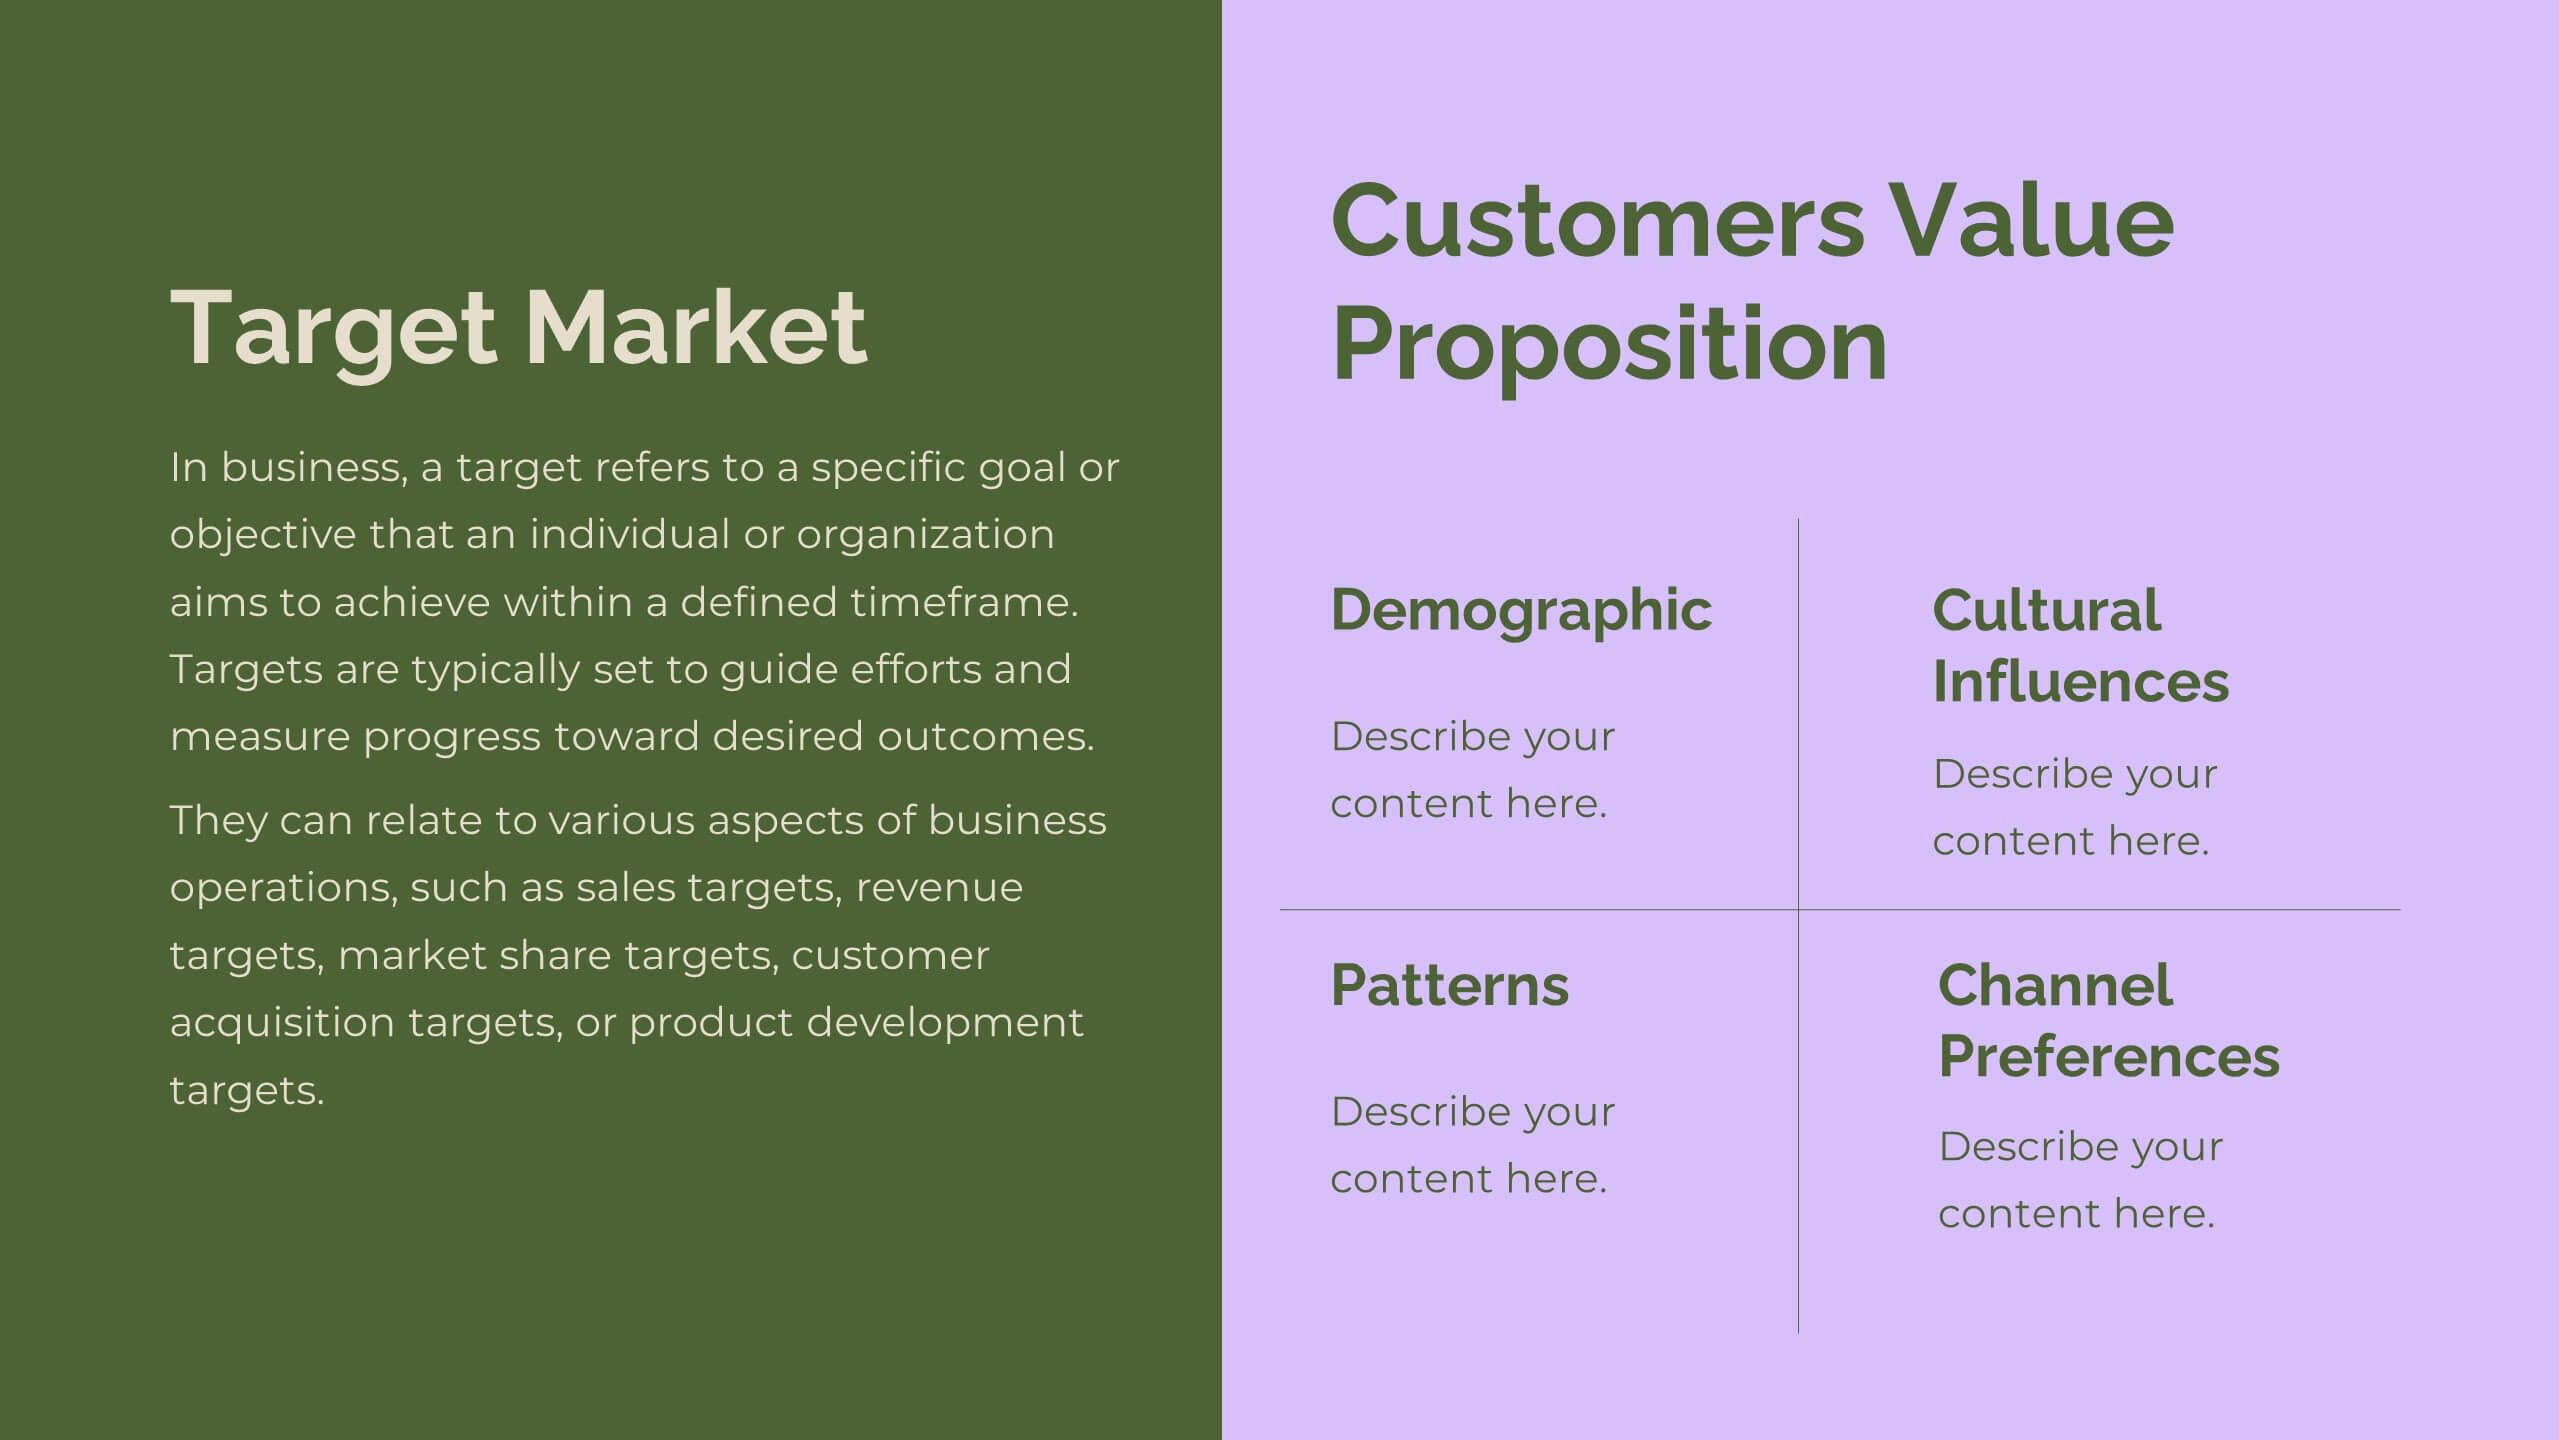
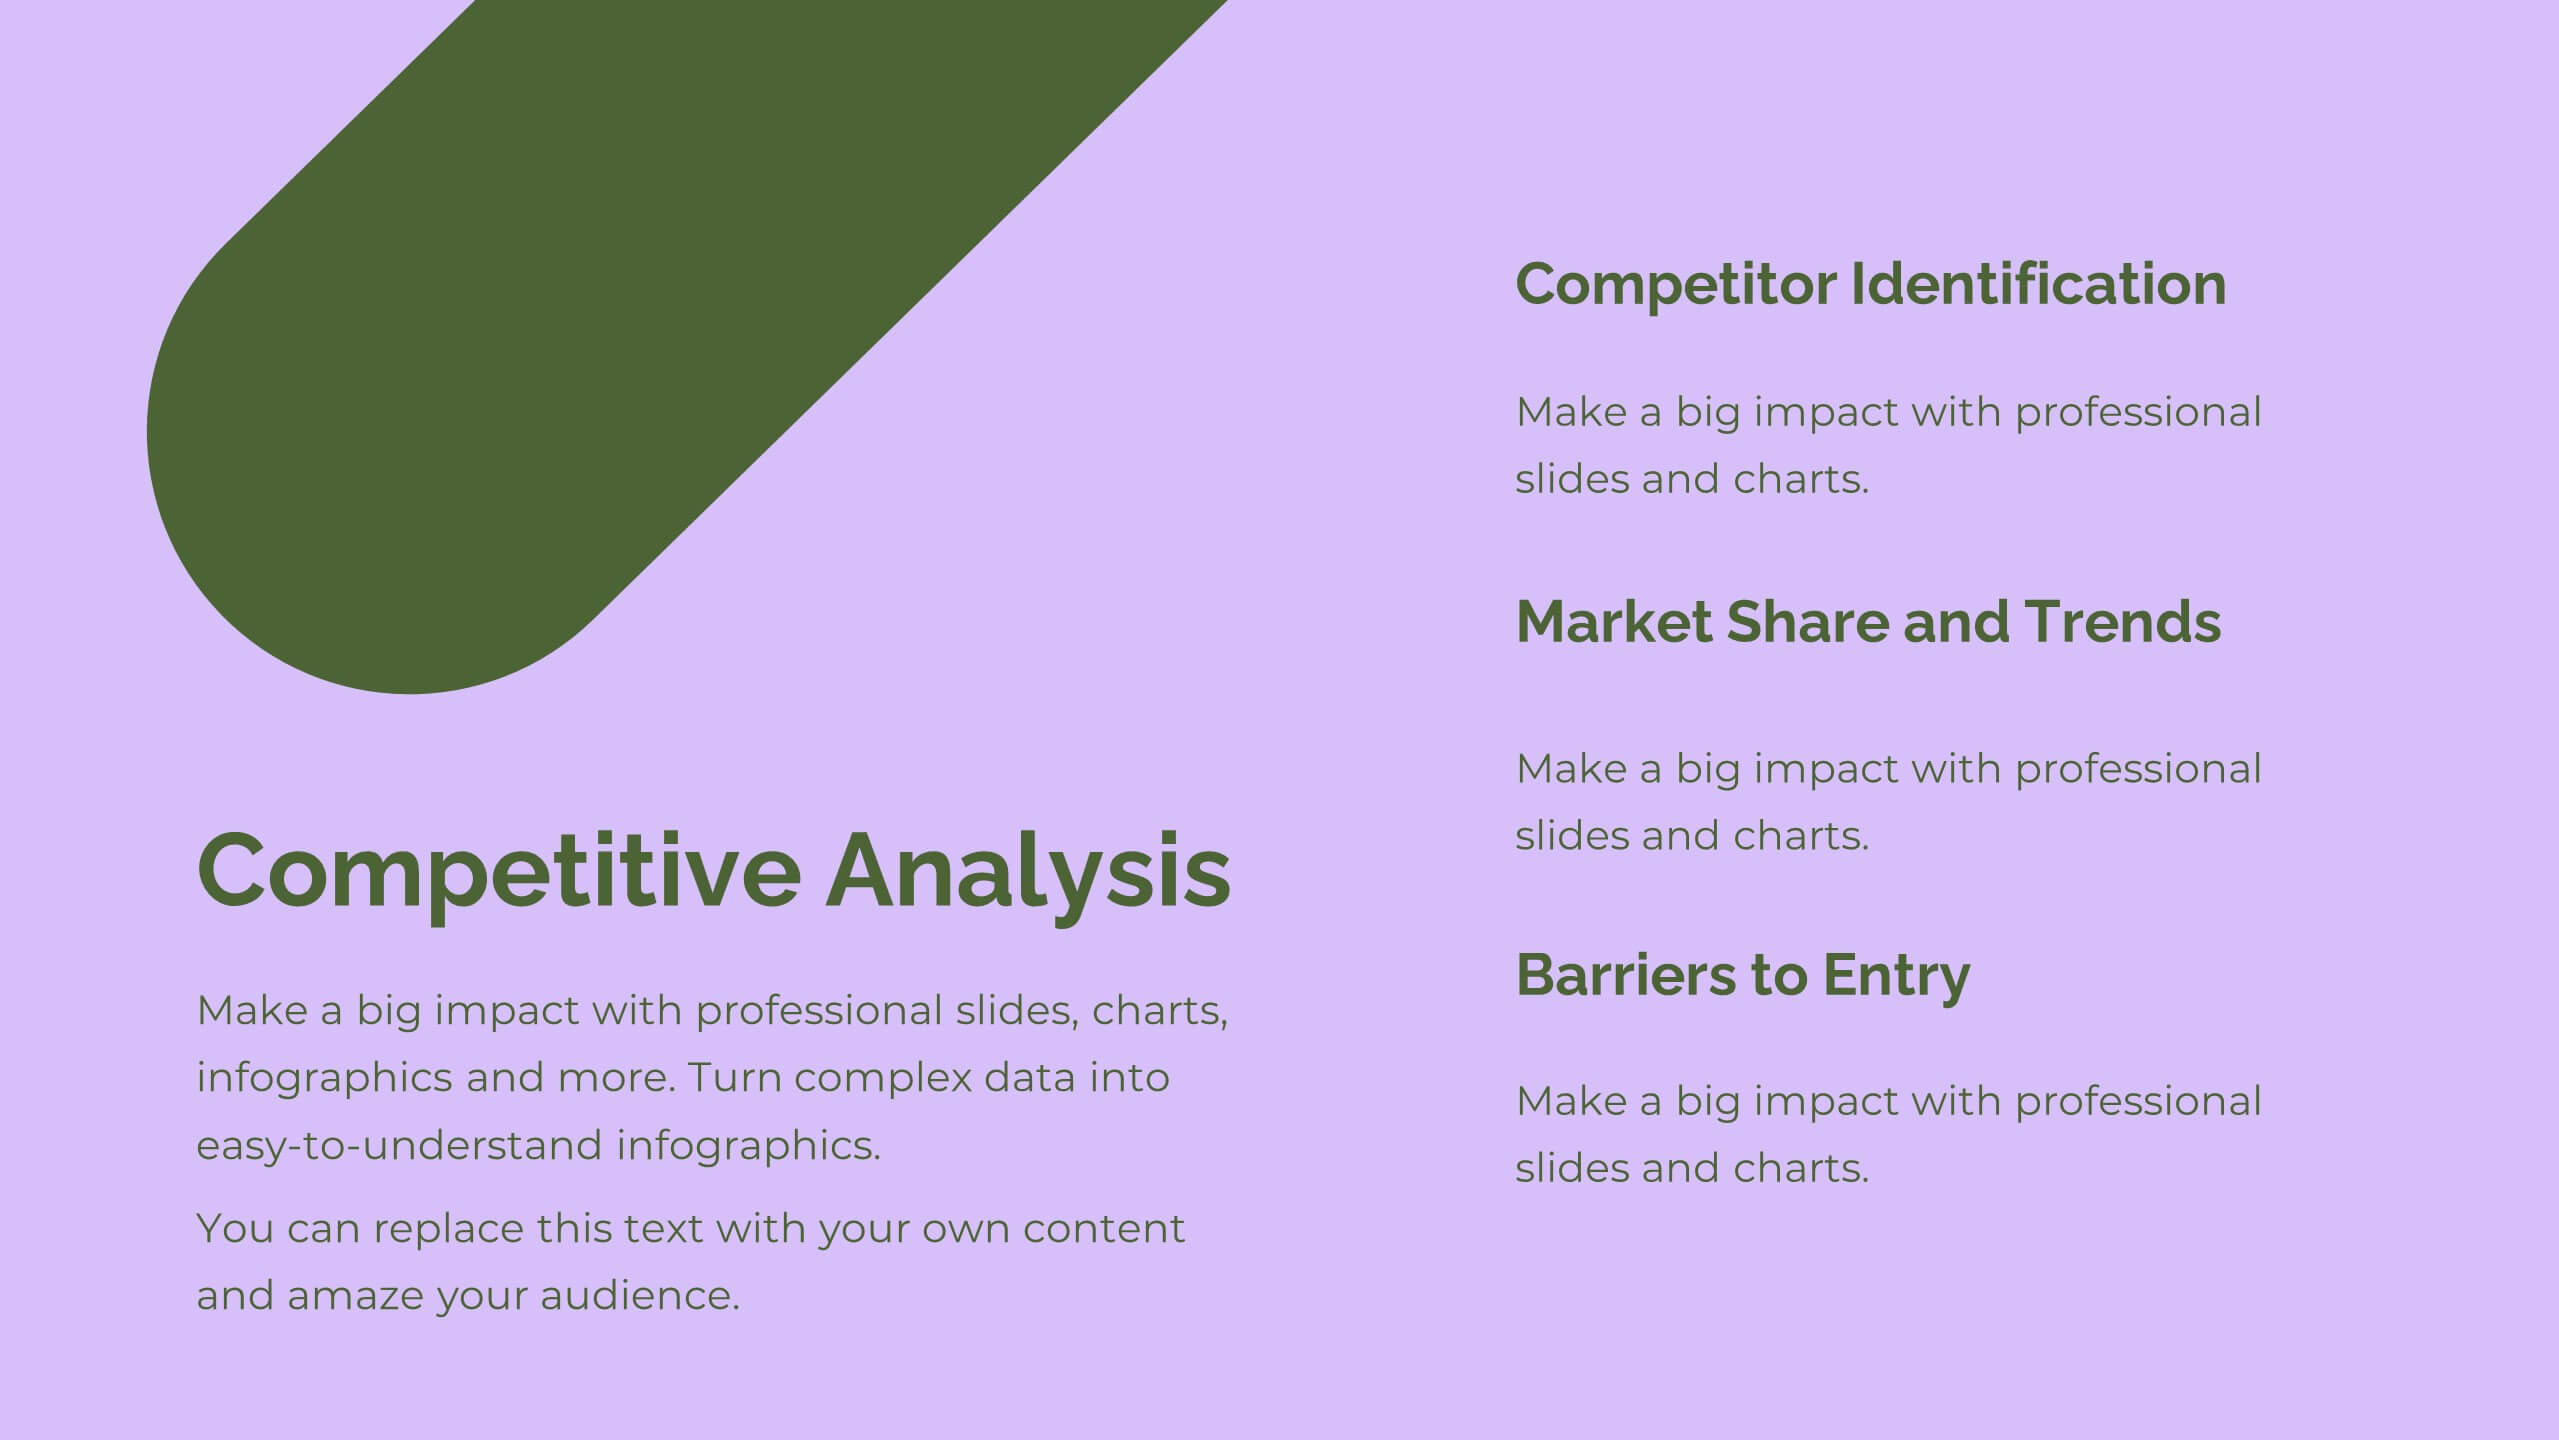
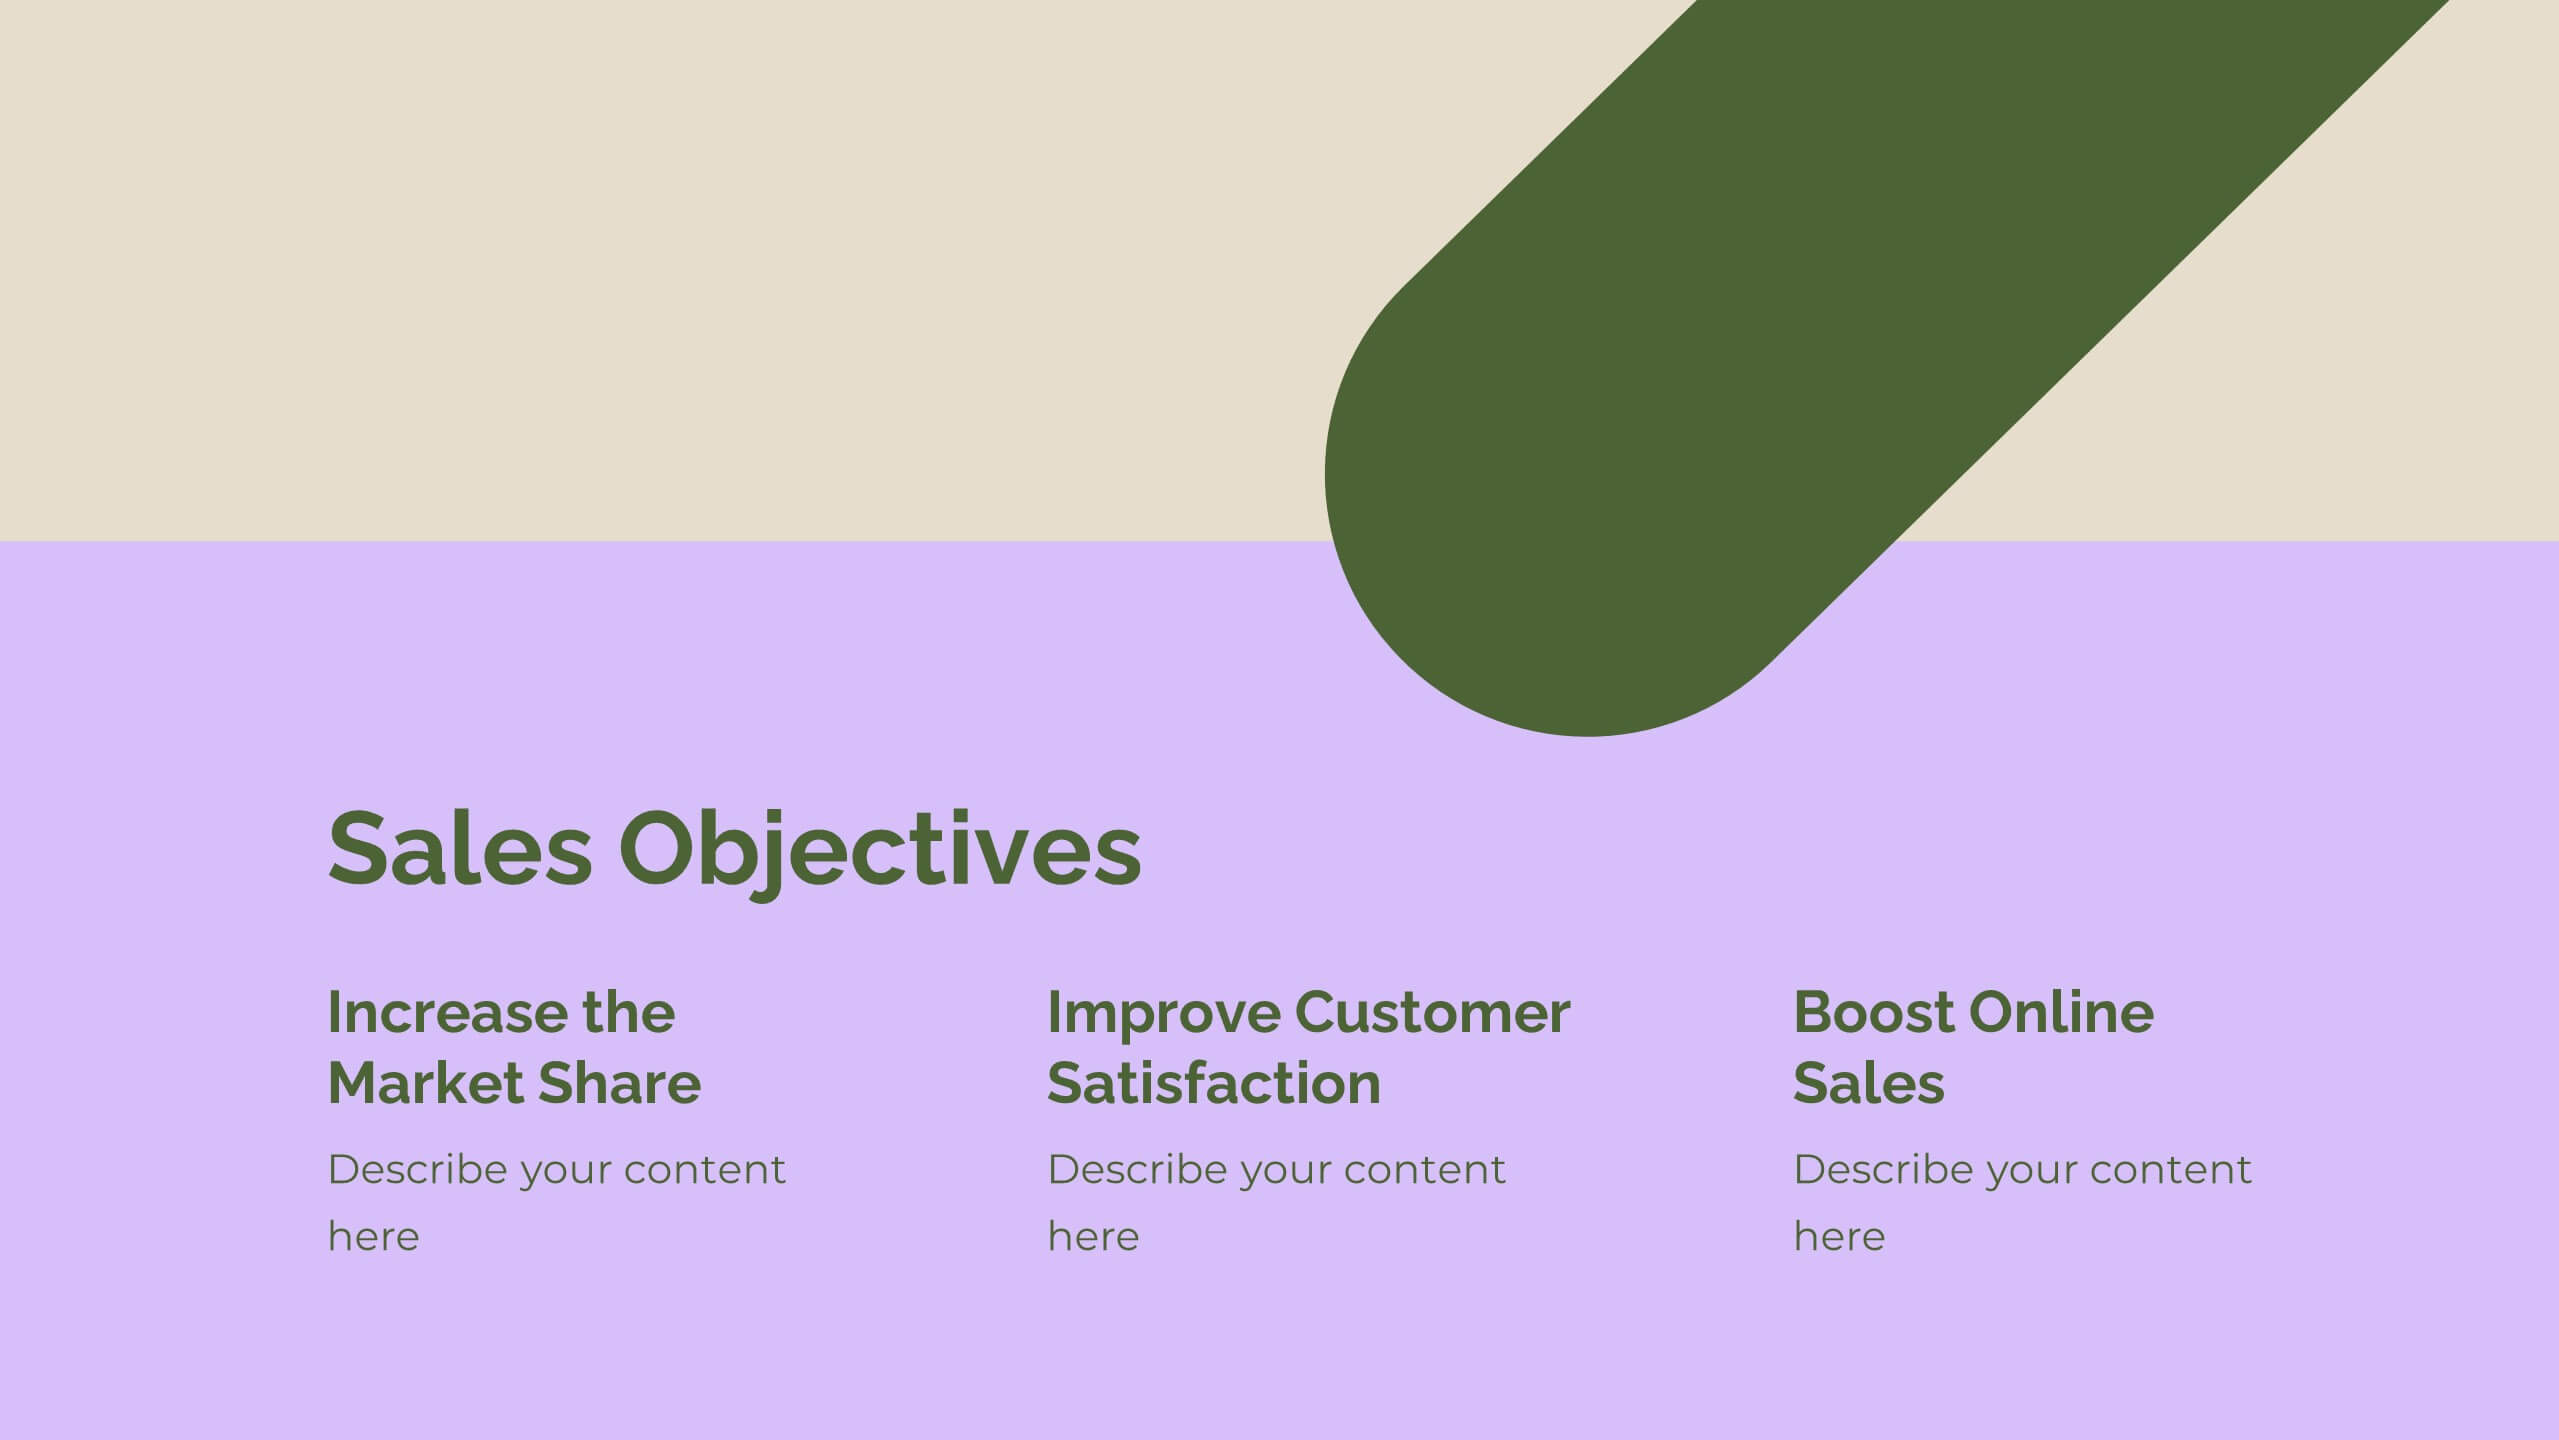
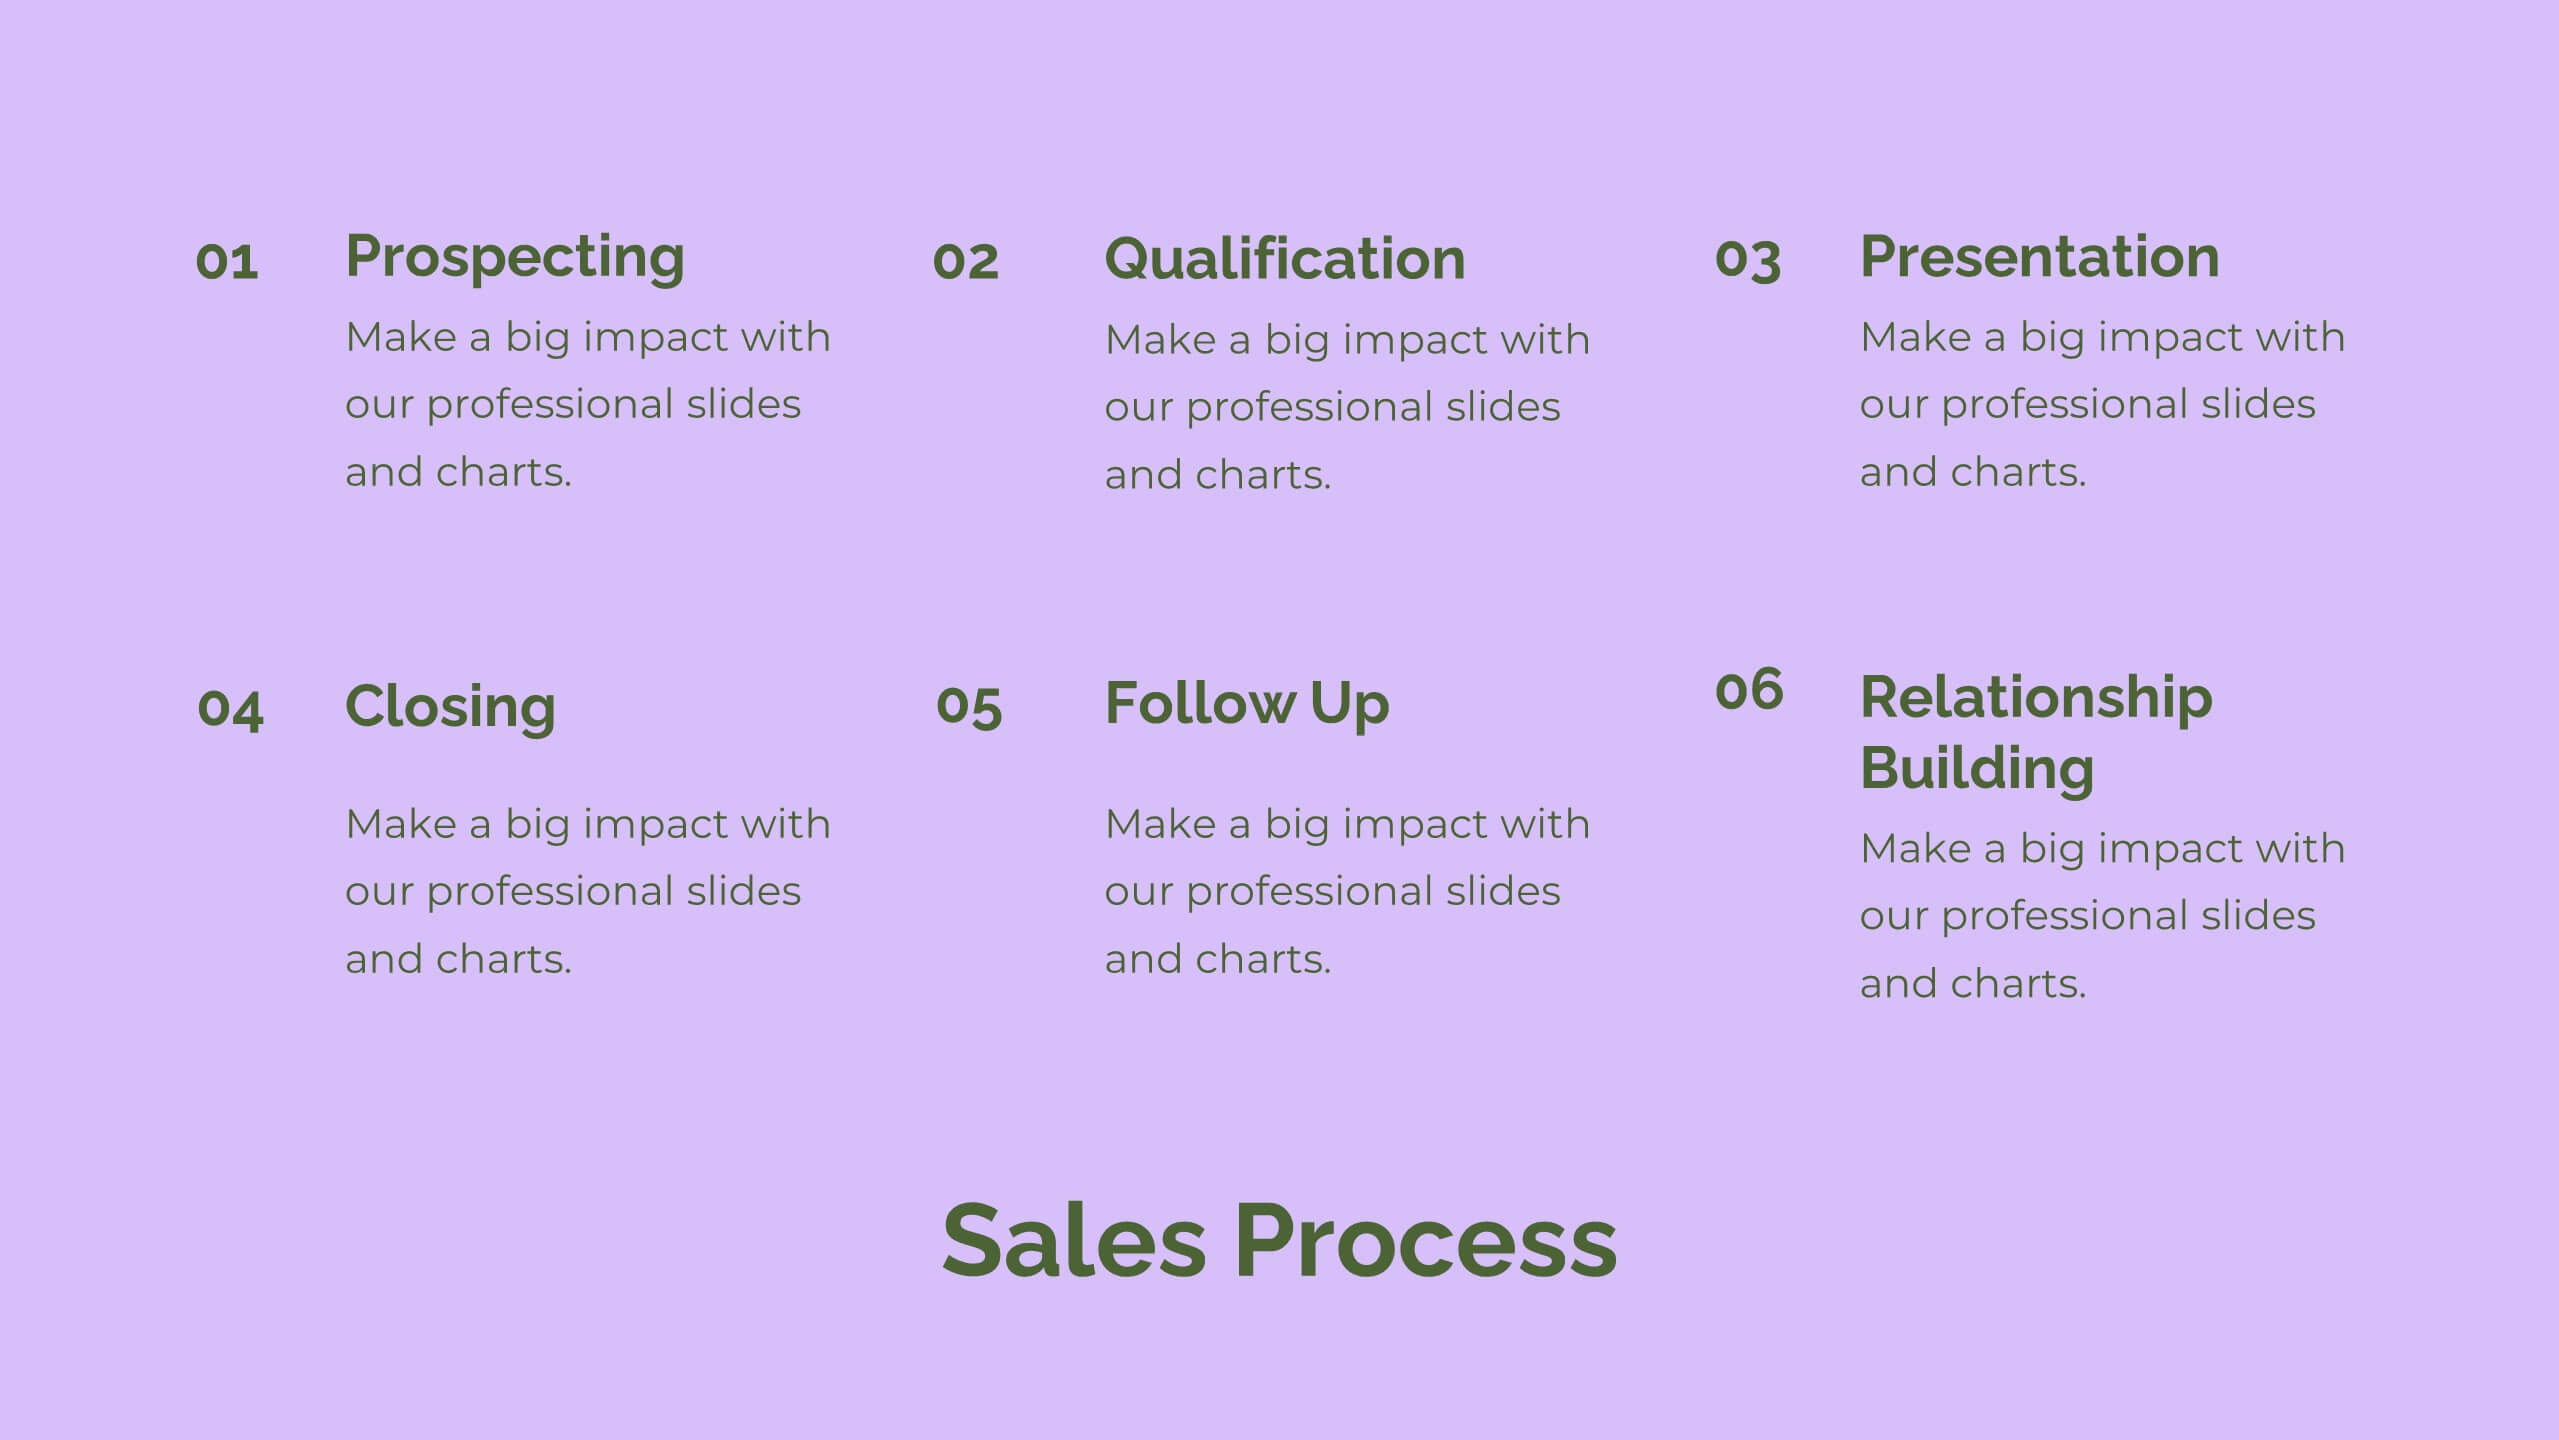
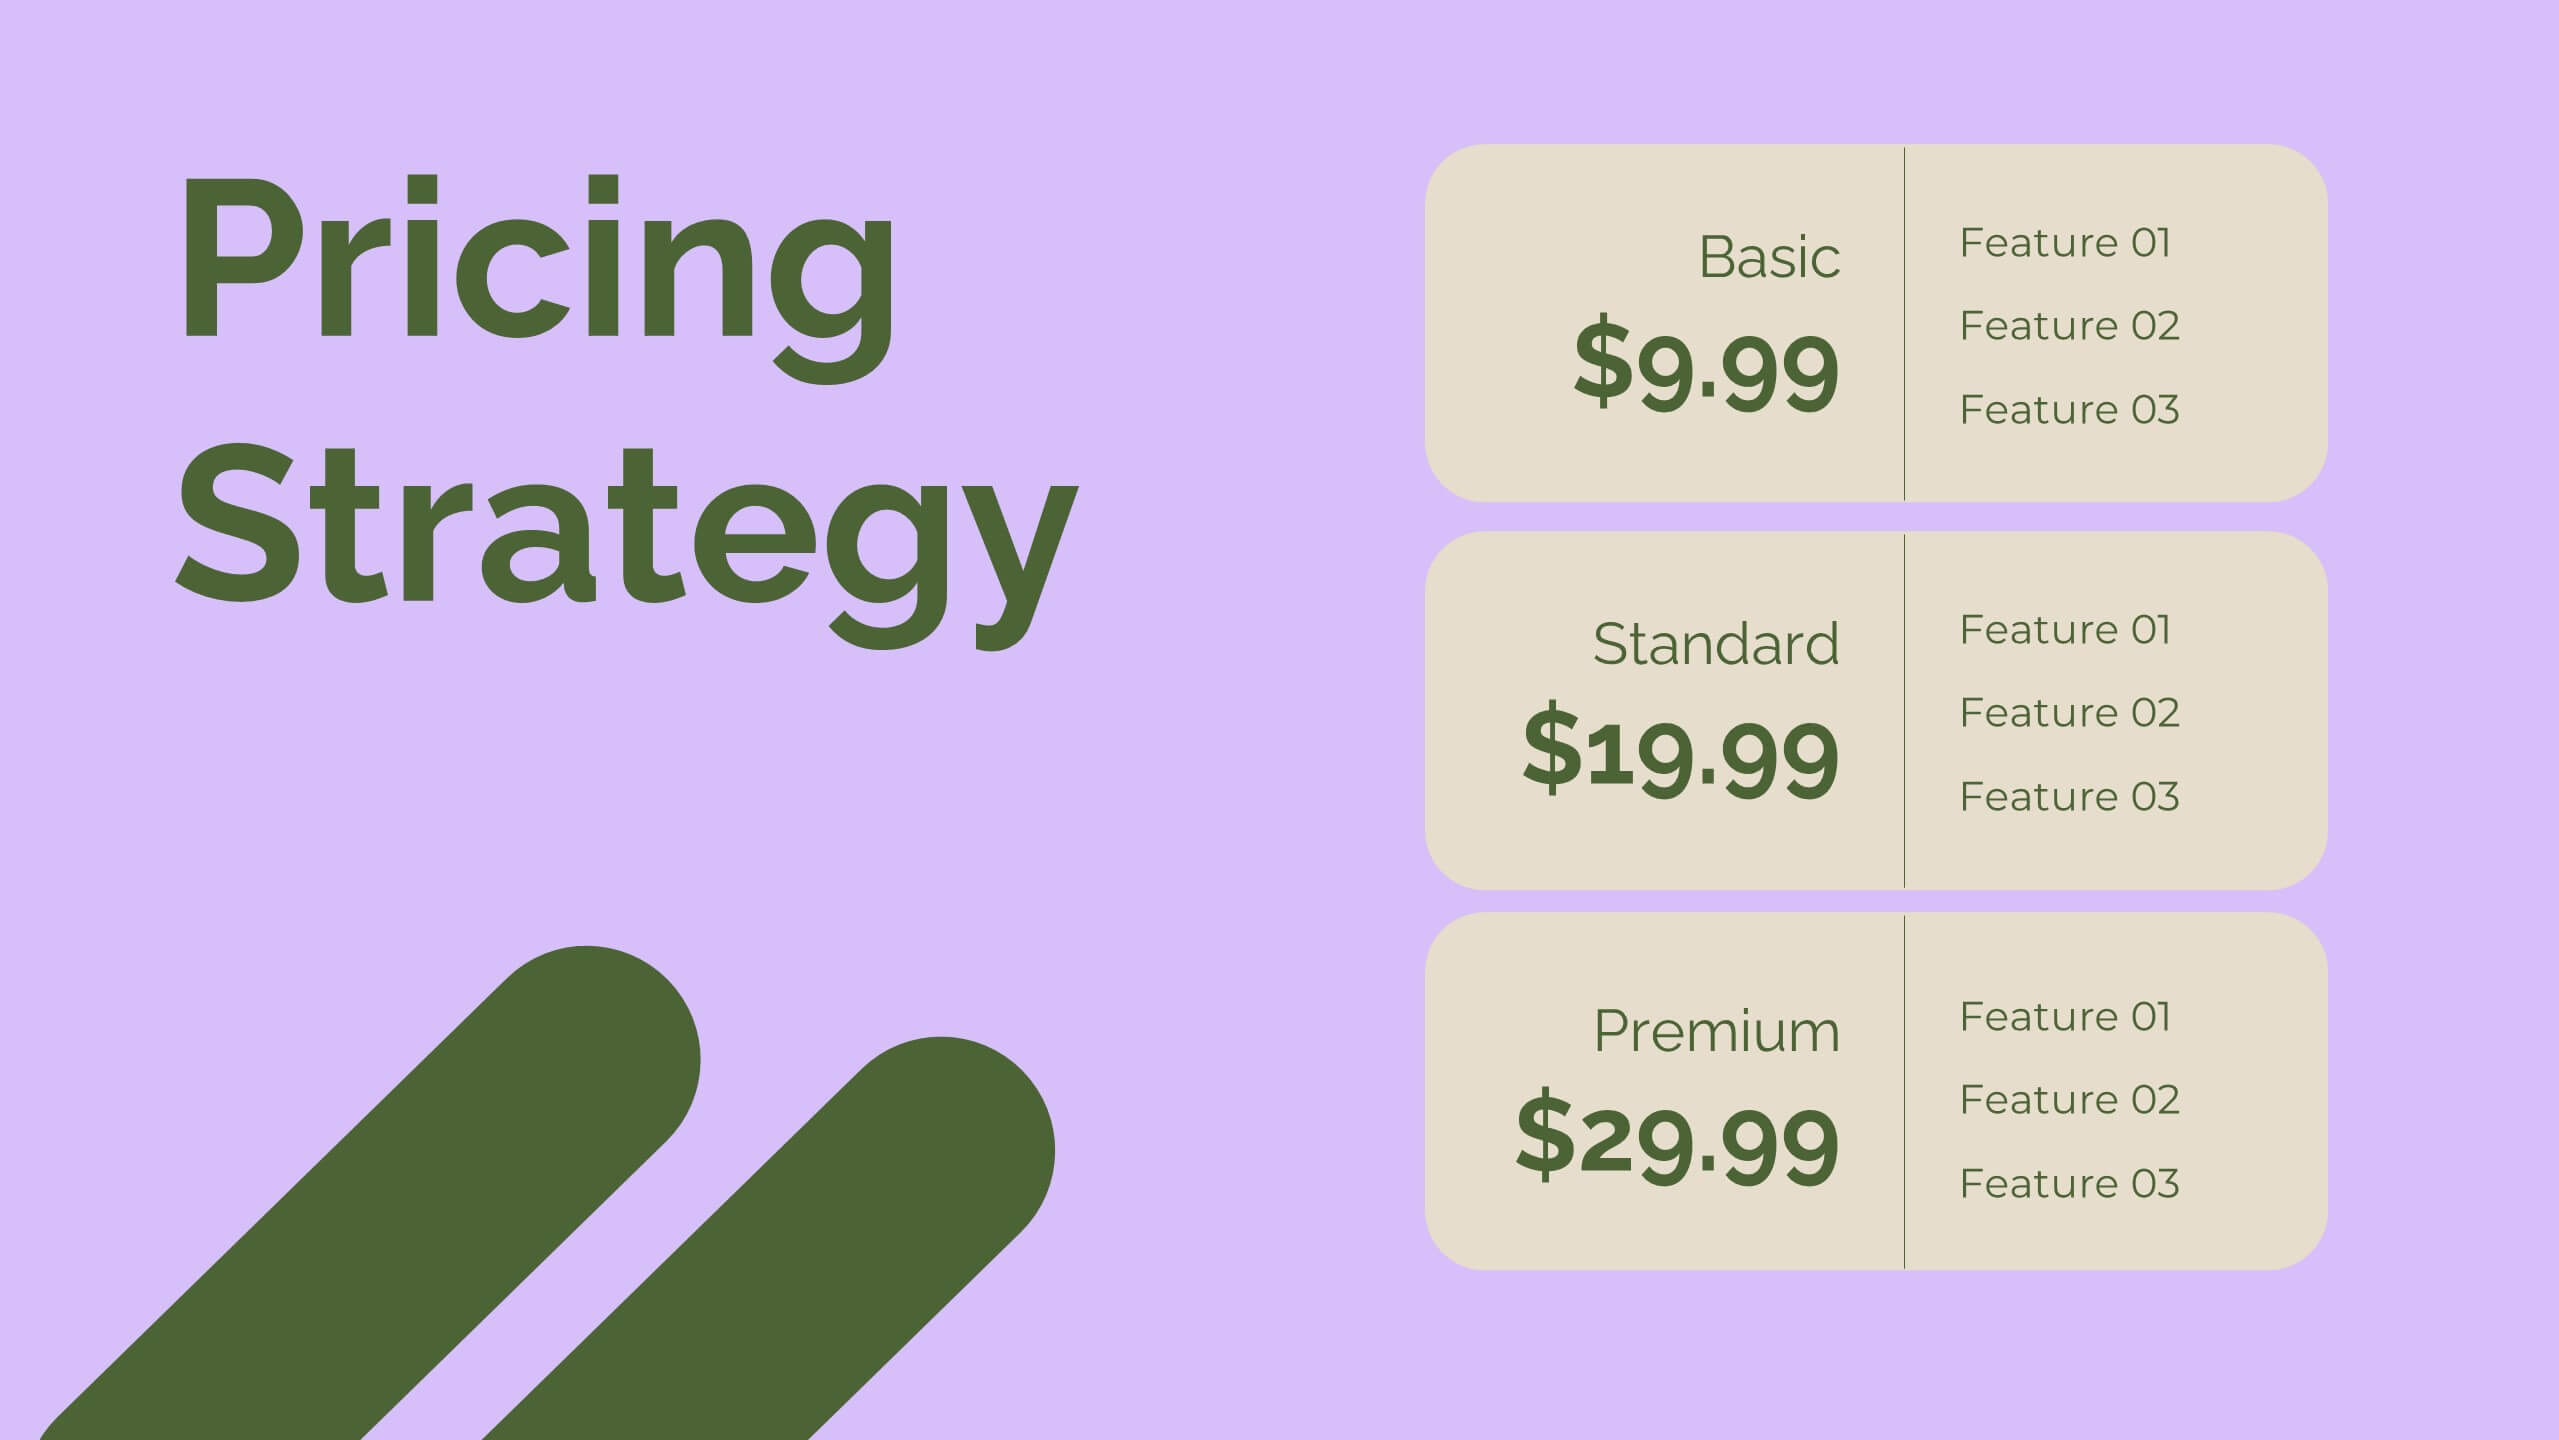
Glint Sales Strategy Presentation
Boost your sales performance with this dynamic sales strategy template! Perfect for presenting your company overview, product details, and competitive analysis, it includes slides for sales objectives, pricing strategy, and performance metrics. Engage your team with vibrant visuals and clear, structured content. Compatible with PowerPoint, Keynote, and Google Slides for seamless presentations on any platform.


5 diapositivas
Flow Chart for Decision Trees
Clarify complex decisions with the Flow Chart for Decision Trees Presentation. This layout uses a vertical tree design with branching logic paths, making it perfect for outlining strategic choices, workflows, or evaluation criteria. Featuring five customizable sections with icon support and placeholder text, this template works seamlessly in PowerPoint, Keynote, and Google Slides.


4 diapositivas
Interlocking Puzzle Chart Design Presentation
Unlock big ideas with a visual design that clicks your concepts together like a seamless 3D puzzle. This presentation makes it easy to explain connected processes, relationships, or strategic components in a clean, engaging way. Perfect for business, planning, and team alignment. Fully compatible with PowerPoint, Keynote, and Google Slides.


6 diapositivas
Tables of Content Analysis Infographic
Table of Contents analysis refers to the examination and evaluation of the structure and content of a document's table of contents. It is commonly used as a preliminary step to understand the flow of information within a longer document, such as a book, report, thesis, or research paper. This infographic template provides insights into the document's structure and can help readers determine whether the document is relevant to their needs. This infographic is designed to provide a quick overview of the topics covered in the document and their distribution, helping readers understand the organization of the content at a glance.

20 diapositivas
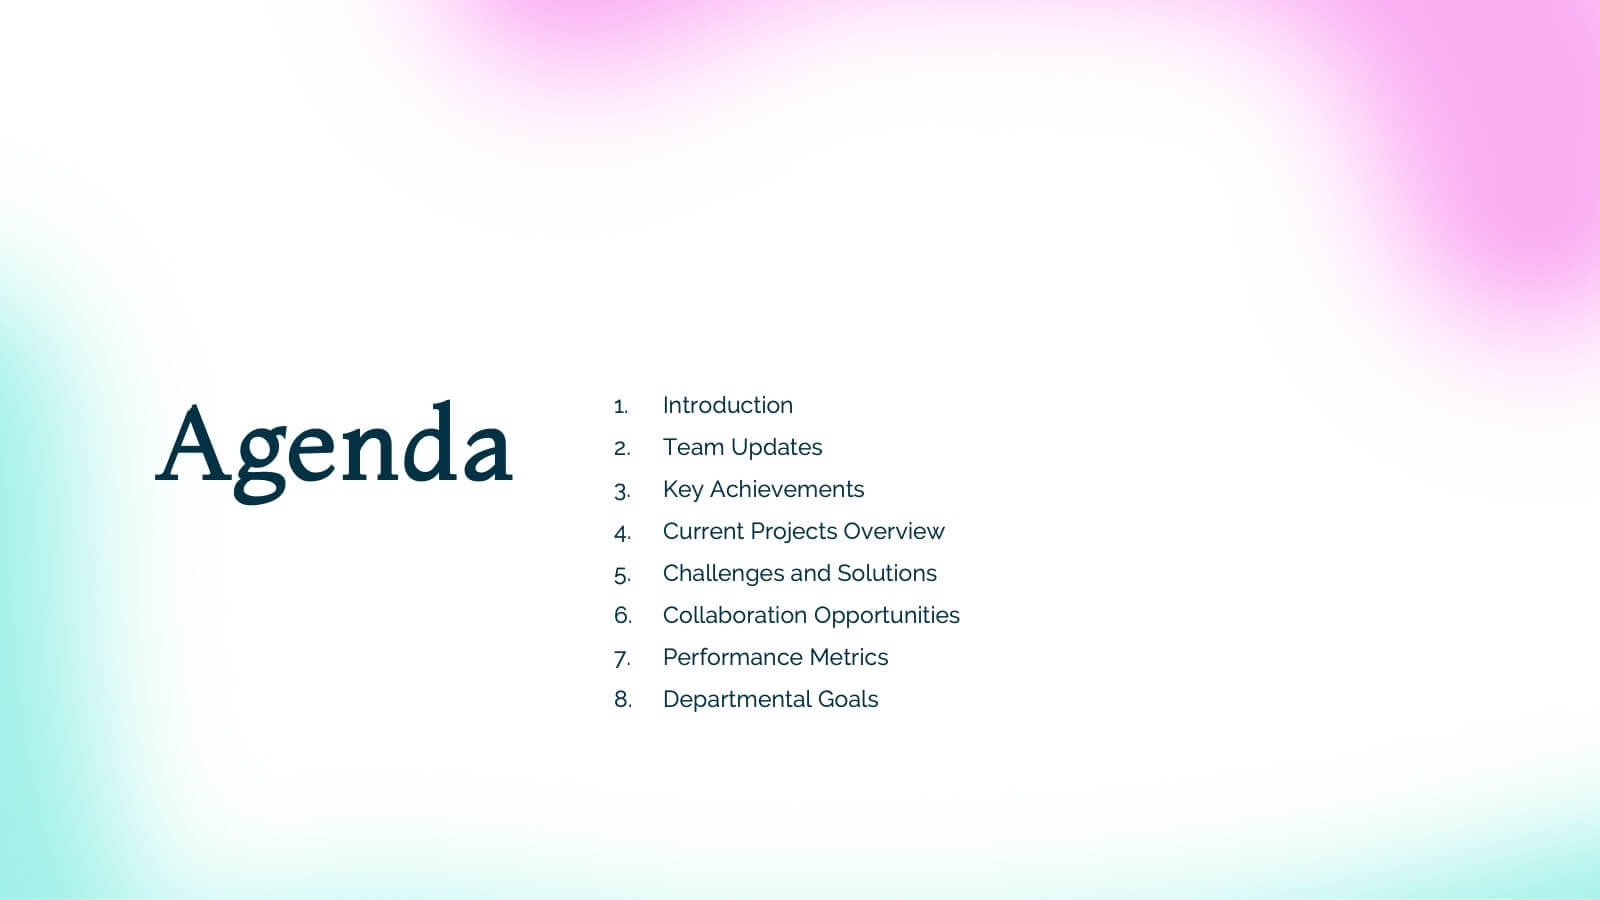
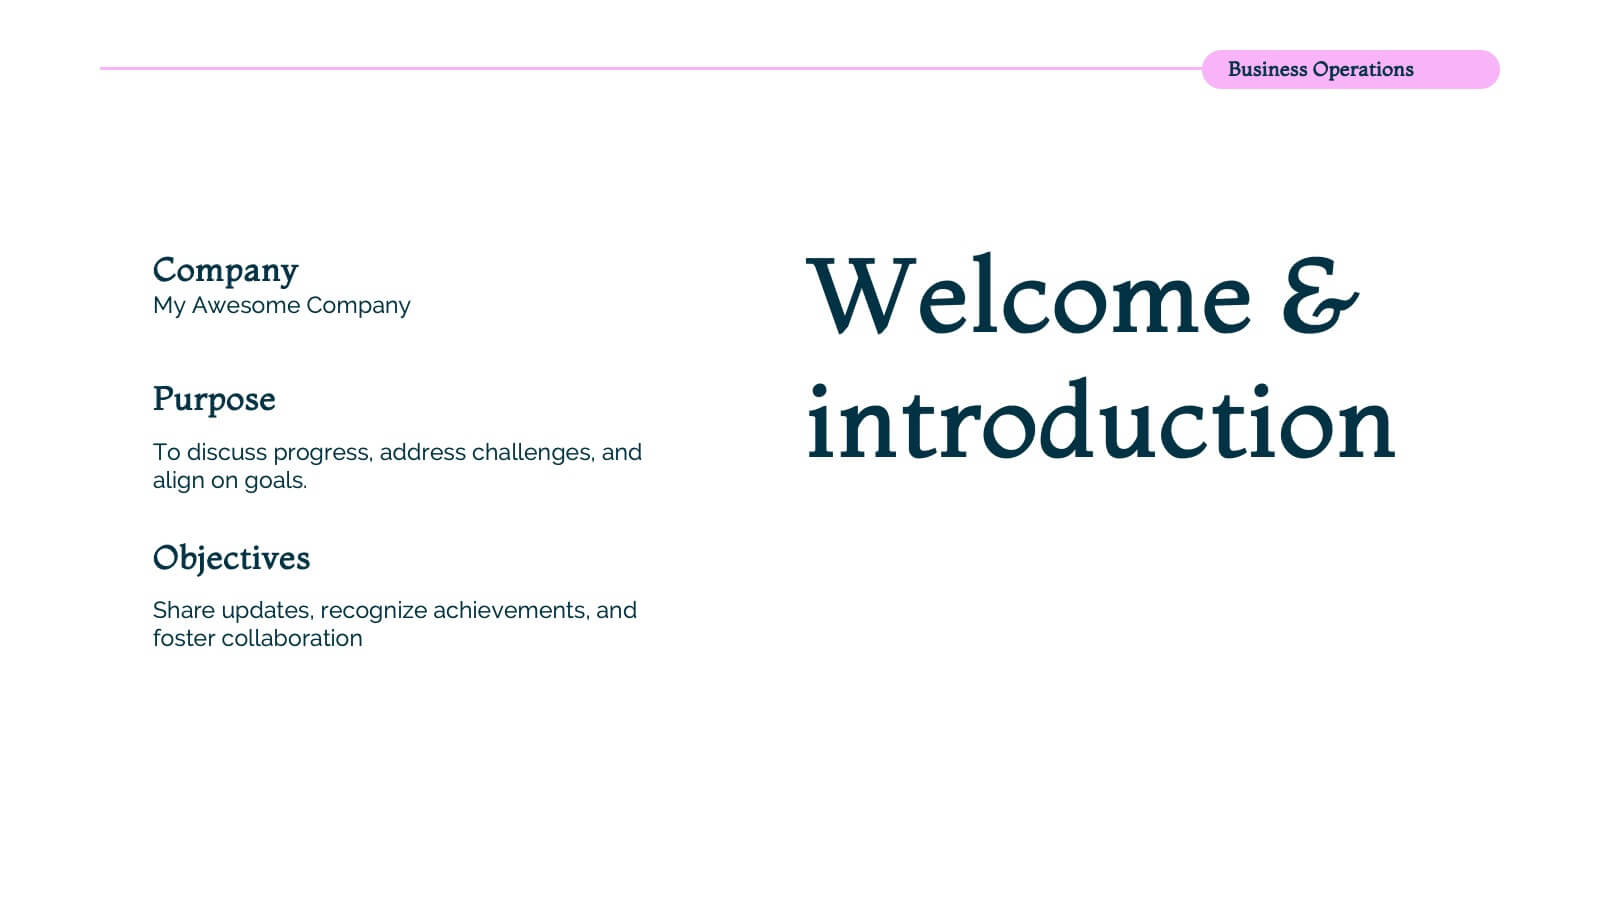
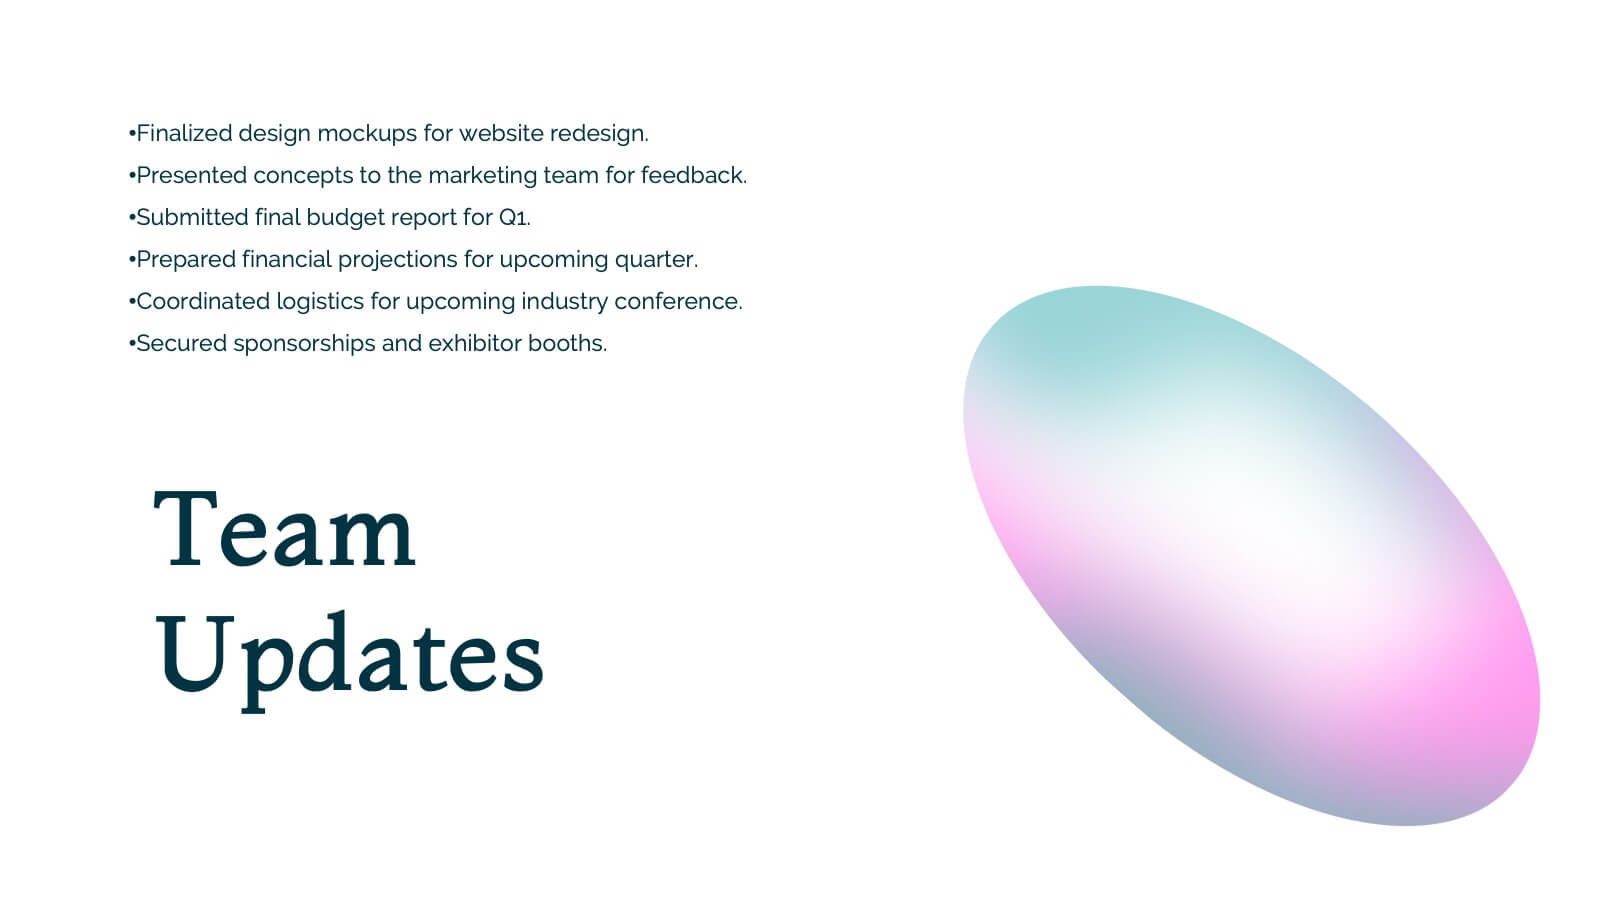
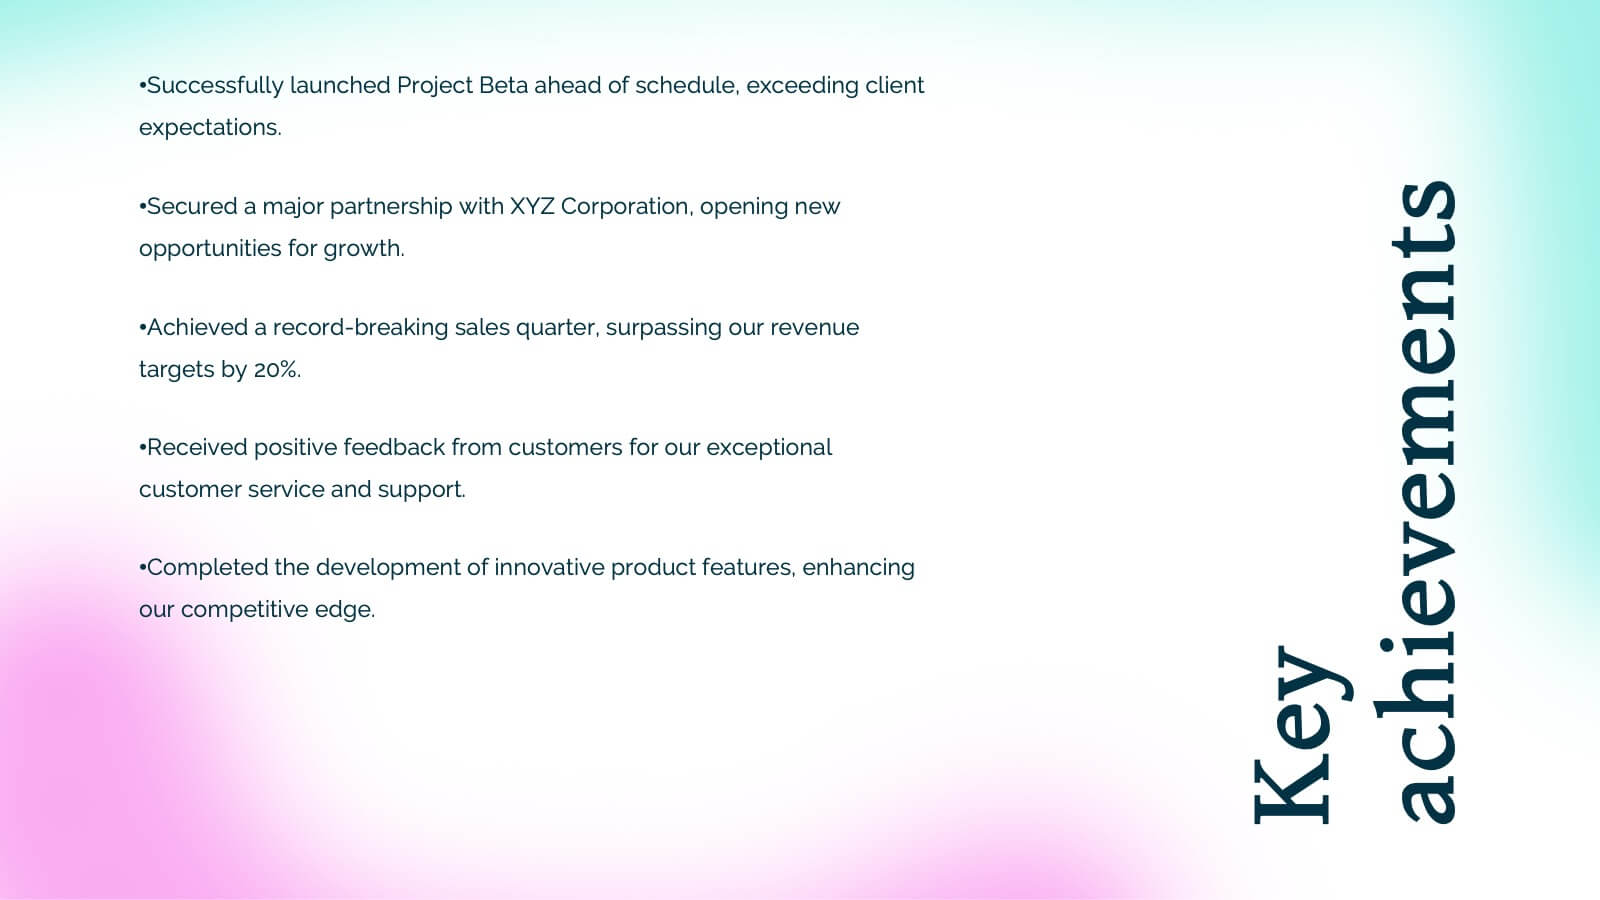
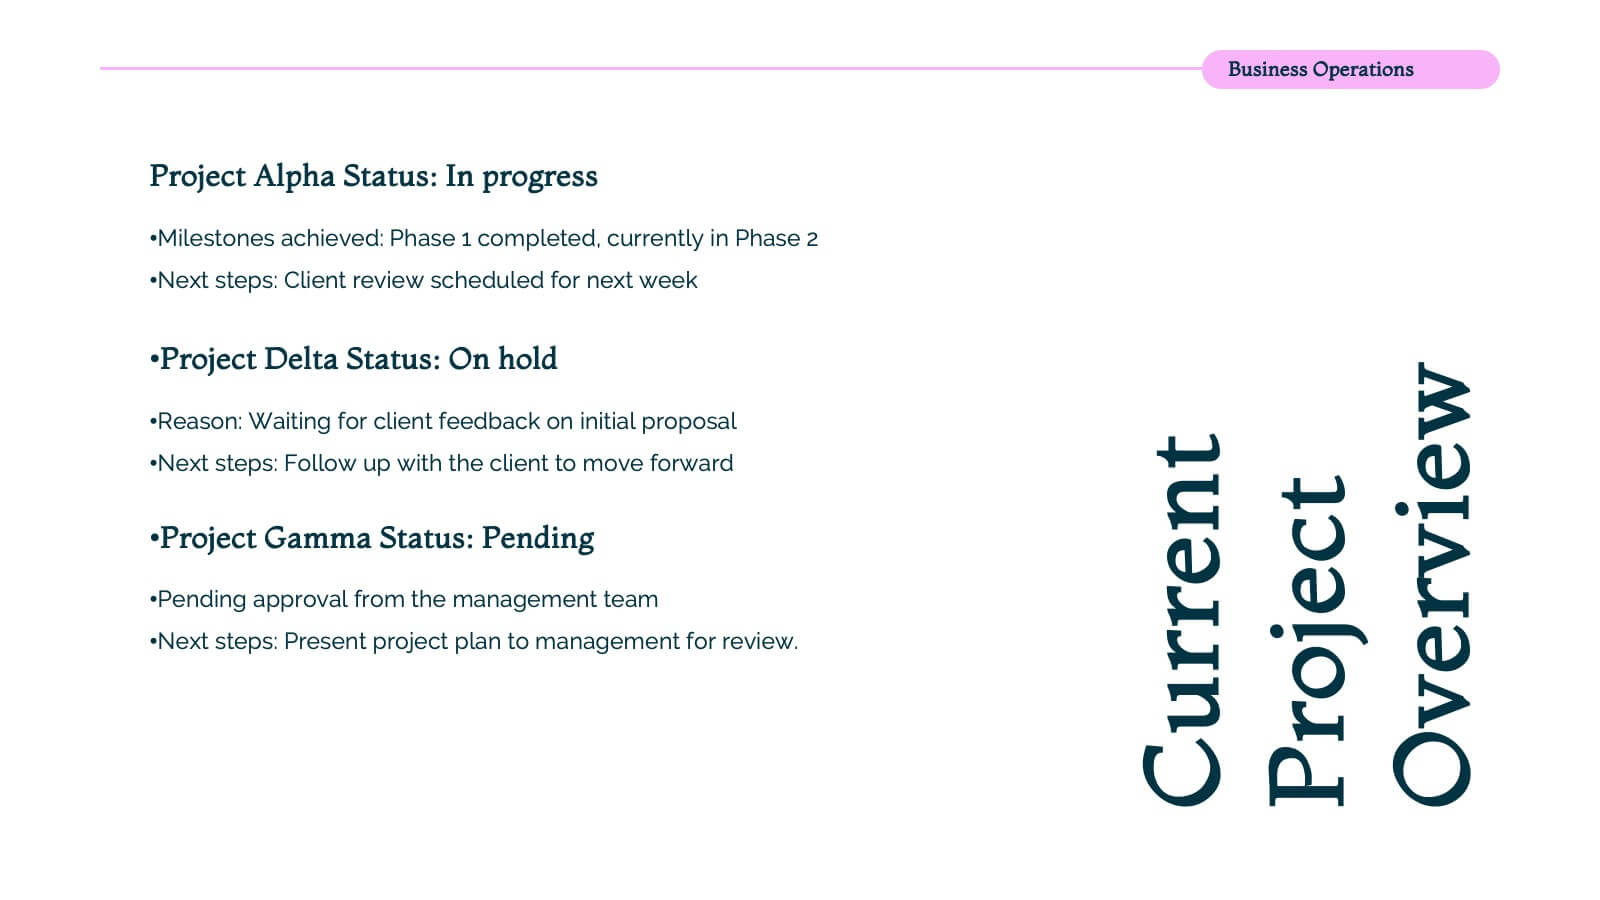
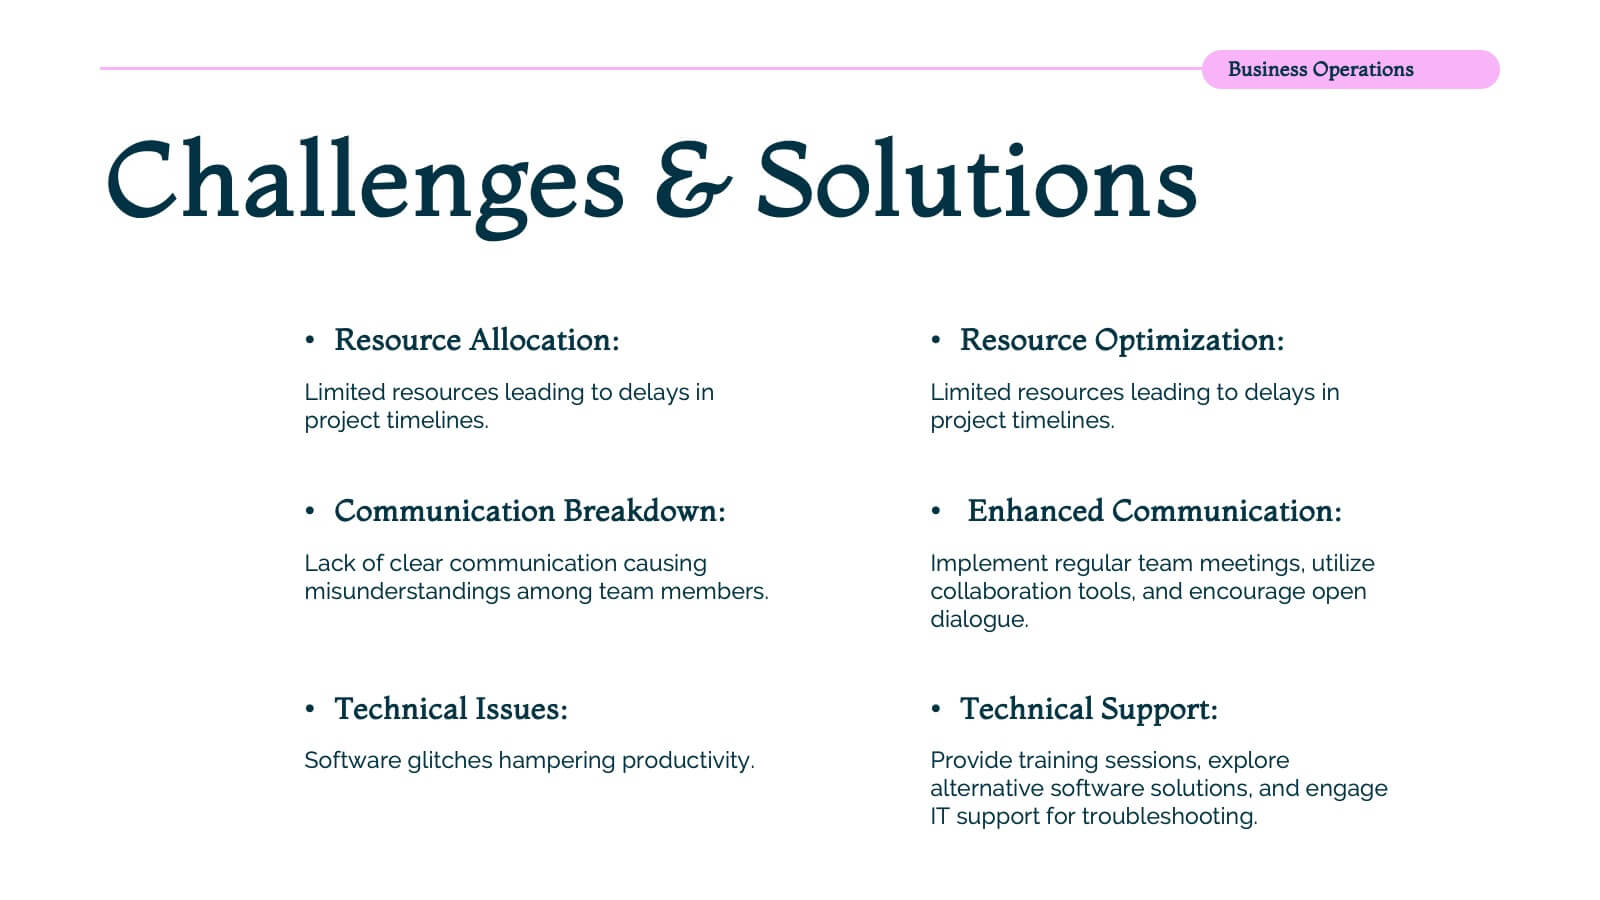
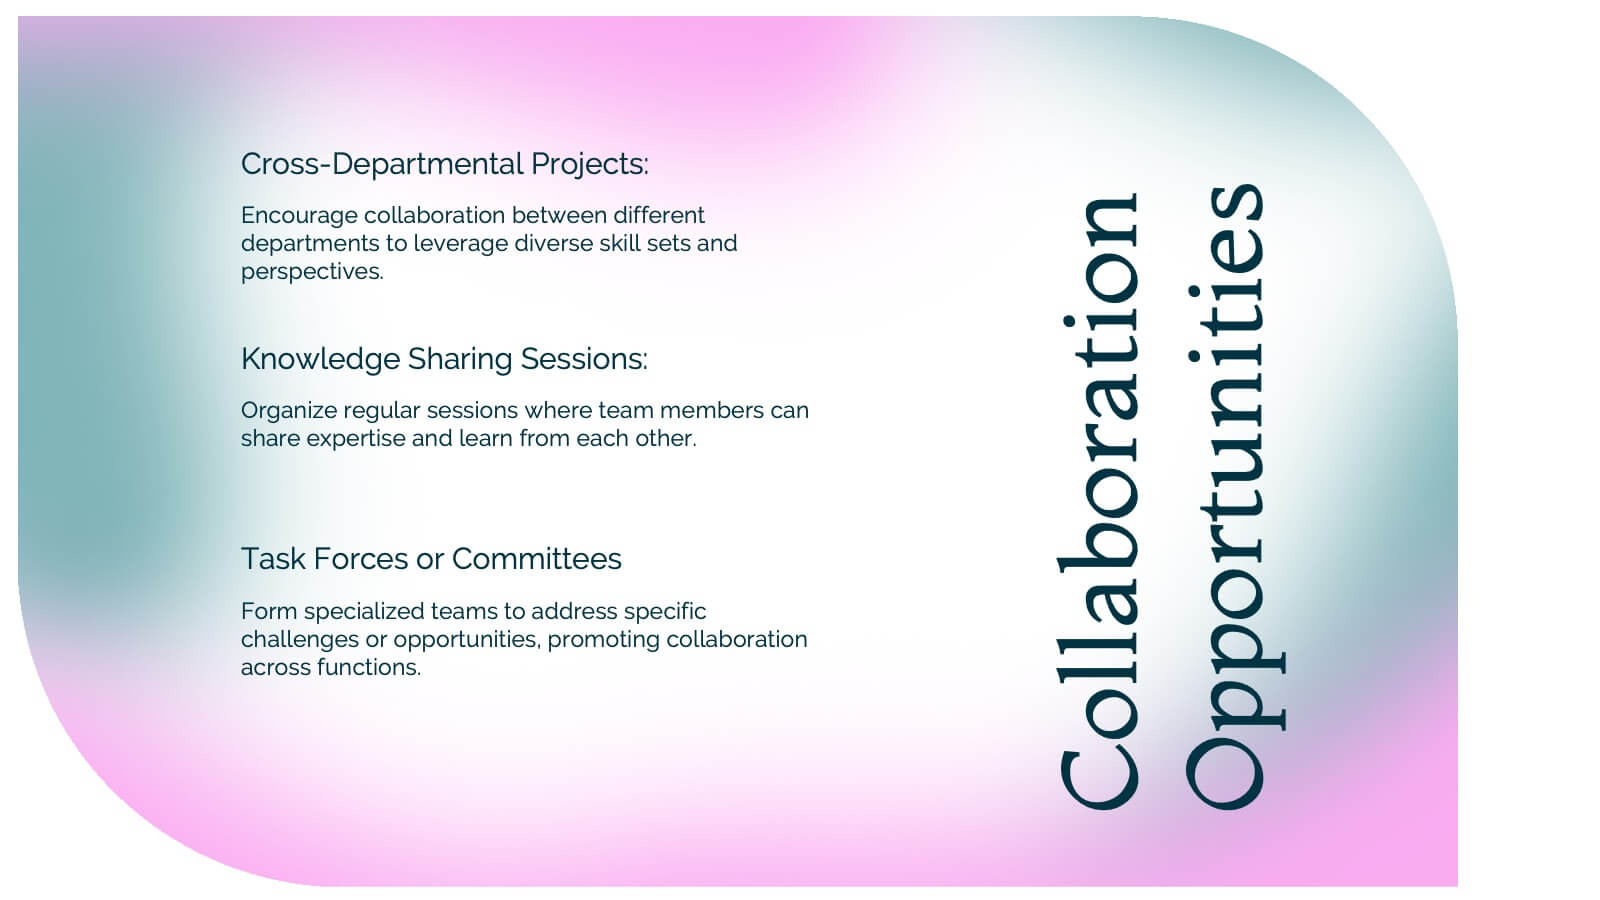
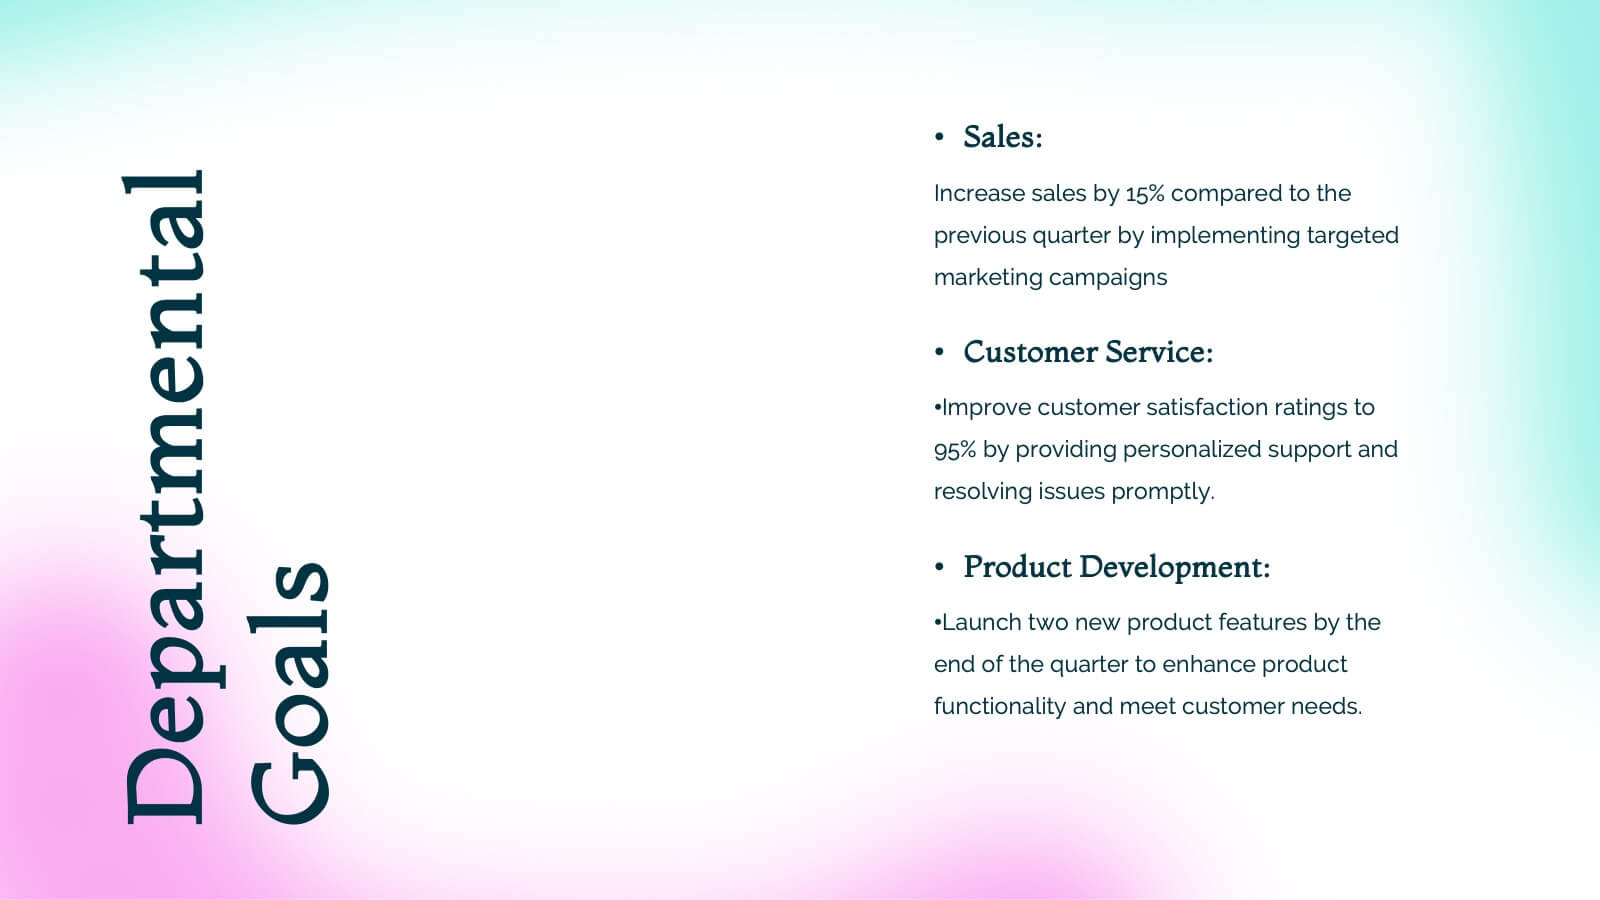
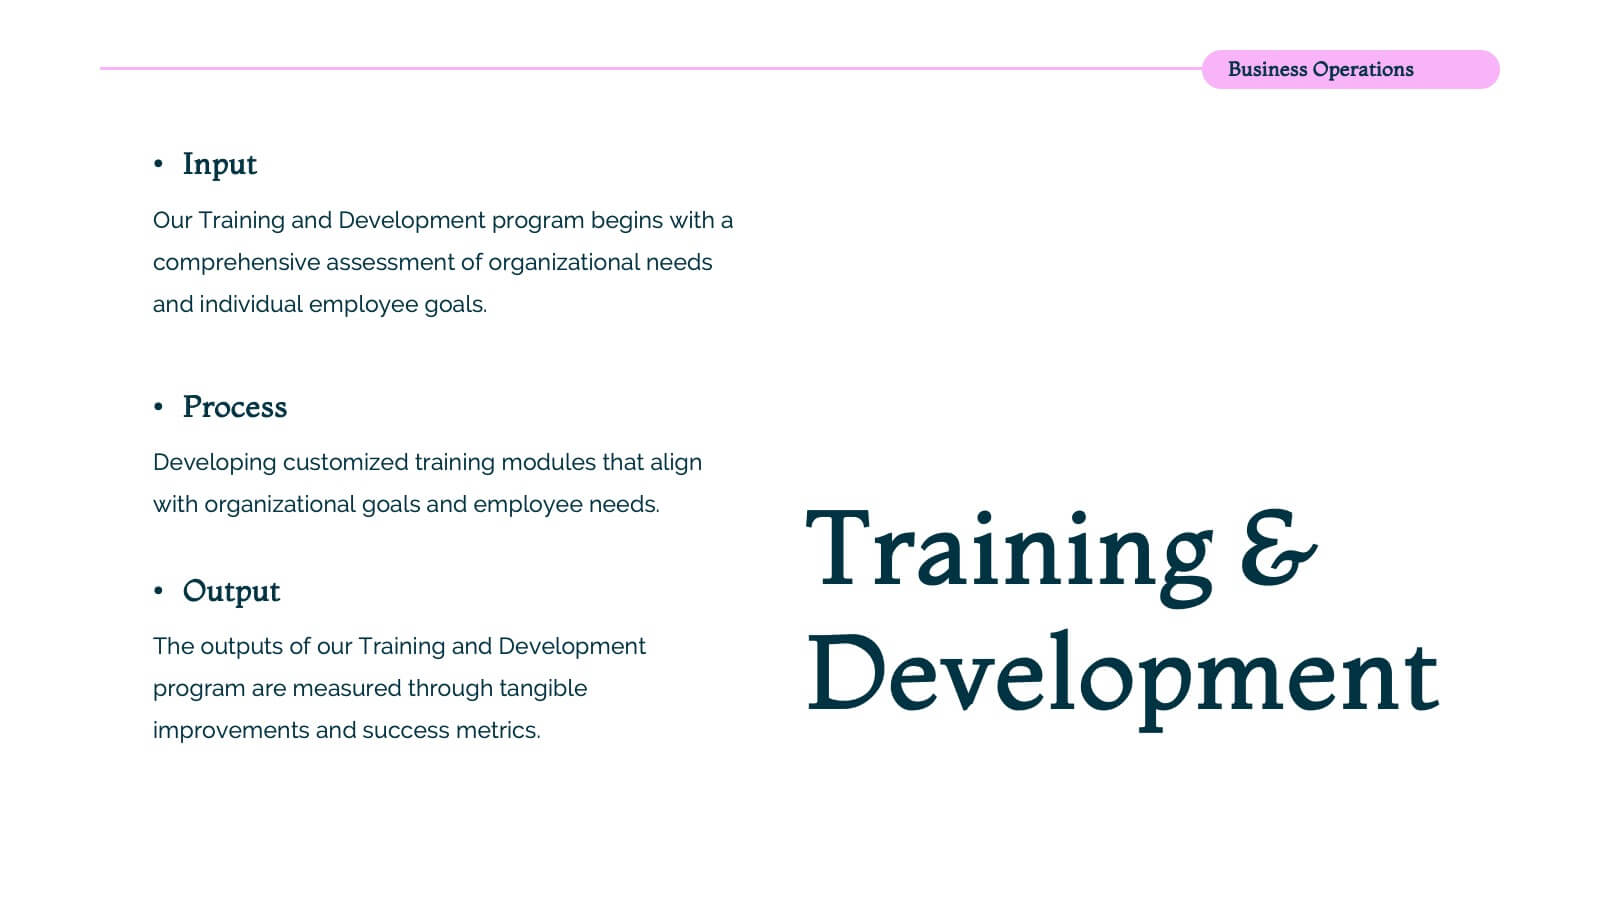
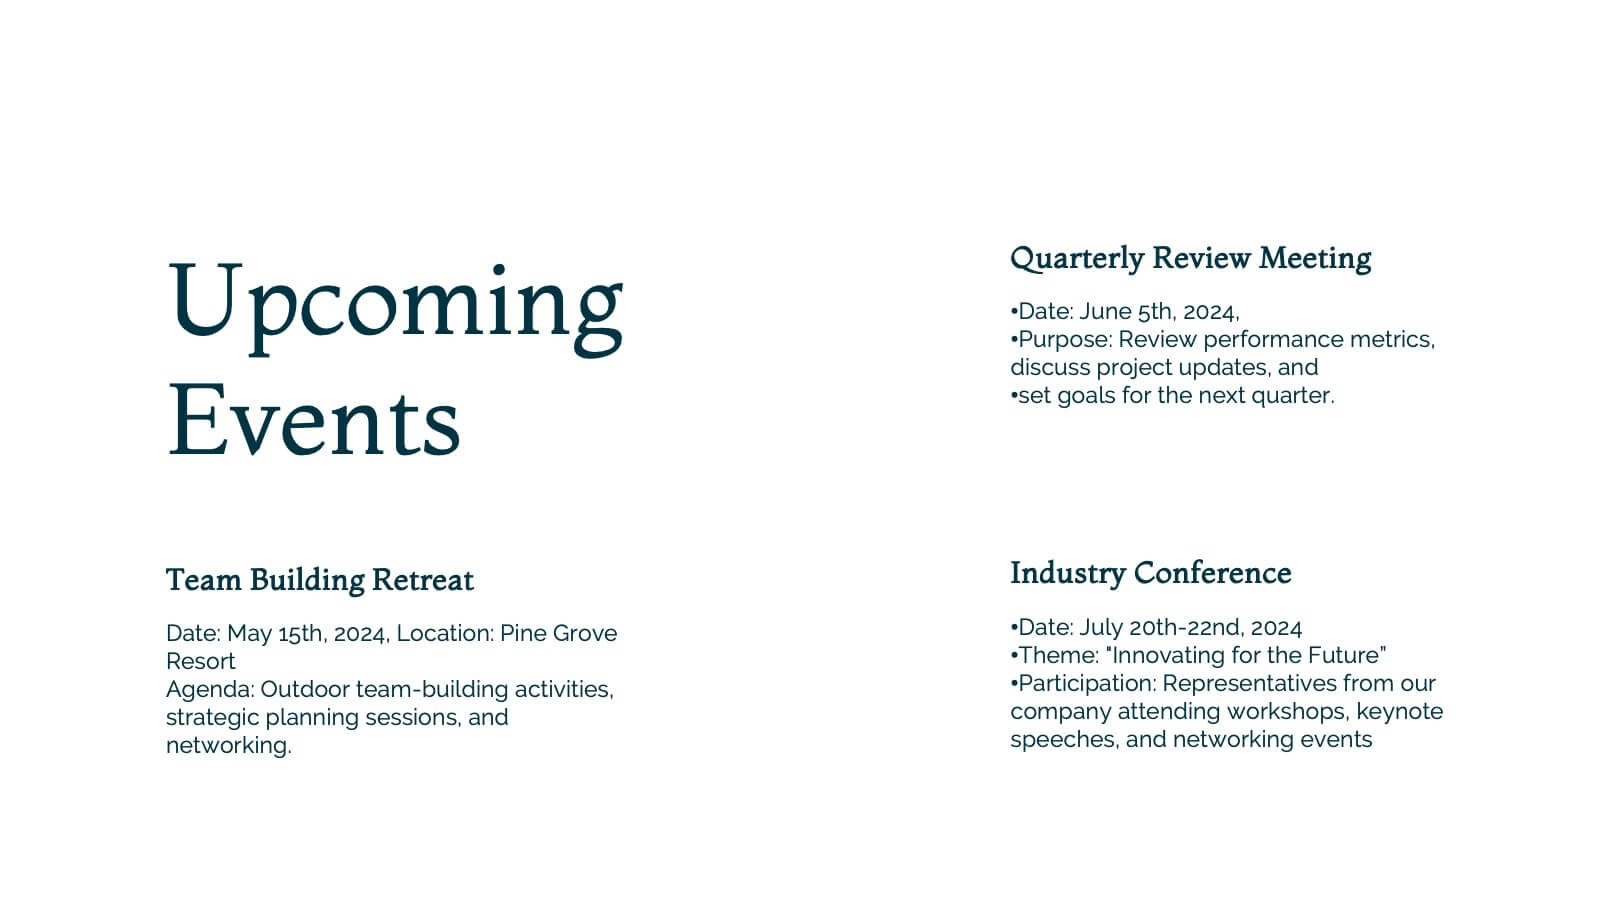
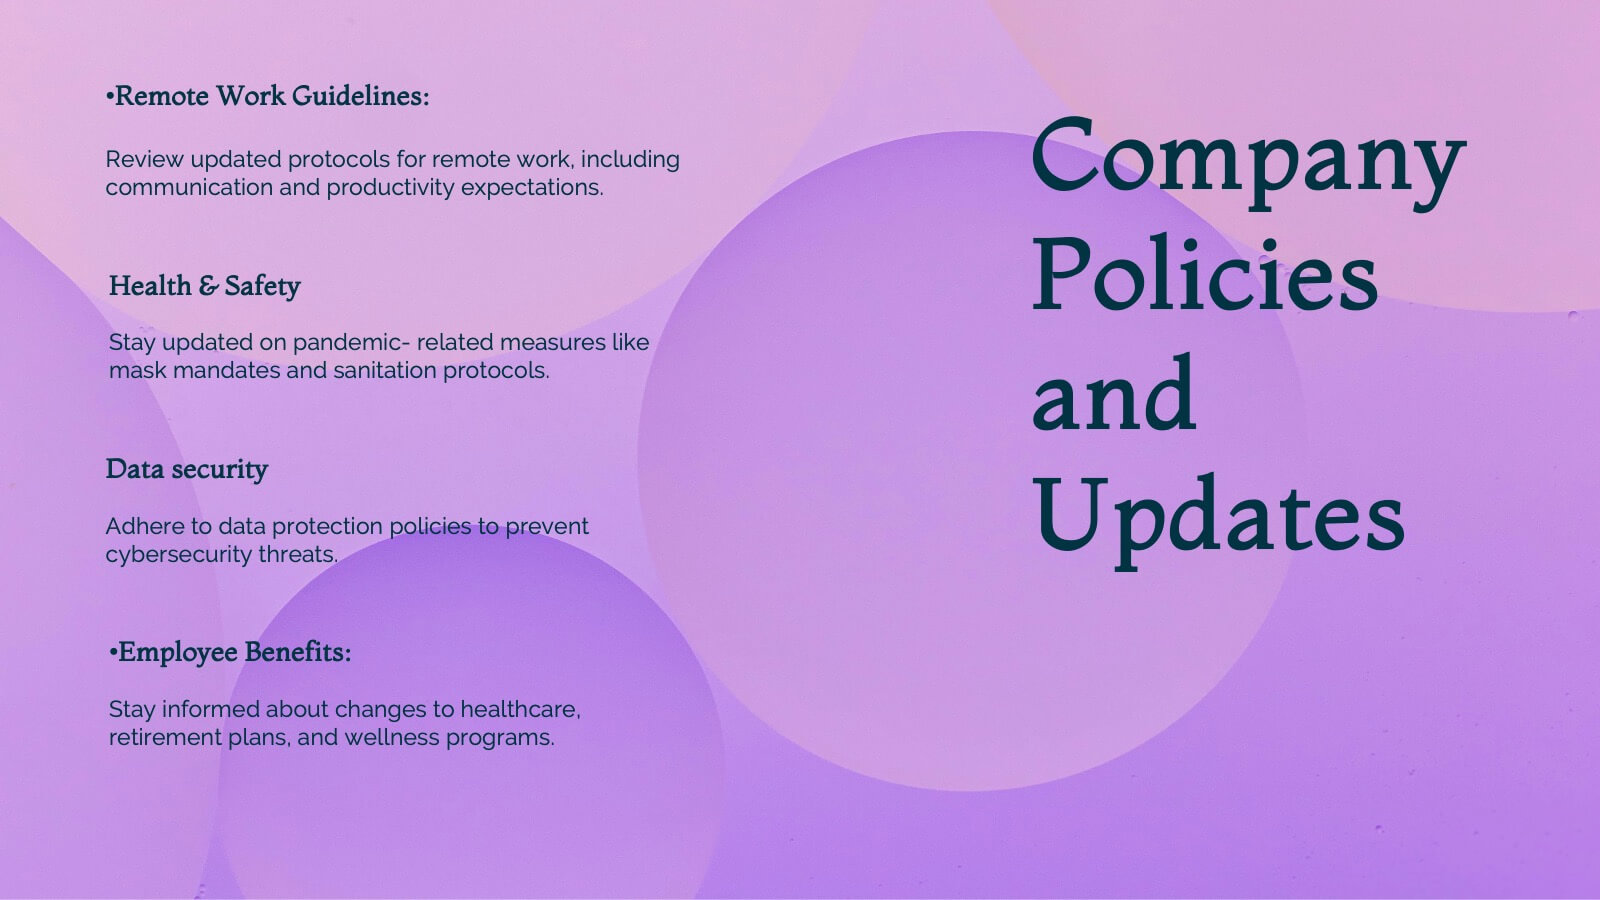
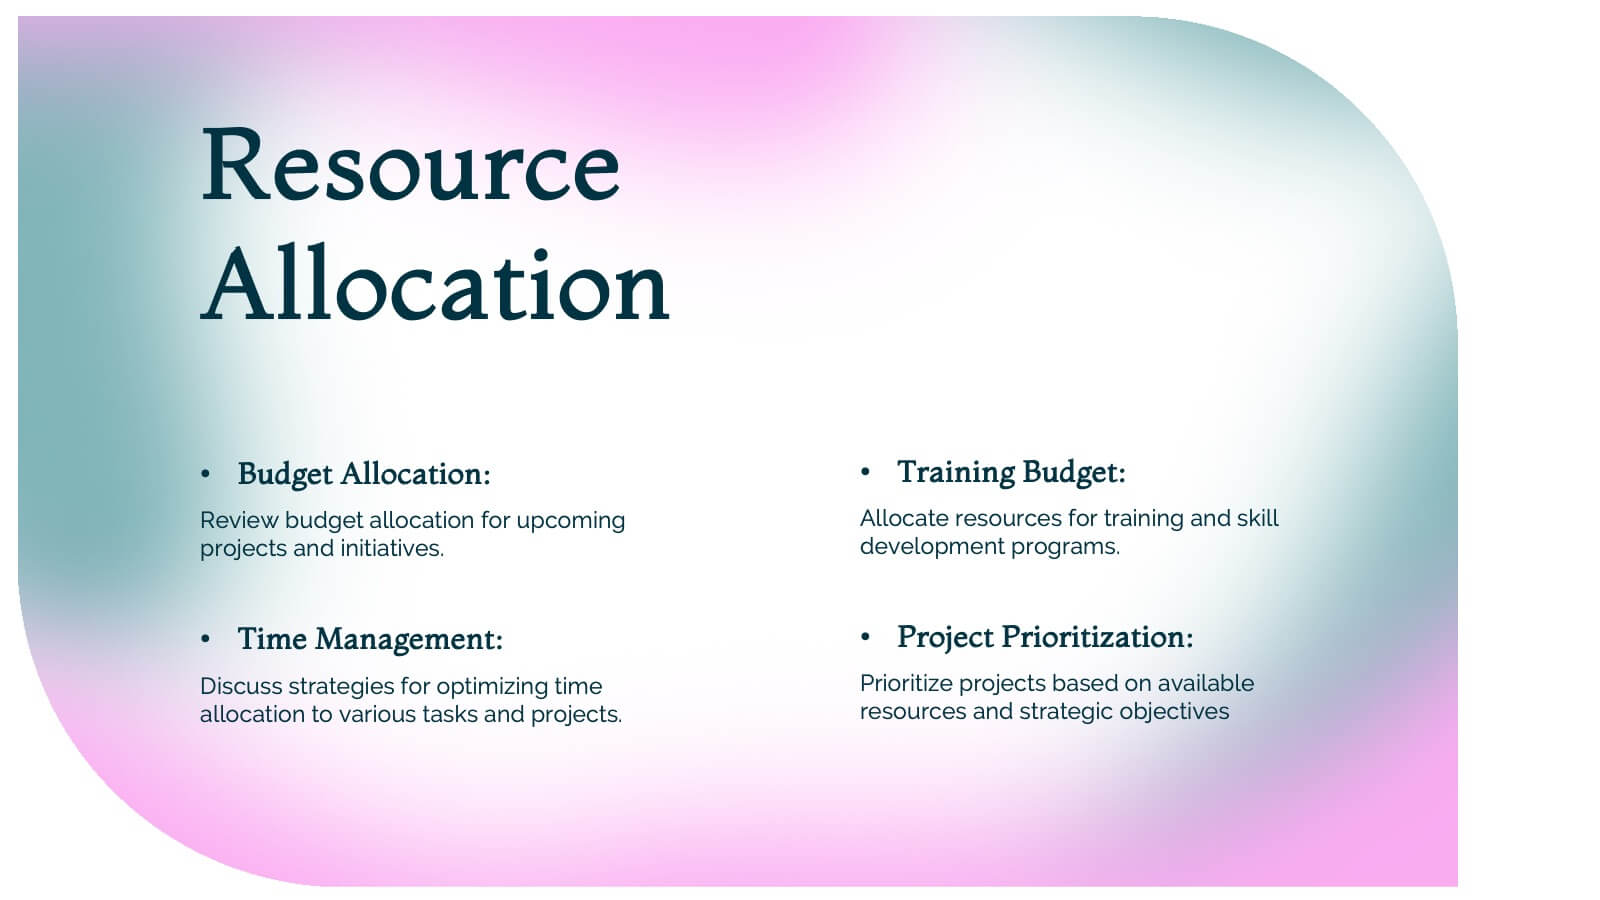
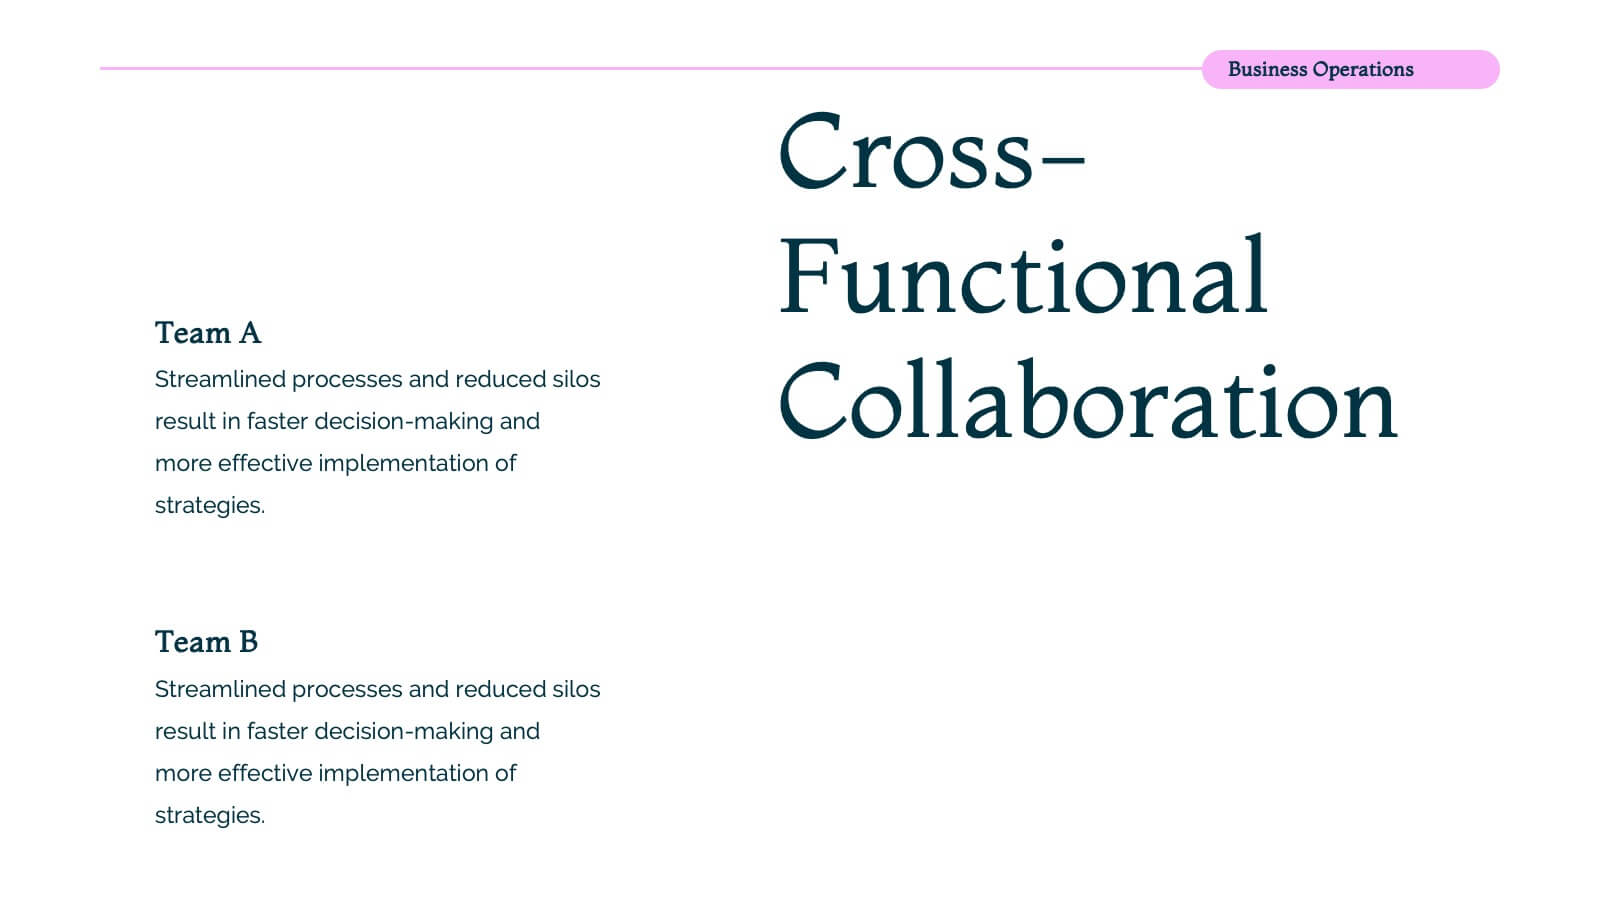
Nova Business Operations Plan Presentation
Create a polished business operations plan with this modern and organized template! It covers everything from team updates and project overviews to resource allocation and collaboration opportunities. Perfect for structuring departmental goals, process improvements, and employee recognition. Compatible with PowerPoint, Keynote, and Google Slides for a seamless, professional presentation.


7 diapositivas
Investment Infographic Presentation Template
This Investment Infographic template is a professionally designed presentation made to present your ideas in an easy to understand format. This template features a professional design, easy color customization and a number of other useful elements to help you create an amazing infographic. This template is designed to include a variety of charts and graphs to visually demonstrate key points, and incorporates animated elements that make it more interesting for the viewer. This is the perfect presentation to introduce your company's investment portfolio to potential investors.


15 diapositivas
Business Journal Infographic
A Business Journal Infographic is a visual representation of data, information, or concepts related to business topics that typically follow the style and format often found in business journals or publications. This infographic is designed to present complex information quickly and clearly. The purpose of this is to convey information in a visually engaging and easily digestible format, making it easier for readers to grasp complex business concepts or data. With this template transform your business narrative into a captivating visual story that not only informs but inspires readers to delve into the world of entrepreneurship.


7 diapositivas
Business Strategy with 7S Model
Clearly map out your organizational alignment using this Business Strategy with 7S Model template. Perfect for strategy consultants, leadership teams, and business educators, it illustrates the interconnectedness of structure, strategy, systems, style, staff, skills, and shared values. Fully customizable in PowerPoint, Keynote, and Google Slides.