


Características


¿Tienes alguna pregunta?
Recomendar


28 diapositivas
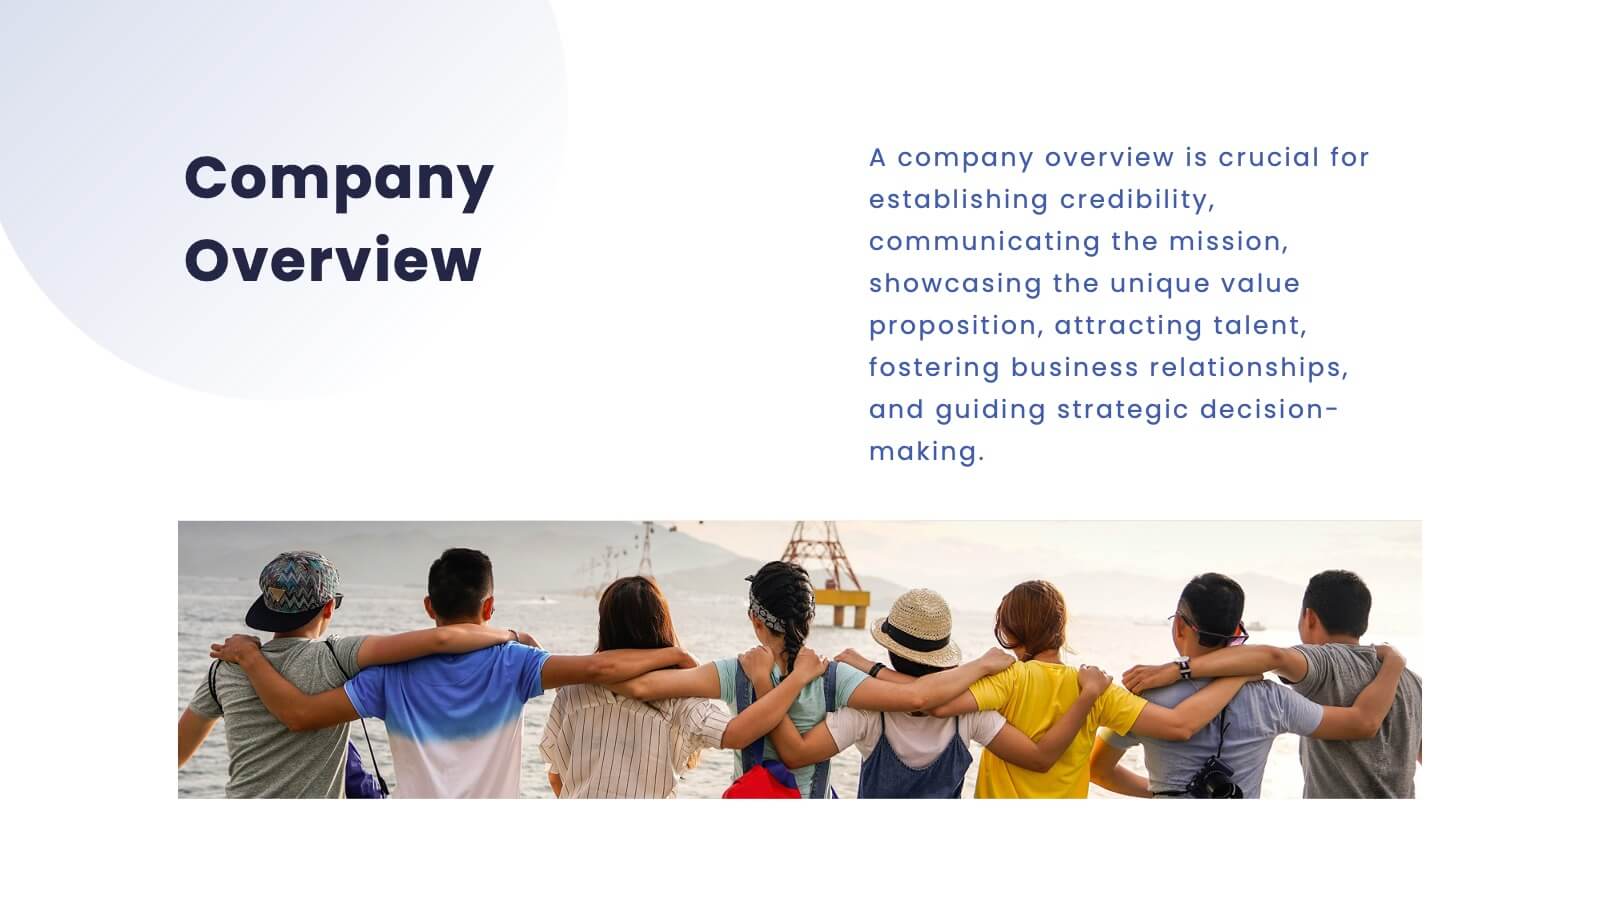
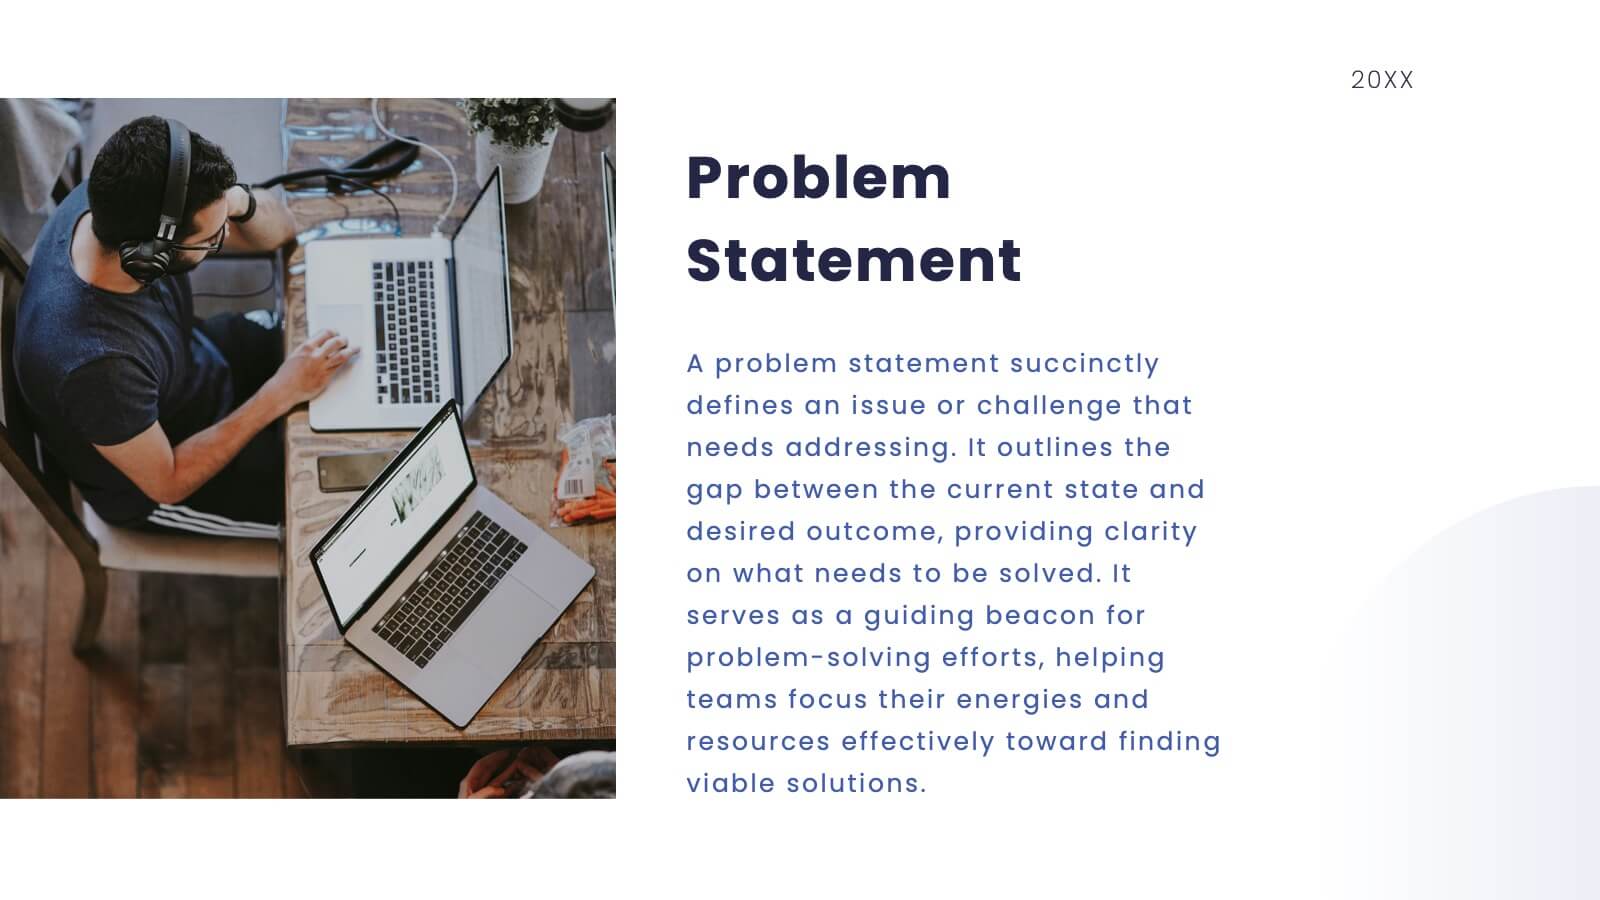
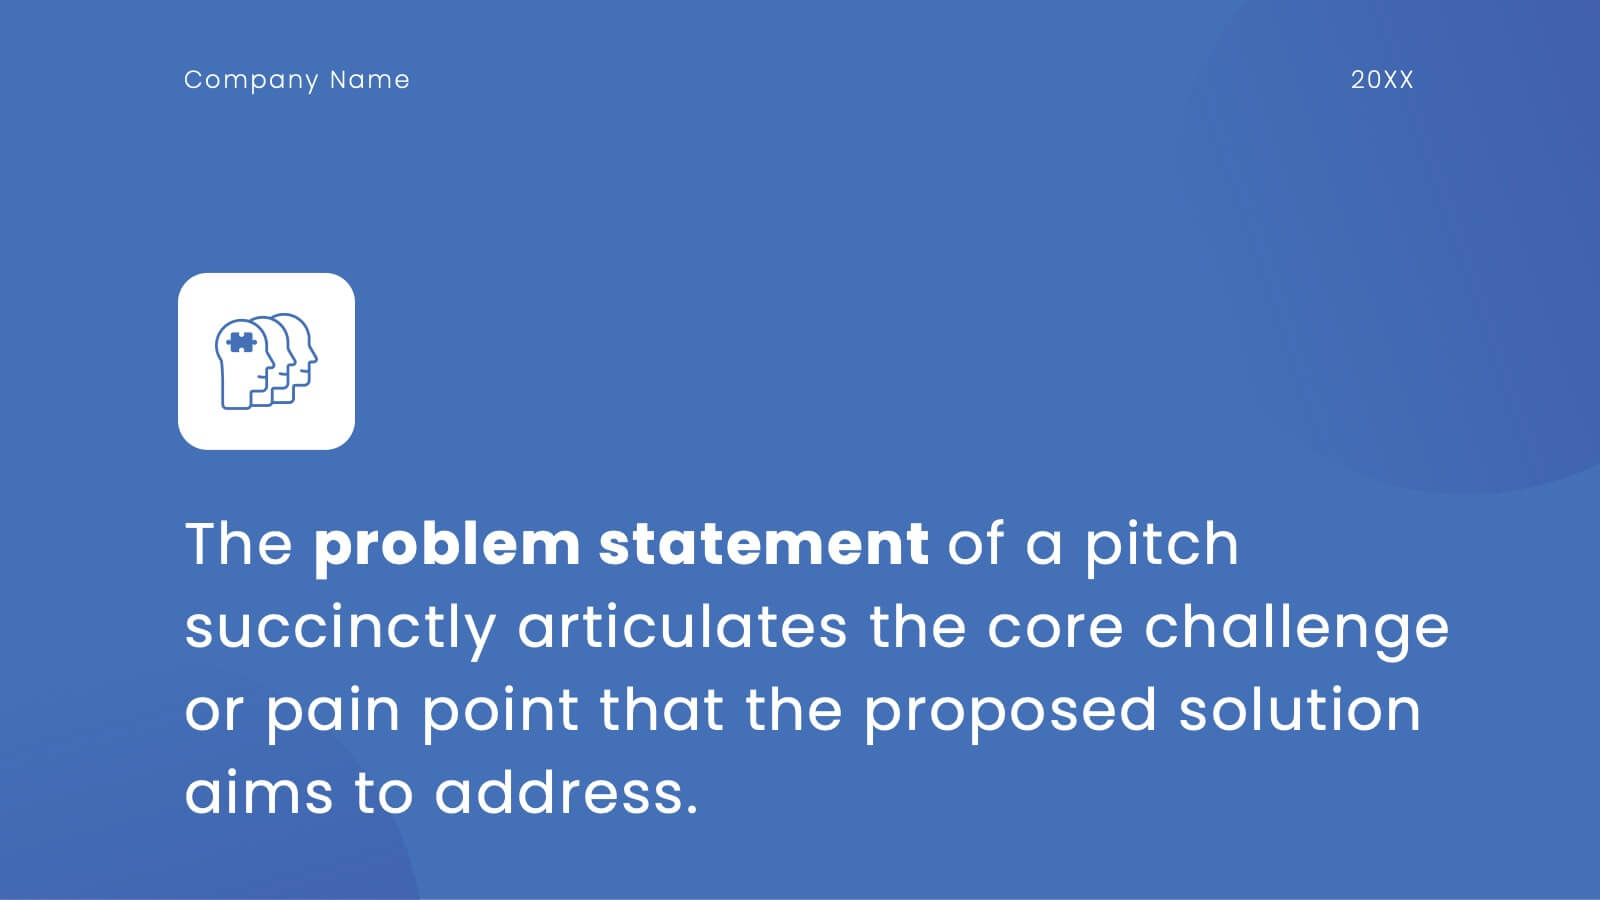
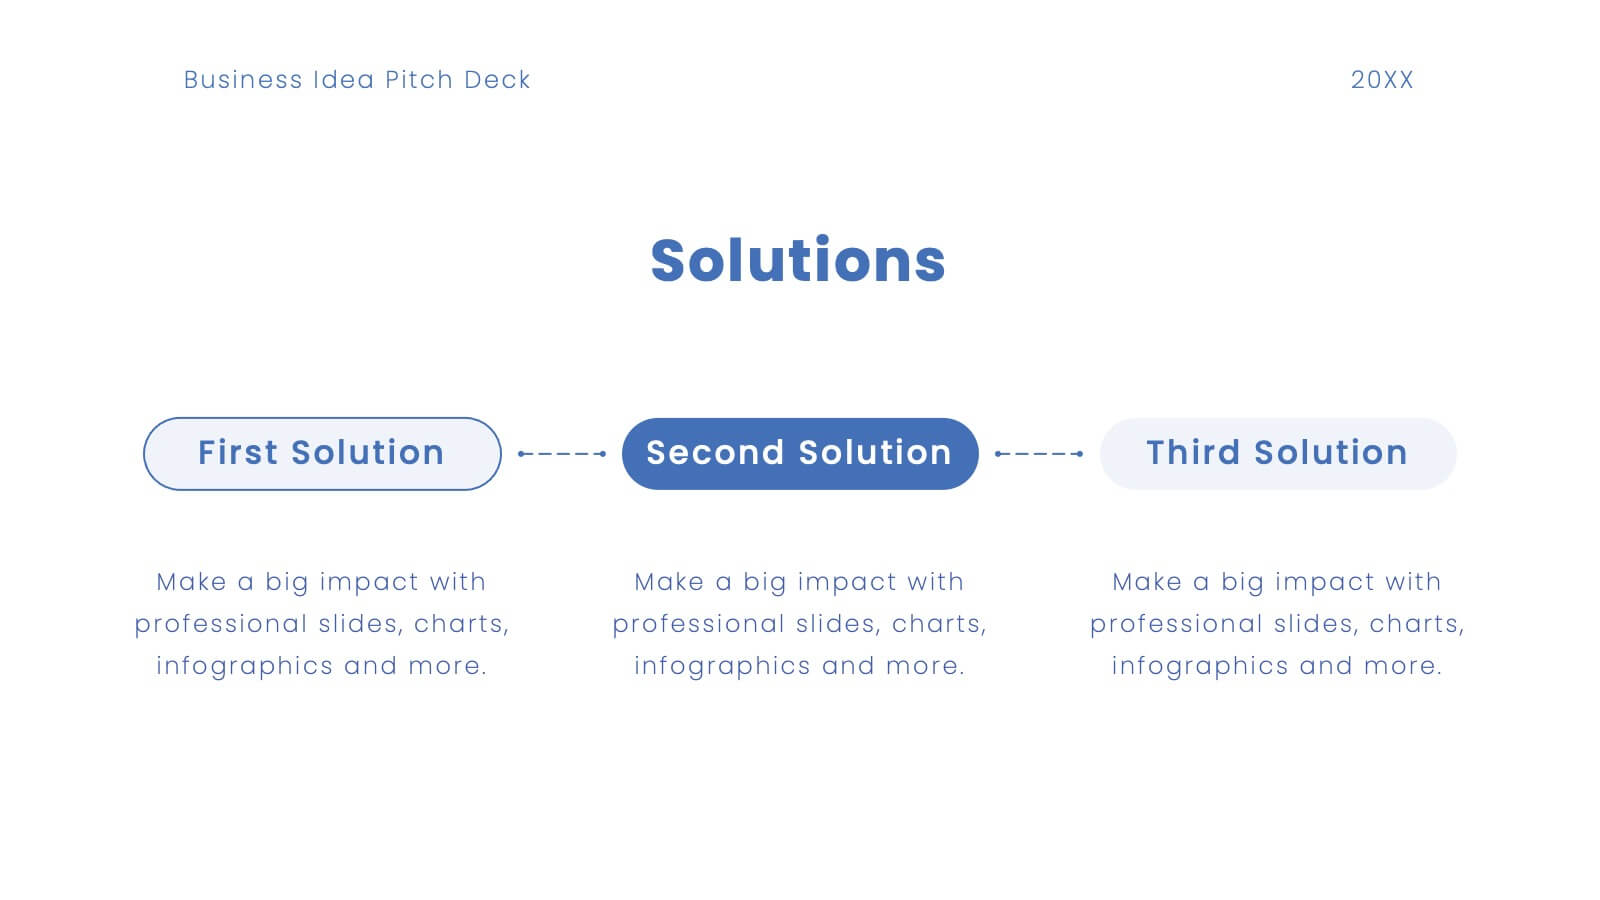
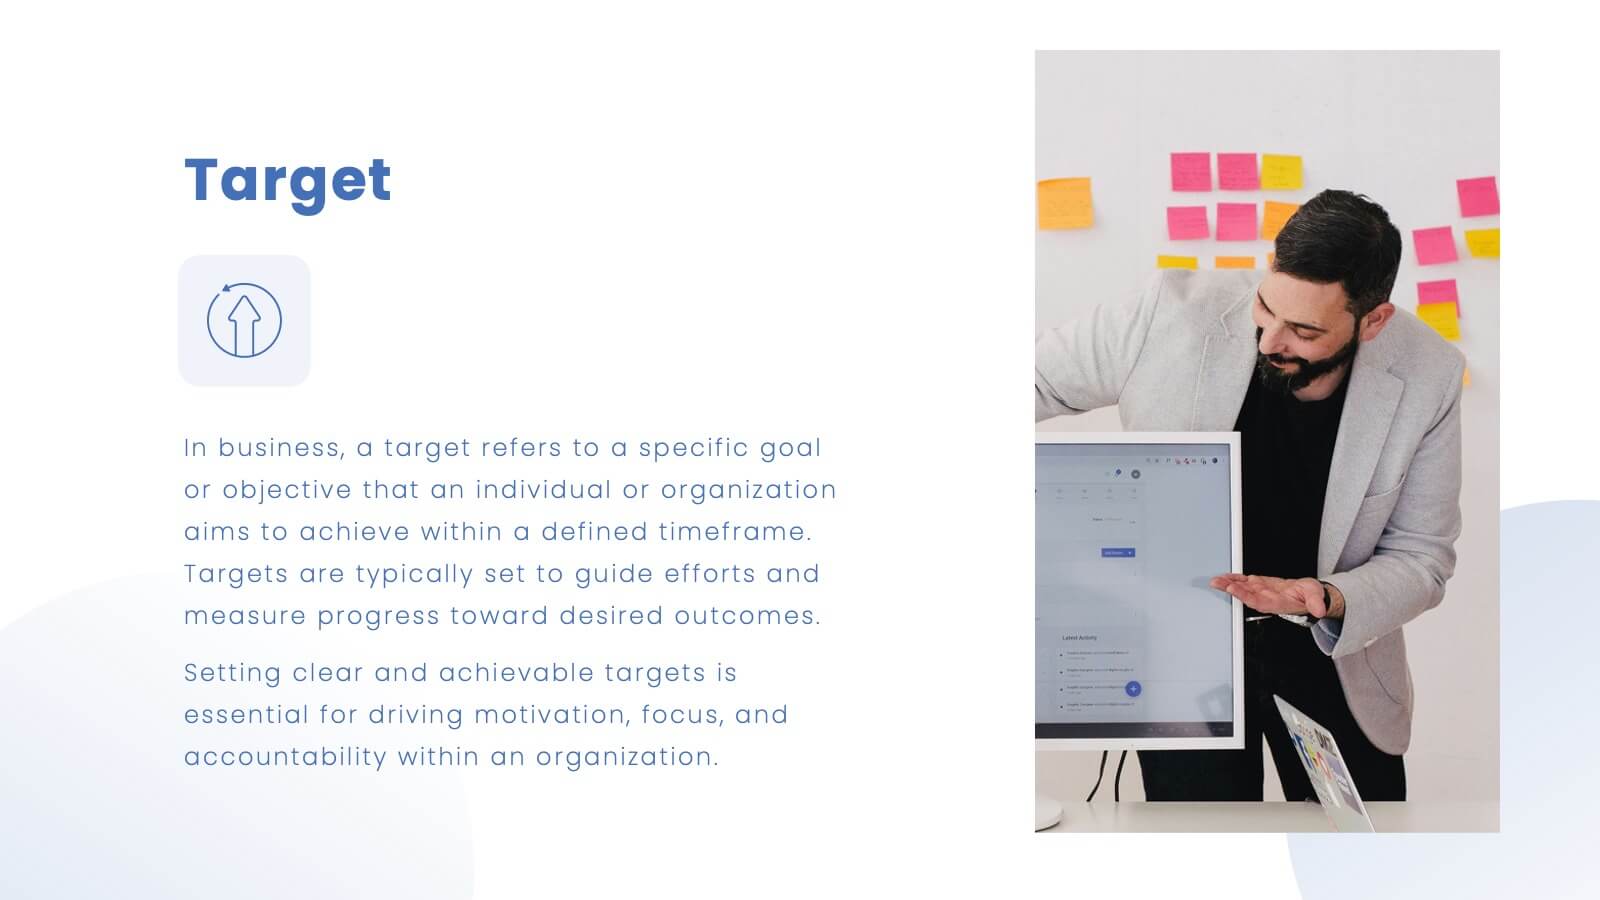
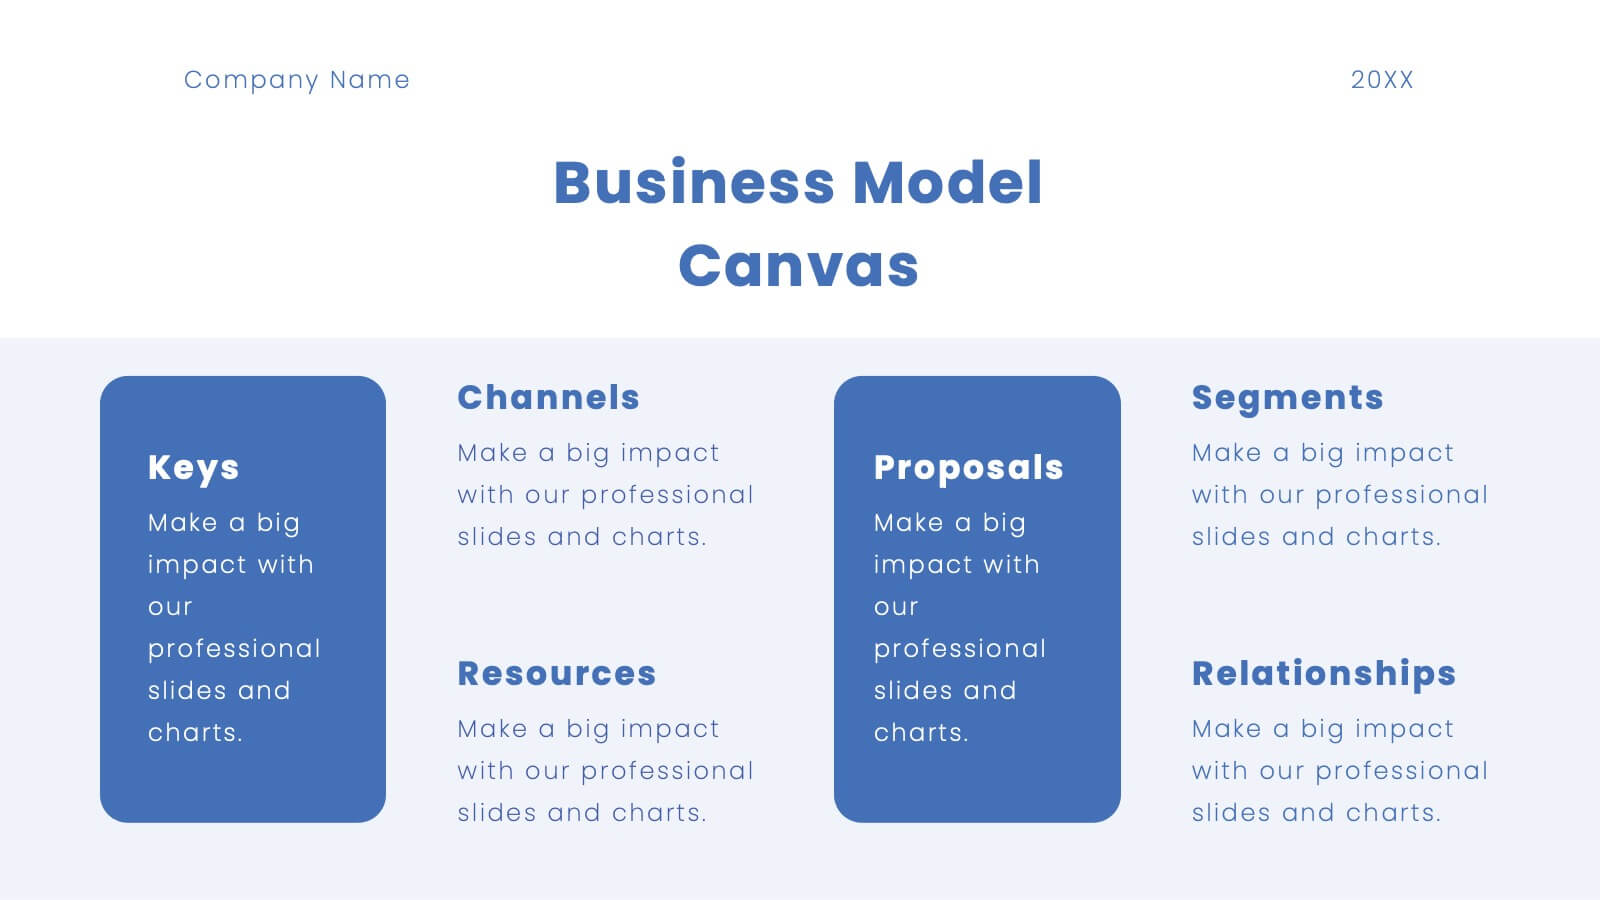
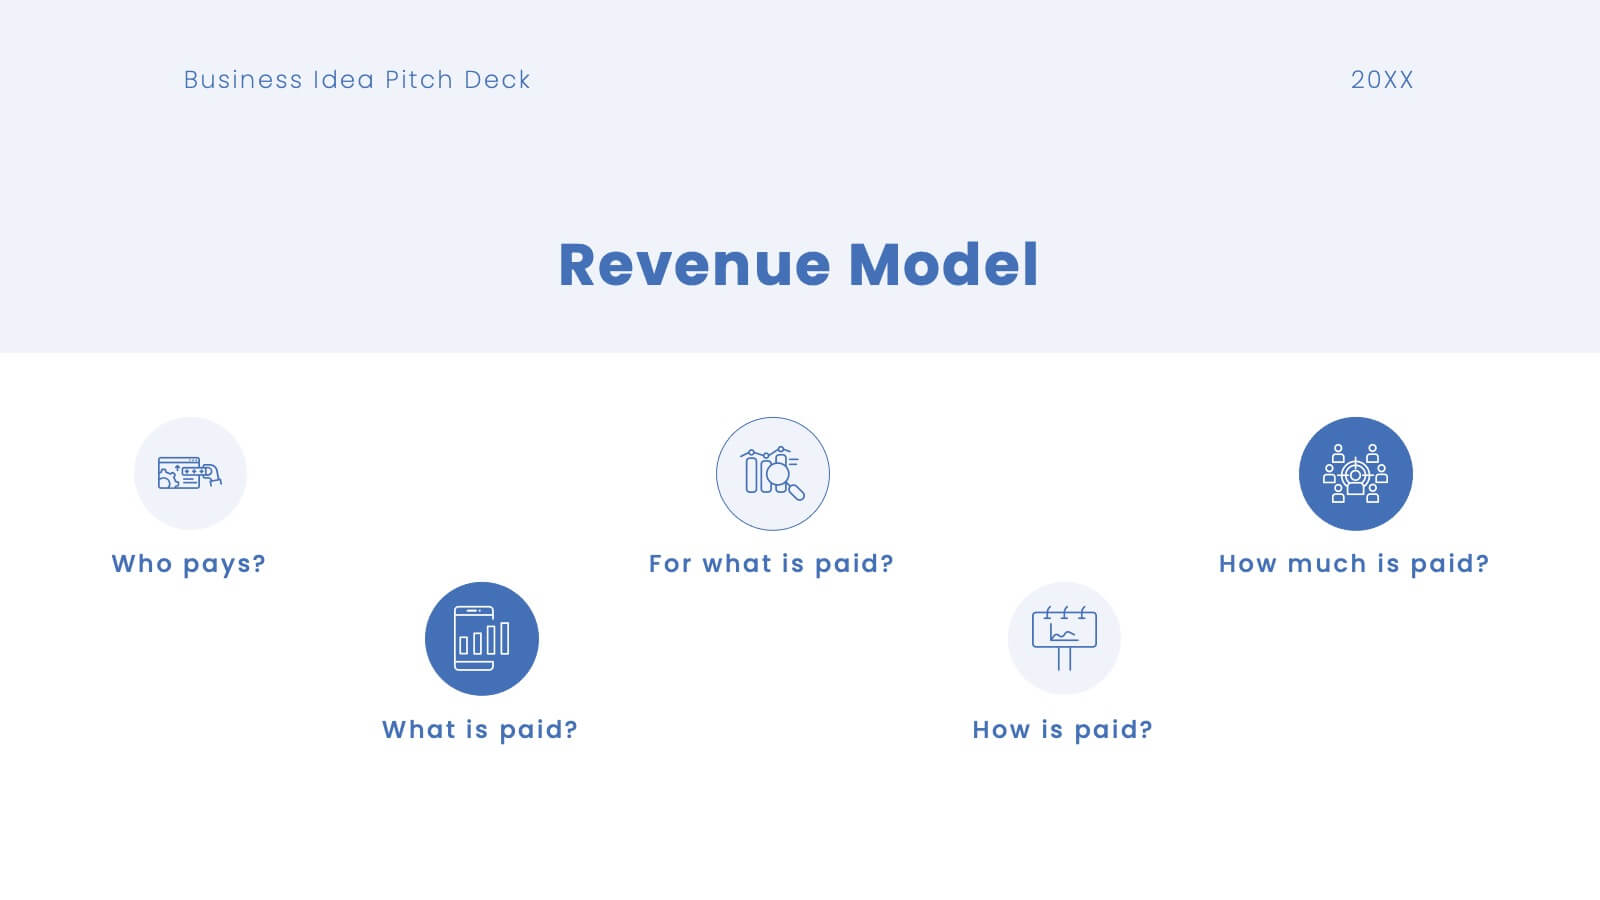
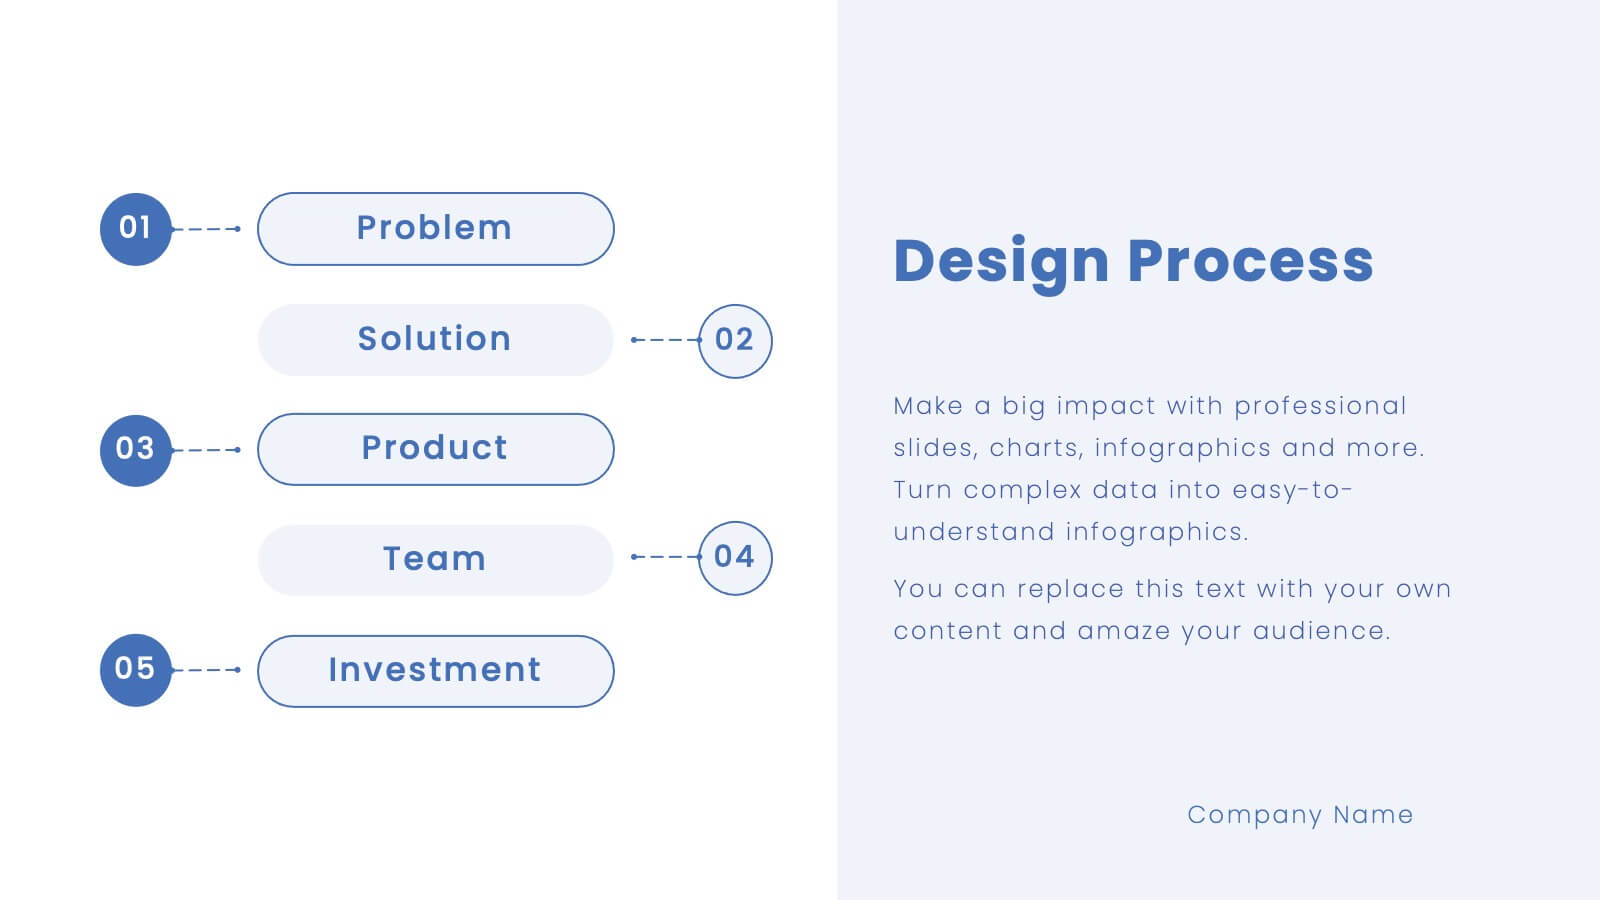
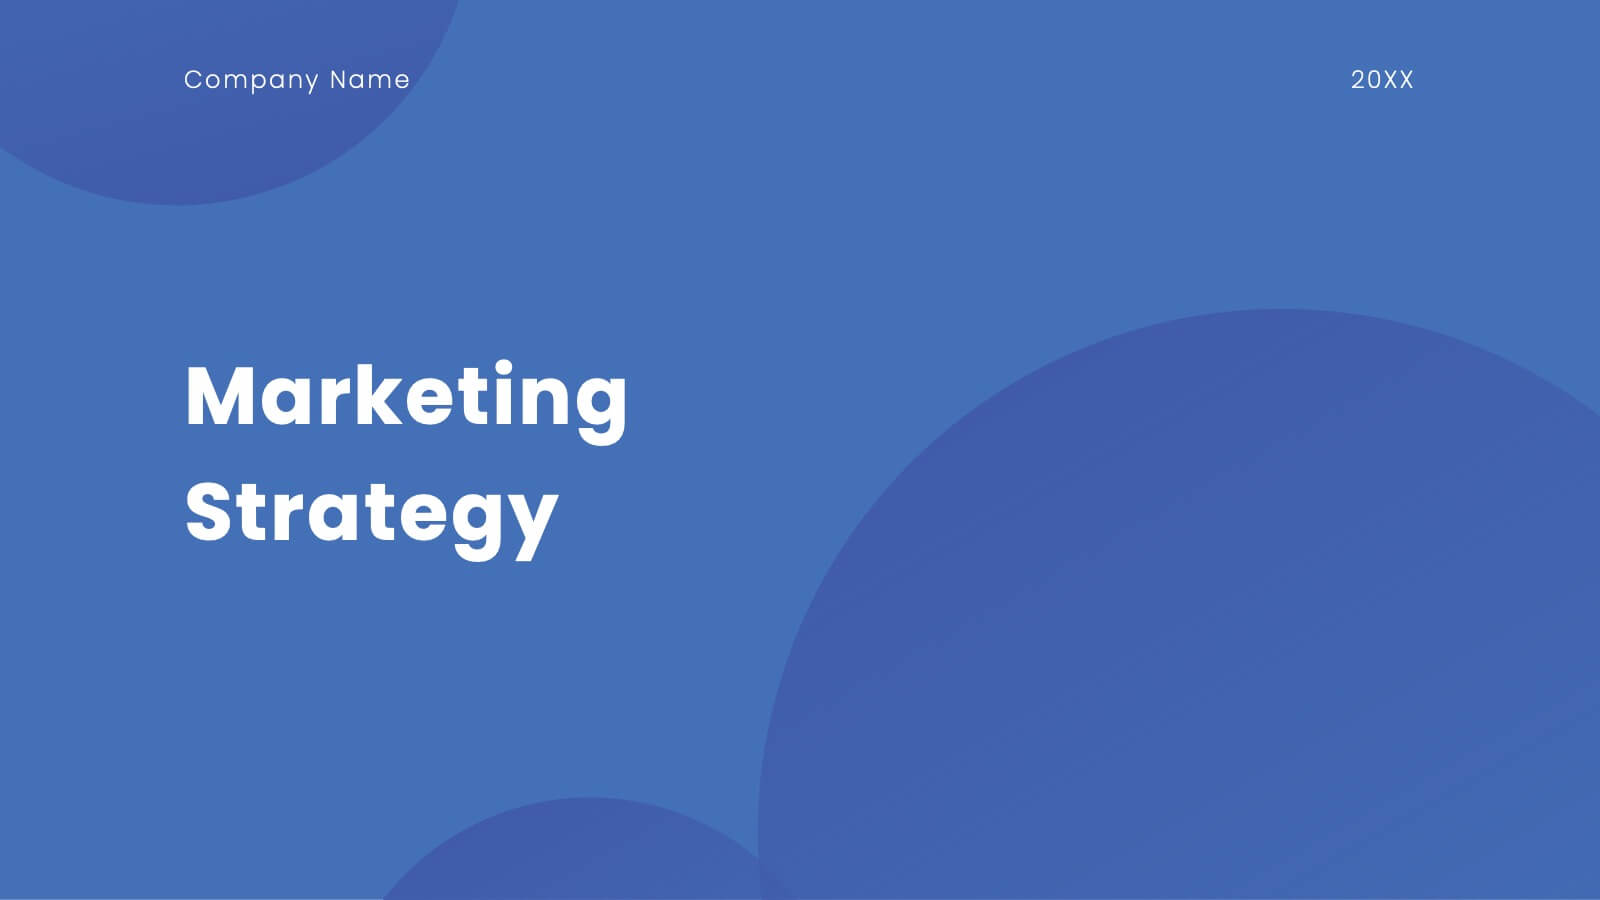
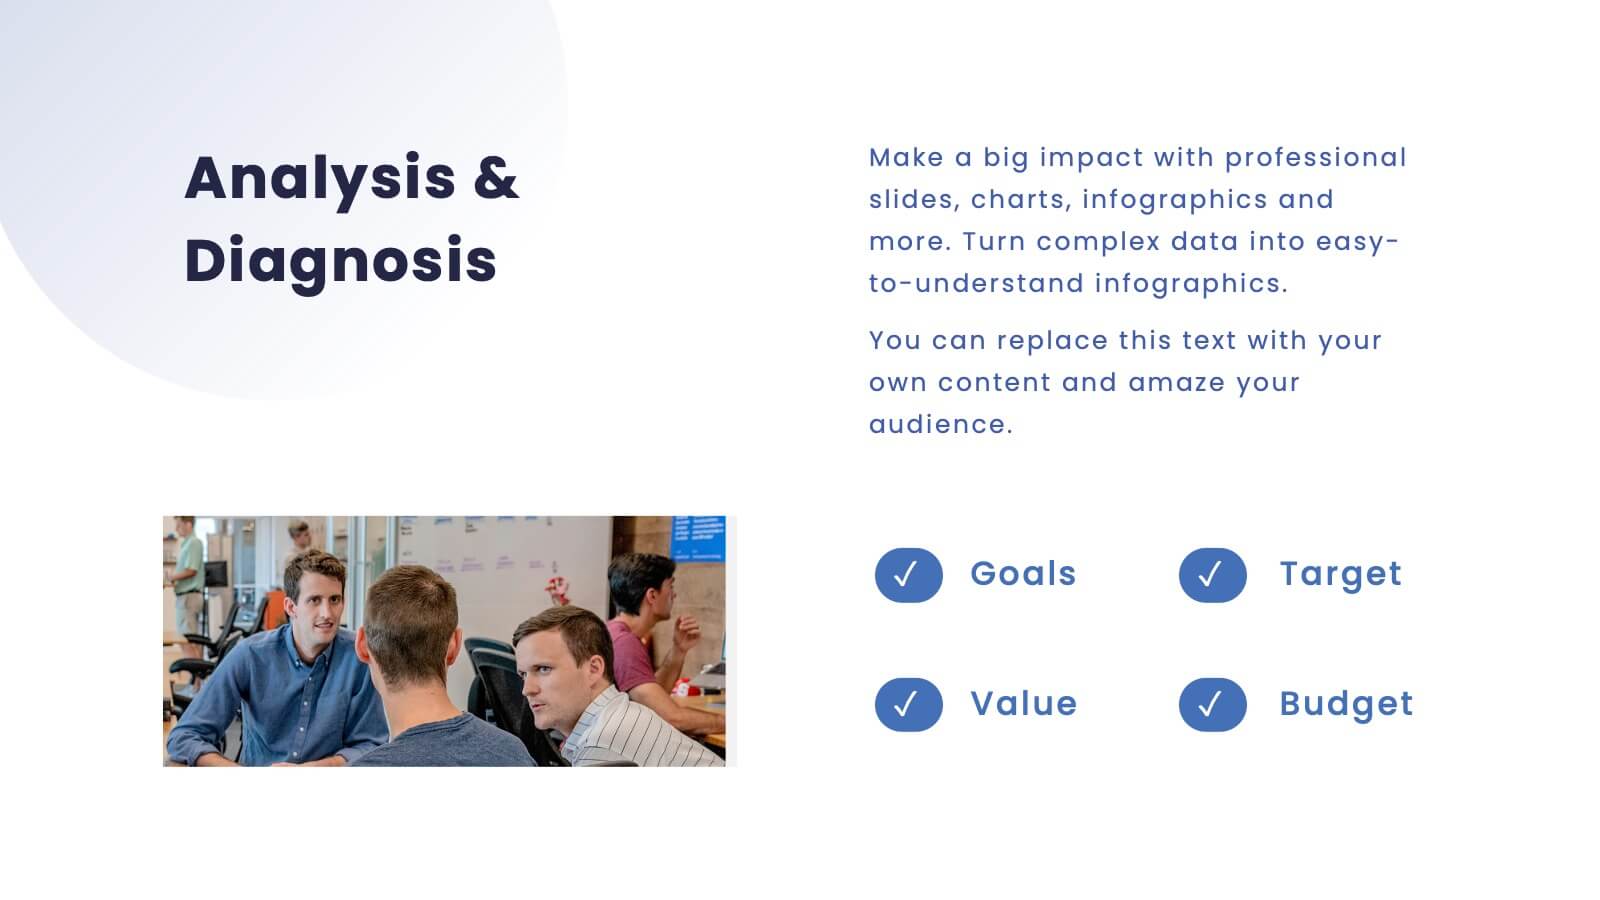
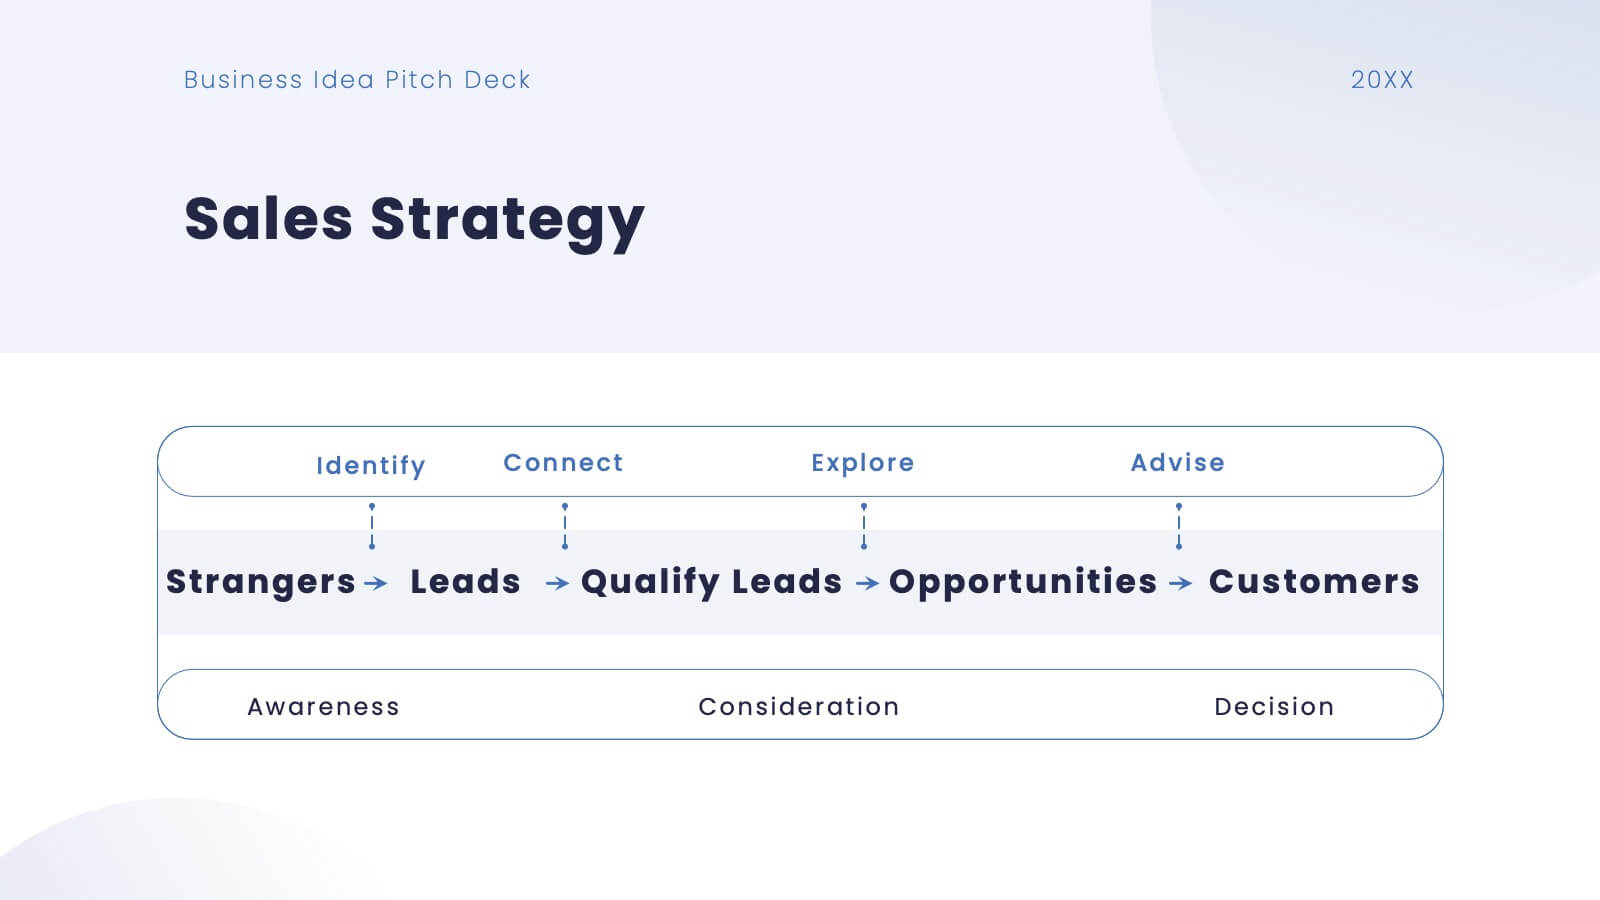
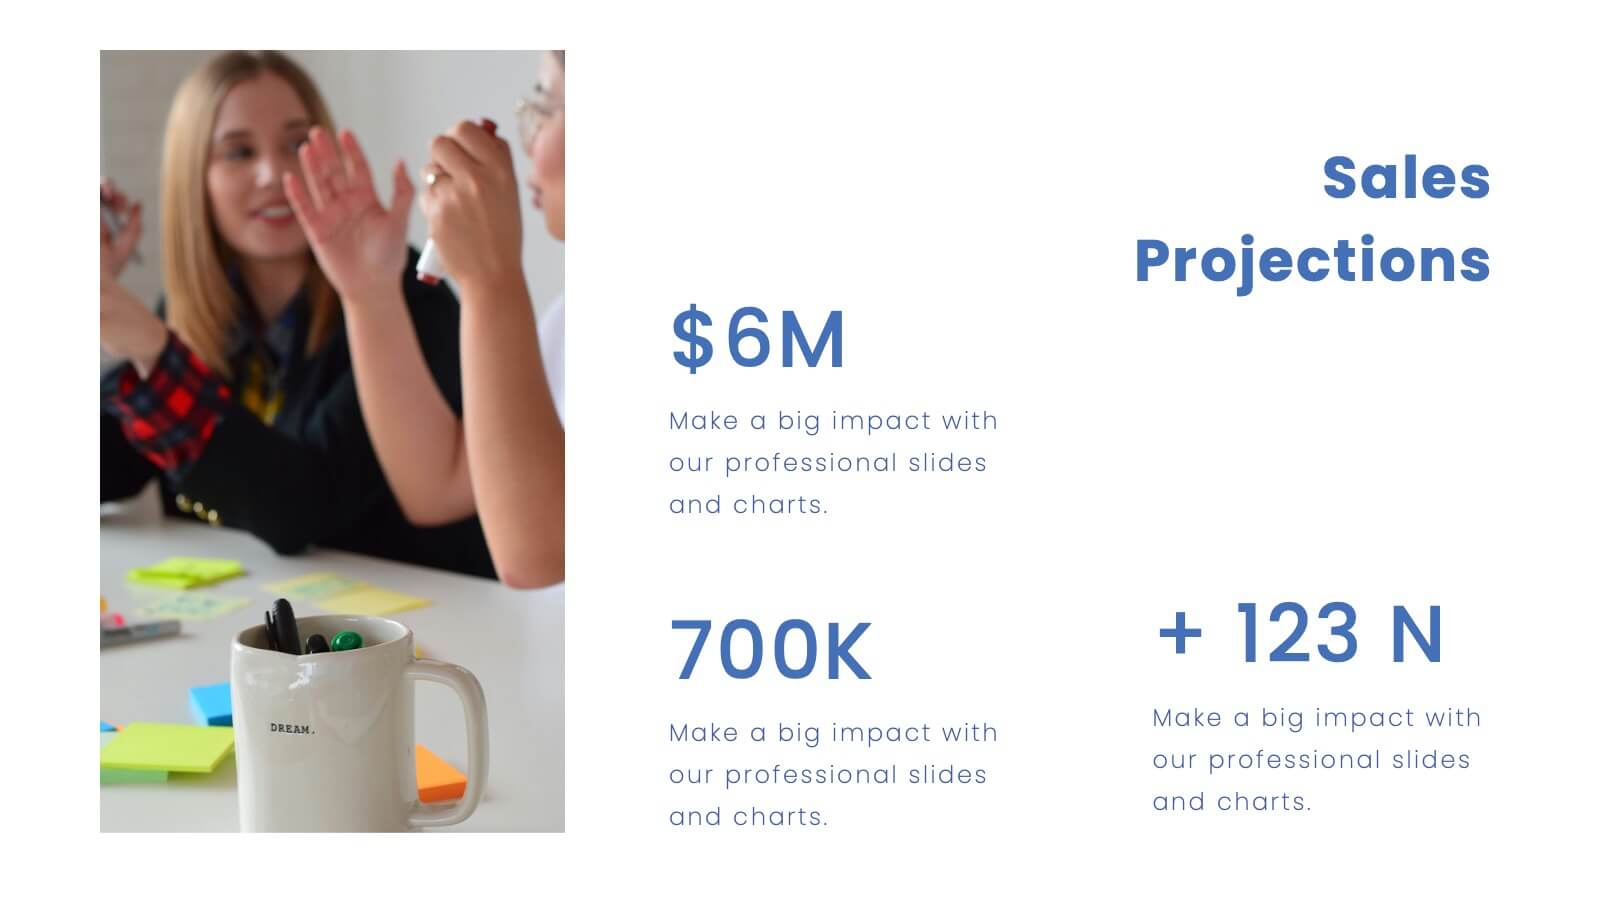
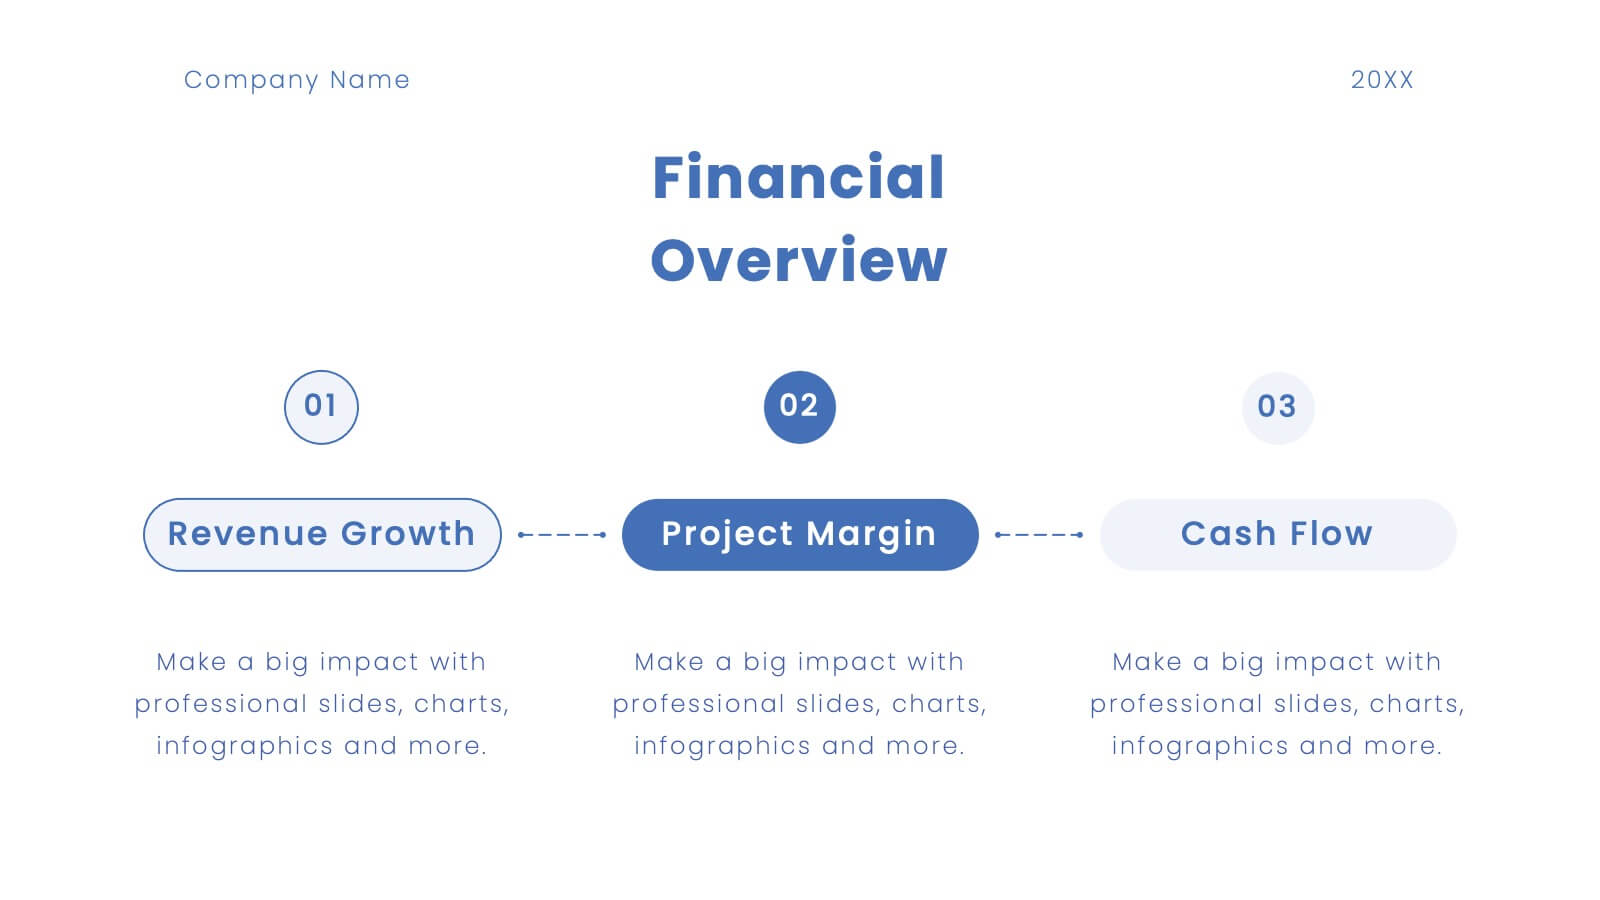
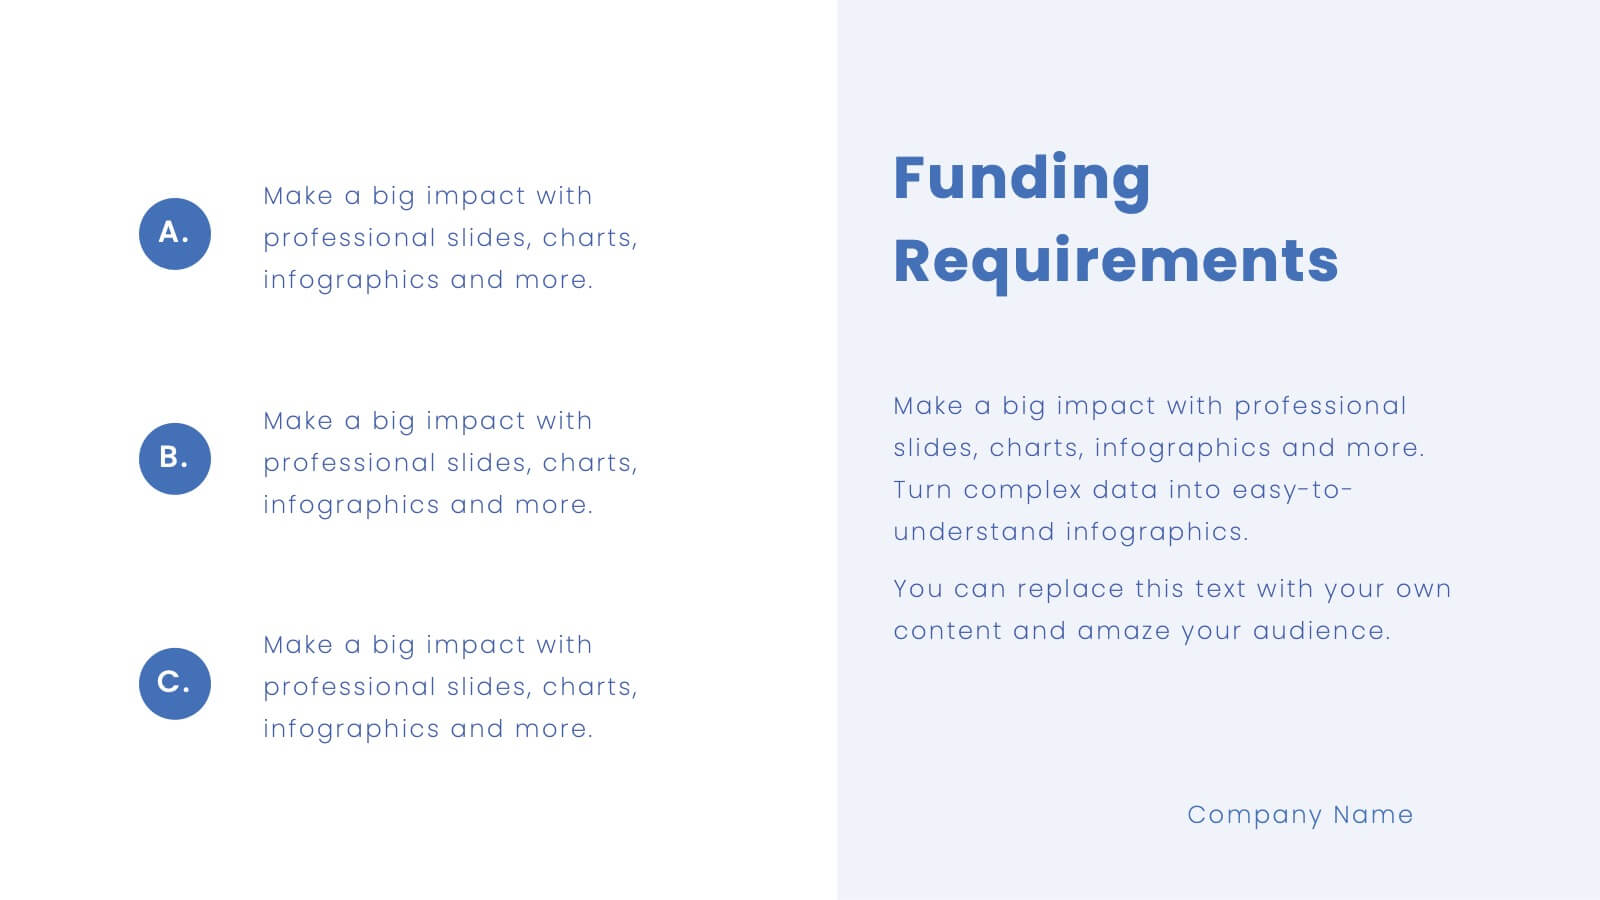
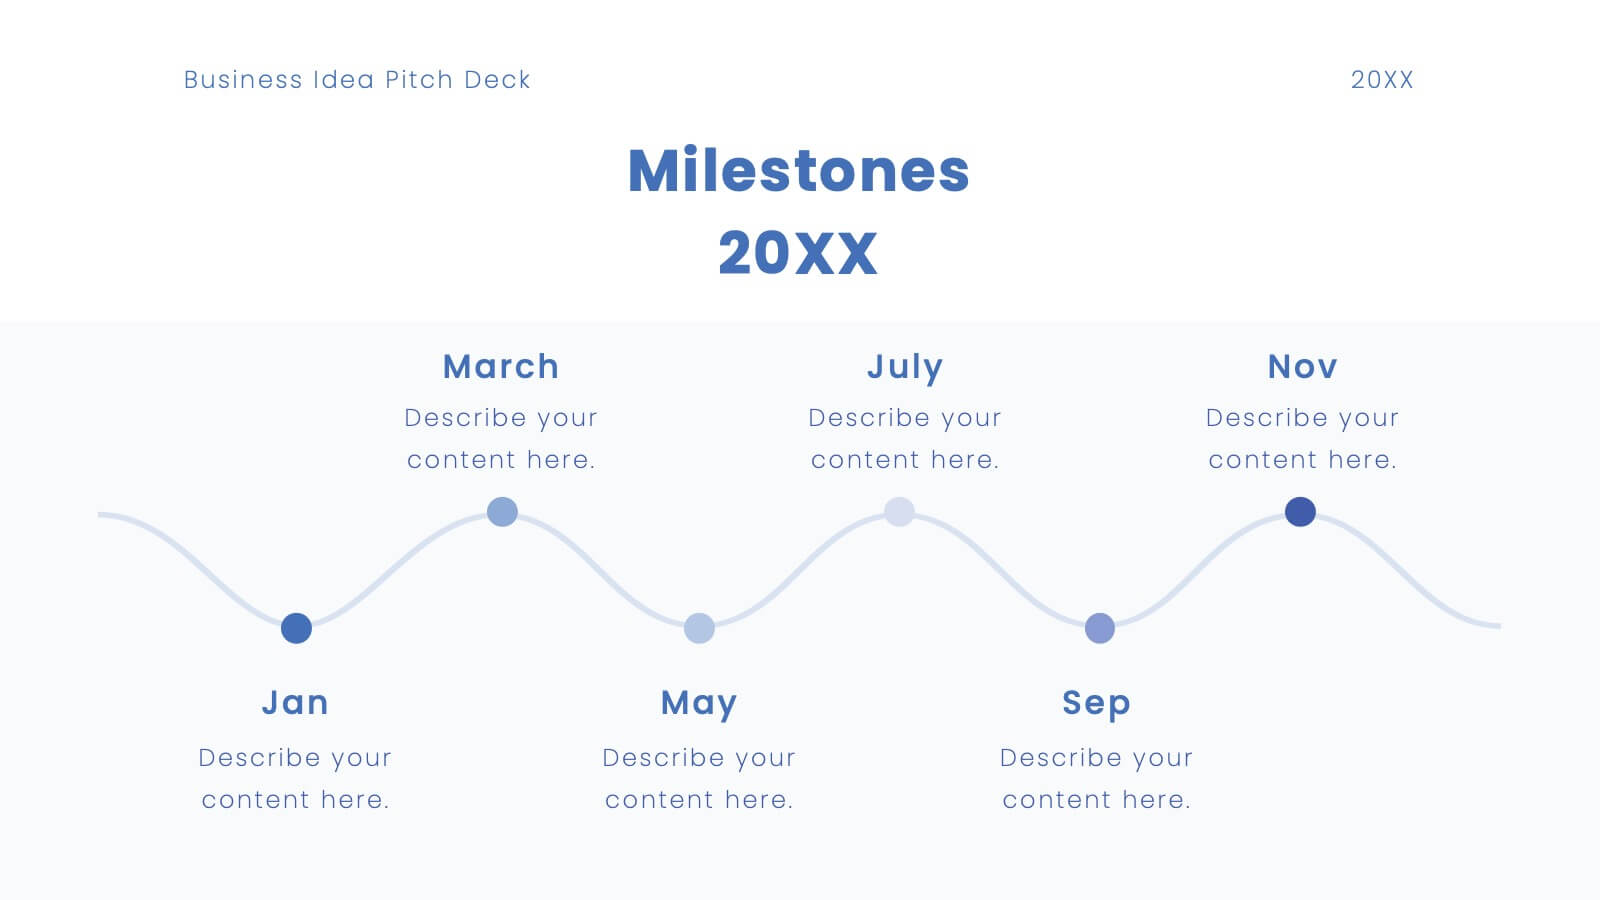
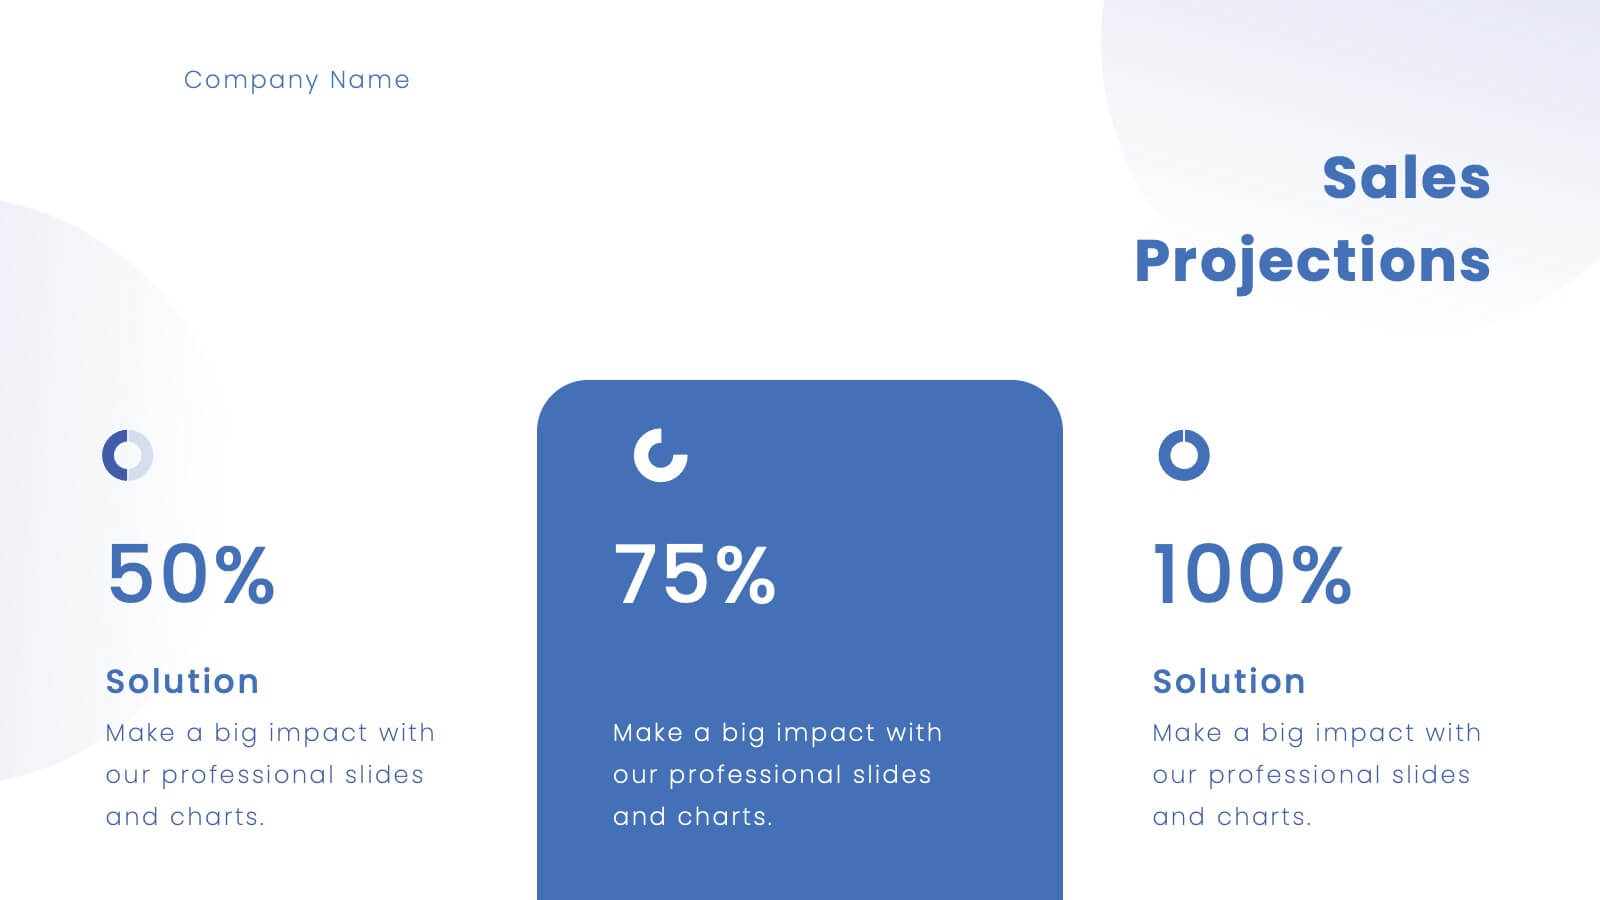
Platinum Business Idea Pitch Deck Presentation
Present your business idea with this sleek and professional pitch deck template! It includes everything from market opportunities to financial projections and sales strategies, providing a comprehensive structure for your pitch. Fully customizable and compatible with PowerPoint, Keynote, and Google Slides, this template is ideal for impressing investors and stakeholders.


7 diapositivas
Break Even Point Infographic Presentation
A Break Even Analysis Infographic is a visual tool that helps businesses and organizations understand the point at which they will begin to make a profit. This template uses a graph to show the relationship between fixed costs, revenue, and profits at different levels of production or sales. This Infographic also includes a graph with two lines: one representing fixed costs and the other representing total revenue. The point at which these lines intersect represents the break-even point, which is the level of sales or production at which the business will neither make a profit nor incur a loss.


5 diapositivas
Poaching Effects Infographics
Navigate the critical issue of wildlife endangerment with our poaching effects infographics. Crafted in earthy tones of brown and tan, this informative and creatively styled vertical template sheds light on the harsh realities of illegal wildlife hunting. Whether you're an environmental activist, an educator, or part of an ecological research team, this infographic is structured to resonate with your audience, offering compelling visuals and thematic icons that starkly represent the consequences of poaching. It's more than a presentation; it's a call to global action, crucial for anyone advocating for wildlife preservation and aiming to inspire change through storytelling.


12 diapositivas
Visual Data Representation Bubble Map Presentation
Present complex data effectively with the Visual Data Representation Bubble Map presentation. This template organizes information into clear, interconnected segments, making it ideal for analytics, business insights, and strategic planning. Compatible with PowerPoint, Keynote, and Google Slides.


23 diapositivas
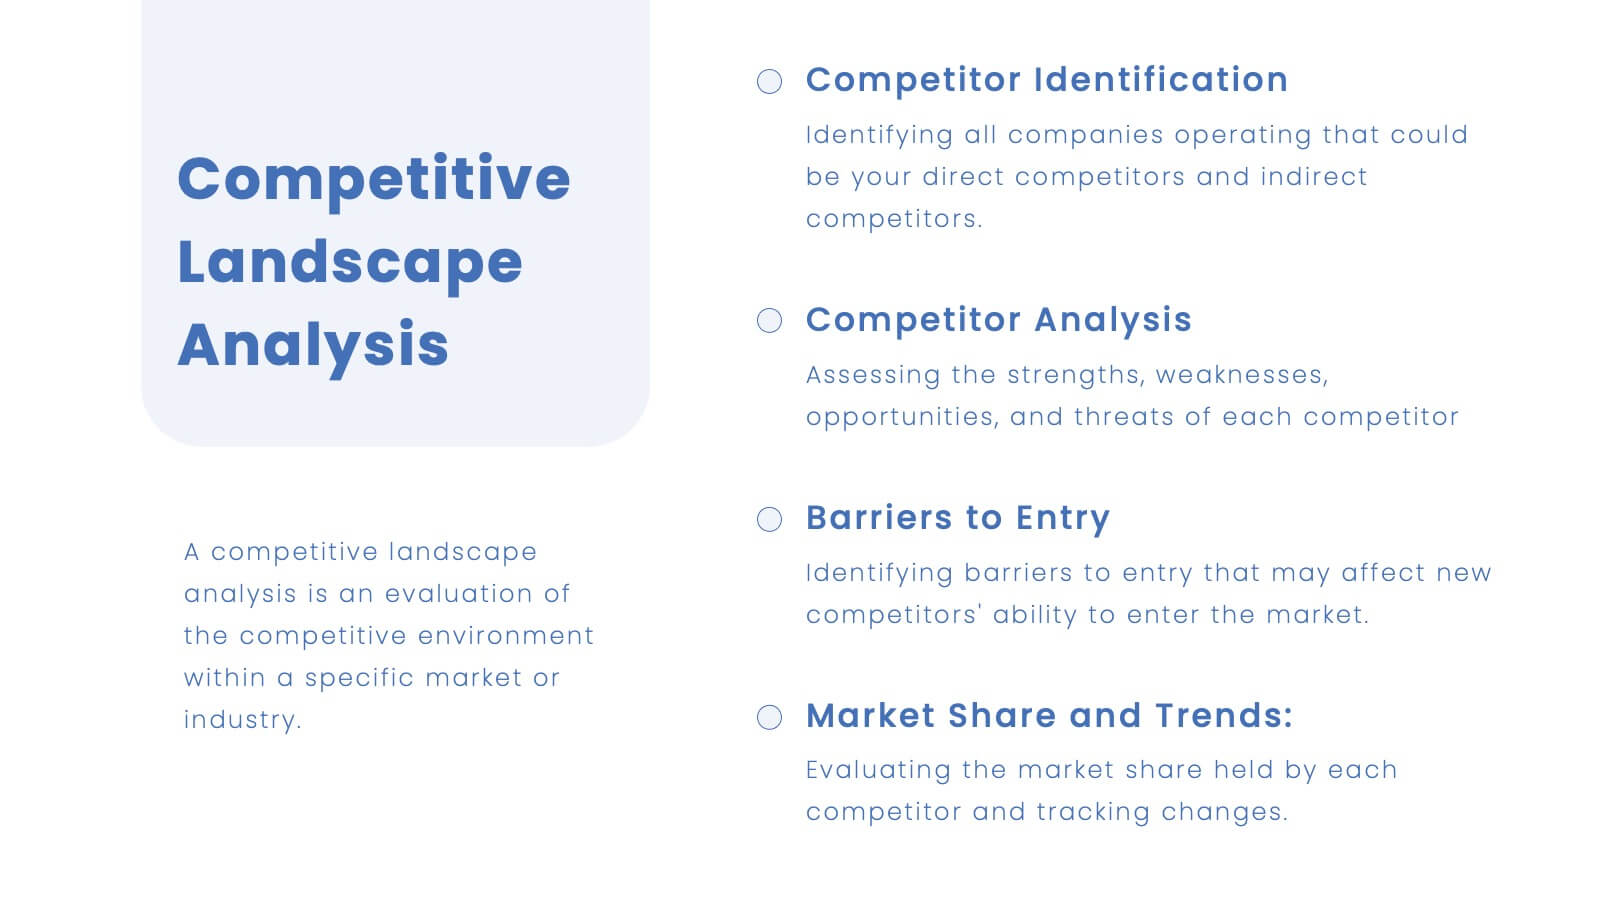
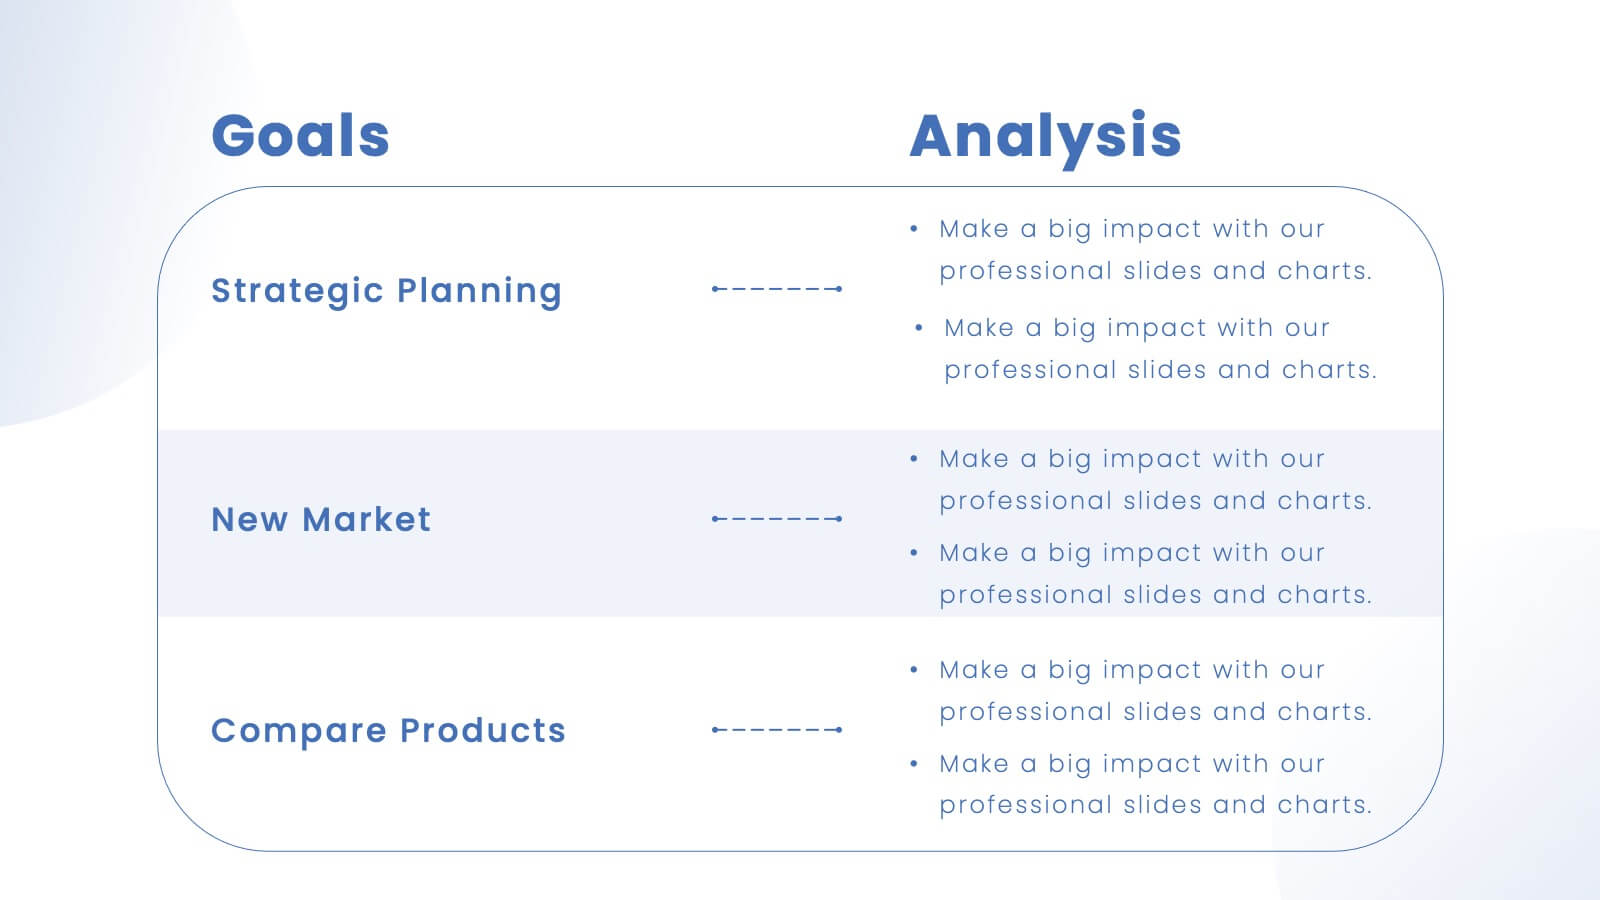
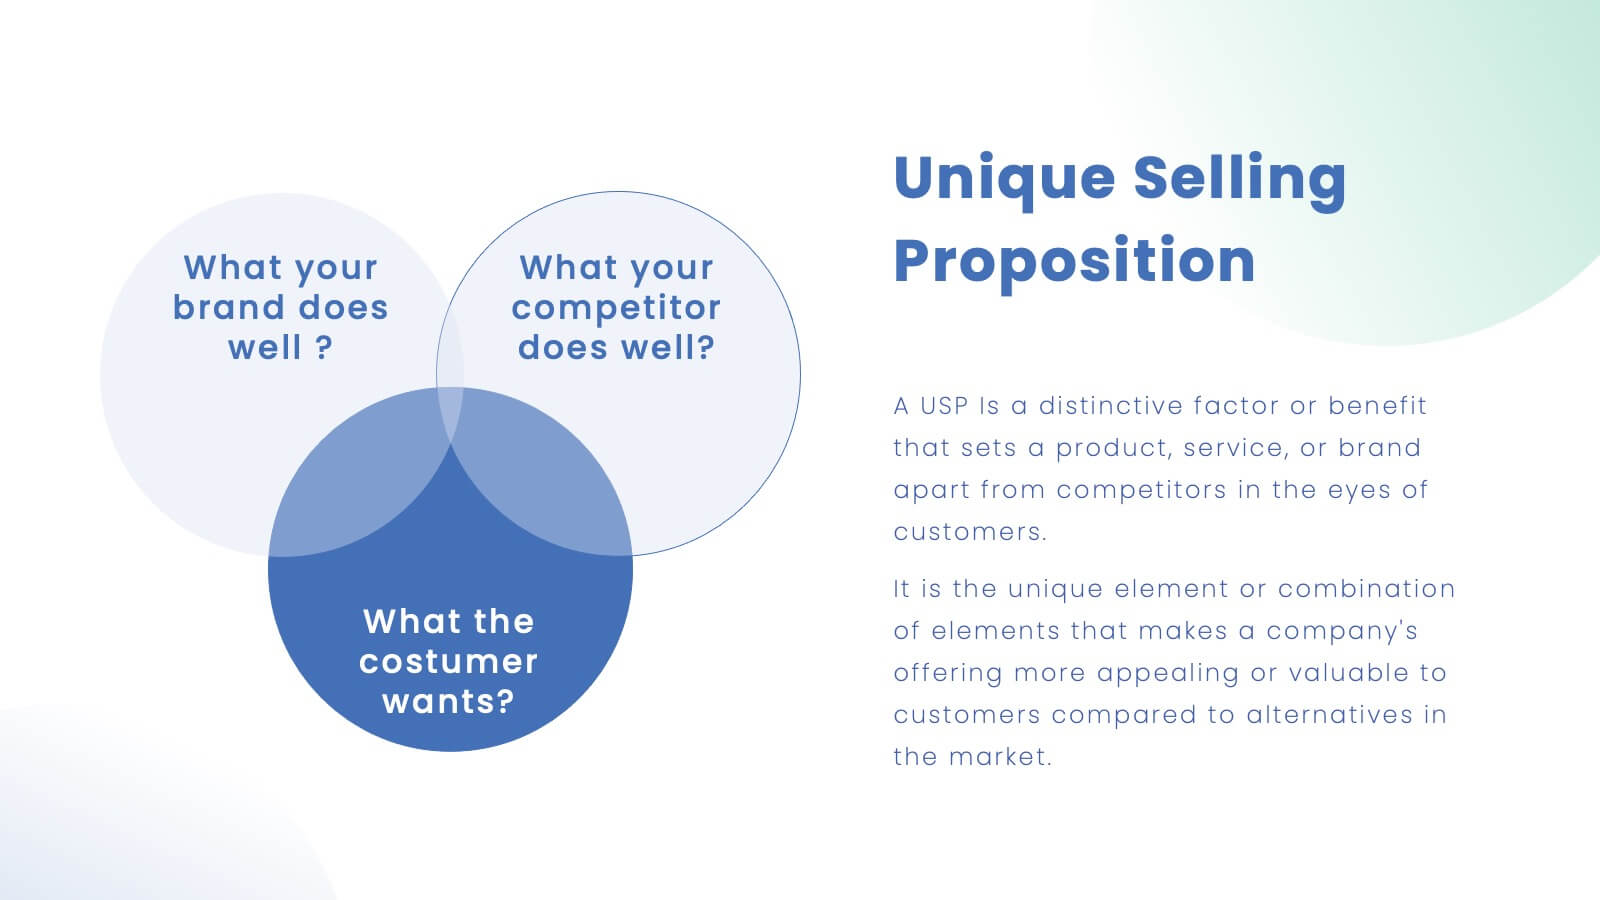
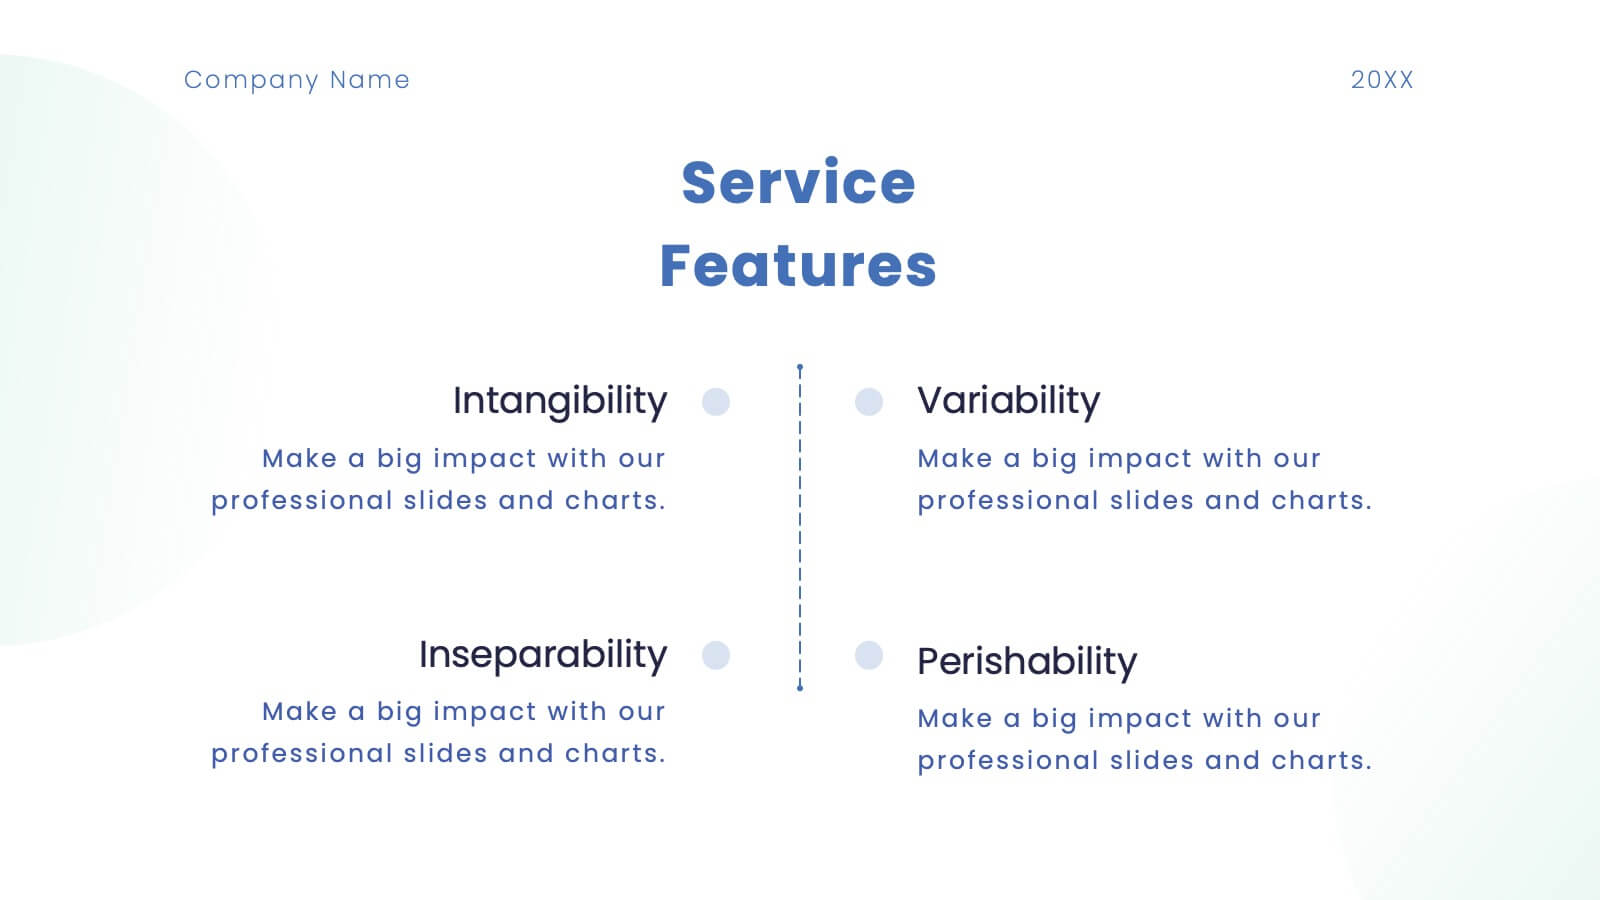
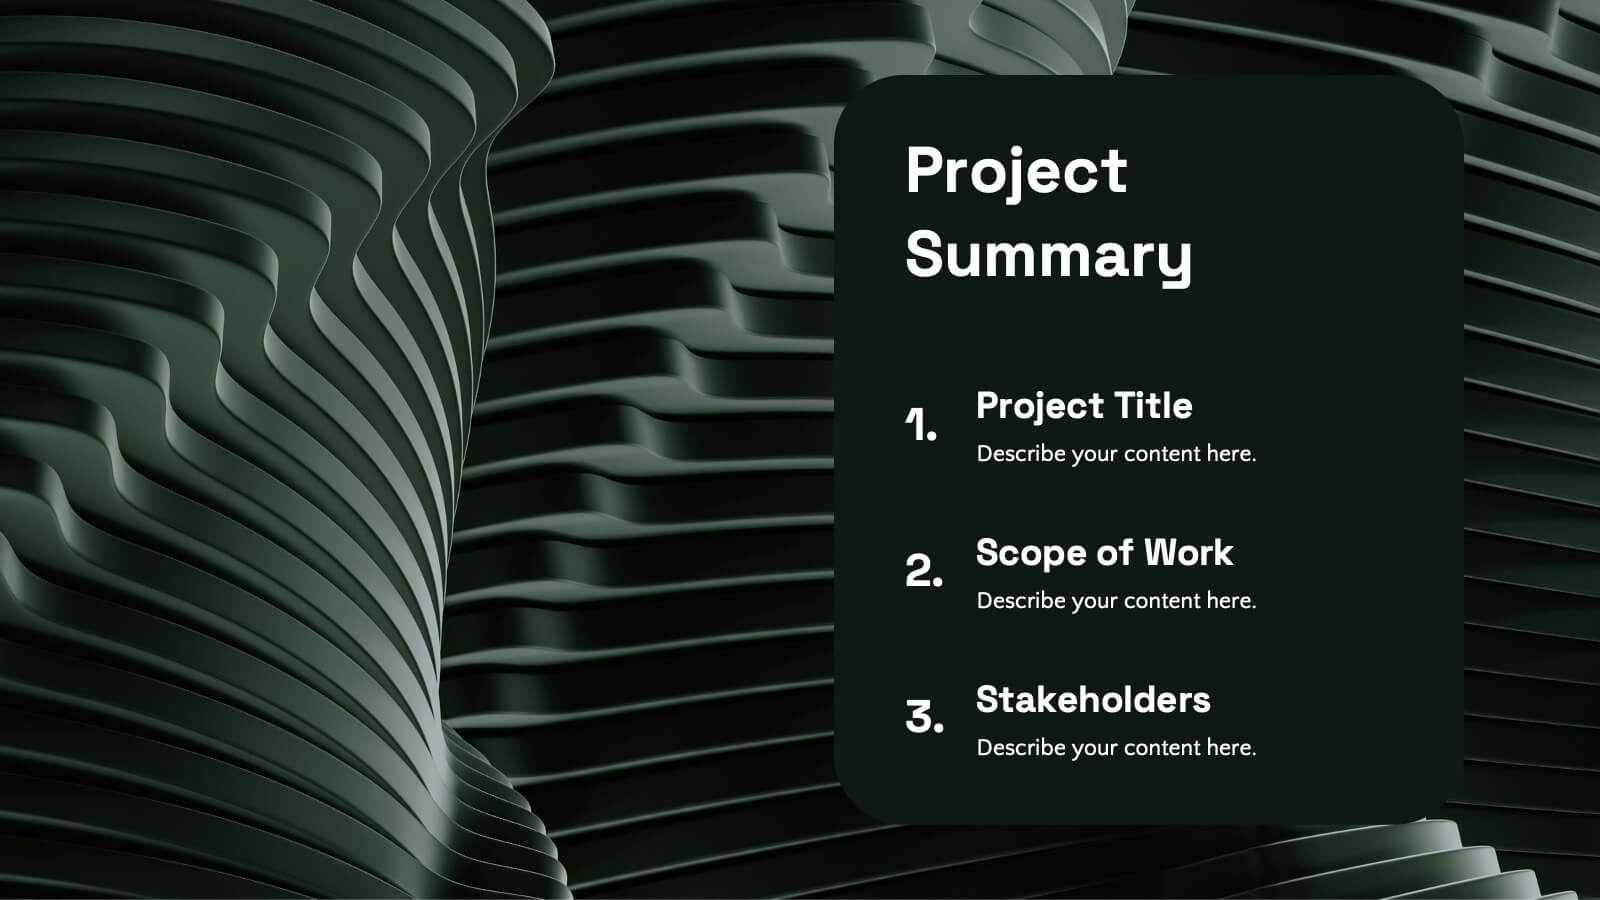
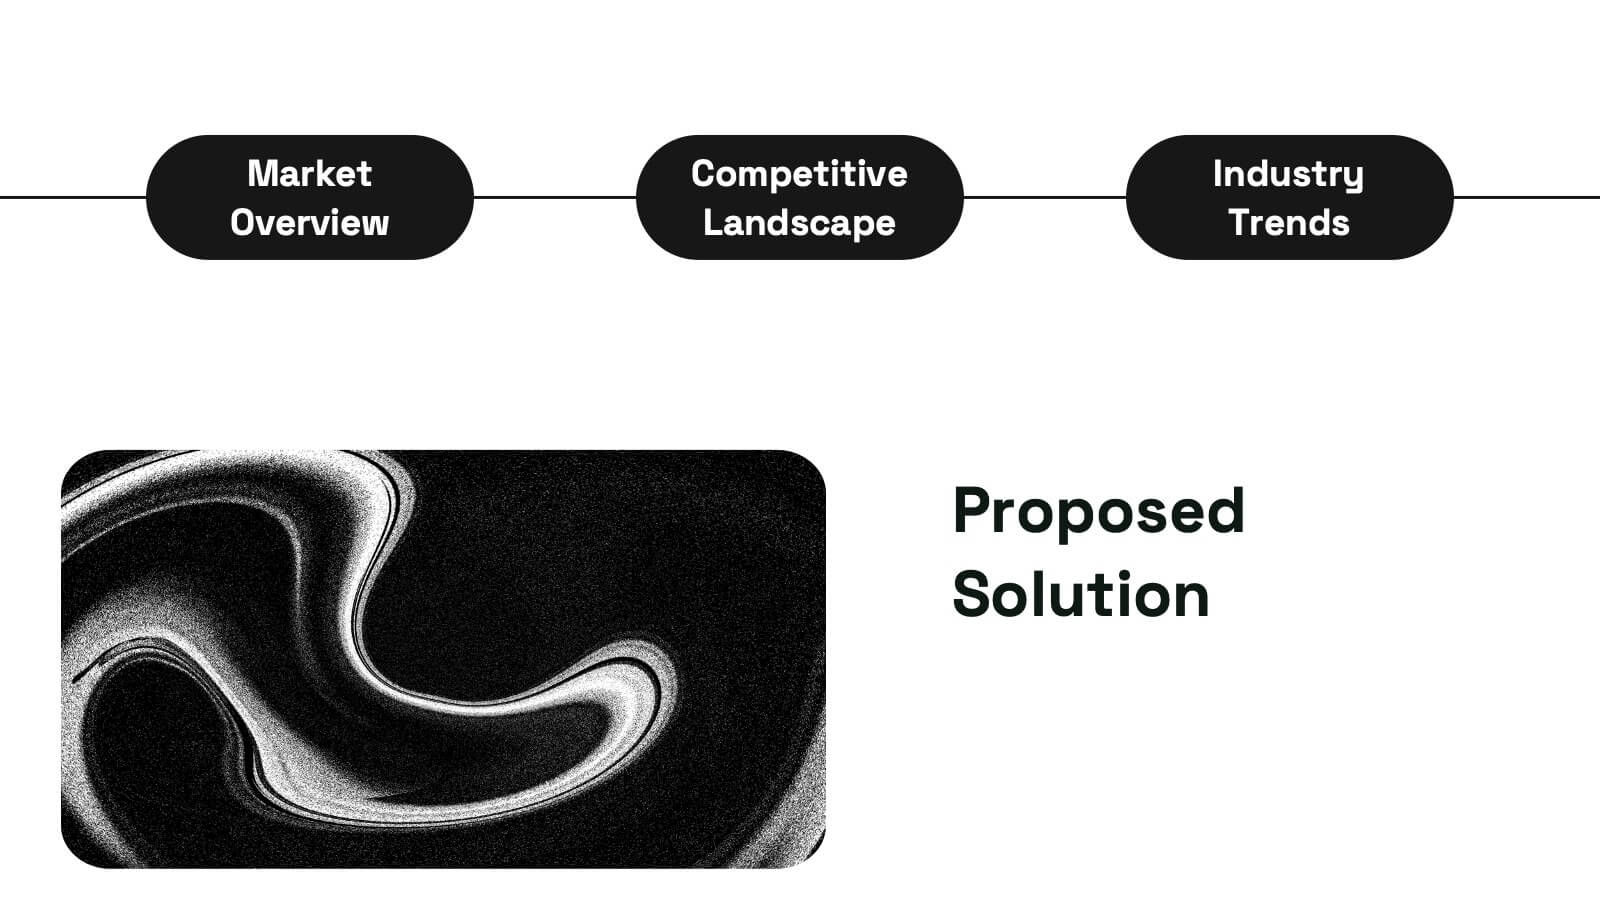
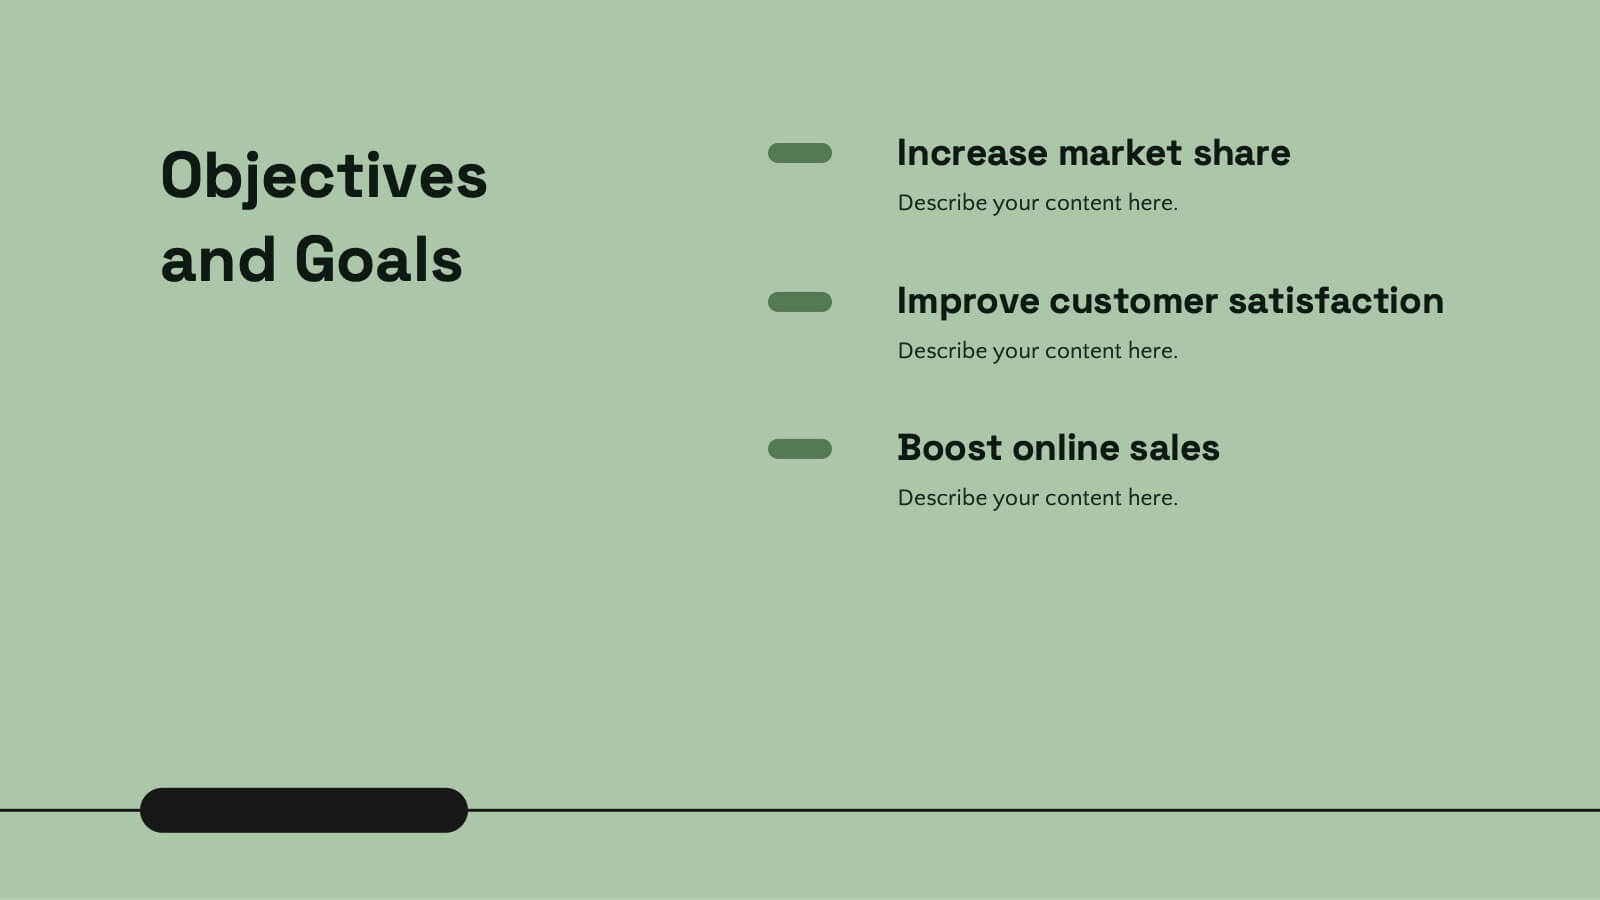
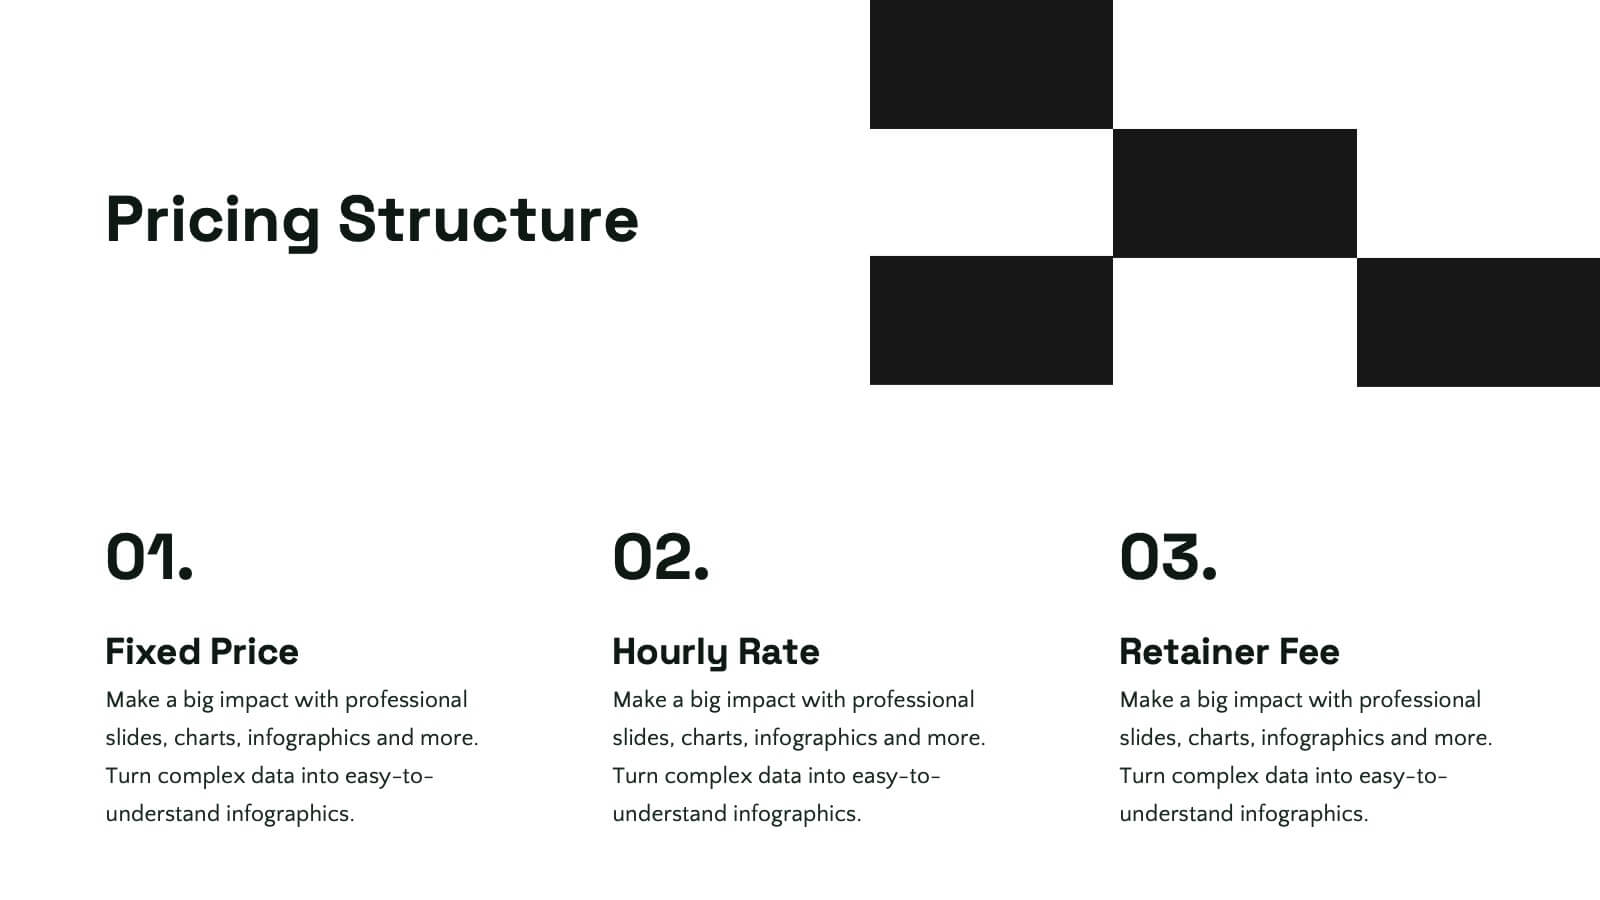
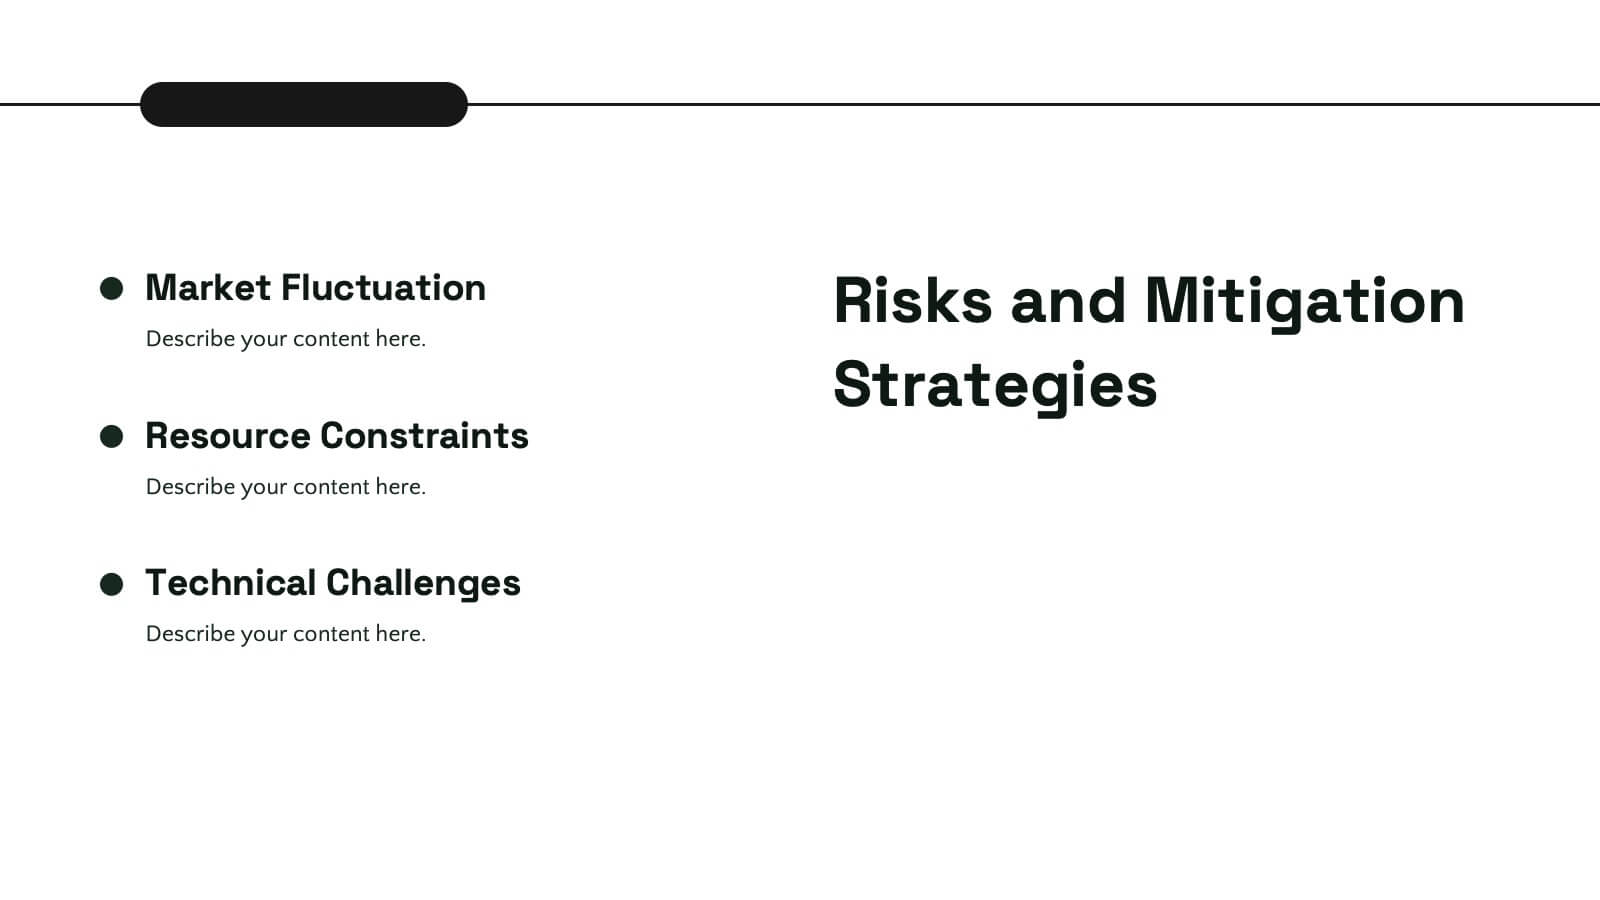
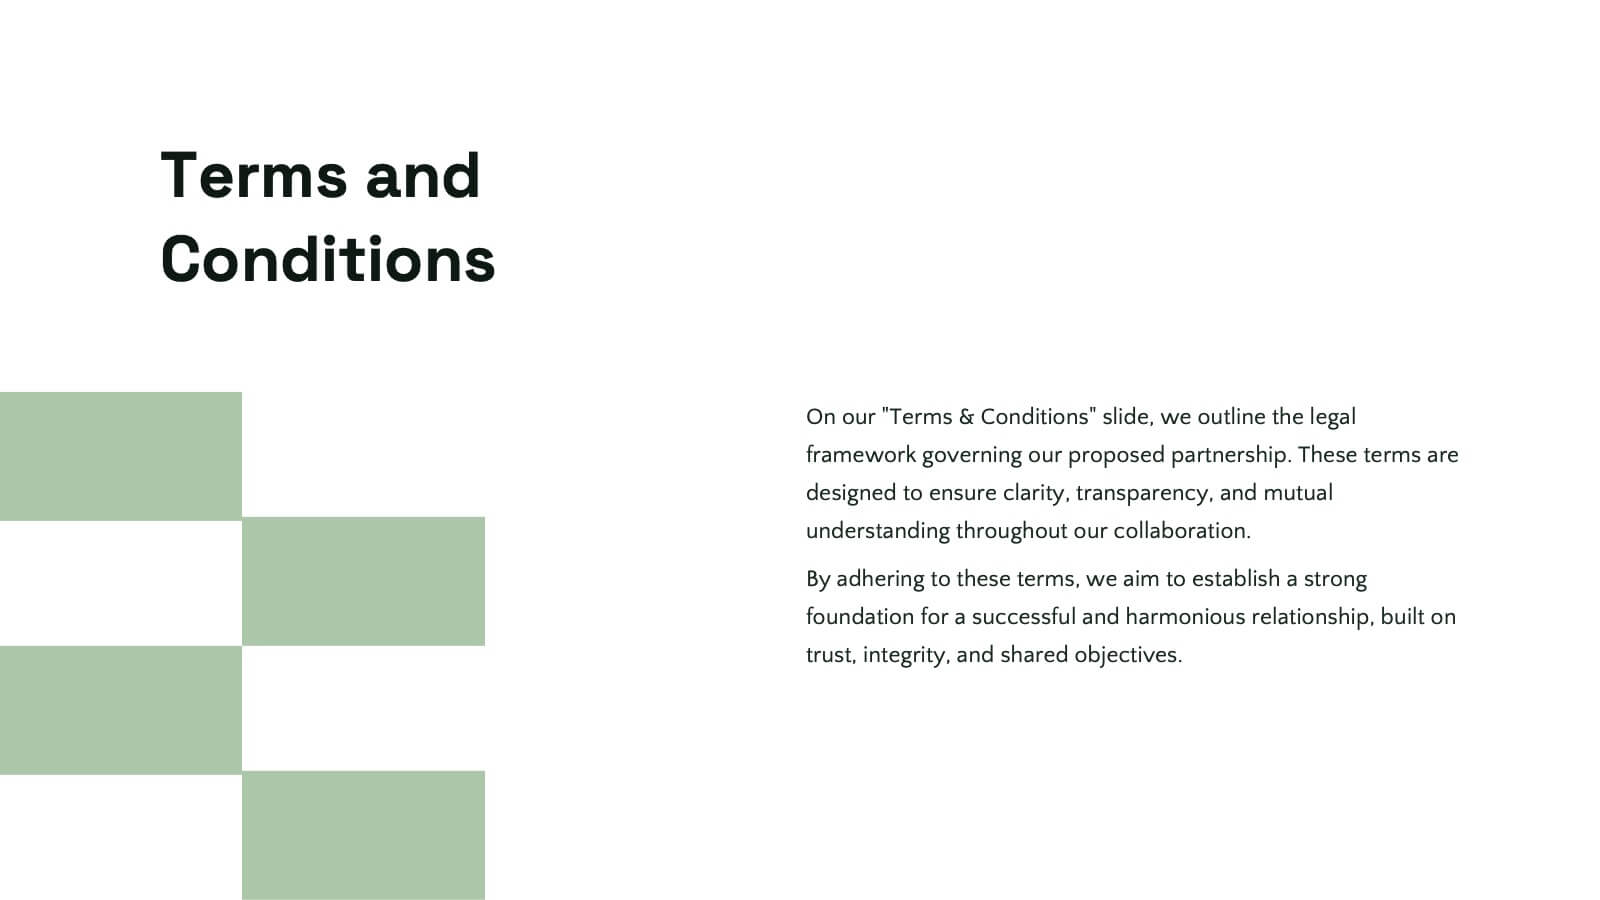
Rainshadow Digital Strategy Presentation
This Digital Strategy Presentation Template is designed to provide a structured approach to planning and implementing digital initiatives. Covering essential elements such as market trends, competitive analysis, value proposition, and risk management, it offers a professional framework to align goals with actionable steps. Fully customizable and compatible with PowerPoint, Keynote, and Google Slides.


4 diapositivas
Breast Cancer Research and Support
Shine a light on women's health initiatives with this impactful “Breast Cancer Research and Support” infographic slide. Featuring a symbolic visual shaped like a heart and ribbon, this layout is ideal for showcasing comparative stats, awareness milestones, or key messages about prevention and treatment. Use it to advocate, inform, or inspire—perfect for awareness campaigns, nonprofit reports, or healthcare presentations. Fully customizable in PowerPoint, Keynote, and Google Slides.


10 diapositivas
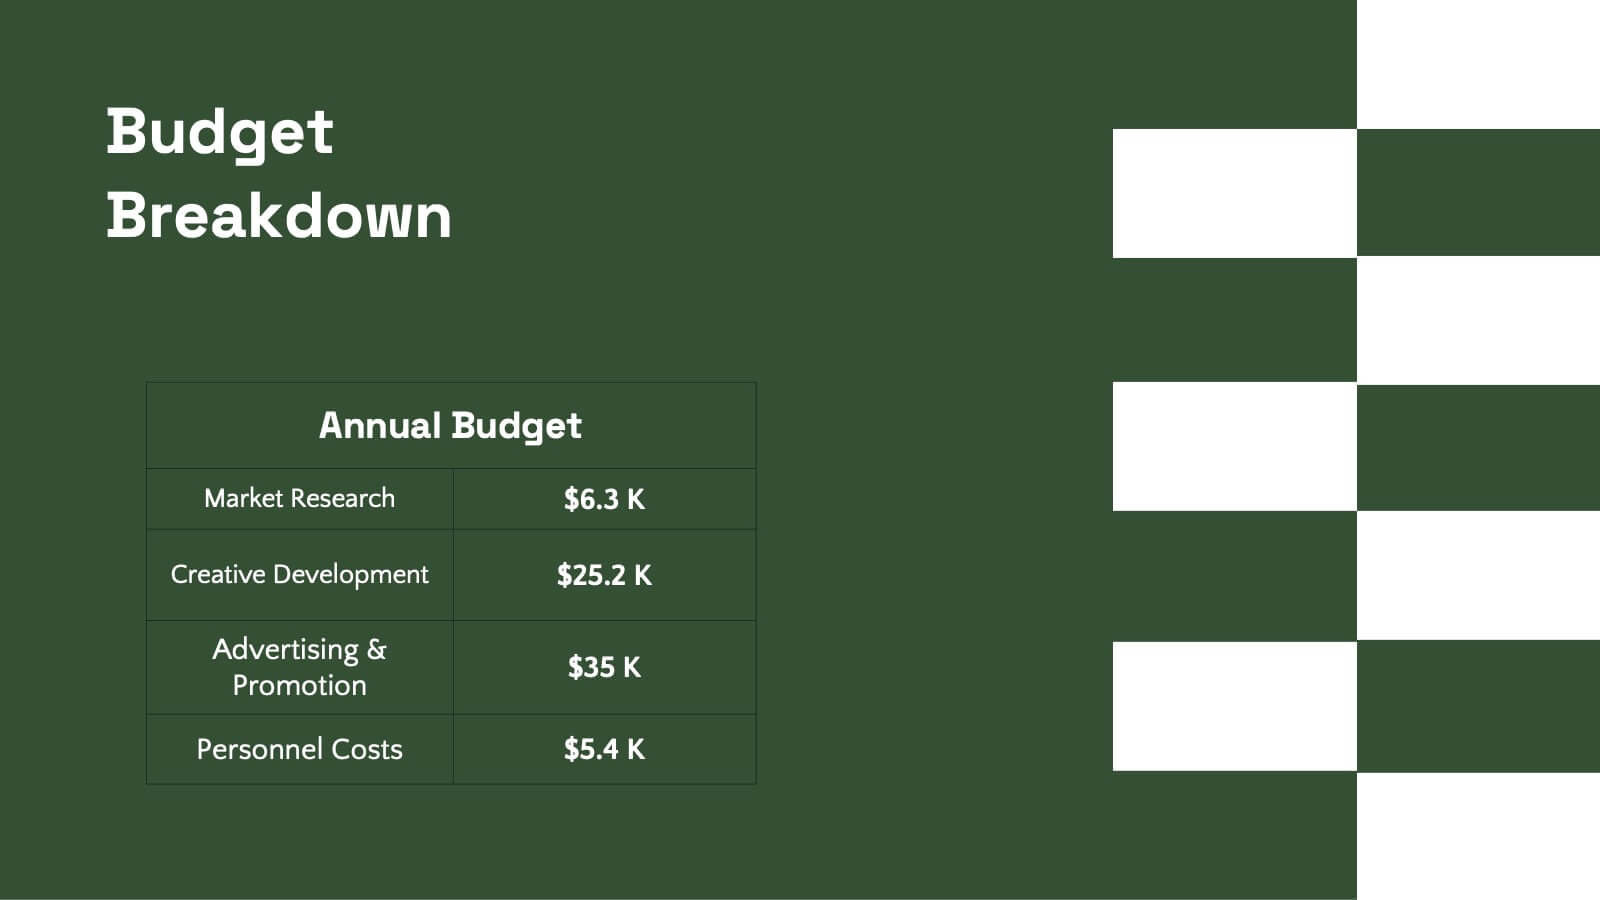
Project Budget Breakdown Presentation
The "Project Budget Breakdown Presentation" template offers a clear and efficient way to visualize budget allocations within a project. It uses a visually appealing color scheme that highlights four different budget segments, each represented by a different color to ensure quick readability and easy understanding. The template allows you to illustrate percentages and corresponding financial values, making it straightforward for stakeholders to grasp budget allocations at a glance. This template is highly beneficial for project managers, financial analysts, and business executives who need to present and discuss budgetary details clearly and concisely in project meetings or budget reviews. It is adaptable for use in various industries, including construction, IT, marketing, and research development, supporting effective budget management and transparency.


5 diapositivas
Foundation of Success Pillars Presentation
Dive into the structural essence of your enterprise with our engaging 'Foundation of Success Pillars' presentation template. Vividly illustrate the key components vital for organizational prosperity. Ideal for presenting corporate strategies and values. Compatible with PowerPoint, Keynote, and Google Slides, it's perfect for enhancing your presentation visuals.


26 diapositivas
Leyna Presentation Template
Leyna is an elegant and minimalist wedding planner presentation template. This wonderful presentation template will help couples know what all you’ll offer as a wedding planner. We have made it easy for you this this multipurpose template because you will be able to edit easily to make sure it fits what you need. We have built a clean, responsive and modern design for them to have a great experience on what they are looking for in the best way possible. This template provides a professional and clean design for your business or personal use. It's time to impress the potential clients!


3 diapositivas
Business Report Summary Slides Presentation
Kick off your report with a slide that feels clean, modern, and effortlessly clear. This presentation helps you summarize key insights, highlight performance updates, and present essential findings in a structured, visual format. It’s ideal for monthly reviews, strategy reports, and stakeholder updates. Fully compatible with PowerPoint, Keynote, and Google Slides.


5 diapositivas
Four-Step Customer Experience Framework Presentation
Showcase your customer journey with this sleek, step-by-step visual. Featuring a stair-step arrow design, it’s ideal for highlighting stages in user experience, onboarding, or service improvement. Each step is editable, with icons and titles for clarity. Compatible with PowerPoint, Keynote, and Google Slides—perfect for marketers, strategists, and CX professionals.


5 diapositivas
Infrastructure and Construction Industry
Showcase progress and performance metrics in the construction sector using this crane-themed, vertical bar chart design. Perfect for engineers, project managers, and developers, this slide uses color-coded scaffolding to illustrate percentages, growth, or completion rates. Fully editable in PowerPoint, Keynote, and Google Slides.


7 diapositivas
PESTEL Framework Business Presentation
The "PESTEL Framework Business" presentation effectively utilizes a segmented color scheme to categorize different environmental factors impacting business strategy: Political, Economic, Social, Technological, Environmental, and Legal. Each segment is color-coded and designated space for text, making it easy to highlight how each factor can influence business operations and decision-making processes. This visual arrangement not only aids in easy comprehension but also allows for a systematic review of external factors, essential for strategic planning.


19 diapositivas
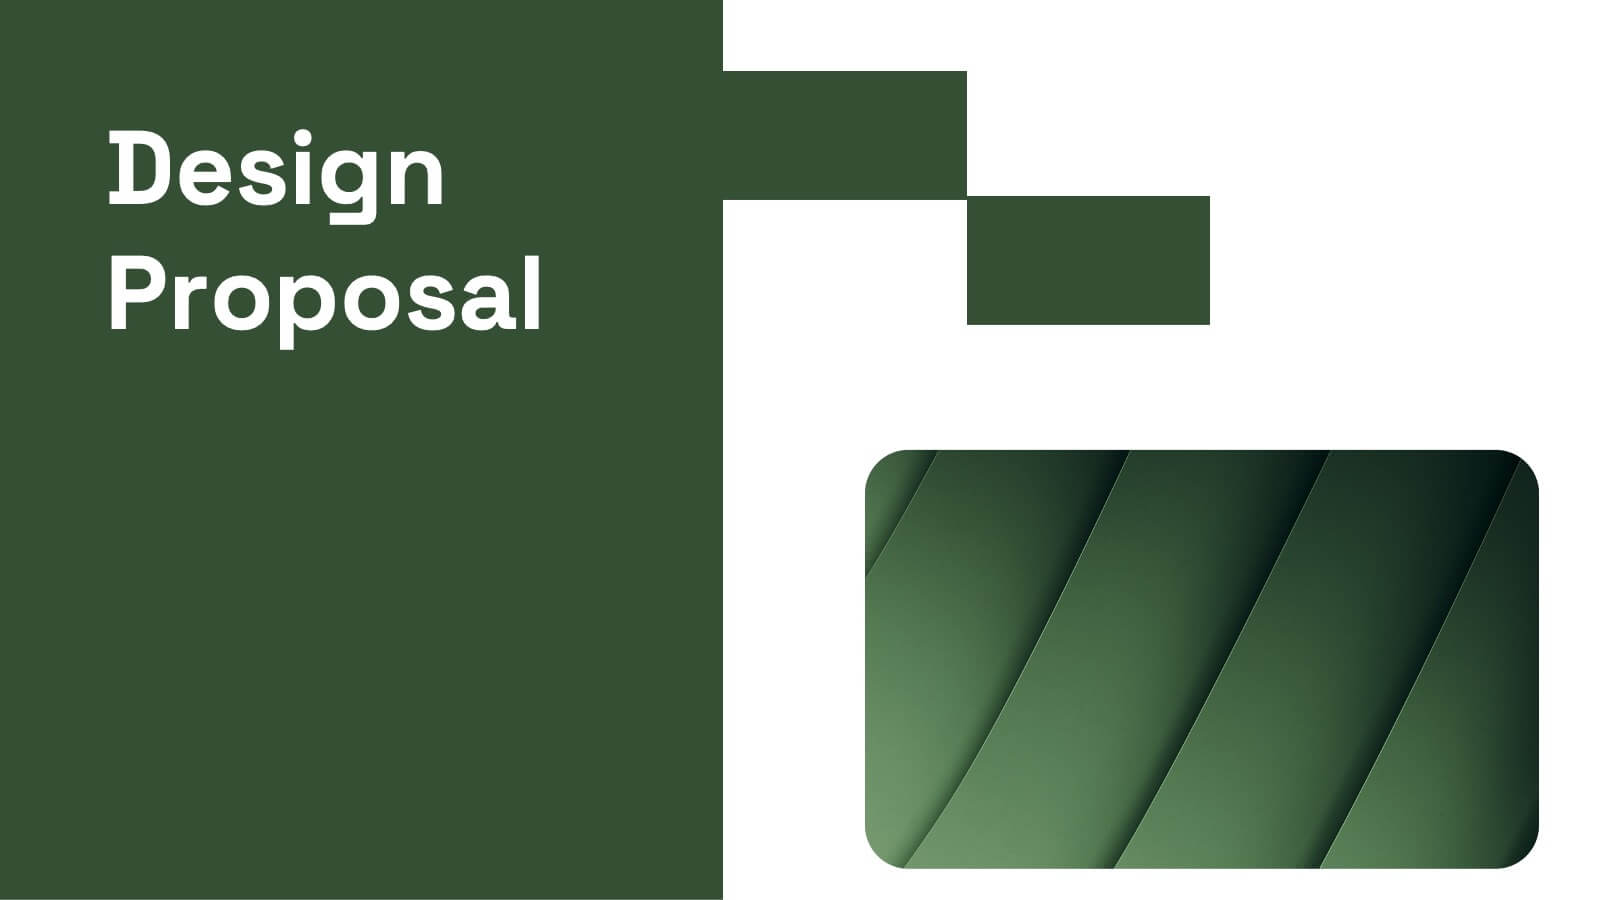
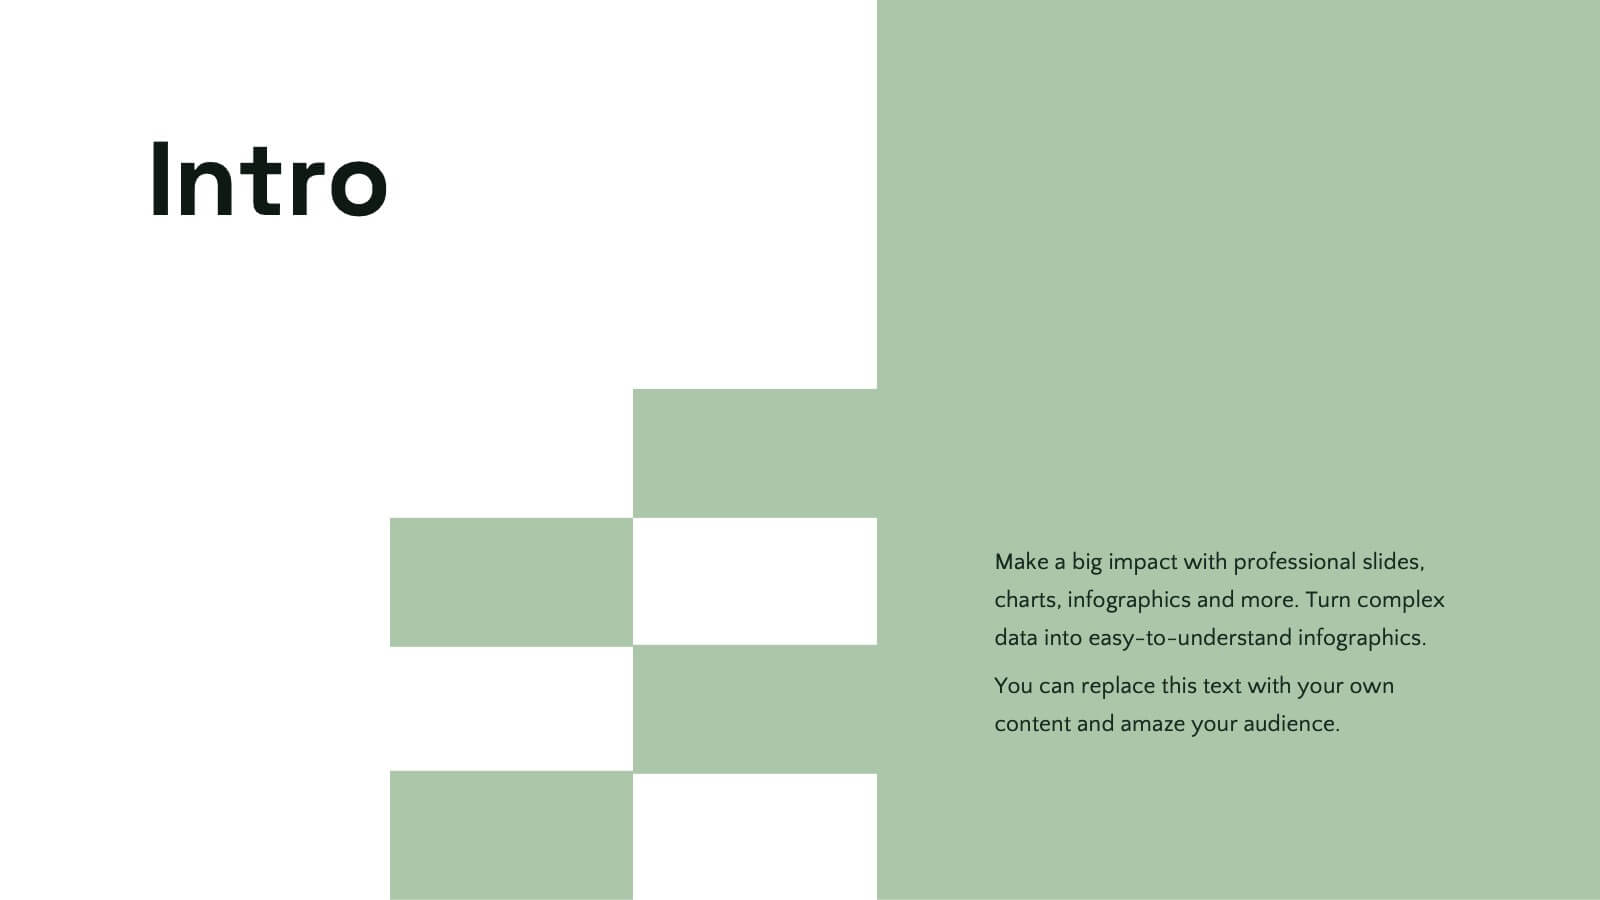
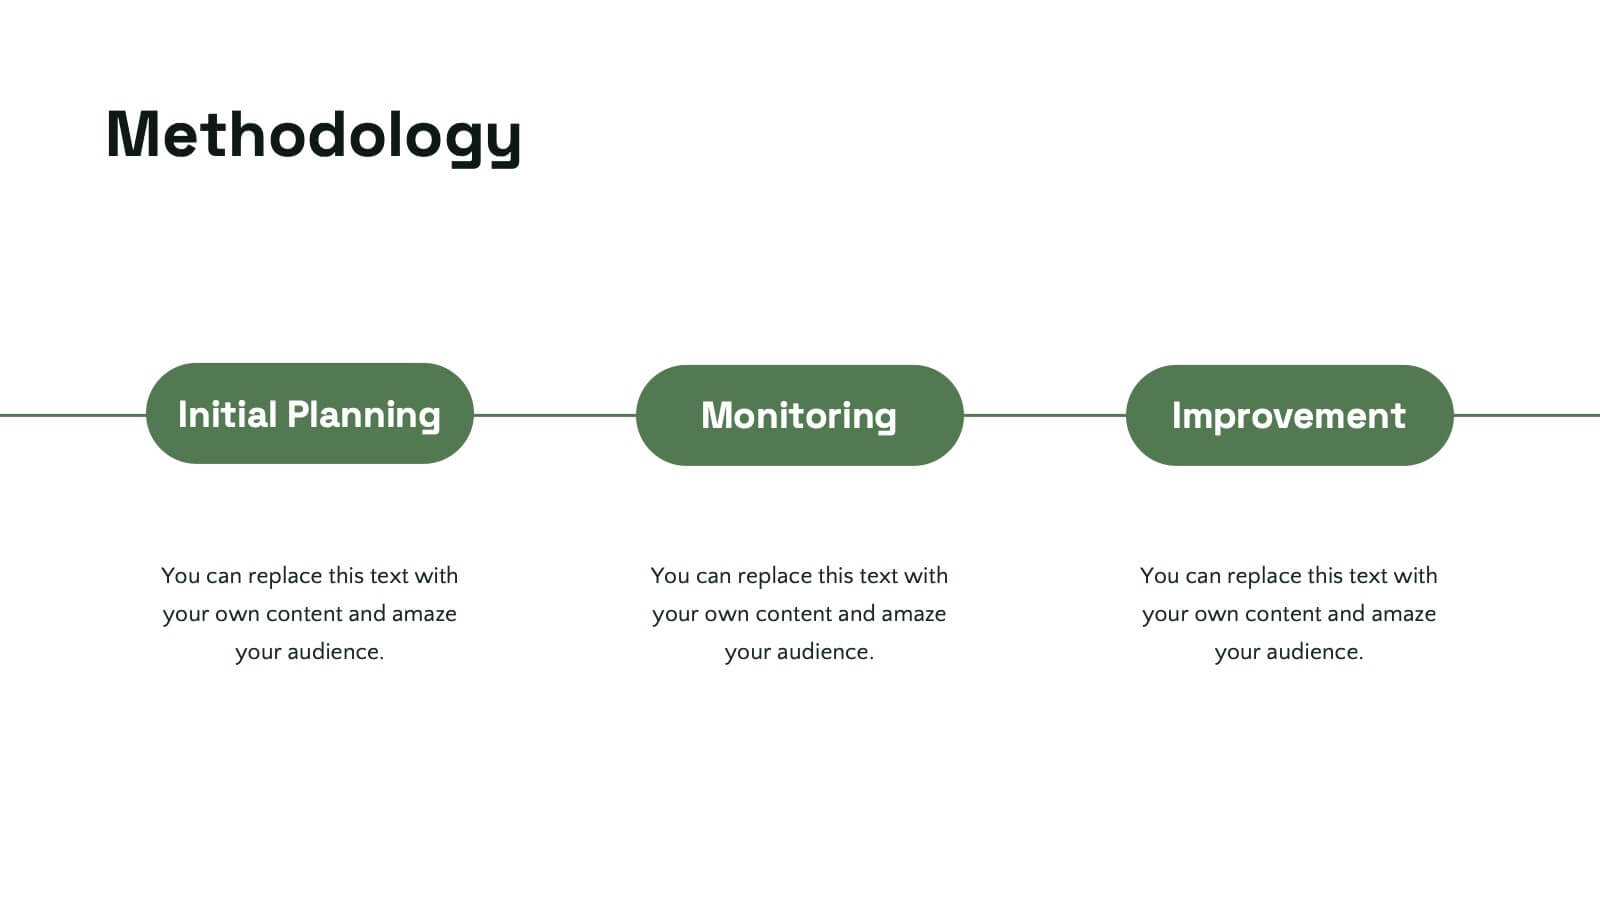
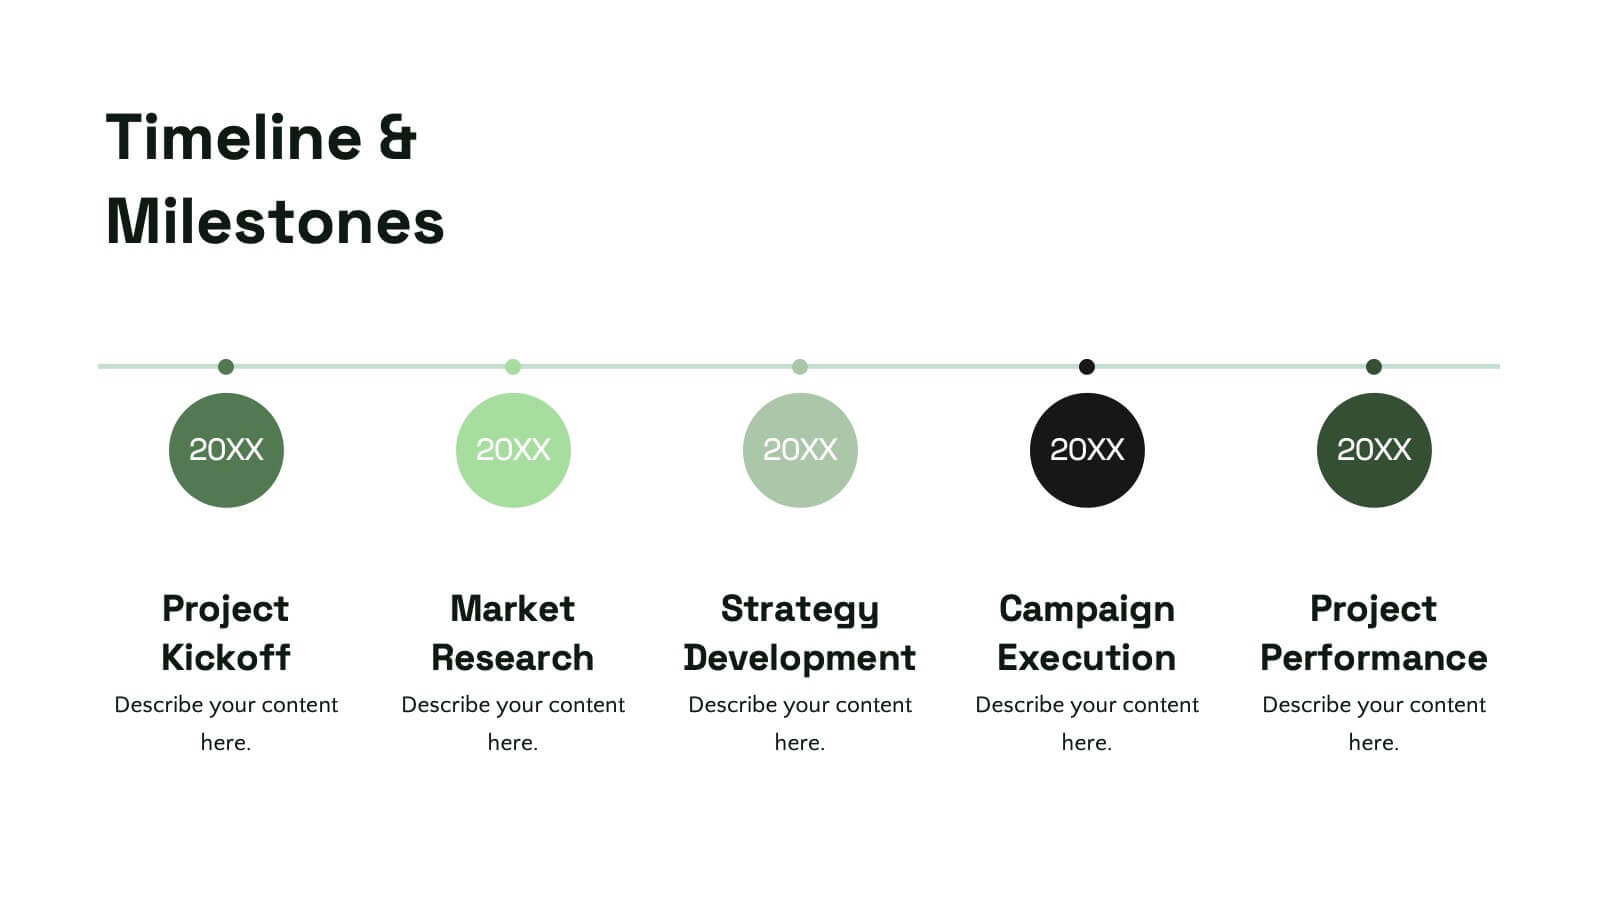
Tidal Design Proposal Presentation
Elevate your pitch with this sleek design proposal template! Perfect for presenting project details, objectives, methodology, and milestones, it ensures your ideas stand out. Impress stakeholders with clear, structured slides and professional aesthetics. Compatible with PowerPoint, Keynote, and Google Slides for a seamless presentation experience across all platforms.


4 diapositivas
Digital Education and Online Learning Tools Presentation
Bring your audience straight into the world of modern learning with a clear, engaging layout that highlights essential digital tools and online teaching methods. This presentation breaks down key platforms, features, and benefits in a simple visual flow that’s easy to follow. Fully compatible with PowerPoint, Keynote, and Google Slides.


7 diapositivas
Demographic Segmentation Infographic Presentation
A Demographic Infographic is designed to provide a quick and easy-to-understand snapshot of the key demographic trends and insights. This Template is easy to edit and intuitive, so you can create a stunning presentation in minutes. With this template, you can focus on your content and the design. It's a multipurpose template which means it can be used for different topics: business, education, marketing, and more. You can use this as a template to explain concepts related to your studies, statistics or market research. This template is compatible with Powerpoint, Keynote and Google Slides.


6 diapositivas
World Market Presence and Expansion Map Presentation
Showcase your company’s global footprint with this World Market Presence and Expansion Map. Visually highlight key regions, market activity, or strategic territories. Perfect for investor decks, global overviews, or international growth strategies. Fully editable in PowerPoint, Keynote, and Google Slides for seamless integration into your professional presentation workflow.