


Características


¿Tienes alguna pregunta?
Recomendar


5 diapositivas
Product Life Cycle Stages Presentation
Explore the 'Product Life Cycle Stages' with this concise presentation template. Perfect for marketing professionals and product managers, it outlines the product journey from introduction to decline. Enhance your strategy discussions using this template, compatible with PowerPoint, Keynote, and Google Slides.


7 diapositivas
College Statistics Infographic Presentation
A College Statistics Infographic is a visual representation of key data and statistics related to a college. This template can provide a quick and easy-to-understand overview of various aspects of the institution, such as enrollment figures, graduation rates, student demographics, and academic performance metrics. Featured are icons, illustrations, diagrams, and other design elements to enhance the visual appeal of this infographic and make it more engaging for your viewers. This template can be a useful tool for students, teachers, and others interested in learning more about a college.


5 diapositivas
Project Boundaries and Deliverables Presentation
Visualize key checkpoints with the Project Boundaries and Deliverables Presentation. This flag-style timeline infographic clearly marks each phase of your project journey—ideal for outlining scope, goals, and delivery milestones. Designed for clarity and progress tracking, this template works seamlessly in PowerPoint, Keynote, and Google Slides.


7 diapositivas
Investment Group Infographic
An investment group, is a collective of individuals or entities that pool their financial resources to invest in various financial instruments or assets. This infographic template is a high-octane journey through the dynamic world of investments, designed to empower and energize your financial understanding. Prepare to take you audience through a thrilling ride through the investment cosmos, where your money takes center stage and financial growth is the ultimate goal. This Investment Infographic isn't just about numbers and charts, it's a thrilling expedition through the realms of finance.


12 diapositivas
Digital Marketing Strategy Presentations
Turn complex campaigns into captivating visuals with this modern, data-driven layout designed for marketing professionals. Perfect for outlining strategies, performance metrics, and digital funnels, it keeps information clear and visually engaging. Easily customizable and fully compatible with PowerPoint, Keynote, and Google Slides for seamless editing across your favorite platforms.


23 diapositivas
Night Slash UX Strategy Plan Presentation
Elevate your UX/UI design presentations with the Night Slate UX Strategy Plan template! This dynamic and visually striking design is perfect for conveying your strategic ideas with impact. The bold use of contrasting black and orange creates a modern and energetic vibe, making your content stand out. Each slide is thoughtfully designed to cover every aspect of your UX/UI strategy, from user research and personas to prototyping and user testing. The template includes sections on design principles, wireframes, and responsive design, ensuring that your audience gains a comprehensive understanding of your approach. Whether you're presenting to stakeholders or guiding a design team, this template is designed to keep your audience engaged and informed. Fully compatible with PowerPoint, Keynote, and Google Slides, the Night Slate template is your go-to tool for delivering compelling UX/UI strategy presentations that leave a lasting impression.


7 diapositivas
Aviation School Infographic Presentation
If you're in search of striking visuals for your upcoming aviation school presentation, we've got just the solution for you. Our expertly crafted infographic template is designed to captivate and engage your audience, ensuring that your message is conveyed with maximum impact. Our template covers a diverse range of aviation topics, including airport and runway security. This guarantees that your information is presented in a clear, concise, and visually compelling manner. With our aviation infographic template, you'll be able to deliver an outstanding presentation that resonates with your audience and leaves a lasting impression.


4 diapositivas
Personal and Business Insurance Plans
Clearly present your insurance tiers with this easy-to-read comparison layout. Ideal for showcasing plan options for individuals, families, and businesses, this template highlights pricing, benefits, and coverage icons side-by-side. Clean and professional, it’s fully editable in PowerPoint, Keynote, and Google Slides.


23 diapositivas
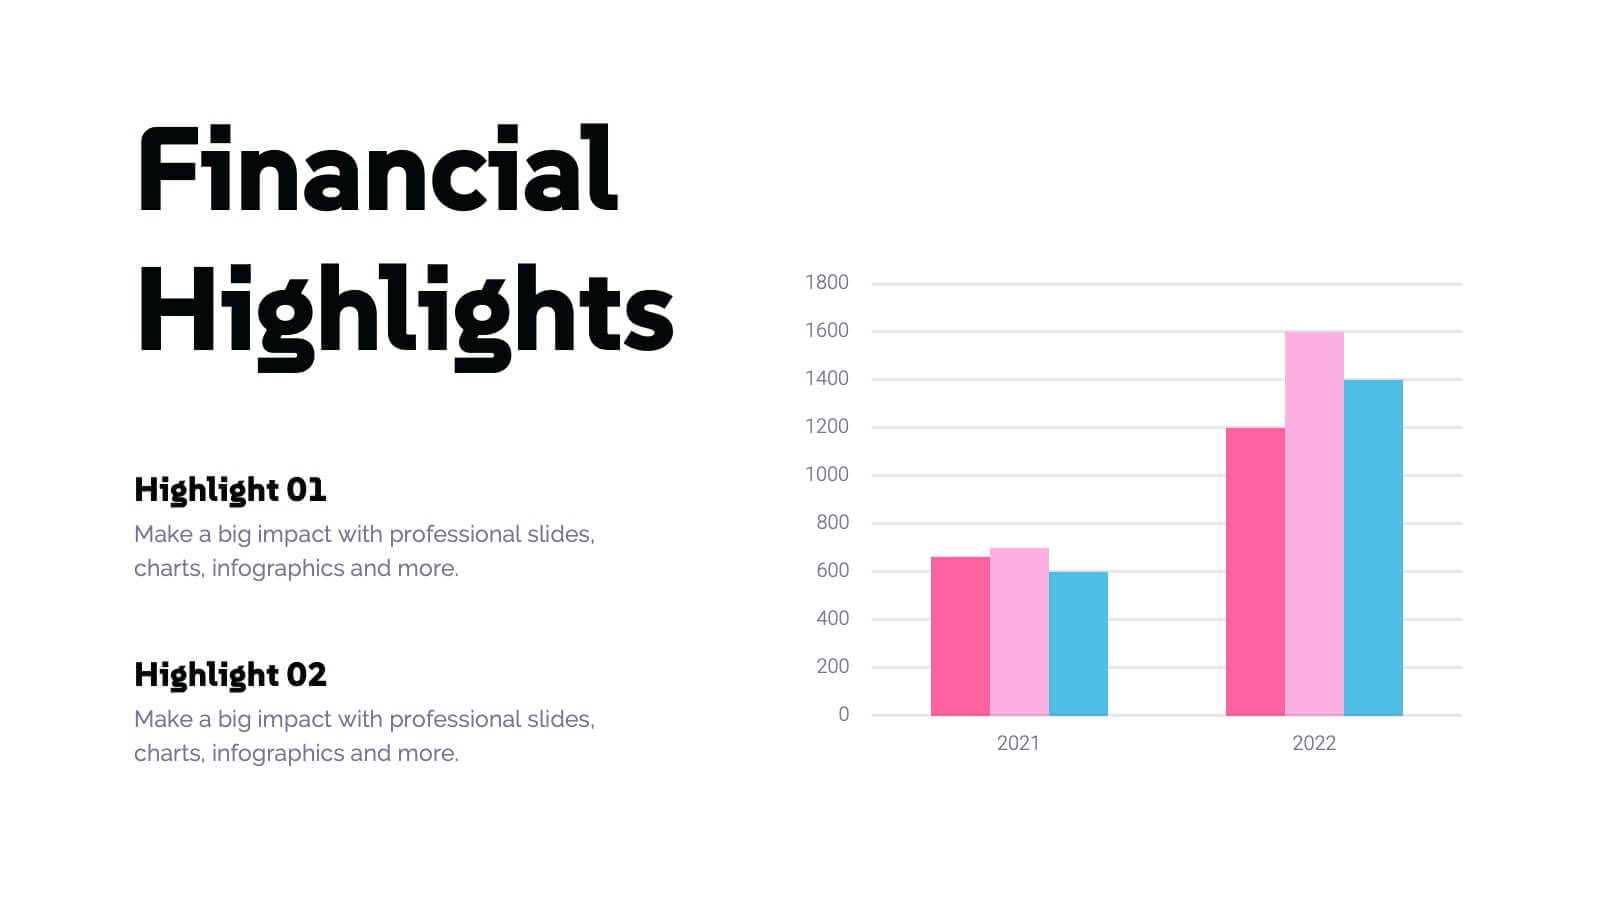
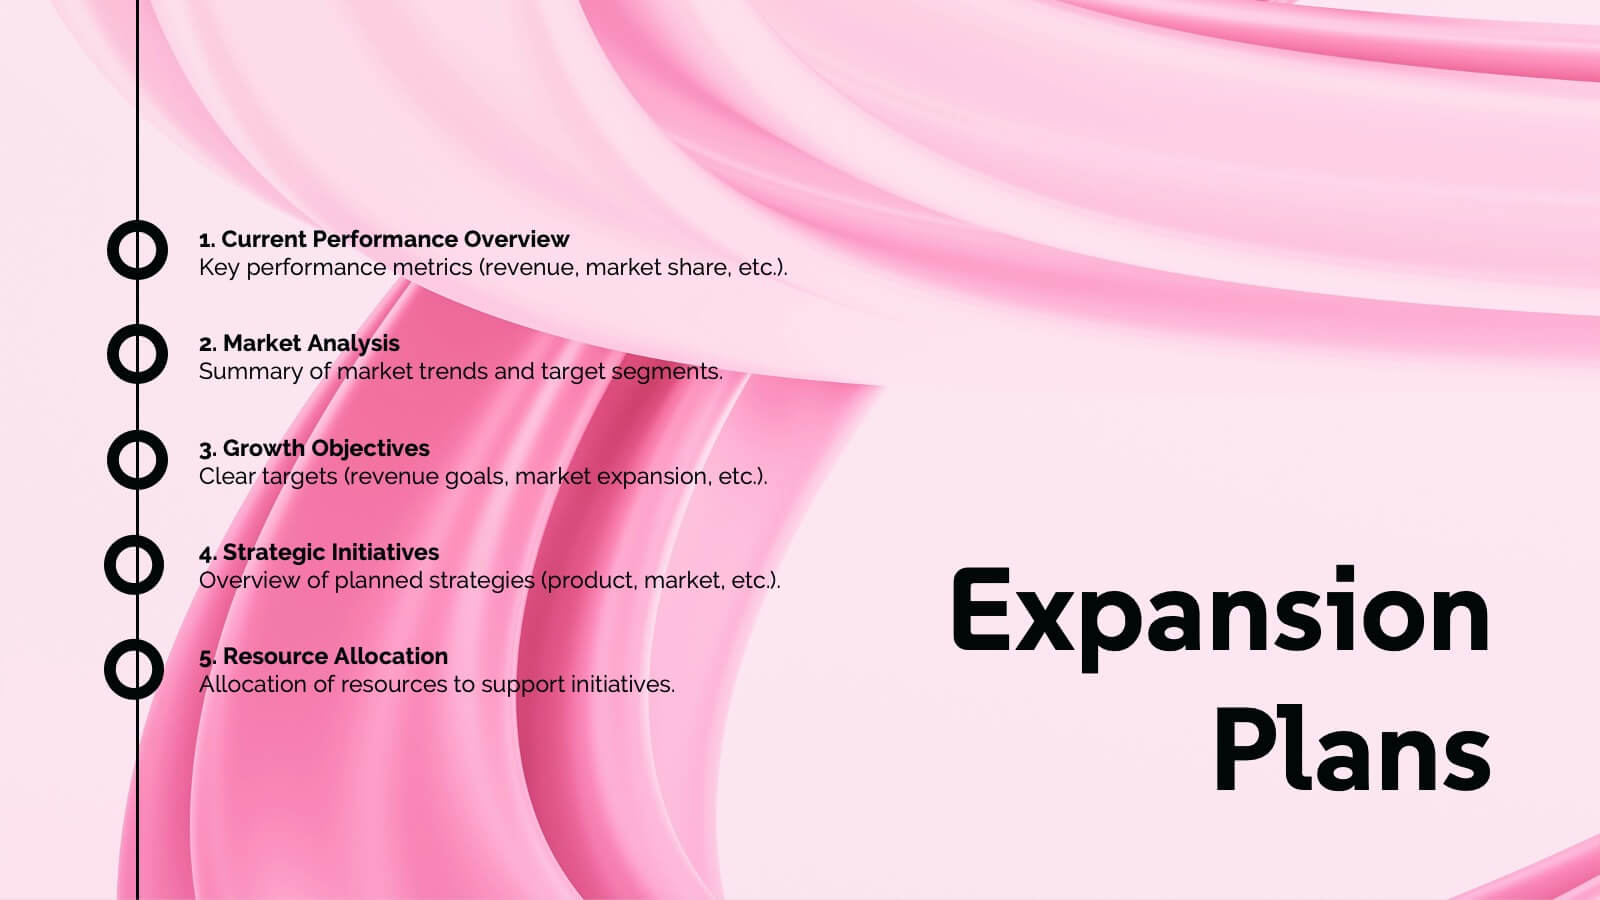
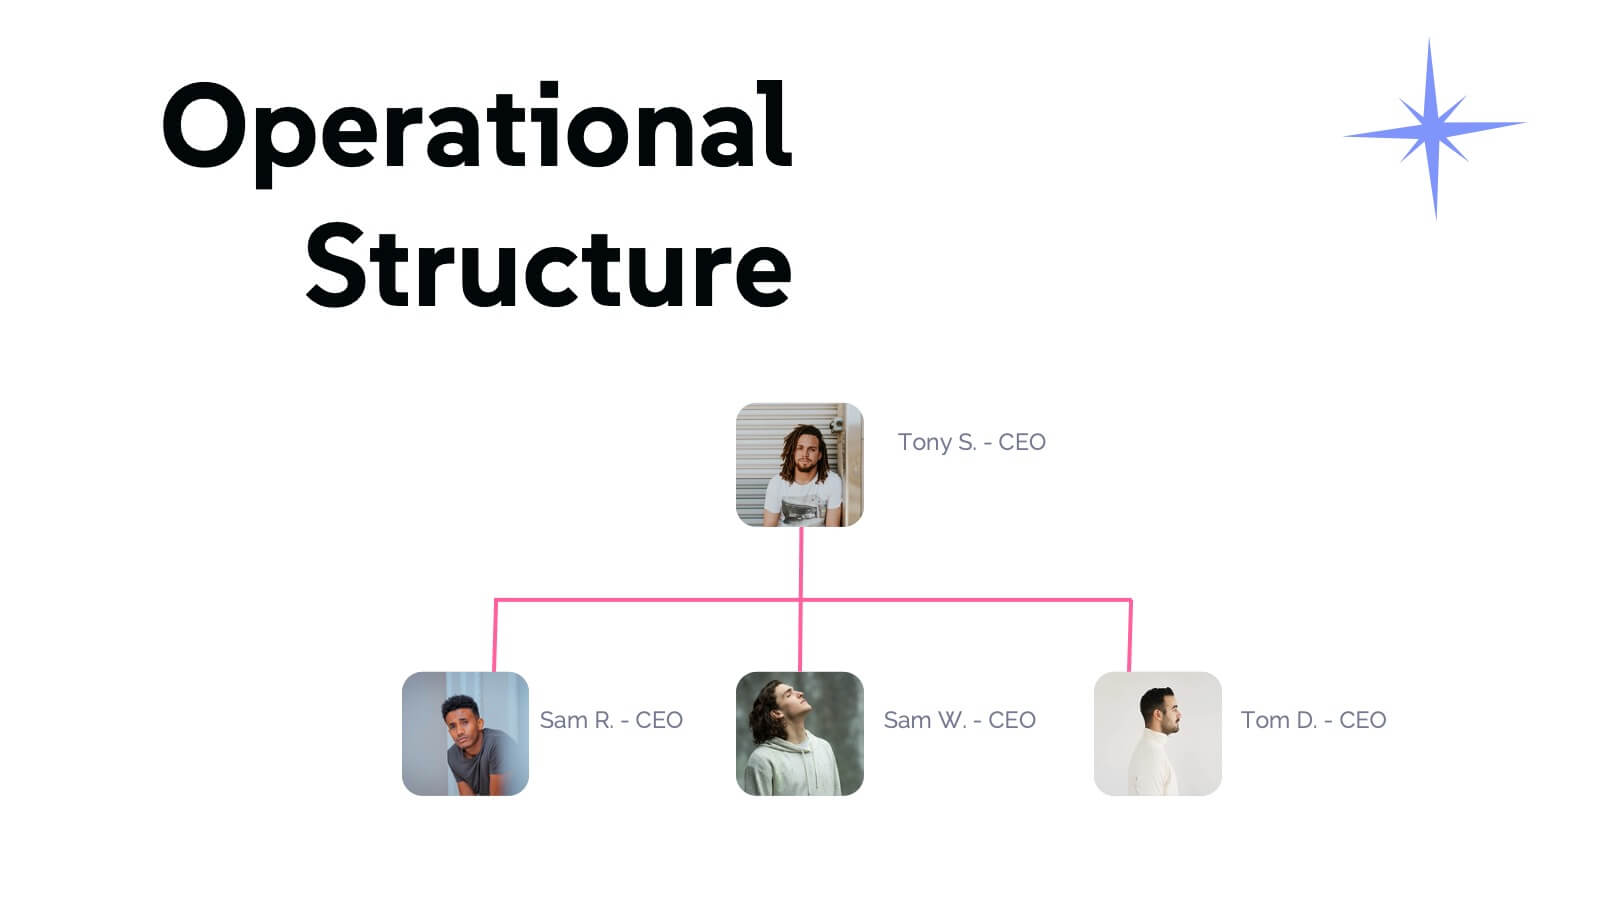
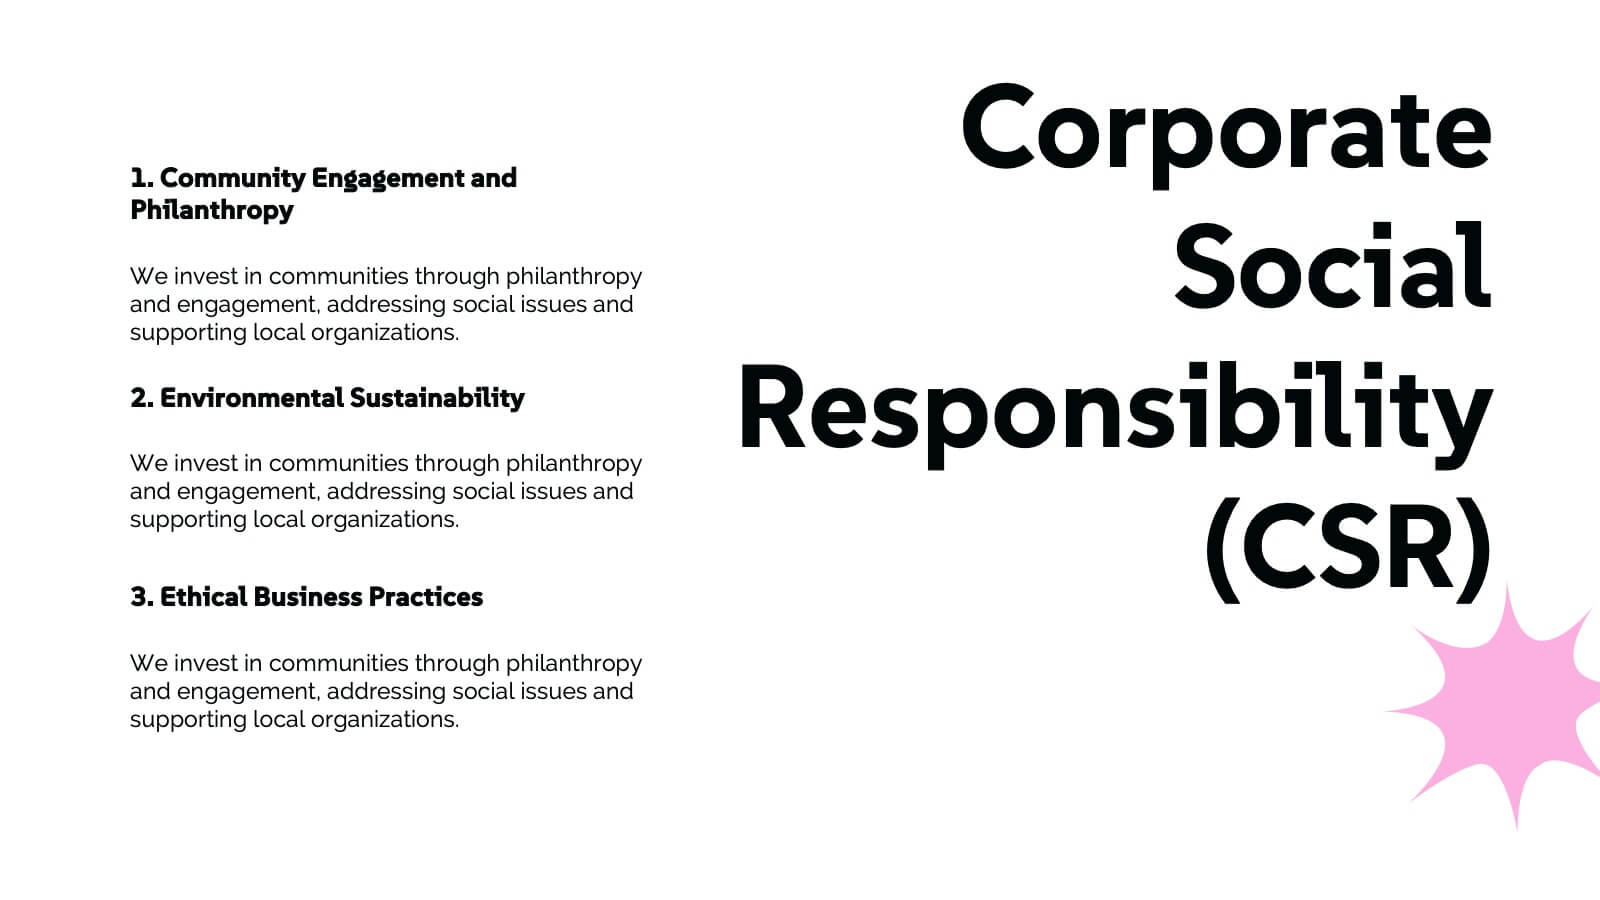
Wave Small Business Pitch Deck Presentation
This business pitch deck is your key to winning over investors! It covers everything from company background and product overview to SWOT analysis and market opportunity. With clear visuals of financial performance and strategic goals, this deck provides the perfect roadmap for success. Ideal for PowerPoint, Keynote, and Google Slides presentations!


5 diapositivas
Risk Assessment Heat Map Presentation
Evaluate risks effectively with a structured heat map. This Risk Assessment Heat Map helps visualize potential threats by mapping probability and impact levels. Ideal for risk management, business continuity planning, and decision-making. Fully customizable and compatible with PowerPoint, Keynote, and Google Slides for professional and seamless integration.


7 diapositivas
Liability Insurance Infographic
Liability insurance is a type of insurance that provides coverage and protection to individuals and businesses against the risk of being sued and held legally liable for injuries, damages, or losses caused to other individuals or entities. This template is your roadmap to understanding the vital realm of liability insurance, a shield against unexpected financial risks. Compatible with Powerpoint, Keynote, and Google Slides. It lays out the crucial aspects of liability insurance in a clear and engaging manner, ensuring you're well-equipped to protect yourself or your business.


5 diapositivas
Environment Articles Infographic
The Environment is important for a number of reasons, it is essential that we take care of it and minimize our impact on it. This vertical Infographic is a visual representations of information related to environmental topics, presented in a vertical format. These infographics are designed to effectively communicate key facts, statistics, and concepts about the environment in a visually appealing and easily digestible manner. This consist of a series of vertically arranged sections or columns, each containing relevant information and visuals. These sections can cover a wide range of environmental topics, such as climate change, renewable energy, pollution, and sustainable practices.


18 diapositivas
Riftbound Creative Design Report Presentation
Unleash your creative vision with this beautifully structured design presentation! It covers essential aspects like concept development, typography, moodboards, wireframes, and final design, ensuring a comprehensive journey from idea to execution. Perfect for creative teams or client presentations, this template is fully compatible with PowerPoint, Keynote, and Google Slides.


5 diapositivas
Ishikawa Fishbone Diagram Presentation
Bring clarity to problem-solving with a visual that makes root-cause analysis feel simple and intuitive. This presentation helps you map issues, organize insights, and highlight contributing factors with clean, structured design. Perfect for workshops, audits, and process improvement. Fully compatible with PowerPoint, Keynote, and Google Slides.


5 diapositivas
Step-by-Step Flow Diagram Presentation
Bring clarity to every stage of your process with a clean, easy-to-follow visual path that guides your audience step by step. This presentation helps simplify workflows, instructions, and project milestones in a structured, approachable layout. Fully compatible with PowerPoint, Keynote, and Google Slides.


21 diapositivas
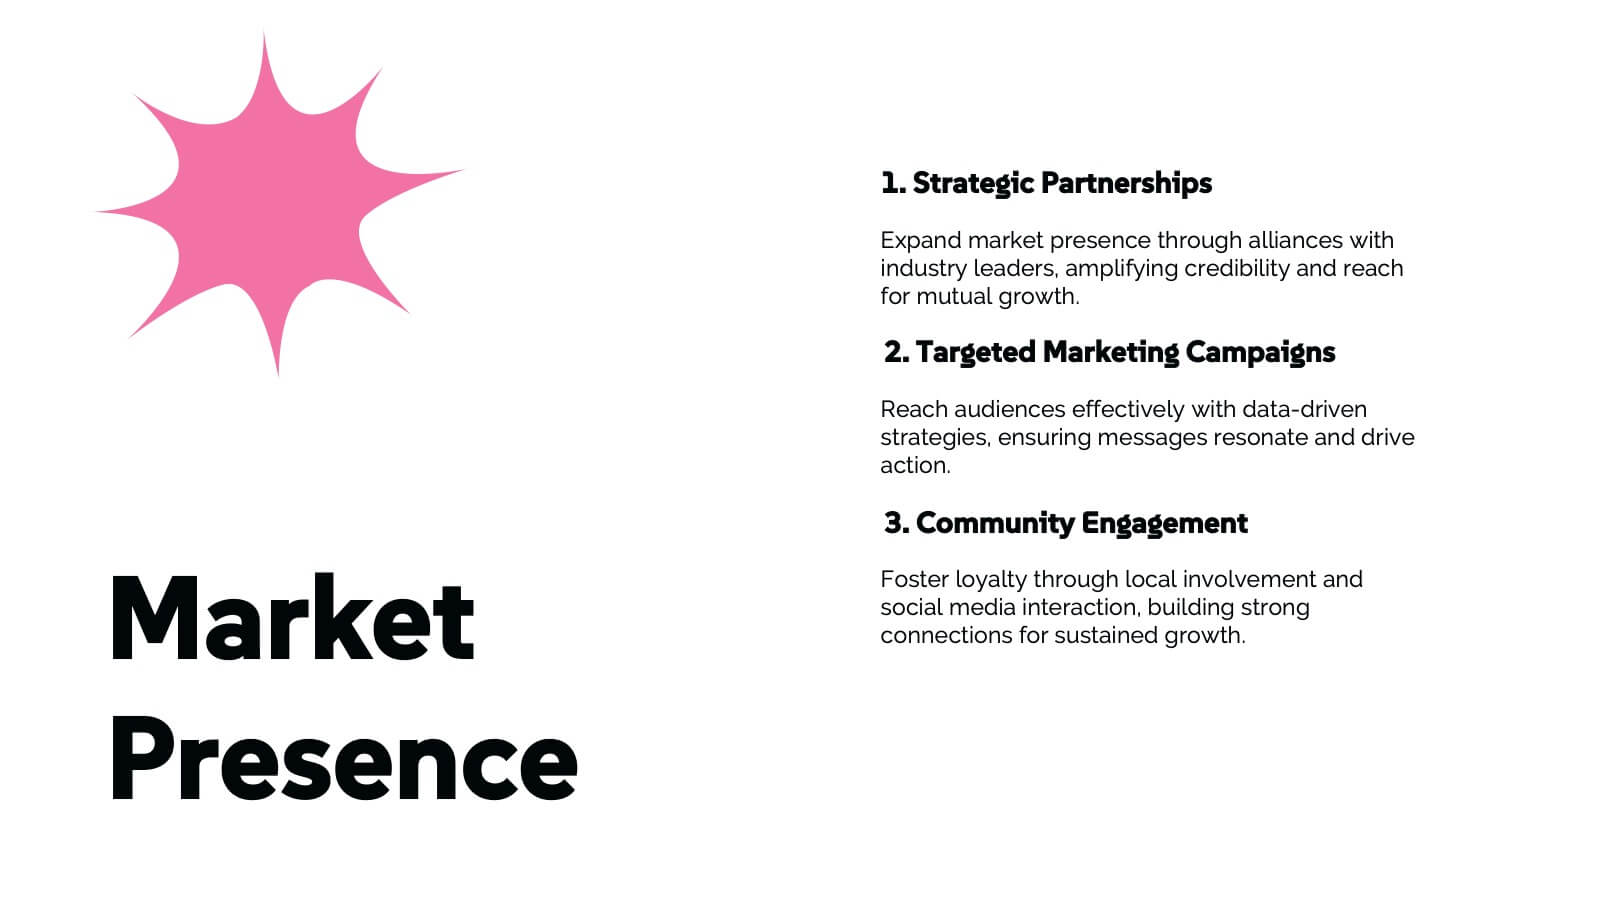
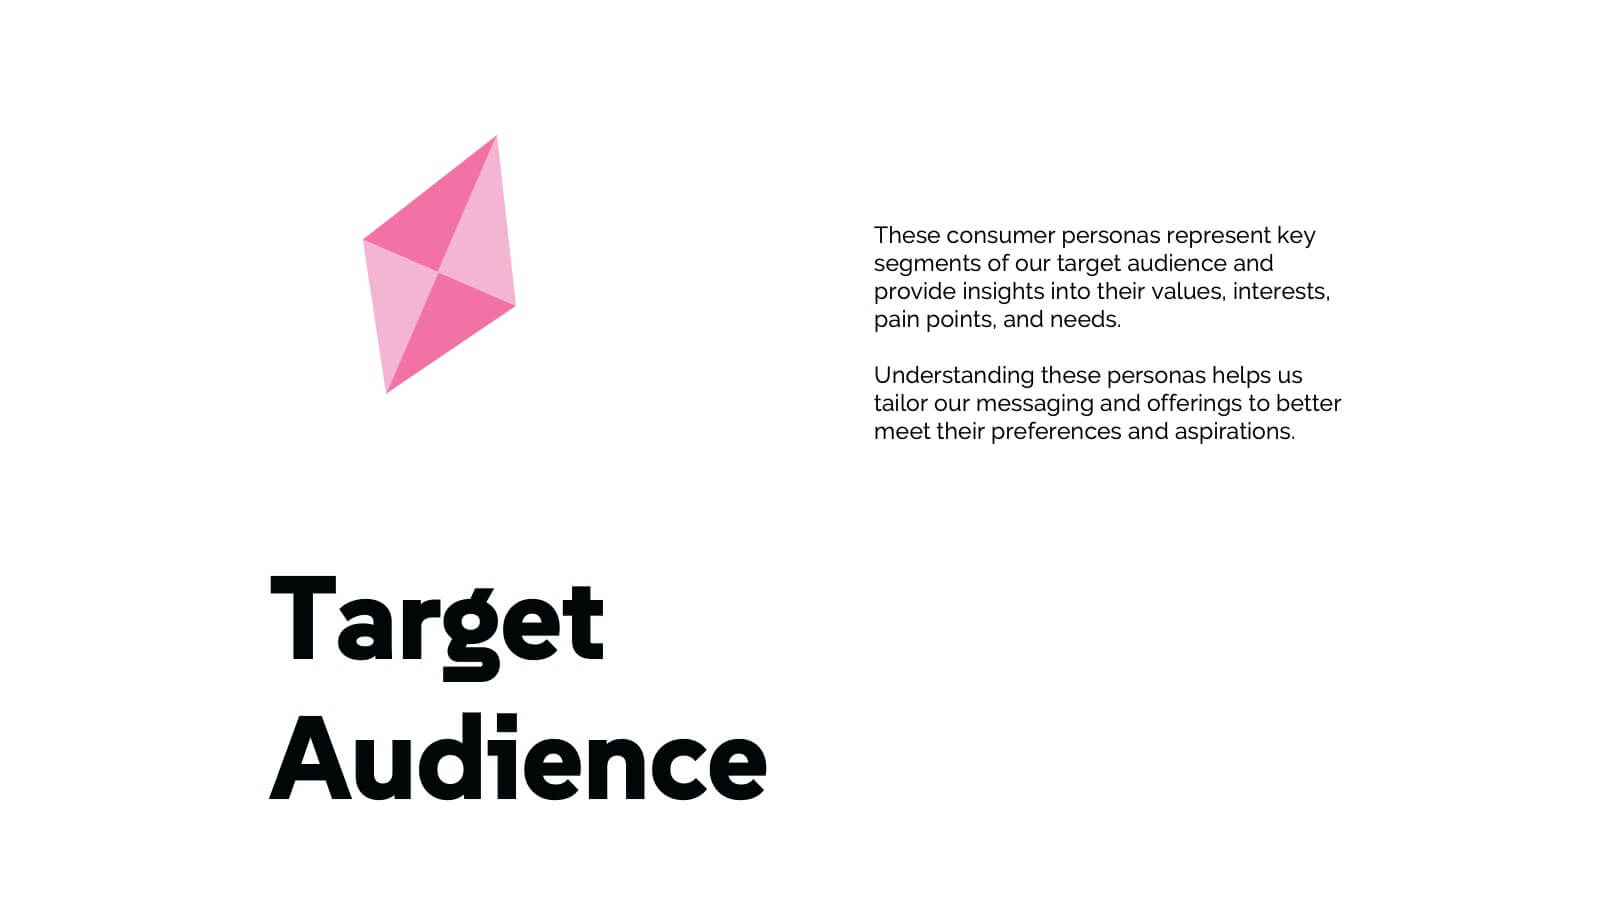
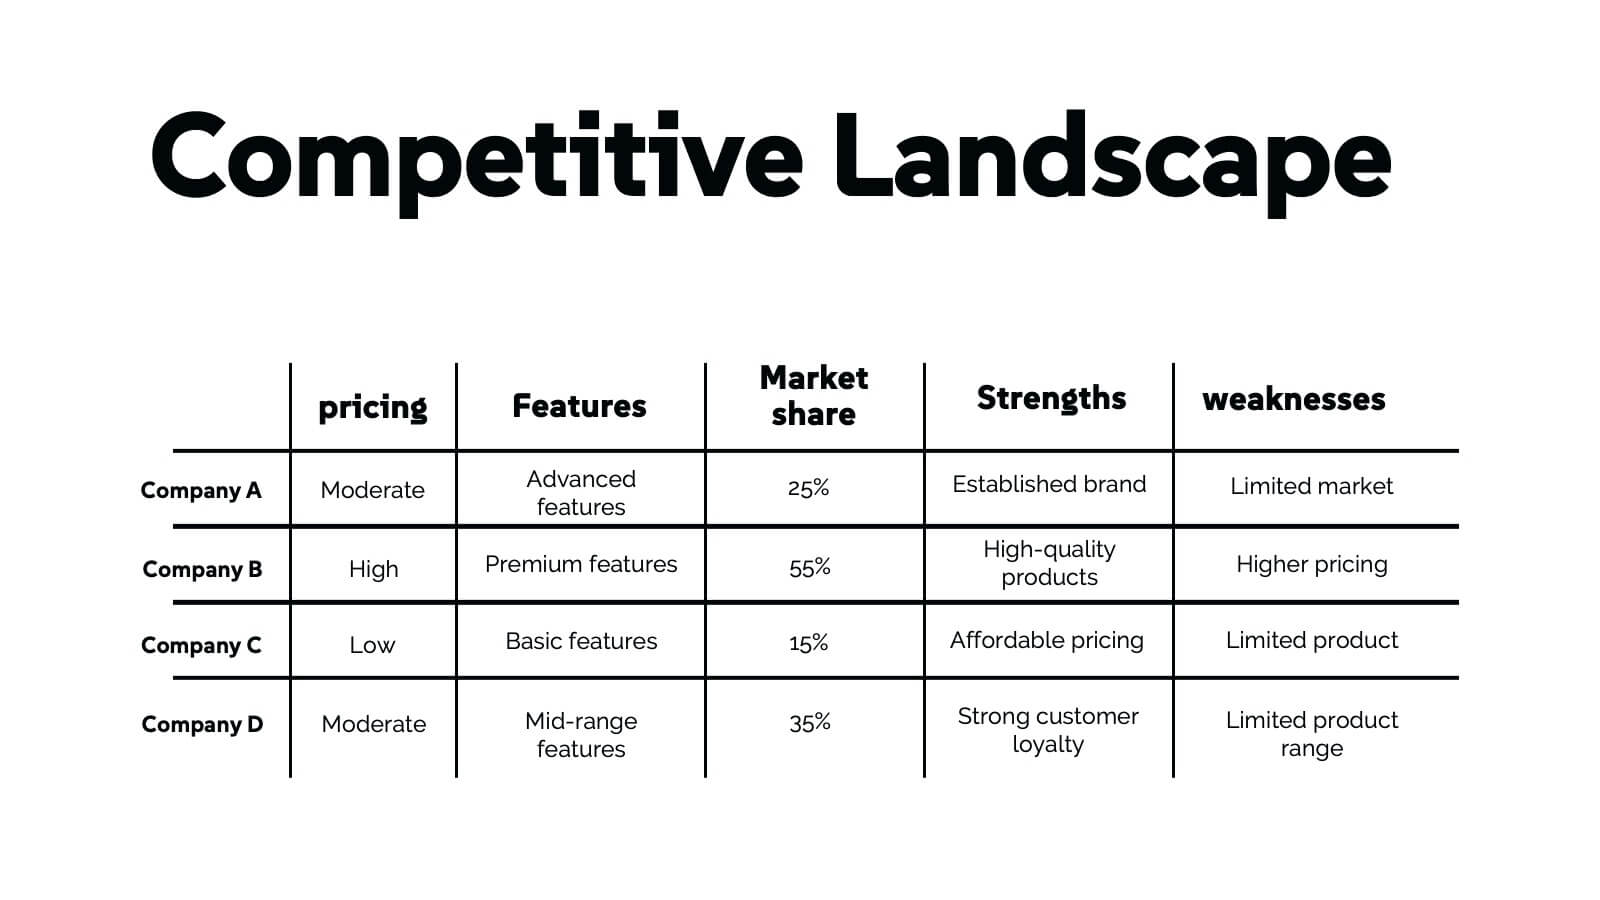
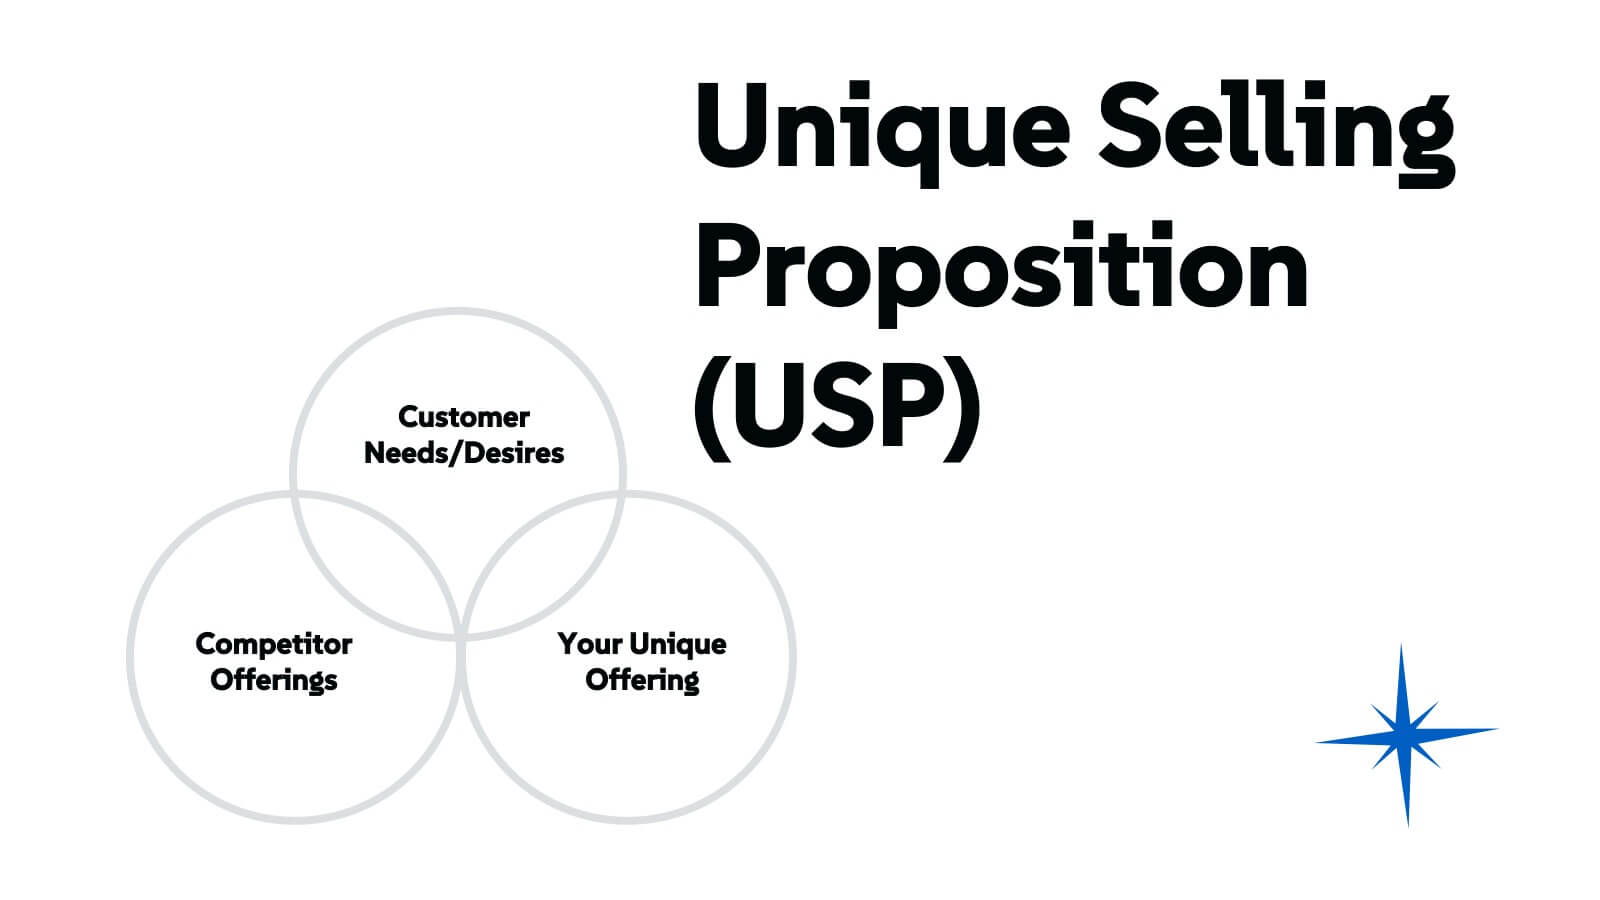
Chimera Marketing Campaign Presentation
Create a visually engaging digital marketing presentation with this modern template! Covering essential topics like company history, market presence, target audience, and competitive landscape, this template helps you showcase your marketing strategies effectively. Fully customizable, it works seamlessly with PowerPoint, Keynote, and Google Slides for professional presentations every time.


4 diapositivas
Property Investment and Housing Report Presentation
Present your Property Investment and Housing Report with this structured real estate-themed presentation template. Featuring a house-shaped design with ascending financial metrics, this layout is perfect for illustrating market trends, investment growth, and housing analysis. Ideal for real estate agents, property developers, and financial analysts, this template makes data visually engaging and easy to understand. Fully customizable and compatible with PowerPoint, Keynote, and Google Slides.