


Características


¿Tienes alguna pregunta?
Recomendar


6 diapositivas
Central Idea Spider Layout Presentation
Bring your big idea to life with a sleek, organized layout that keeps every supporting point perfectly connected. This presentation is ideal for mapping strategies, goals, or project concepts in a clear, visual way. Fully customizable and compatible with PowerPoint, Keynote, and Google Slides for effortless editing.


6 diapositivas
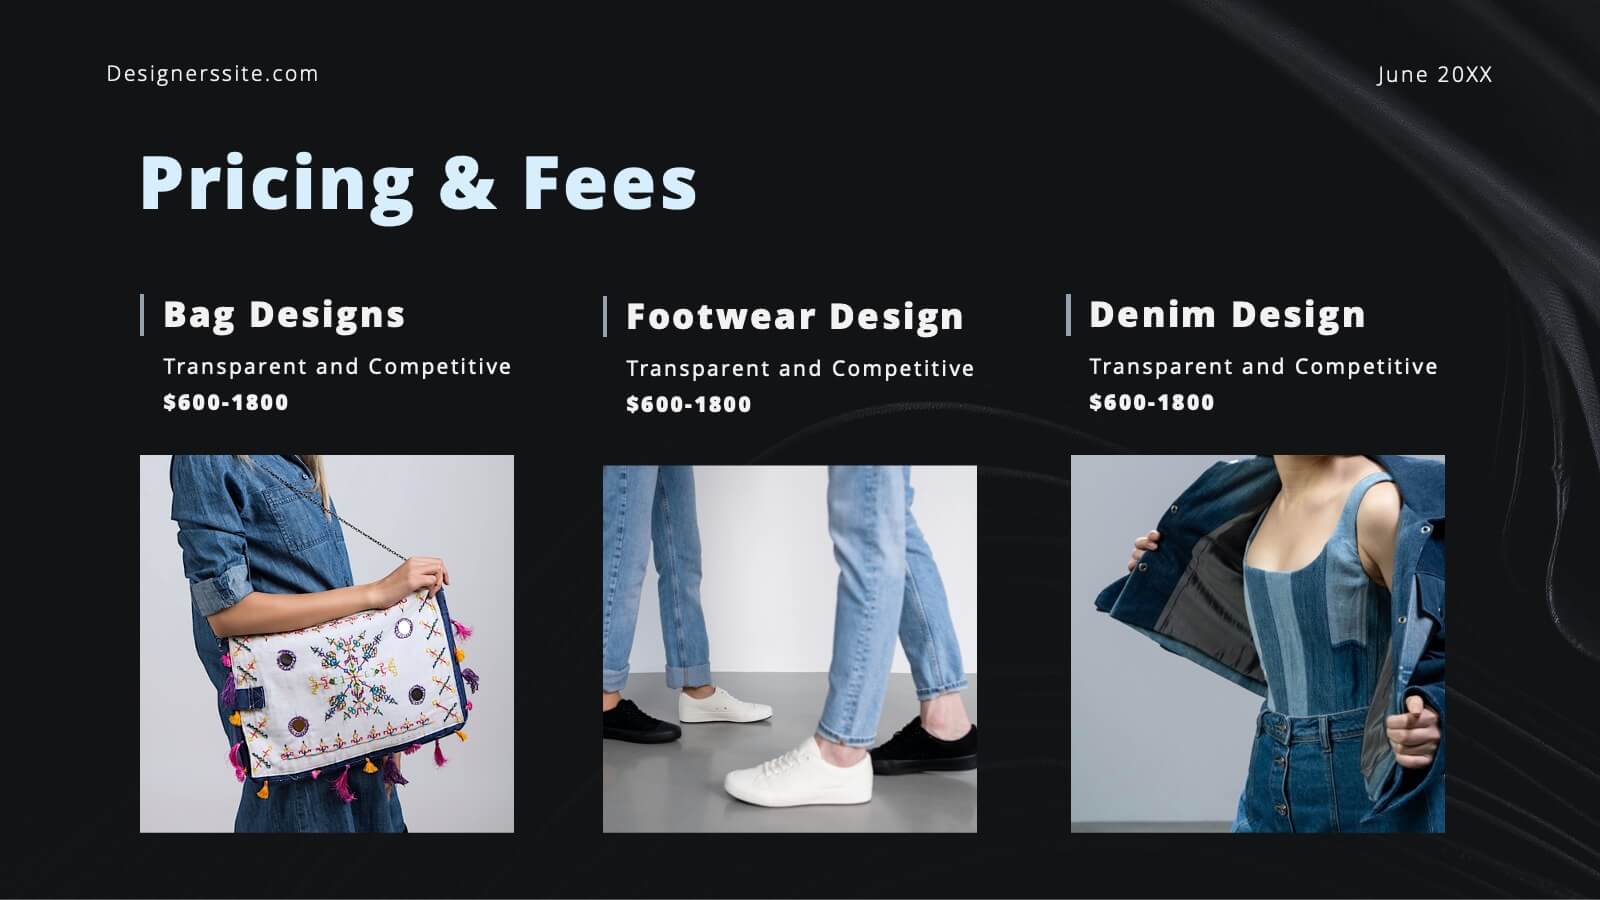
Business Revenue Break-Even Strategy
Visualize profitability with clarity using this dynamic break-even strategy template. Ideal for business analysts, finance teams, and consultants, this diagram highlights the balance between cost, loss, and profit at the break-even point. With intuitive icons and space for key metrics, it's fully editable in PowerPoint, Keynote, and Google Slides.


20 diapositivas
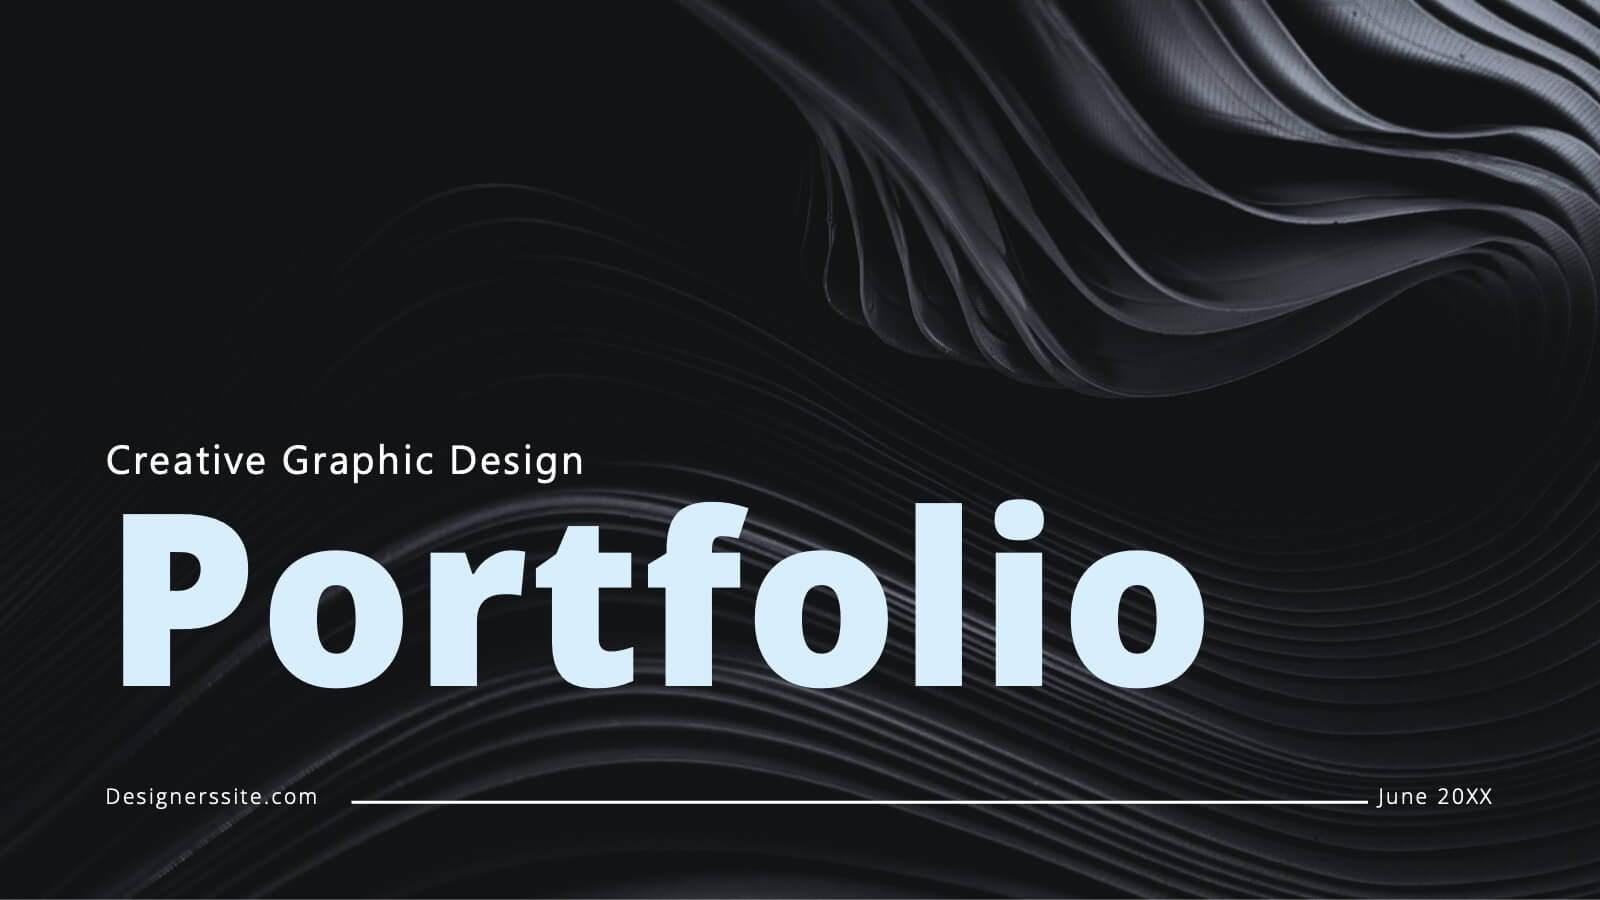
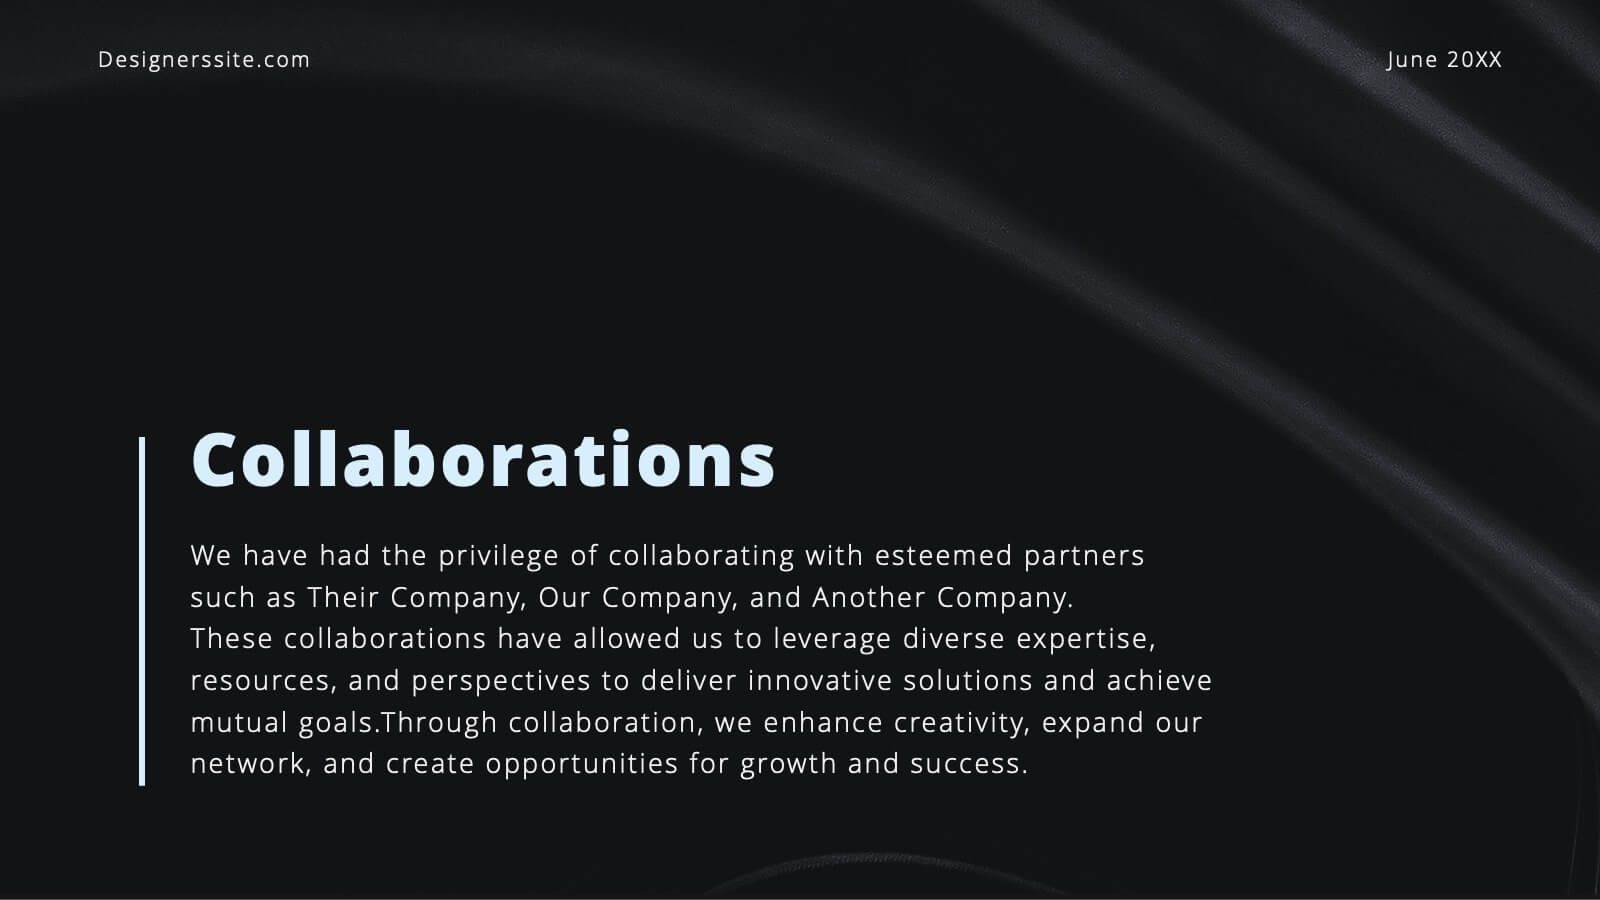
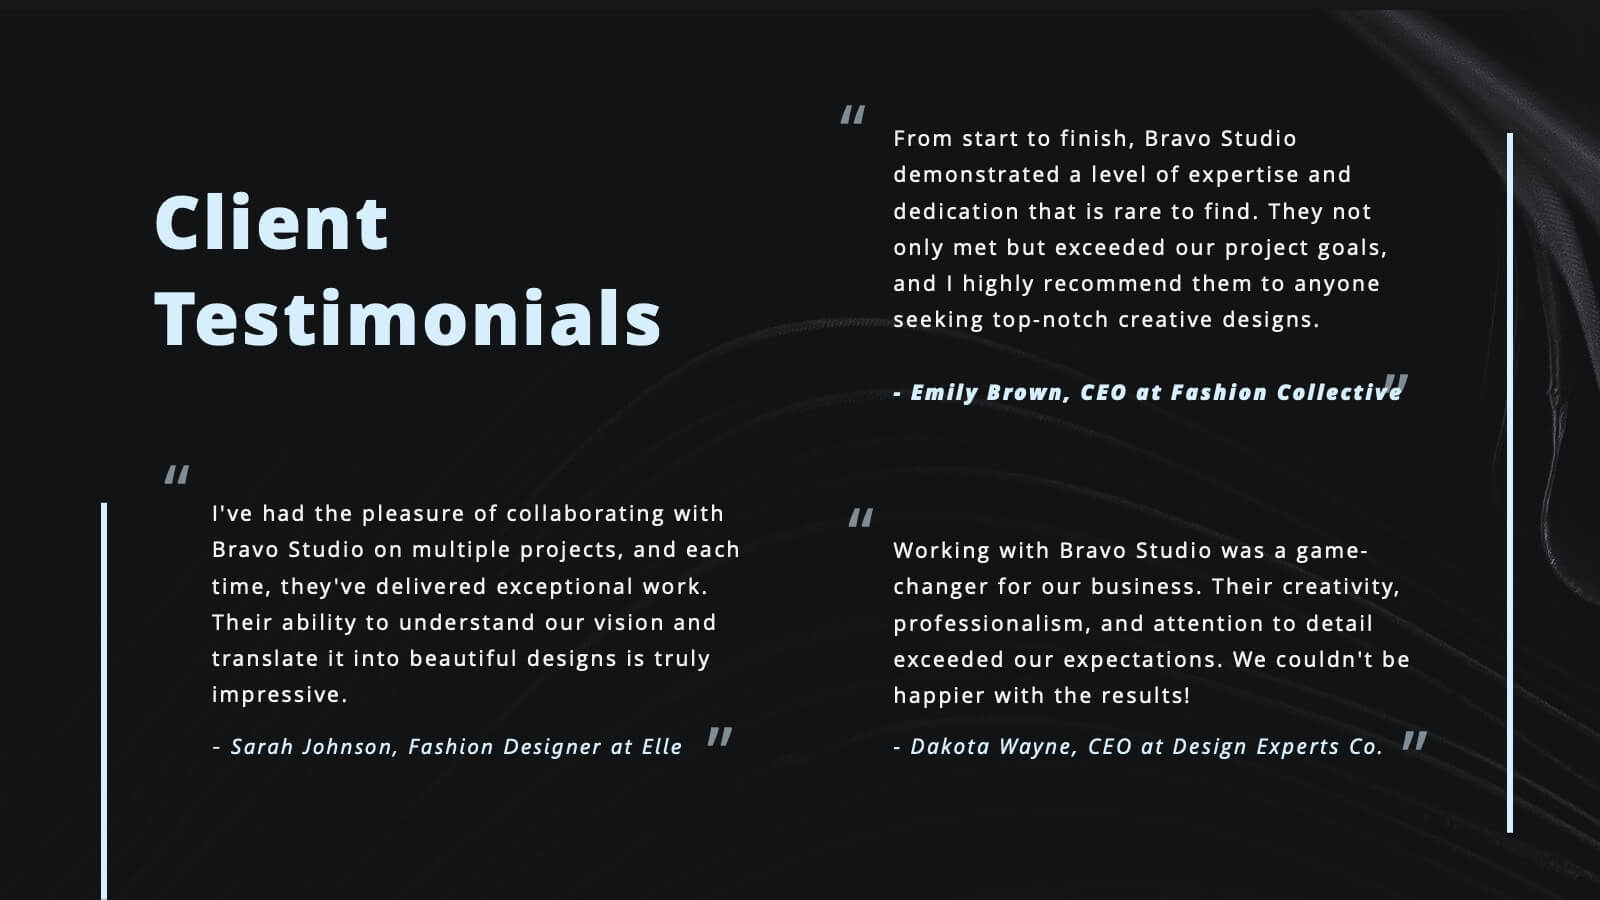
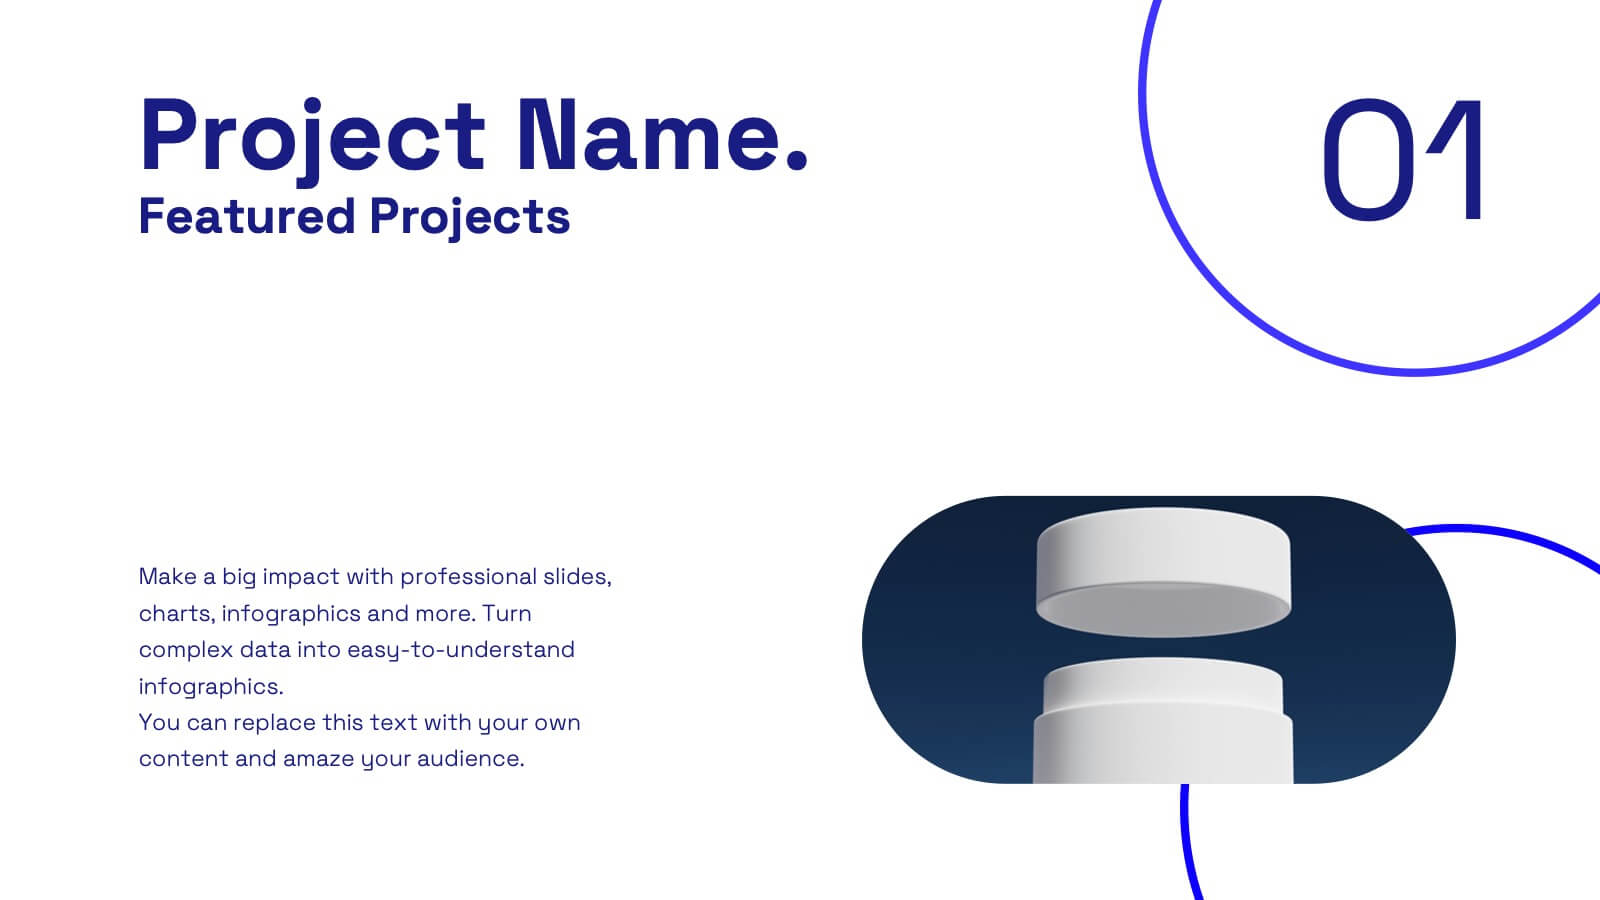
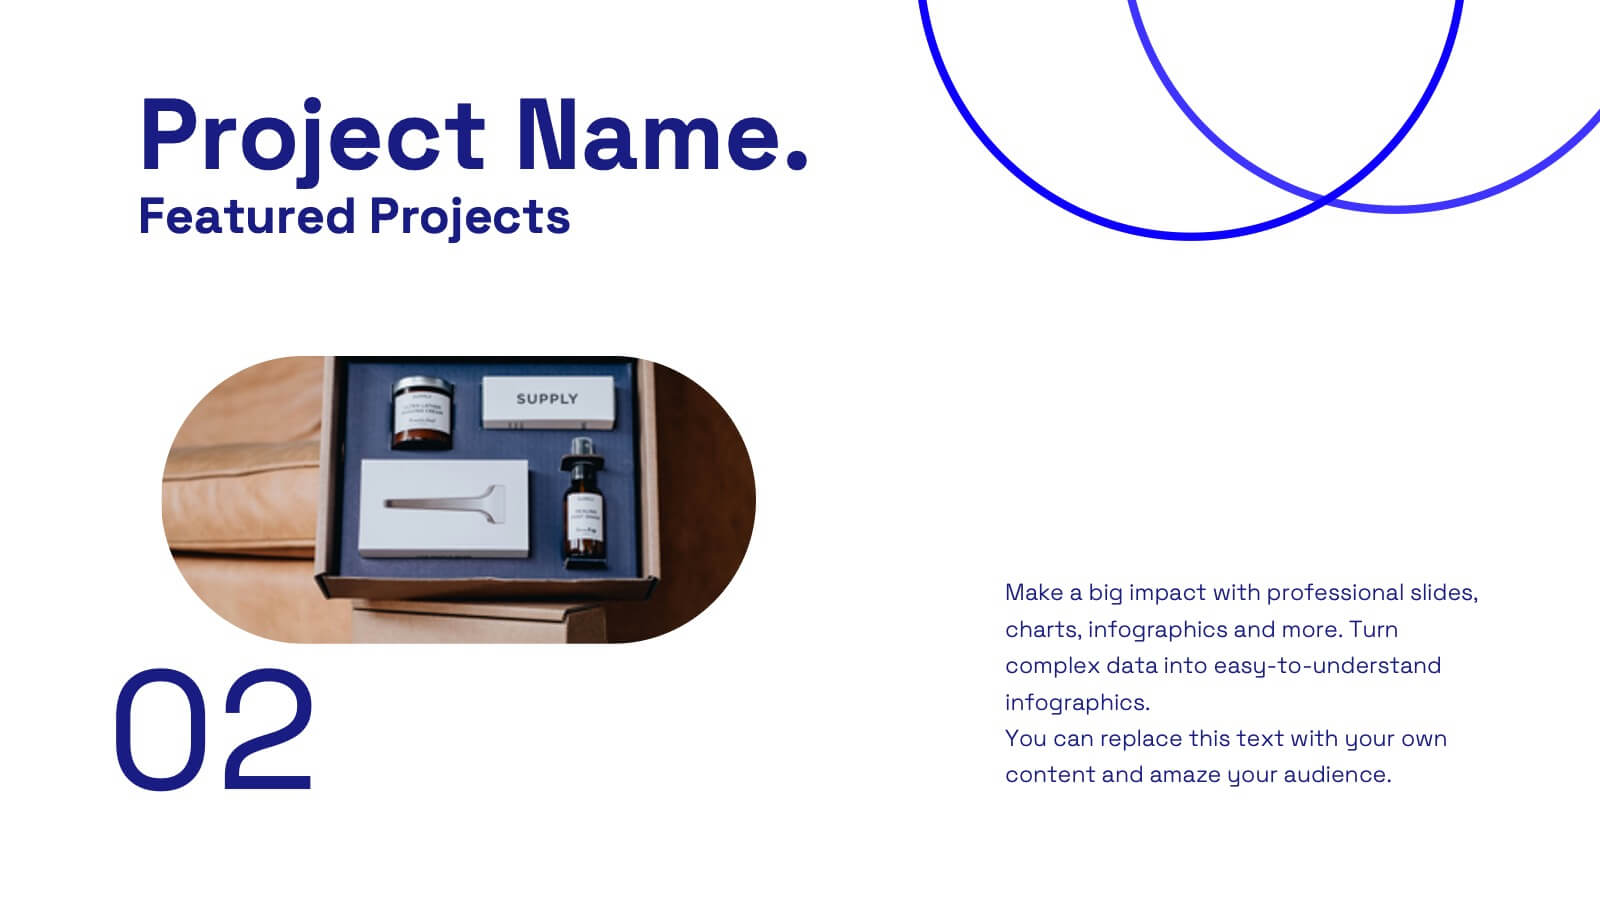
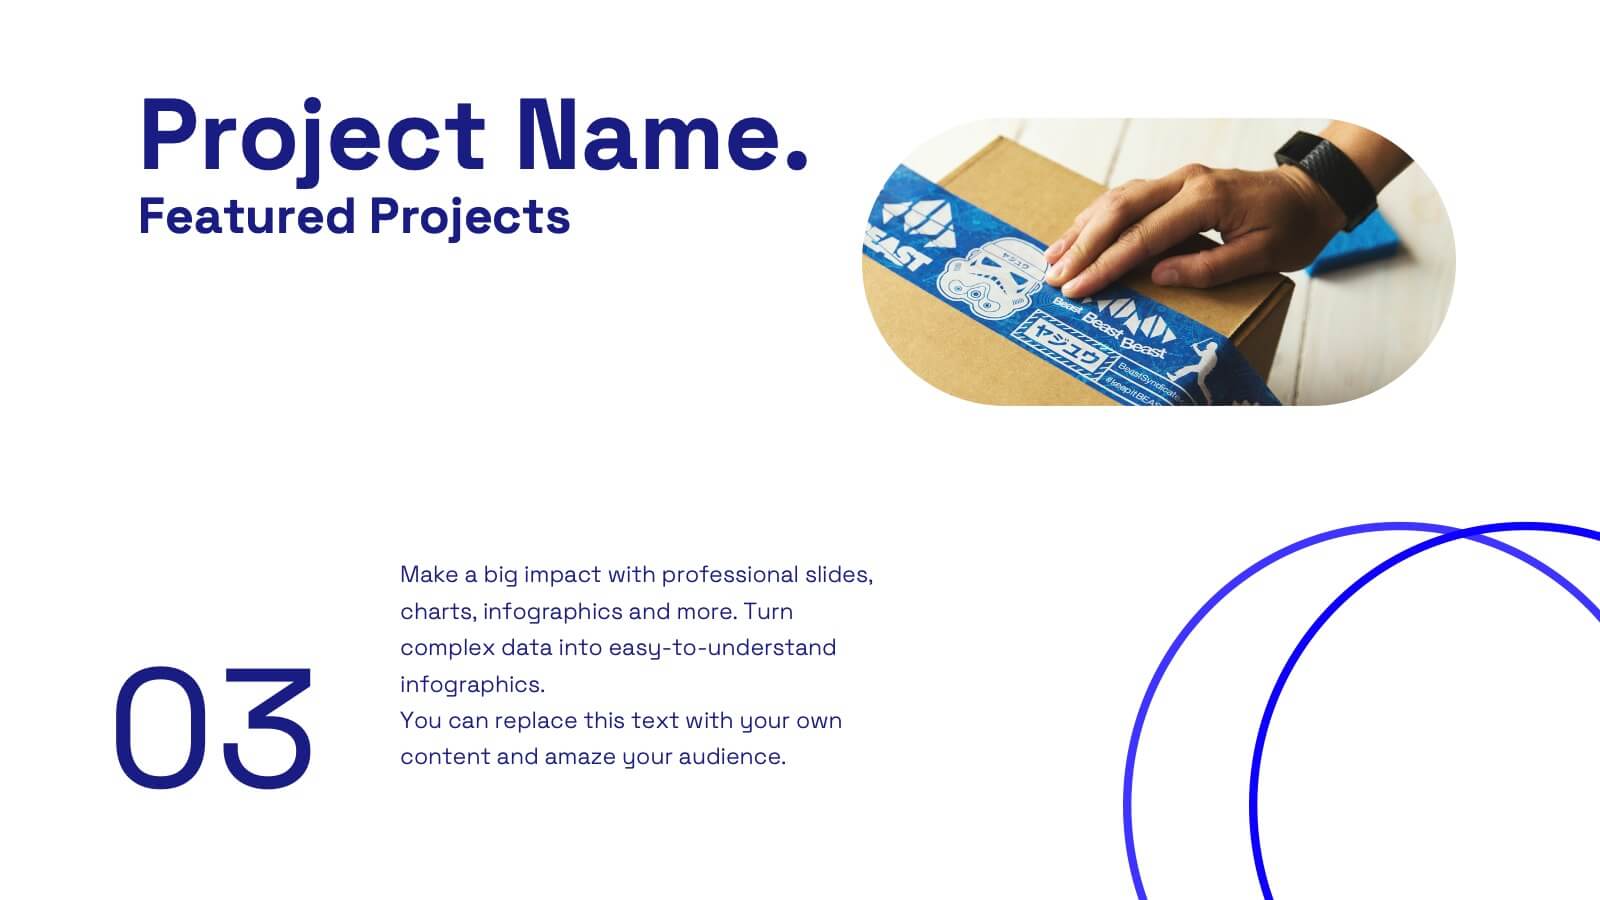
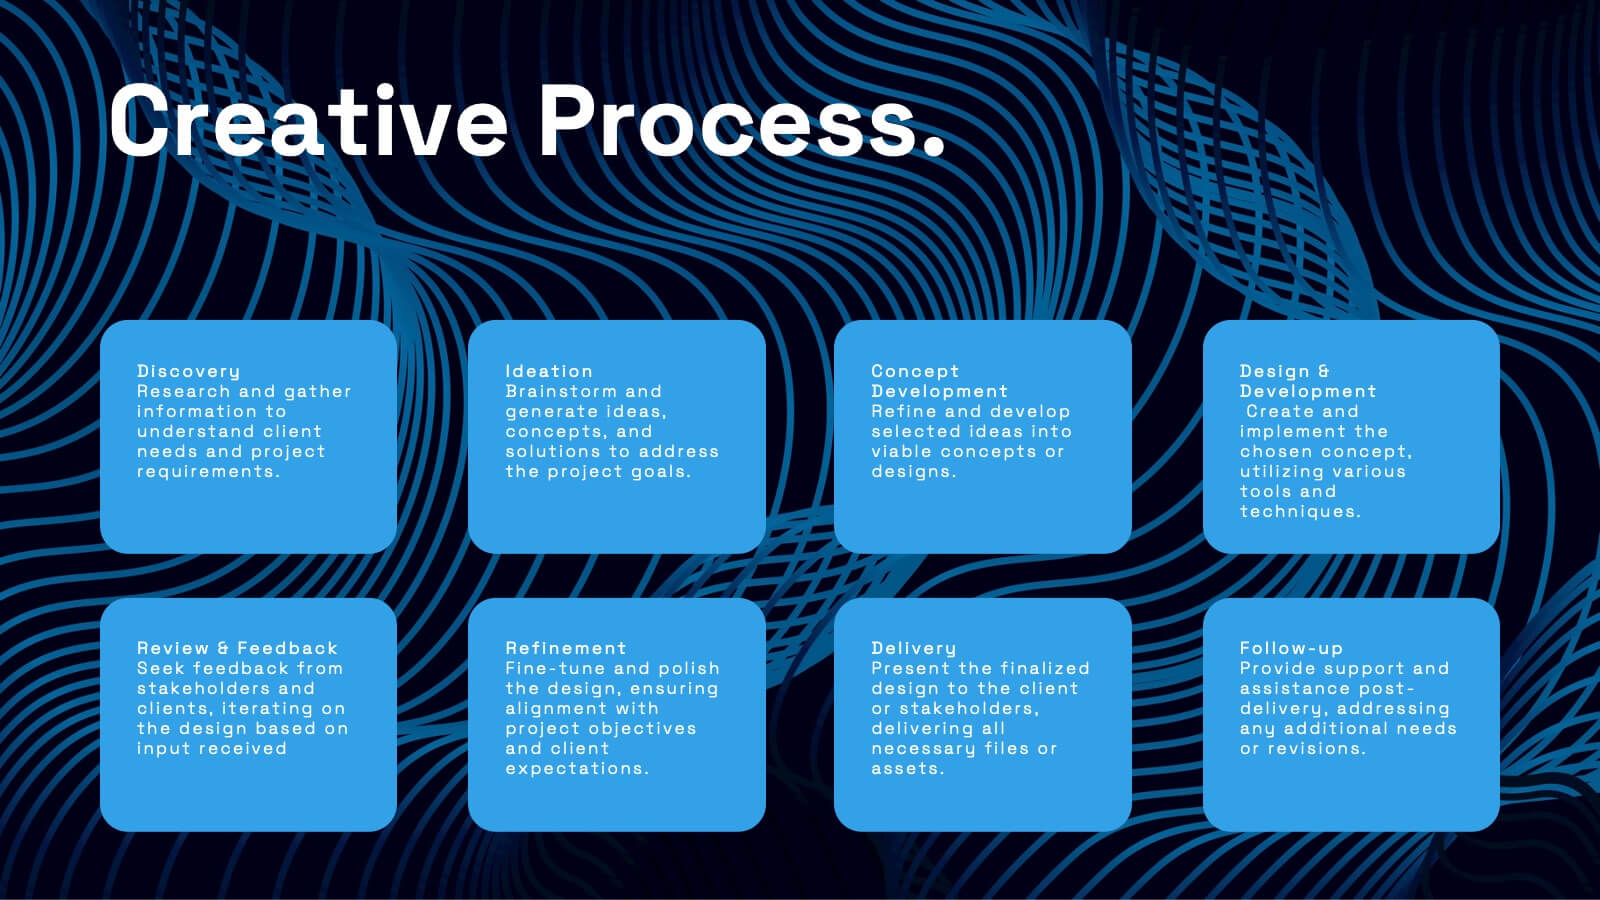
Bravo Creative Portfolio Presentation
Showcase your creative prowess with this sleek, modern portfolio presentation template. Perfect for highlighting featured projects, client testimonials, and your creative process, this template ensures your work shines. Its stylish design and professional layout make it ideal for impressing potential clients and collaborators. Compatible with PowerPoint, Keynote, and Google Slides, it's versatile for any platform.


6 diapositivas
Business Value Proposition Presentation
Ignite your strategy with this captivating template that highlights your unique business value. This tool breaks down key value propositions, market differentiators, and customer benefits in an engaging format. Perfect for pitching ideas, it clarifies competitive advantages and growth opportunities. Compatible with PowerPoint, Keynote, and Google Slides for seamless presentations.


4 diapositivas
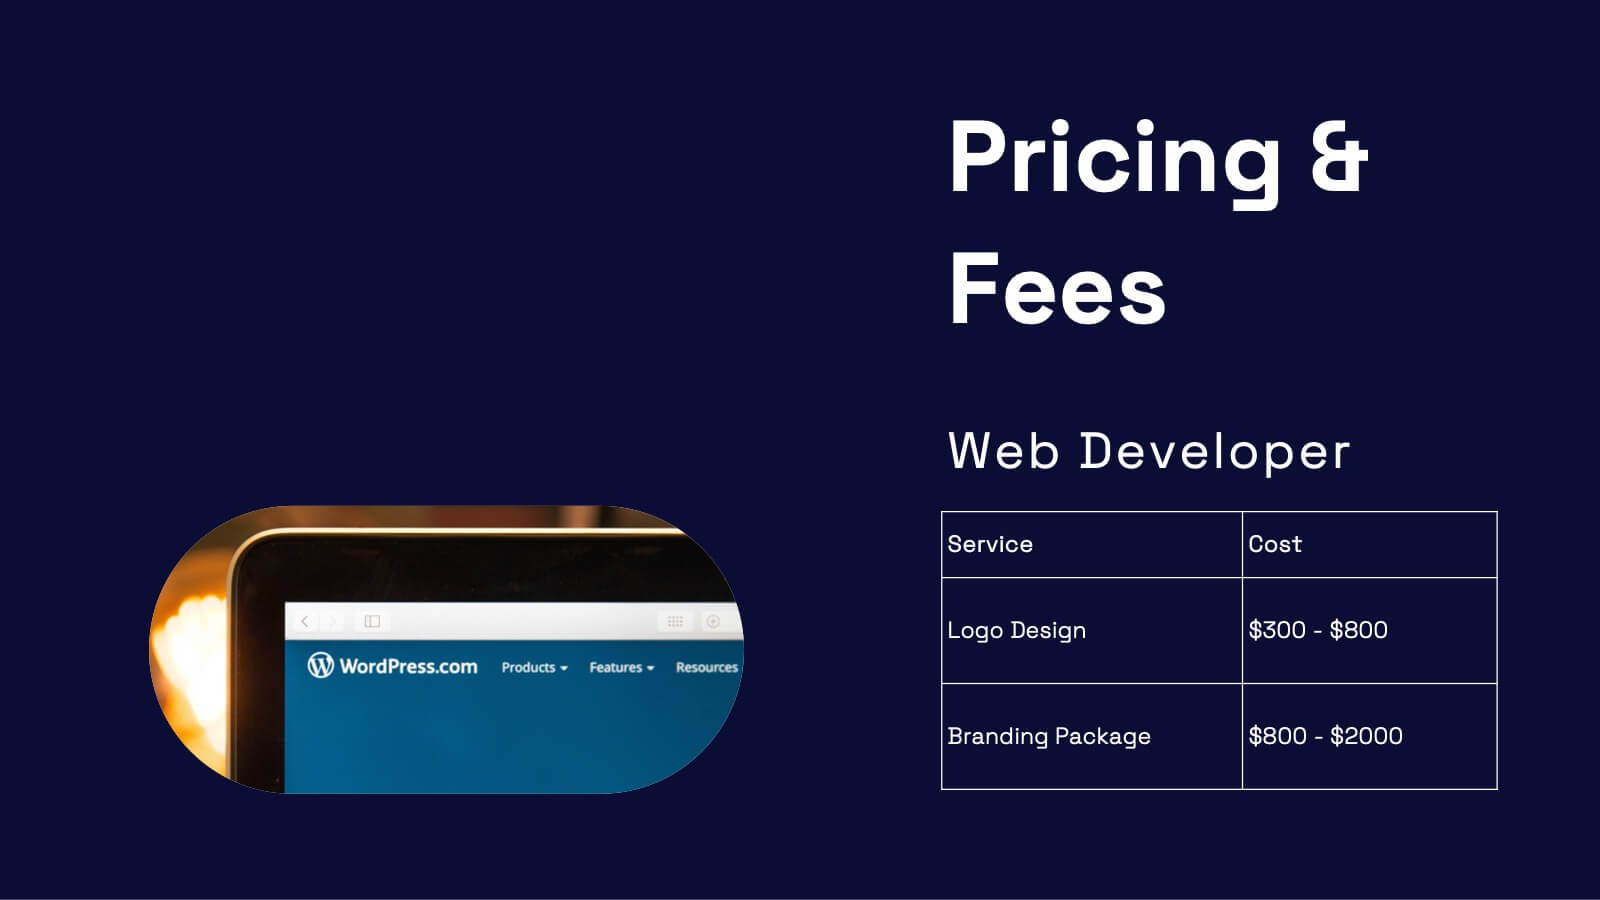
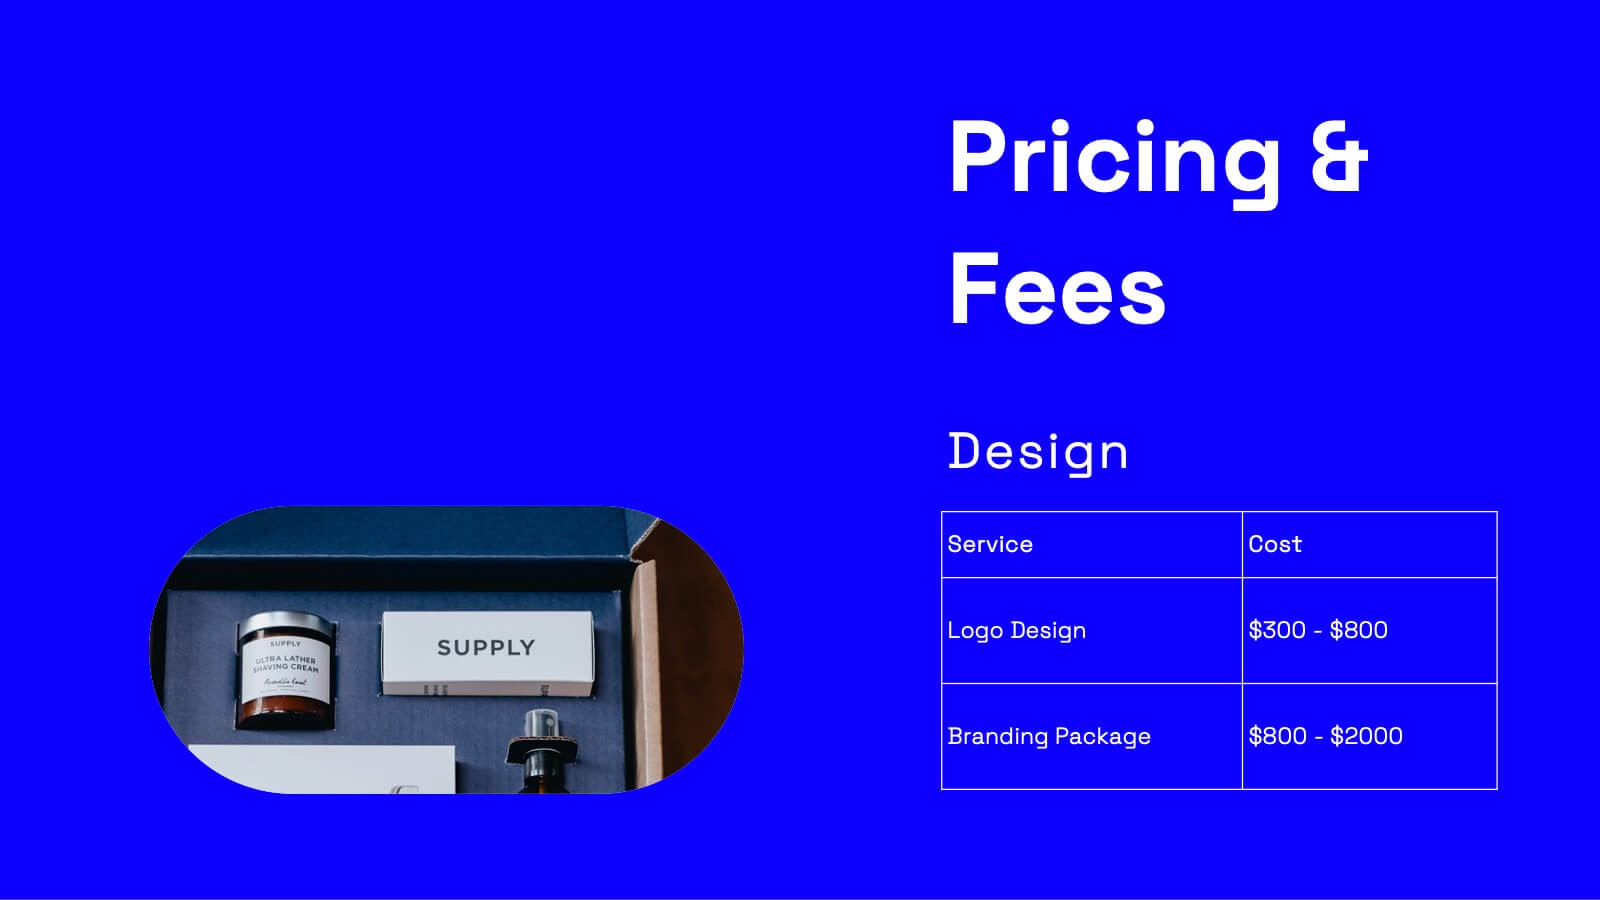
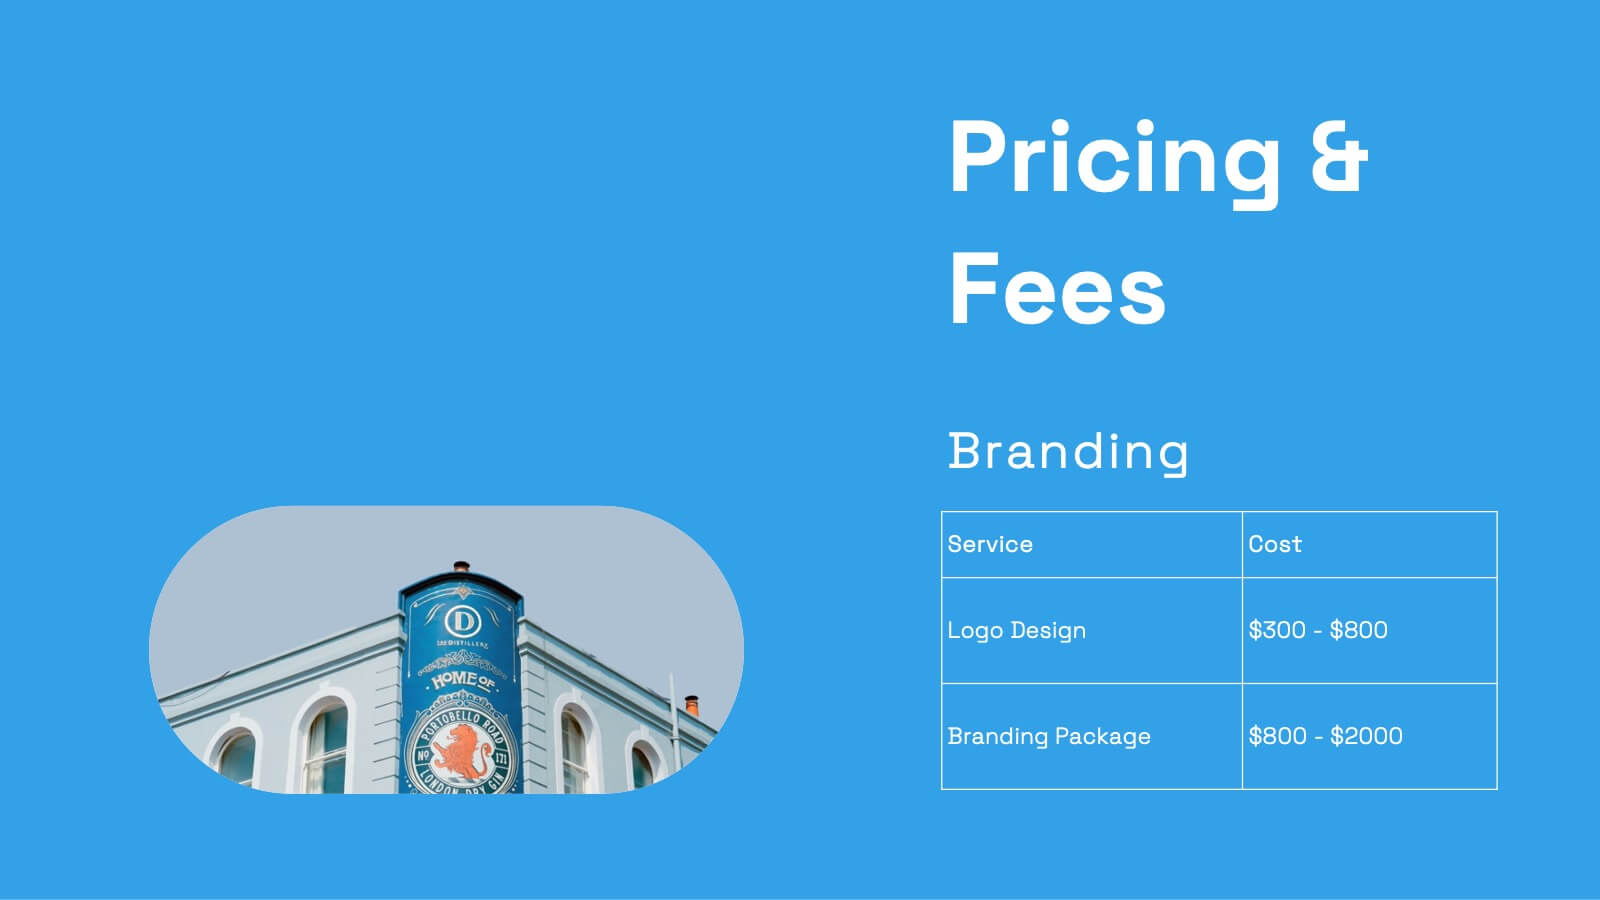
Financial Table Layout Presentation
Bring your numbers to life with a clear, colorful layout that makes financial details easy to compare at a glance. This presentation helps you organize pricing tiers, budget insights, or account summaries with clean structure and smooth readability. Fully compatible with PowerPoint, Keynote, and Google Slides.


20 diapositivas
Elementra Marketing Proposal Presentation
Elevate your marketing initiatives with this professional and well-structured proposal template. Covering essential sections such as objectives, goals, budget breakdown, timeline, and pricing structure, this presentation helps you effectively communicate your strategy to stakeholders and clients. Its clean, modern design ensures clarity and engagement, making it ideal for pitching ideas and securing approvals. Fully customizable and compatible with PowerPoint, Keynote, and Google Slides.


26 diapositivas
Modern Company Culture Playbook Presentation
A culture playbook is a document or guide that outlines the values, beliefs, behaviors, and norms that define the organizational culture of a company or team. This presentation template is designed to help businesses create and communicate their unique company culture to employees and potential recruits. With a modern and professional design, this presentation provides a comprehensive overview of your company's values, mission, and beliefs, fostering a positive and inclusive work environment. Illustrate your company's vision for the future and its role in shaping a better world, encouraging employees to be part of a meaningful journey.

22 diapositivas
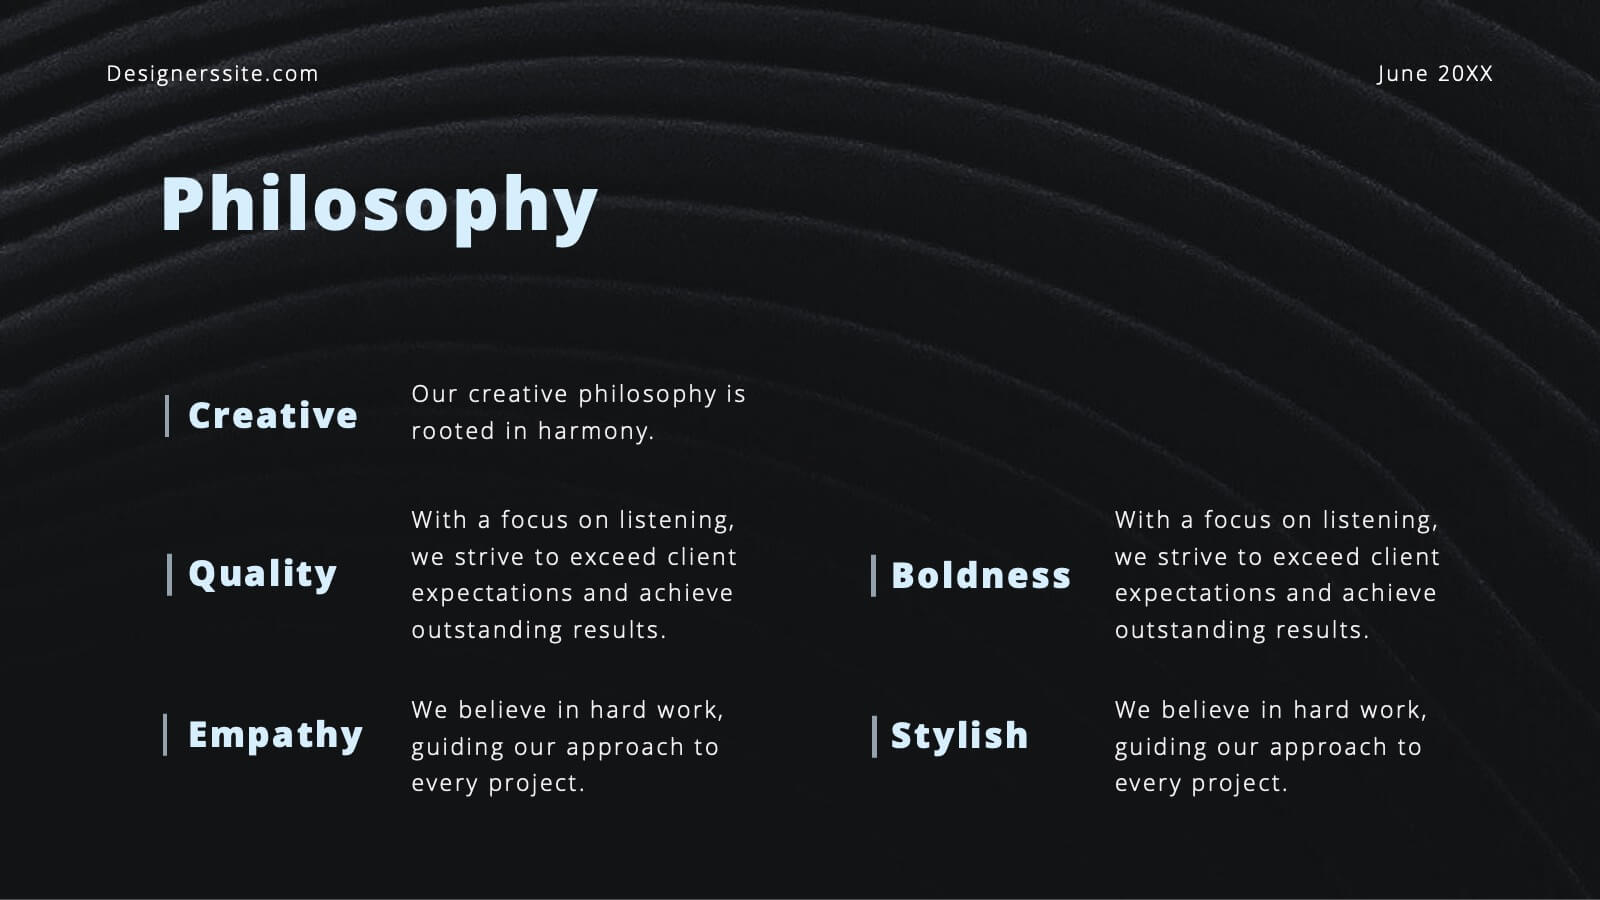
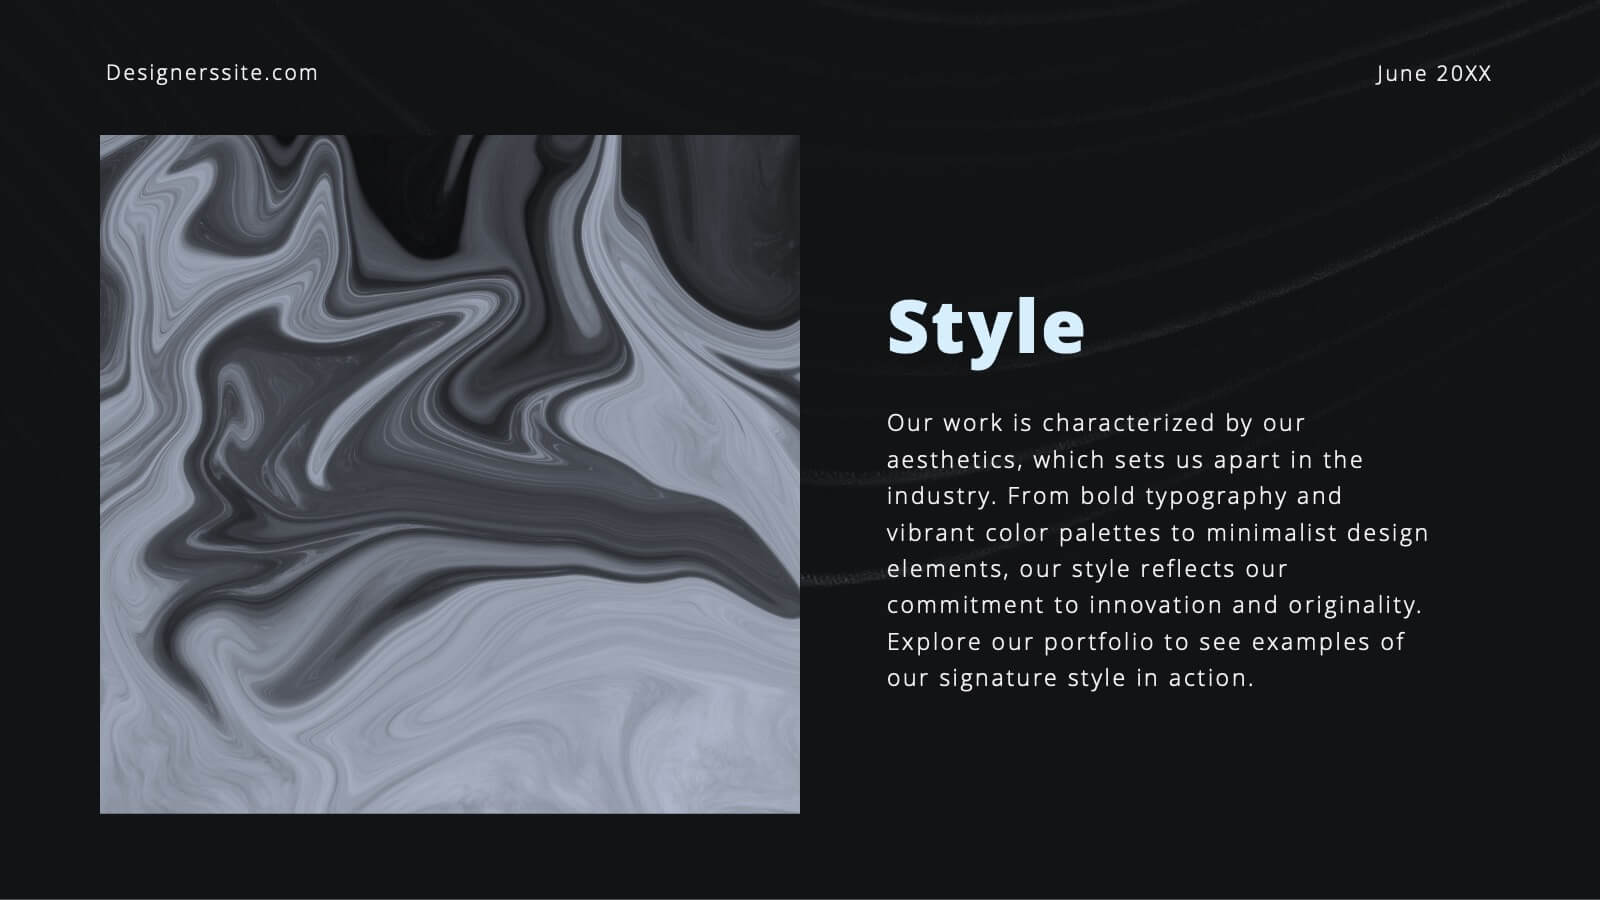
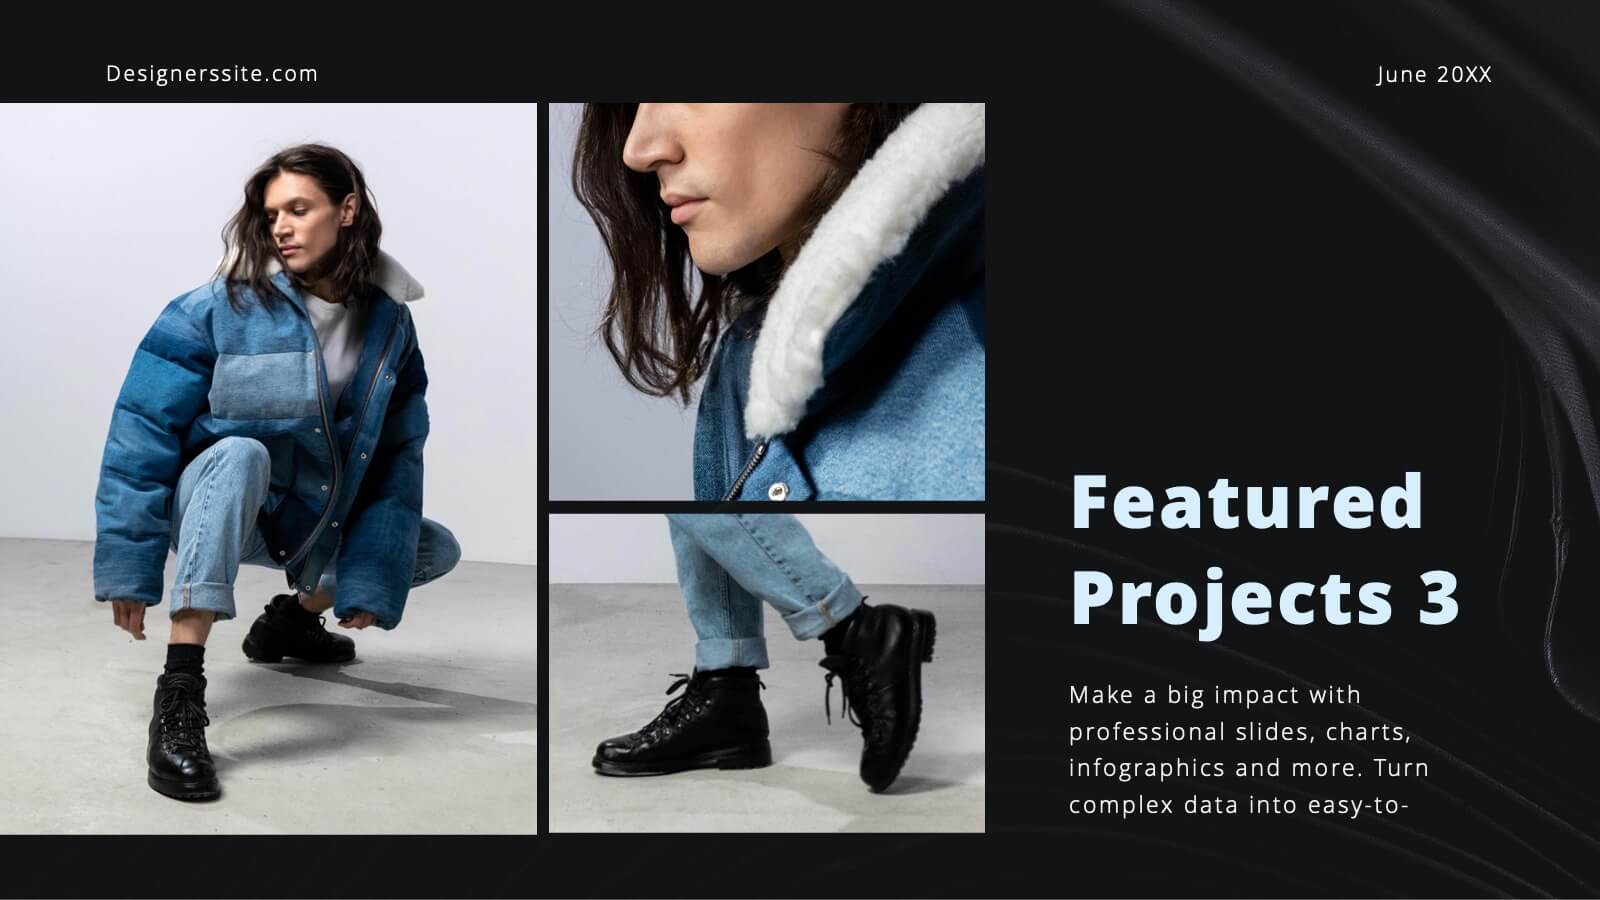
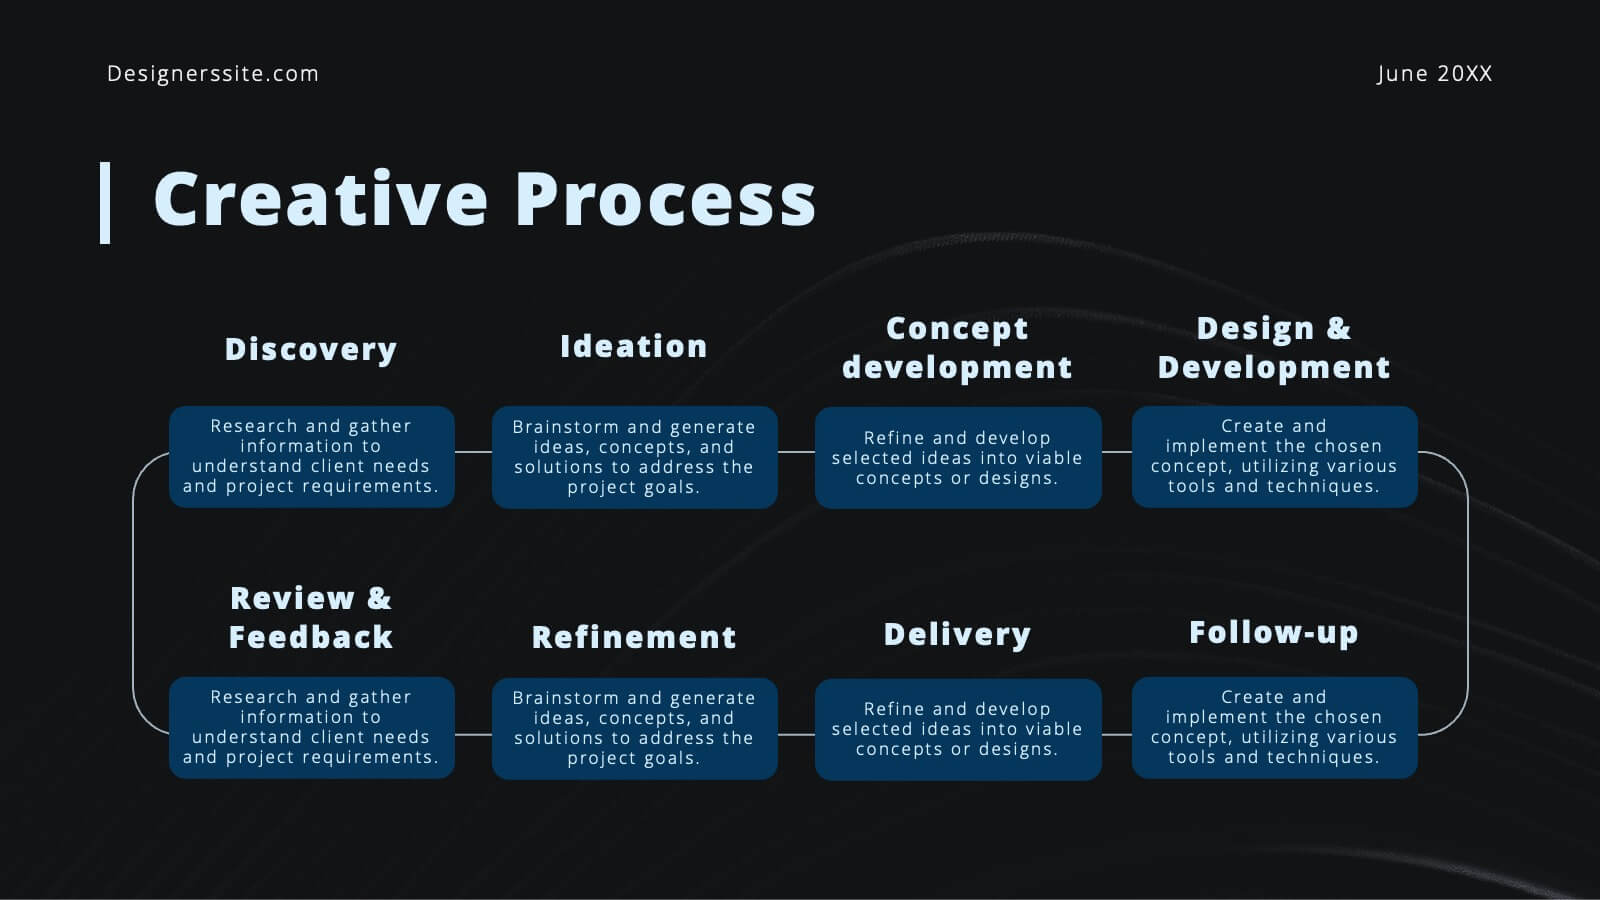
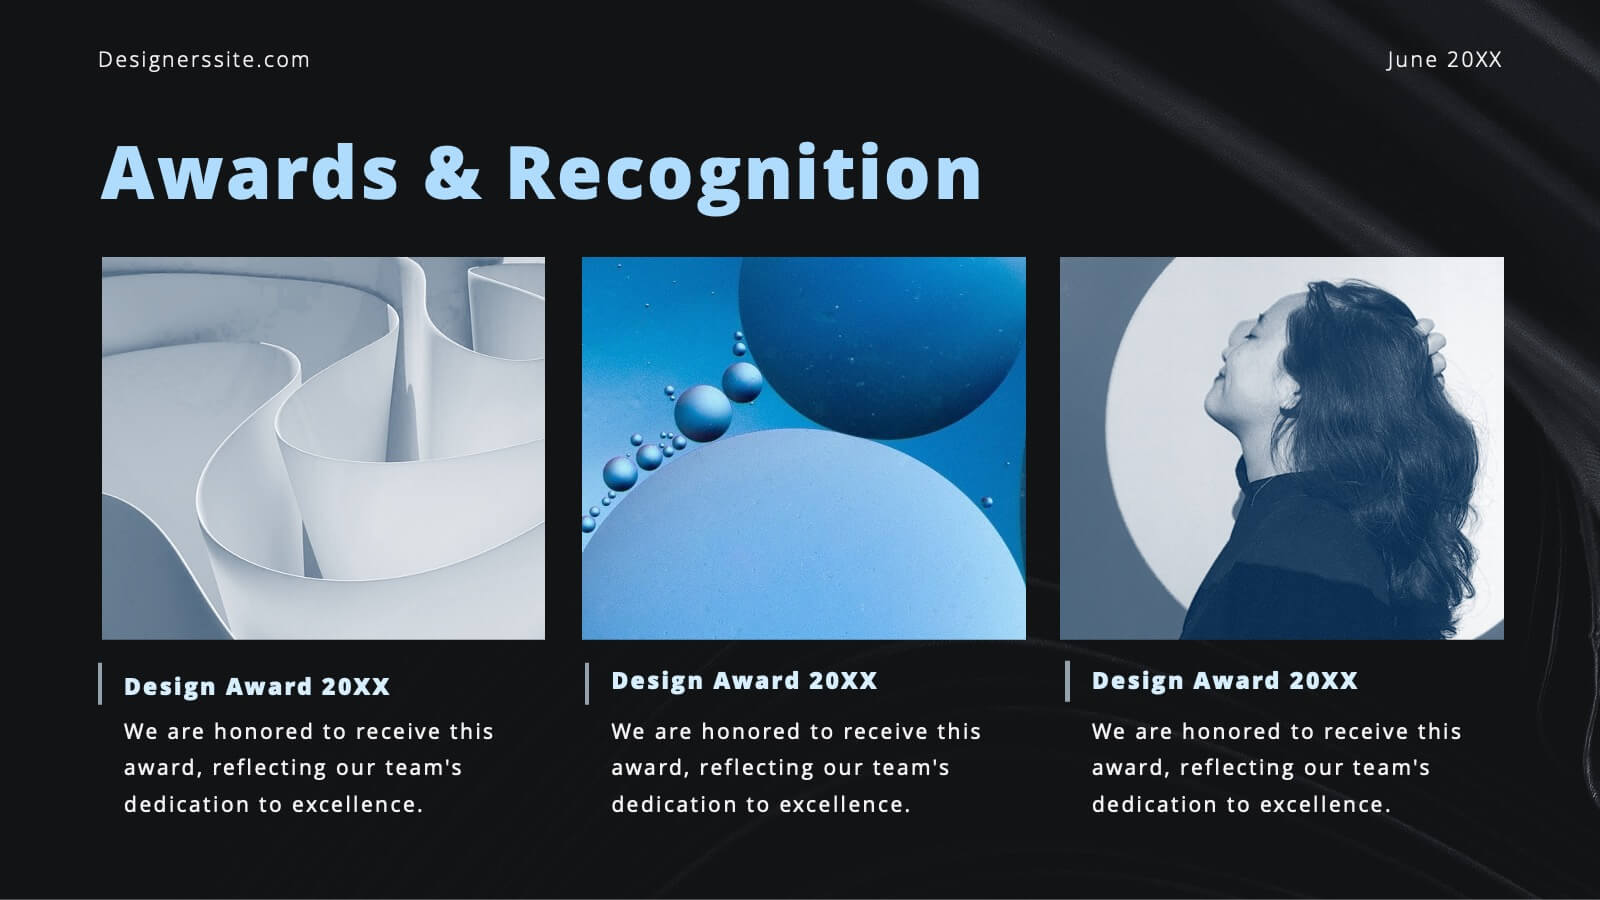
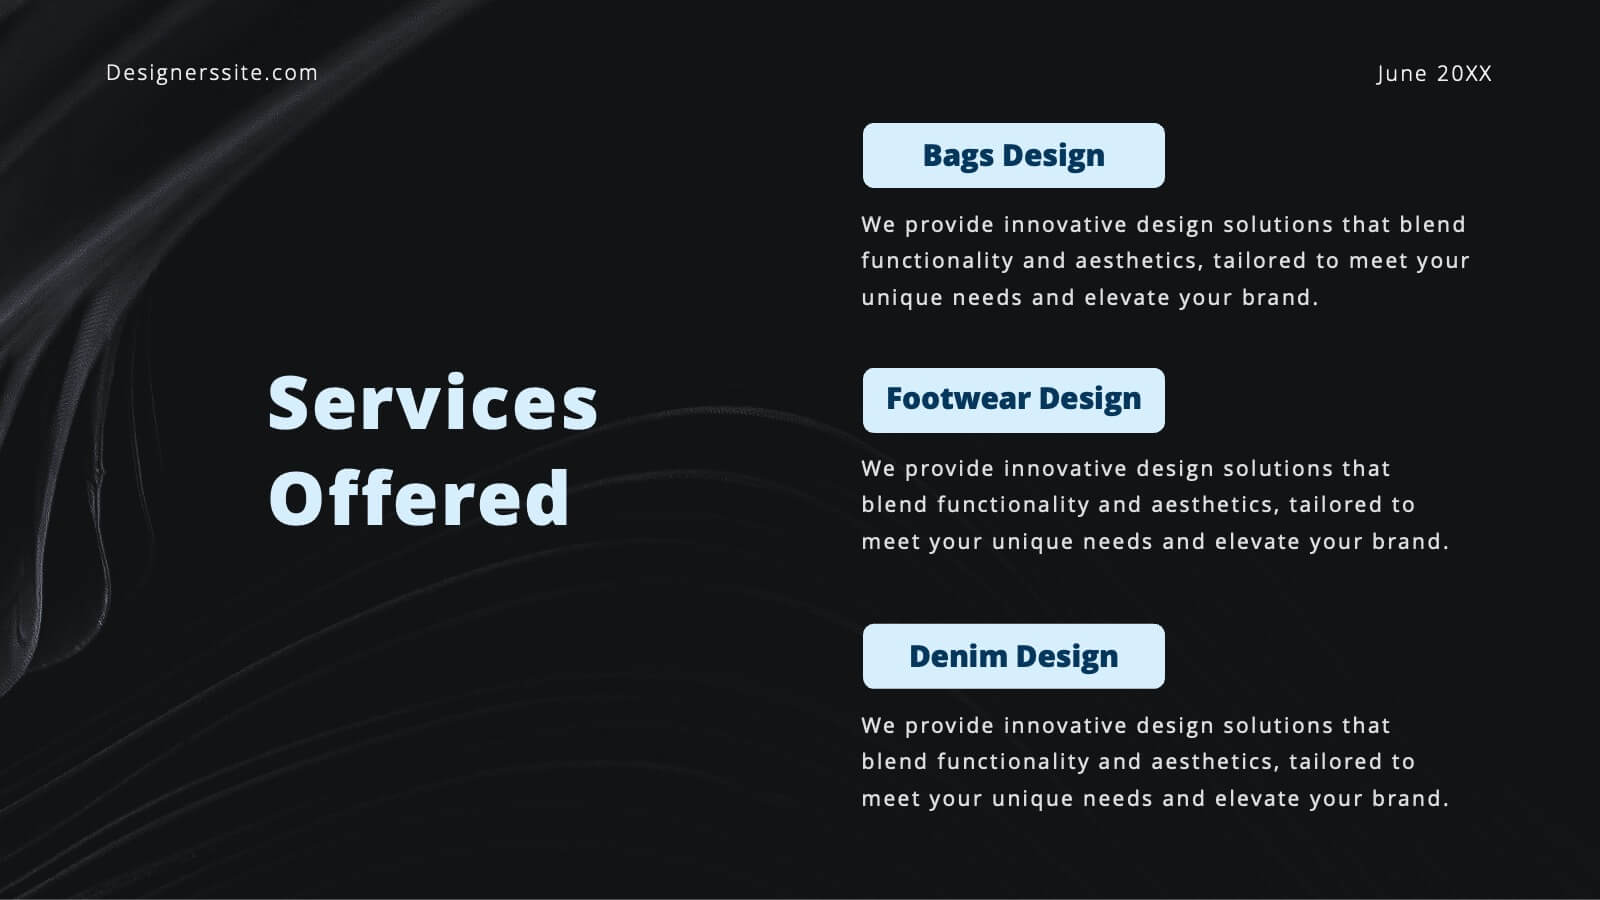
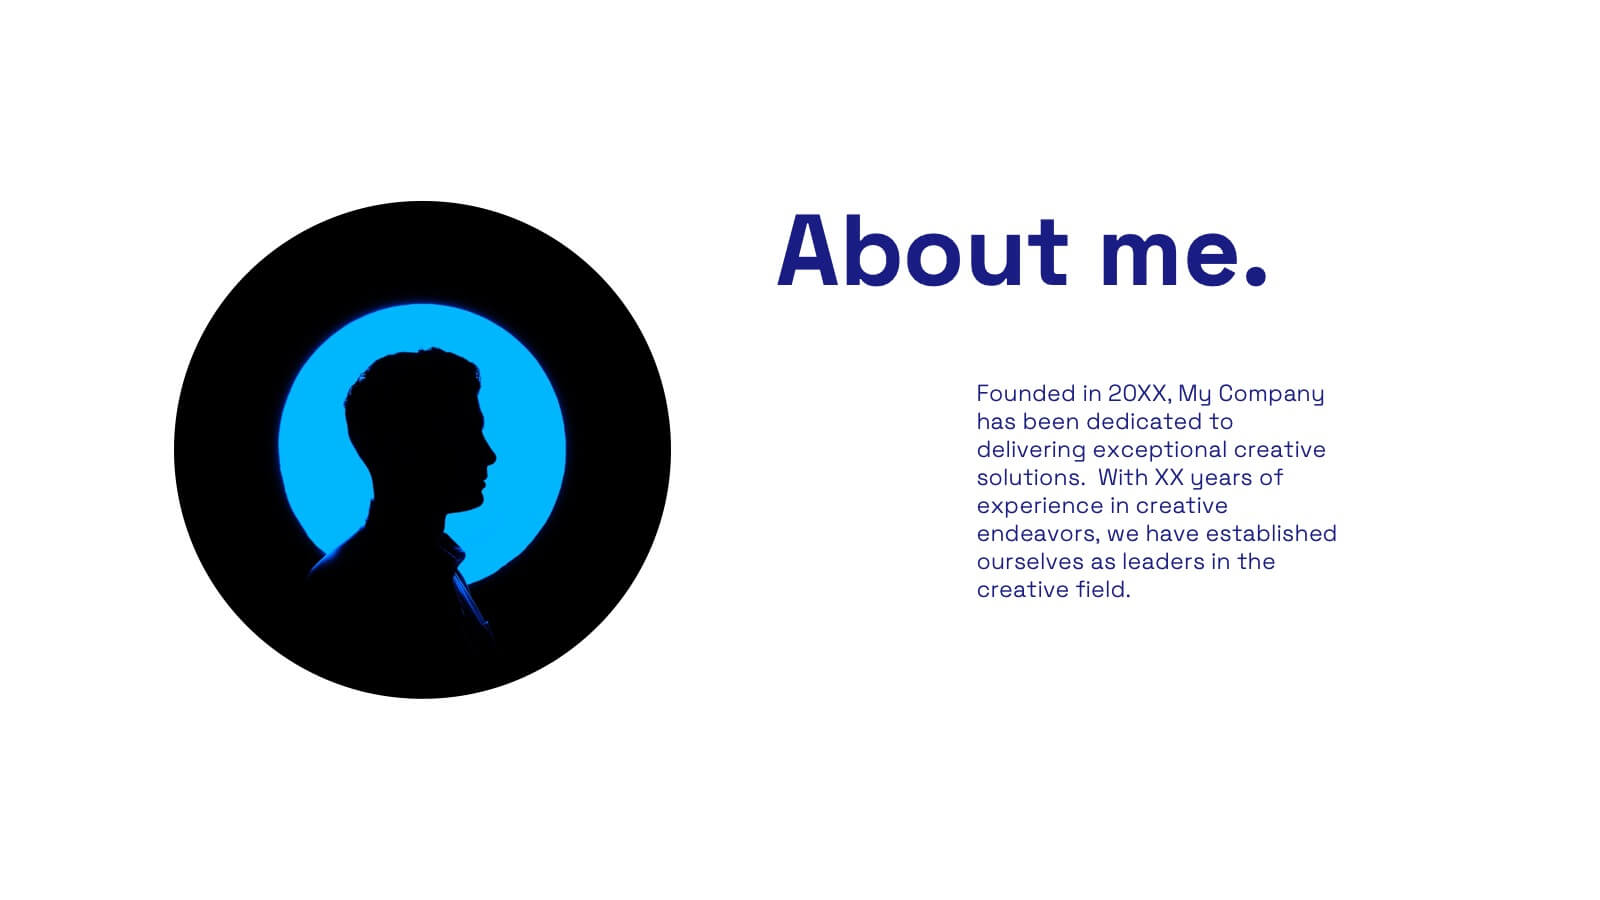
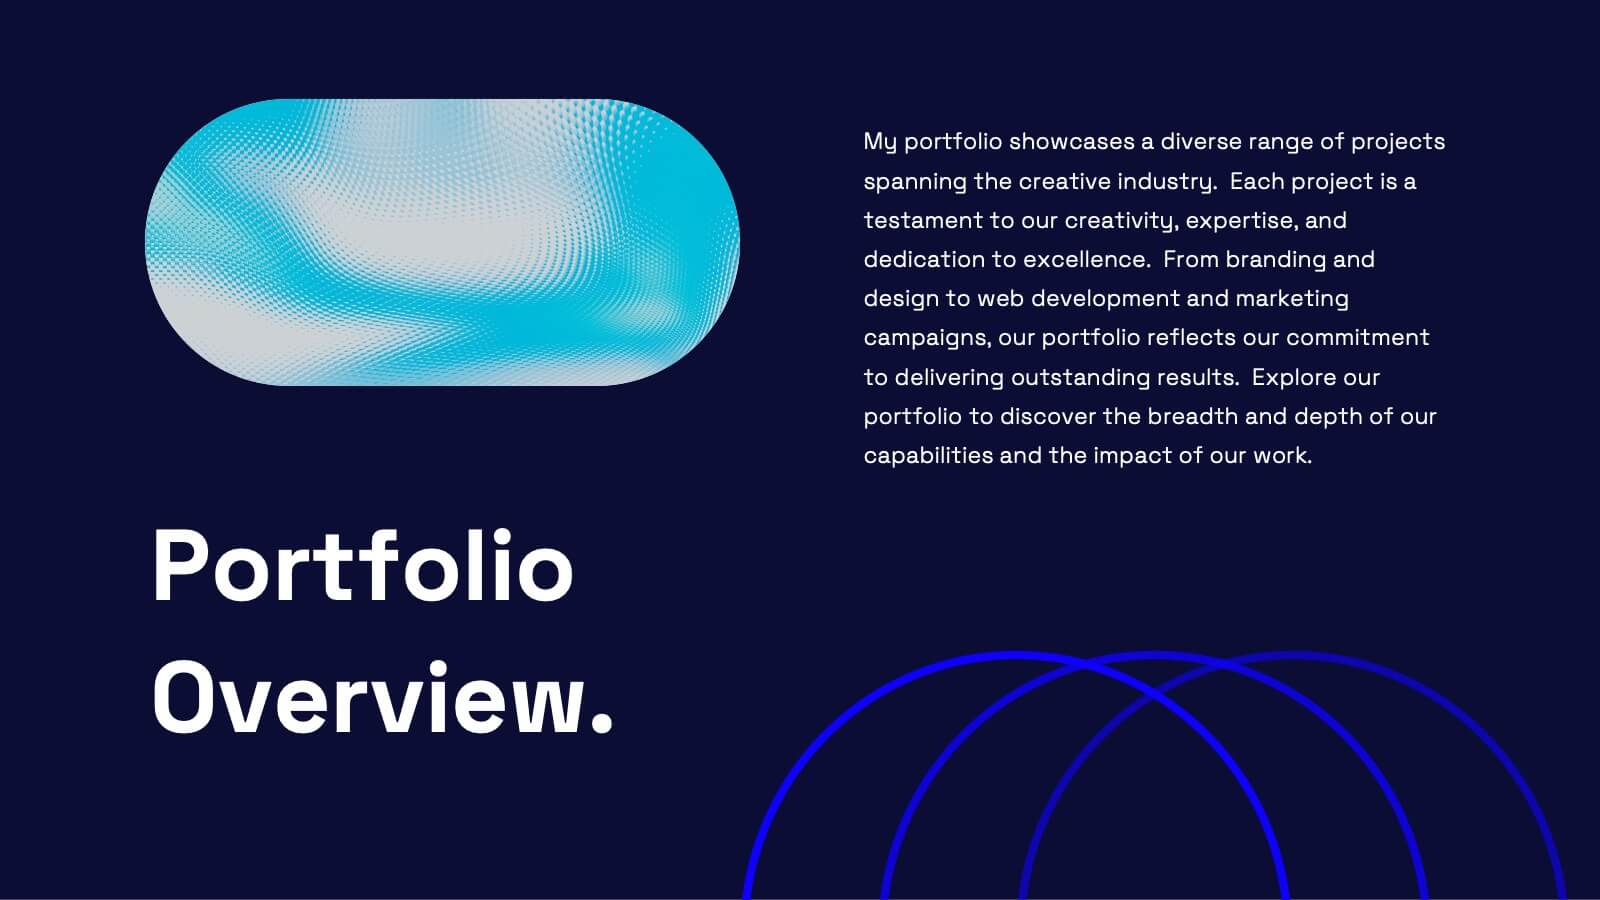
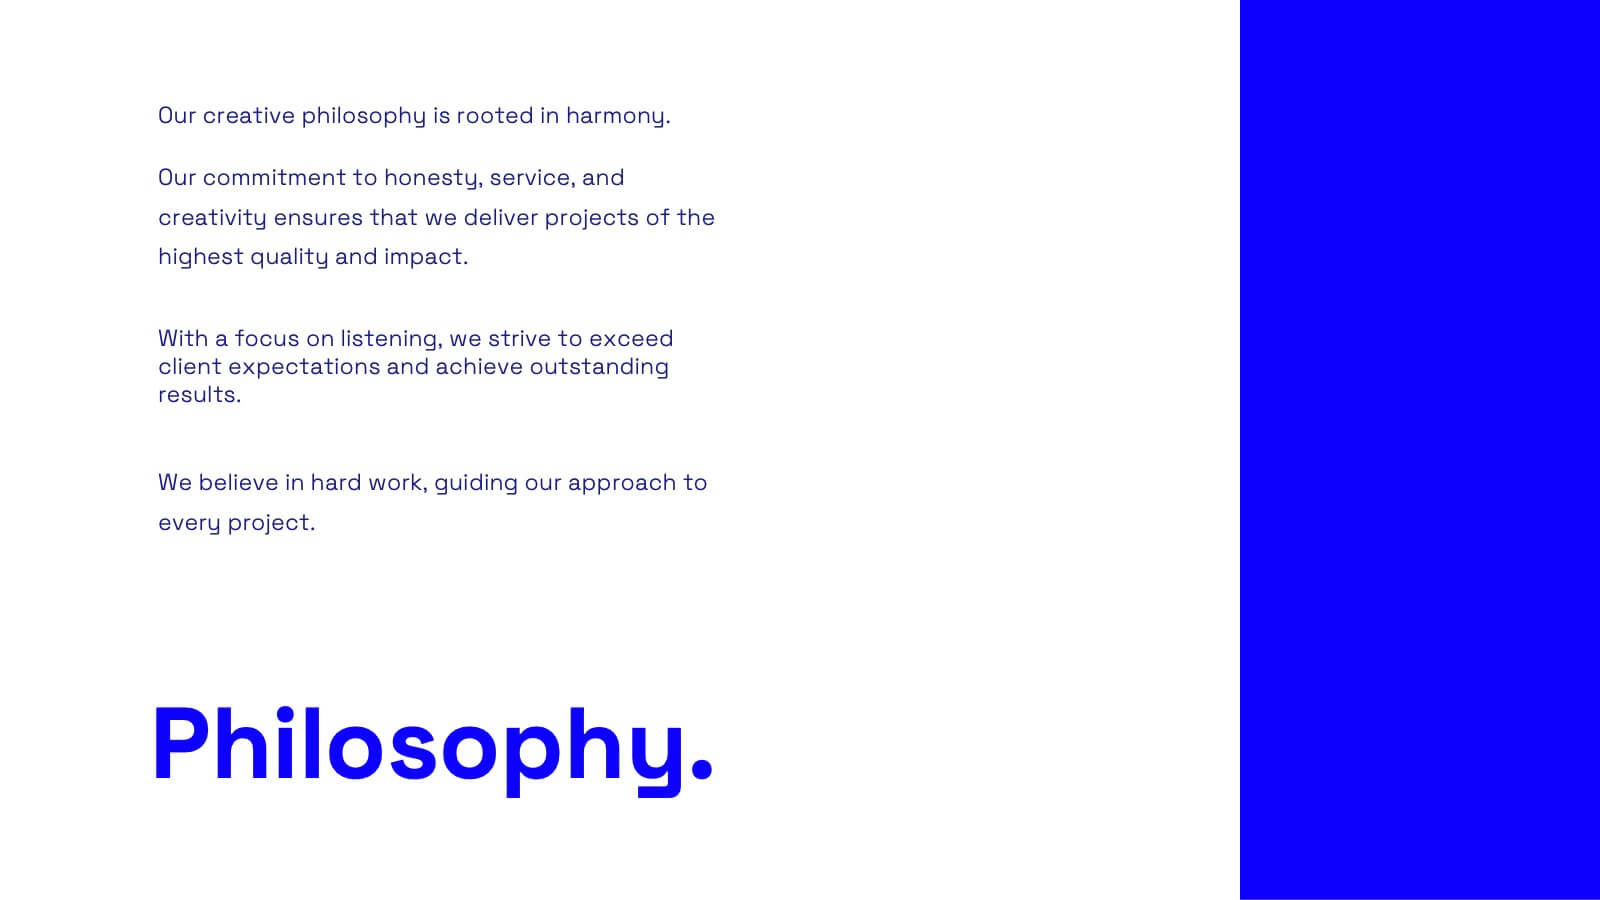
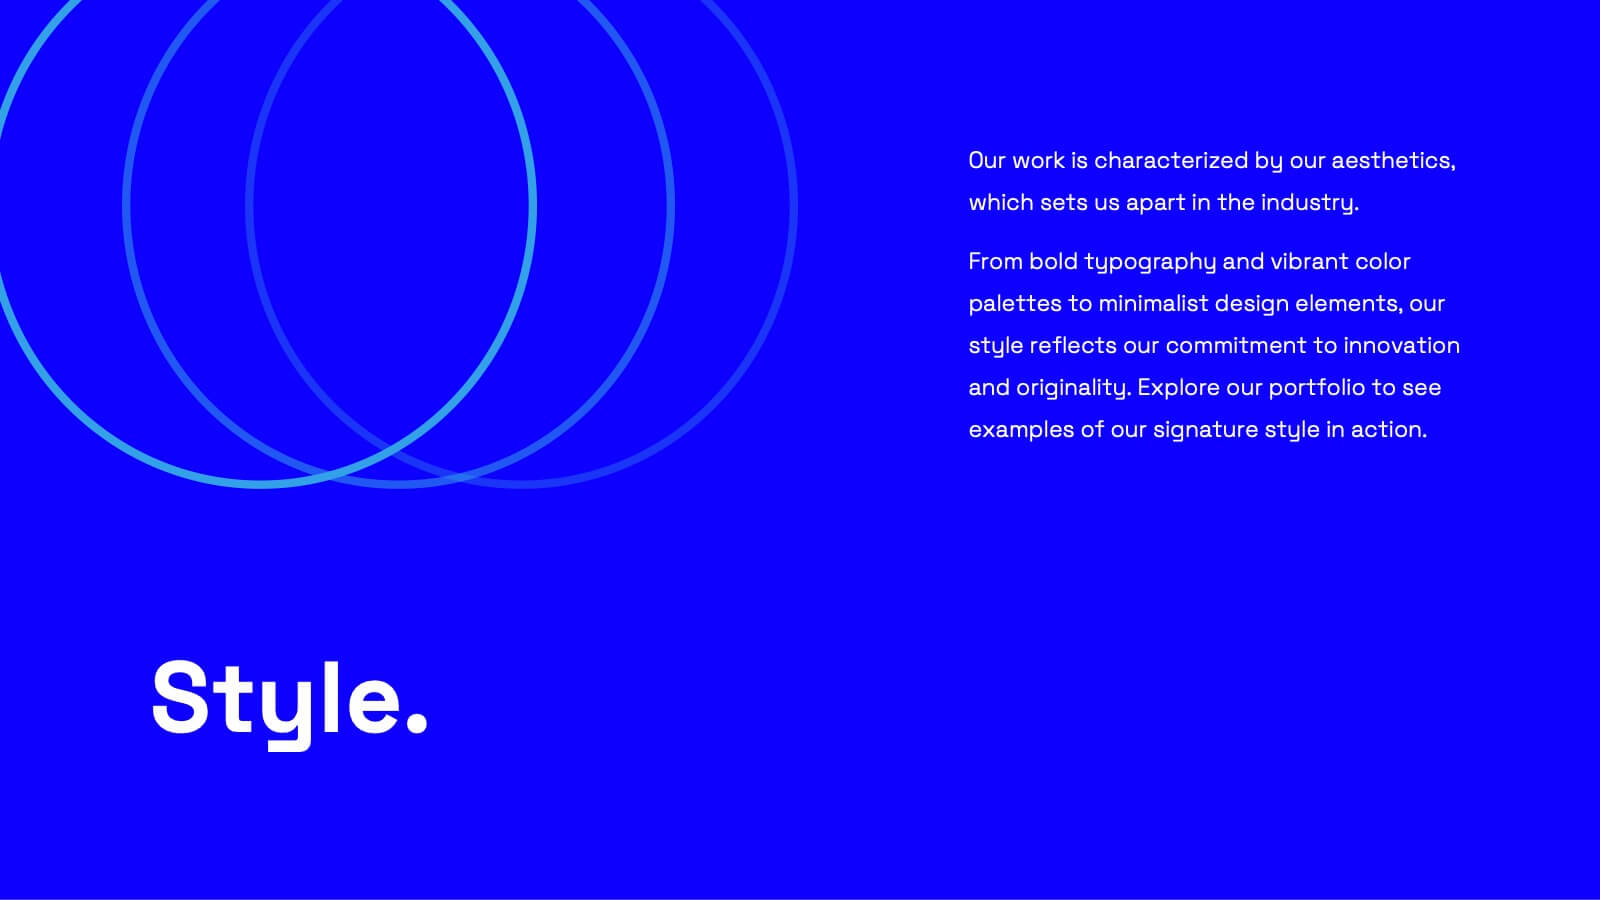
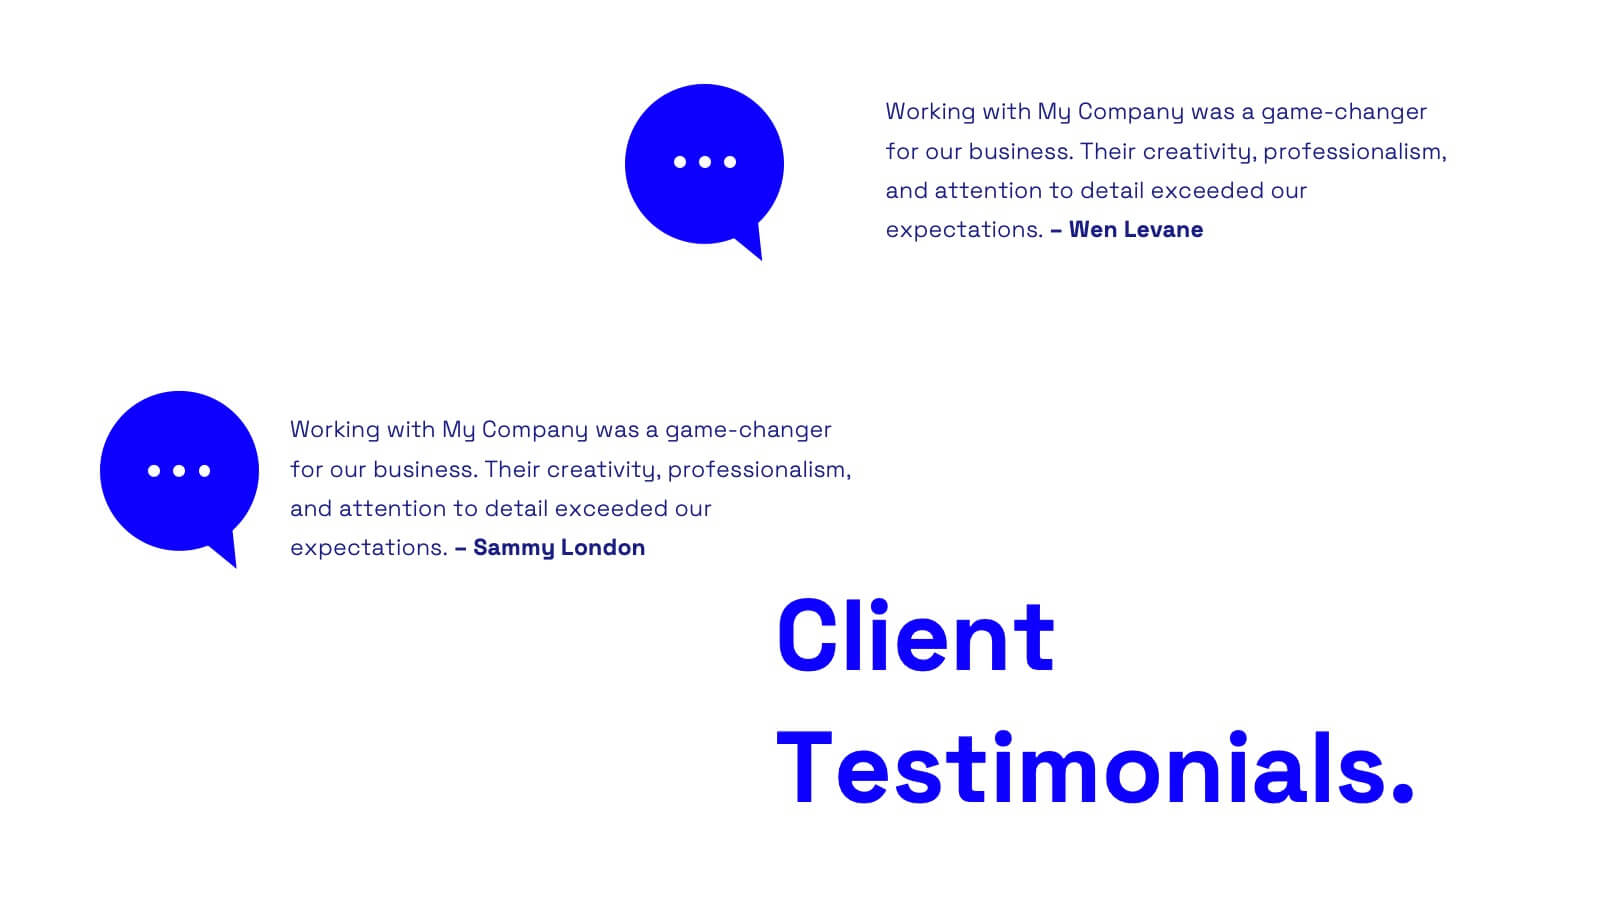
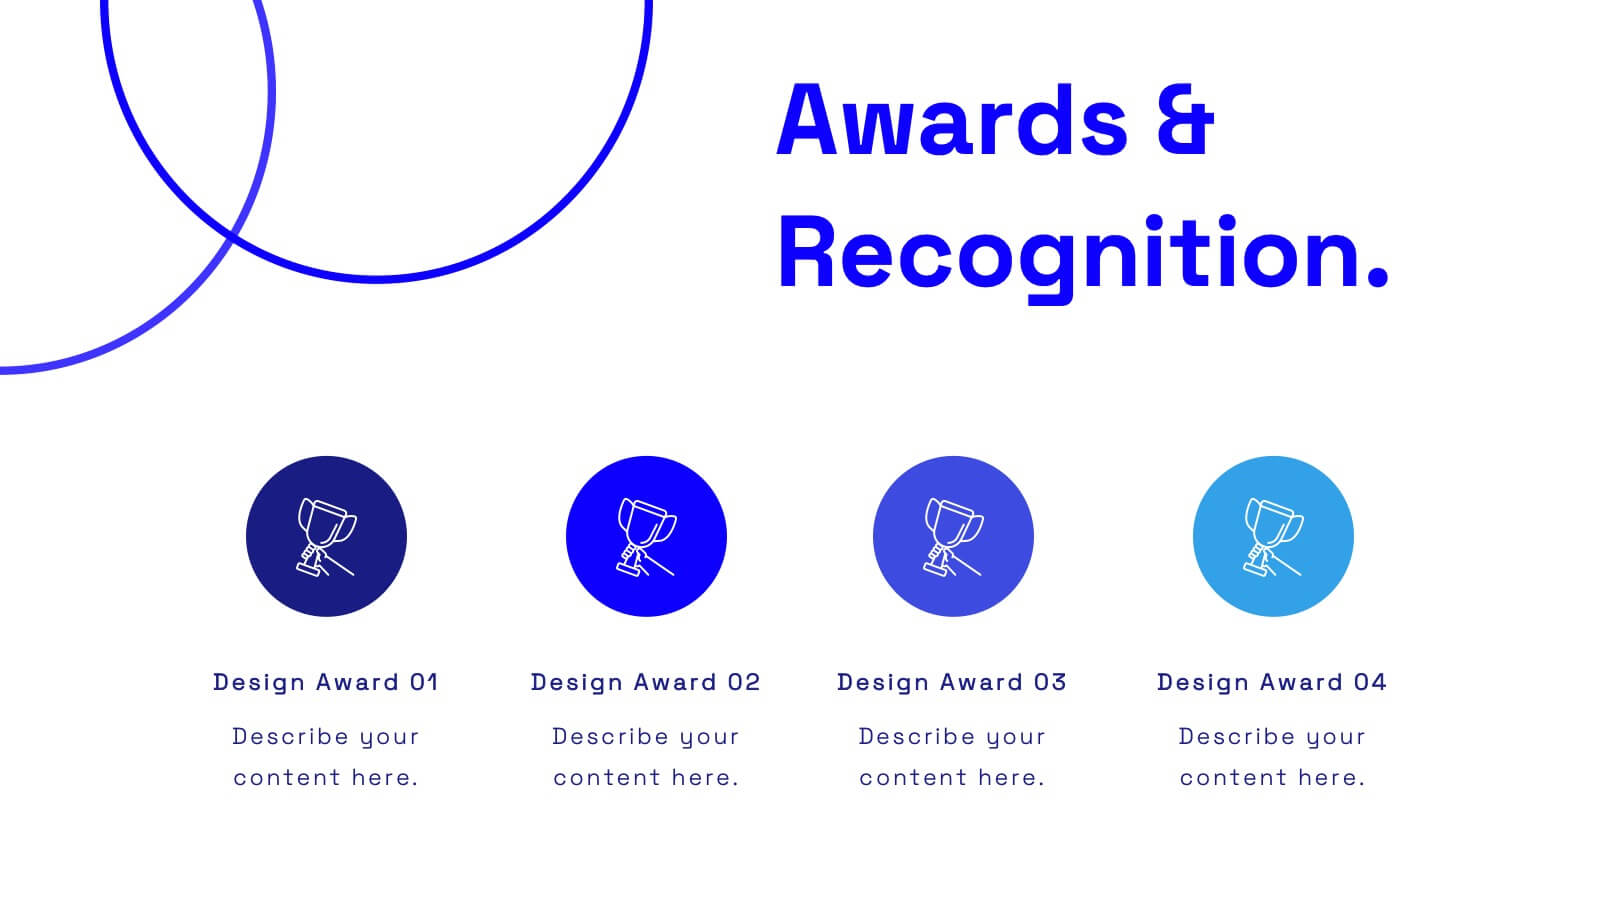
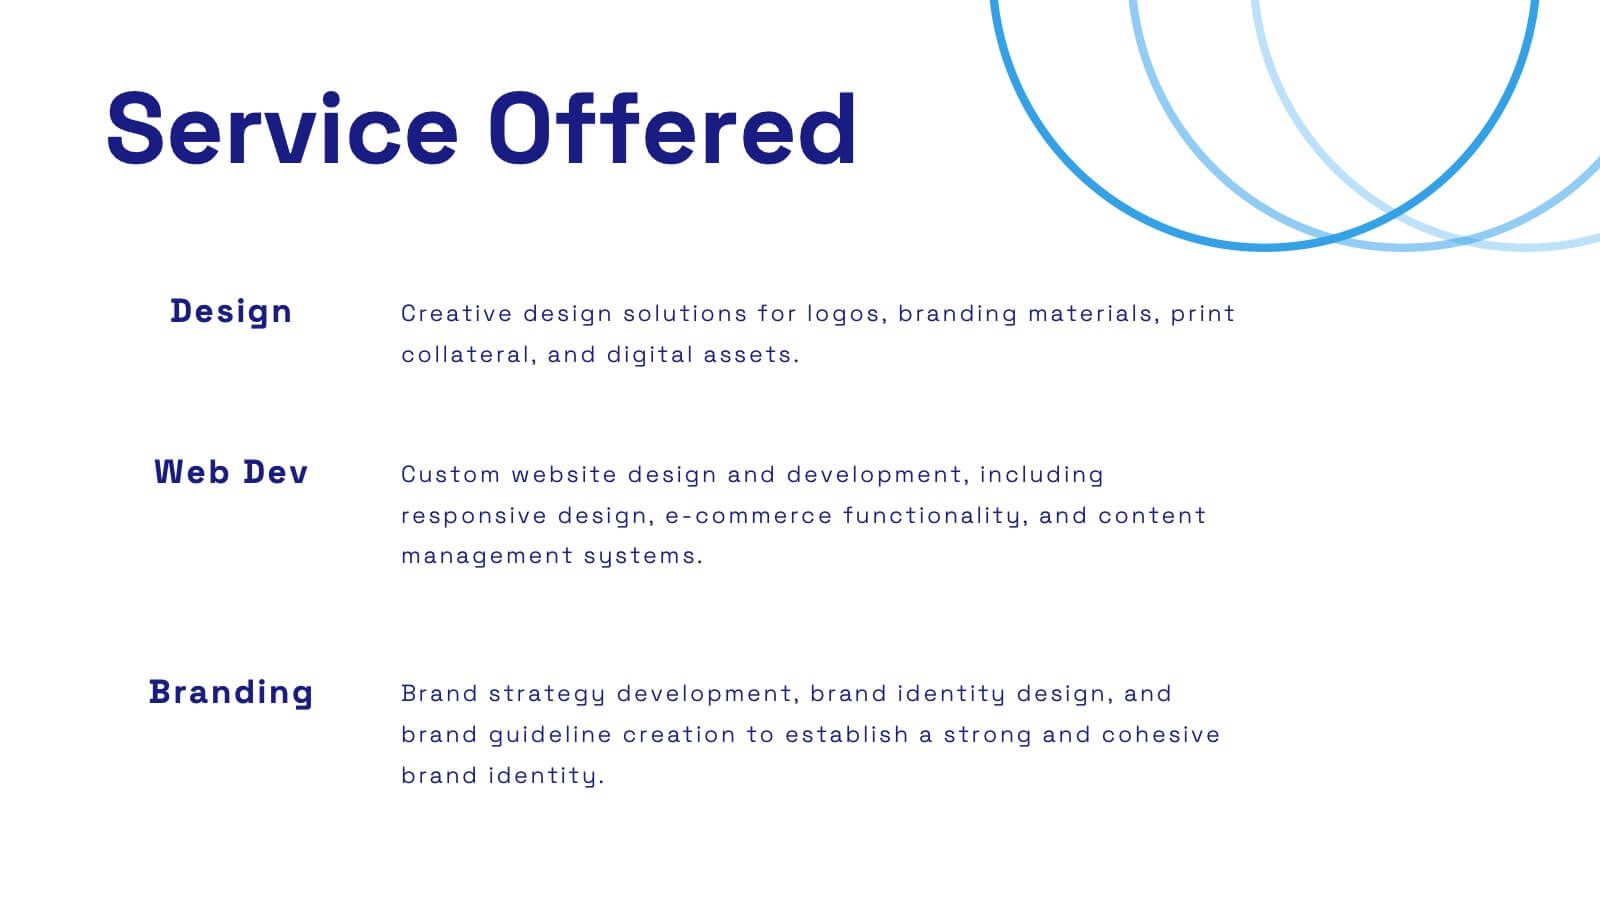
Wanderer Professional Portfolio Showcase Presentation
Showcase your creative work with this sleek, modern portfolio template. Perfect for highlighting your projects, philosophy, and client testimonials, it features a professional design with a dynamic layout. Display your awards, services offered, and pricing clearly to impress potential clients. Compatible with PowerPoint, Keynote, and Google Slides, it ensures seamless presentations on any platform.


4 diapositivas
Strategic Takeaways and Final Points Presentation
Summarize key insights and final thoughts with this clean, icon-based layout. Ideal for wrapping up business reviews, strategy decks, or executive briefings, each section includes room for concise summaries and visuals. Easily customizable in PowerPoint, Keynote, and Google Slides to match your brand and presentation goals.


26 diapositivas
Fundraising Event Presentation
Inspire generosity and support for your cause with our Fundraising Event presentation template, ideal for PowerPoint, Keynote, and Google Slides. This template is crafted with non-profit organizations, charity foundations, and event coordinators in mind, featuring a heartwarming design that encourages giving and communal effort. The slides are tailored to highlight the importance of philanthropy, with 'big image slides' to tell the stories of those you're helping, 'process infographics' to explain how donations are used, and 'chart slides' to show the impact of collected funds. The soothing color palette and thoughtful graphics create an atmosphere of hope and solidarity. Our Fundraising Event template is more than just a collection of slides; it's a powerful storytelling tool that can galvanize audiences into action. Download it now to create a moving presentation that not only shares the vision of your event but also rallies the community around your noble cause.


26 diapositivas
Katlina Presentation Template
Everyone wants to be on top of their SEO game. This Katlina presentation template provides a way for you to teach your audience about the importance of Search Engine Optimization. Start creating your own slides with this template. With fun graphics that will also make the information more interesting and easy to understand charts and timelines.This presentation will help your audience see how they can increase their sites visibility in search results. It can also be use for your presentations at work or in class due to it's customizability. Get started today makeing an impact in your industry.


6 diapositivas
Educational A-Z Letter Chart Presentation
Clear, structured, and easy to navigate, this Educational A-Z Letter Chart presentation visually organizes key topics using letter-coded icons and titles. Ideal for learning journeys, curriculum overviews, or training modules. Fully editable in Canva, making it simple to adapt for any subject or audience. Clean and professional layout.


26 diapositivas
Leyna Presentation Template
Leyna is an elegant and minimalist wedding planner presentation template. This wonderful presentation template will help couples know what all you’ll offer as a wedding planner. We have made it easy for you this this multipurpose template because you will be able to edit easily to make sure it fits what you need. We have built a clean, responsive and modern design for them to have a great experience on what they are looking for in the best way possible. This template provides a professional and clean design for your business or personal use. It's time to impress the potential clients!


21 diapositivas
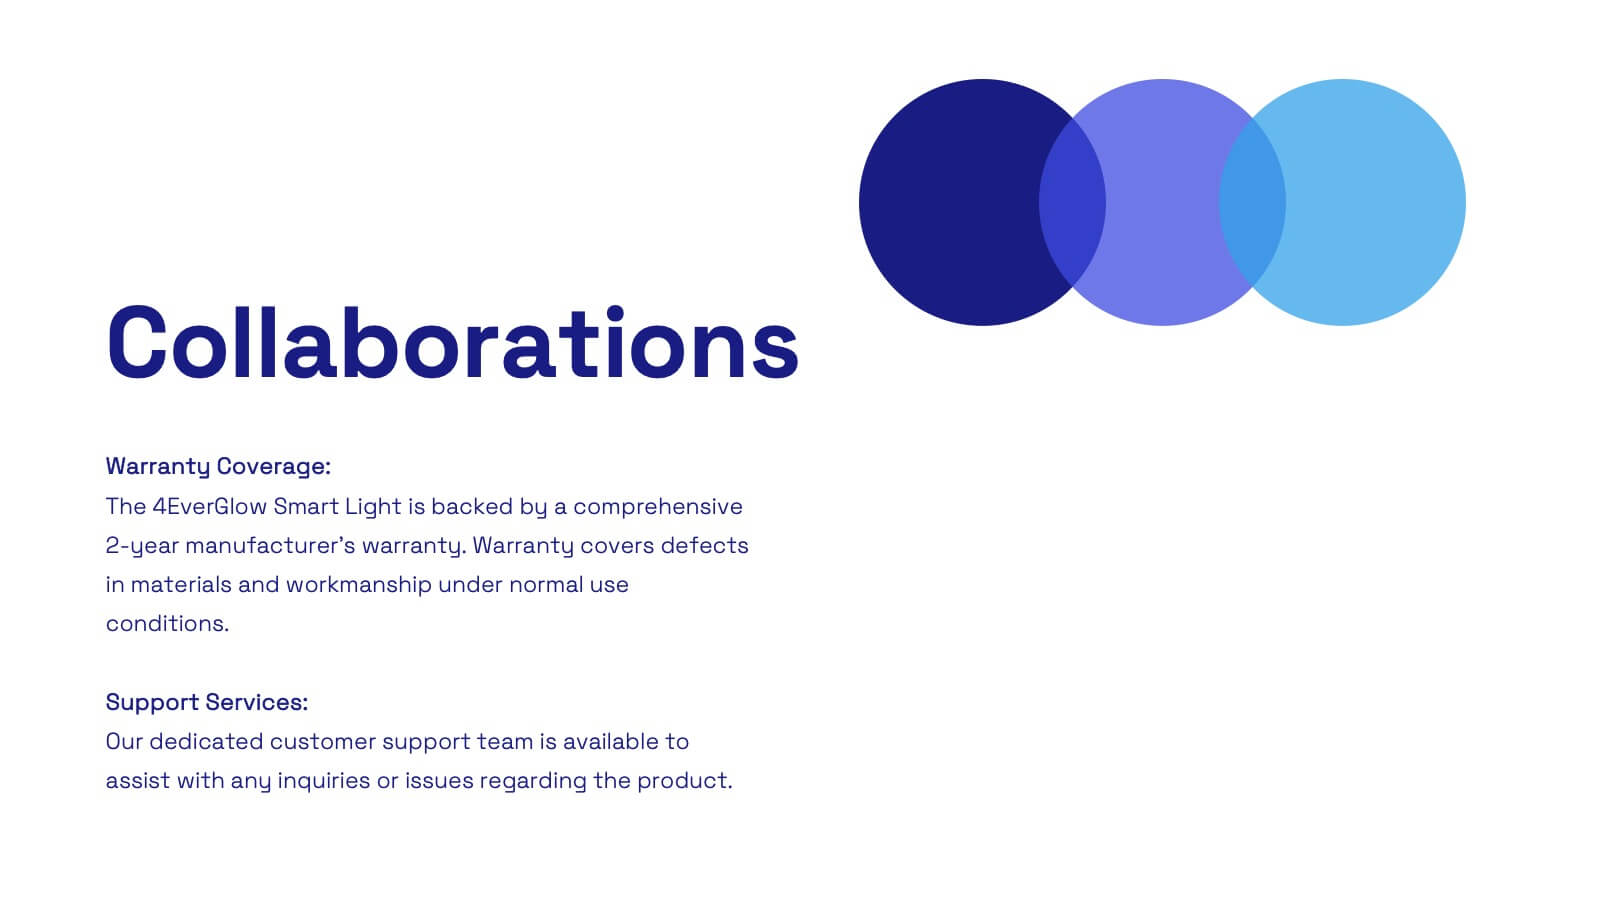
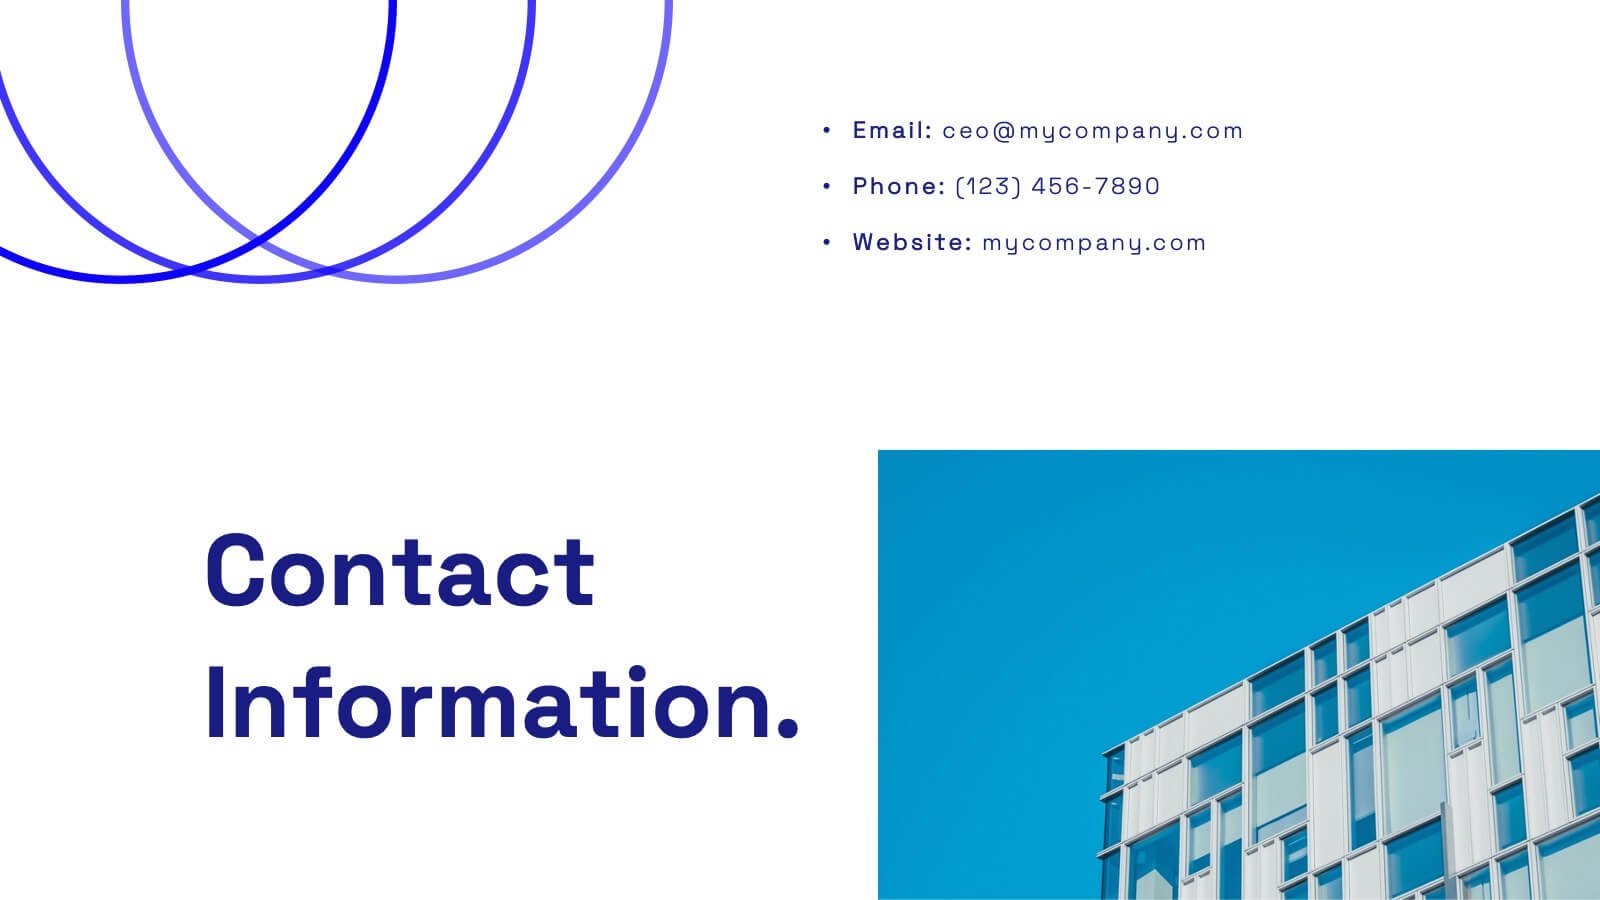
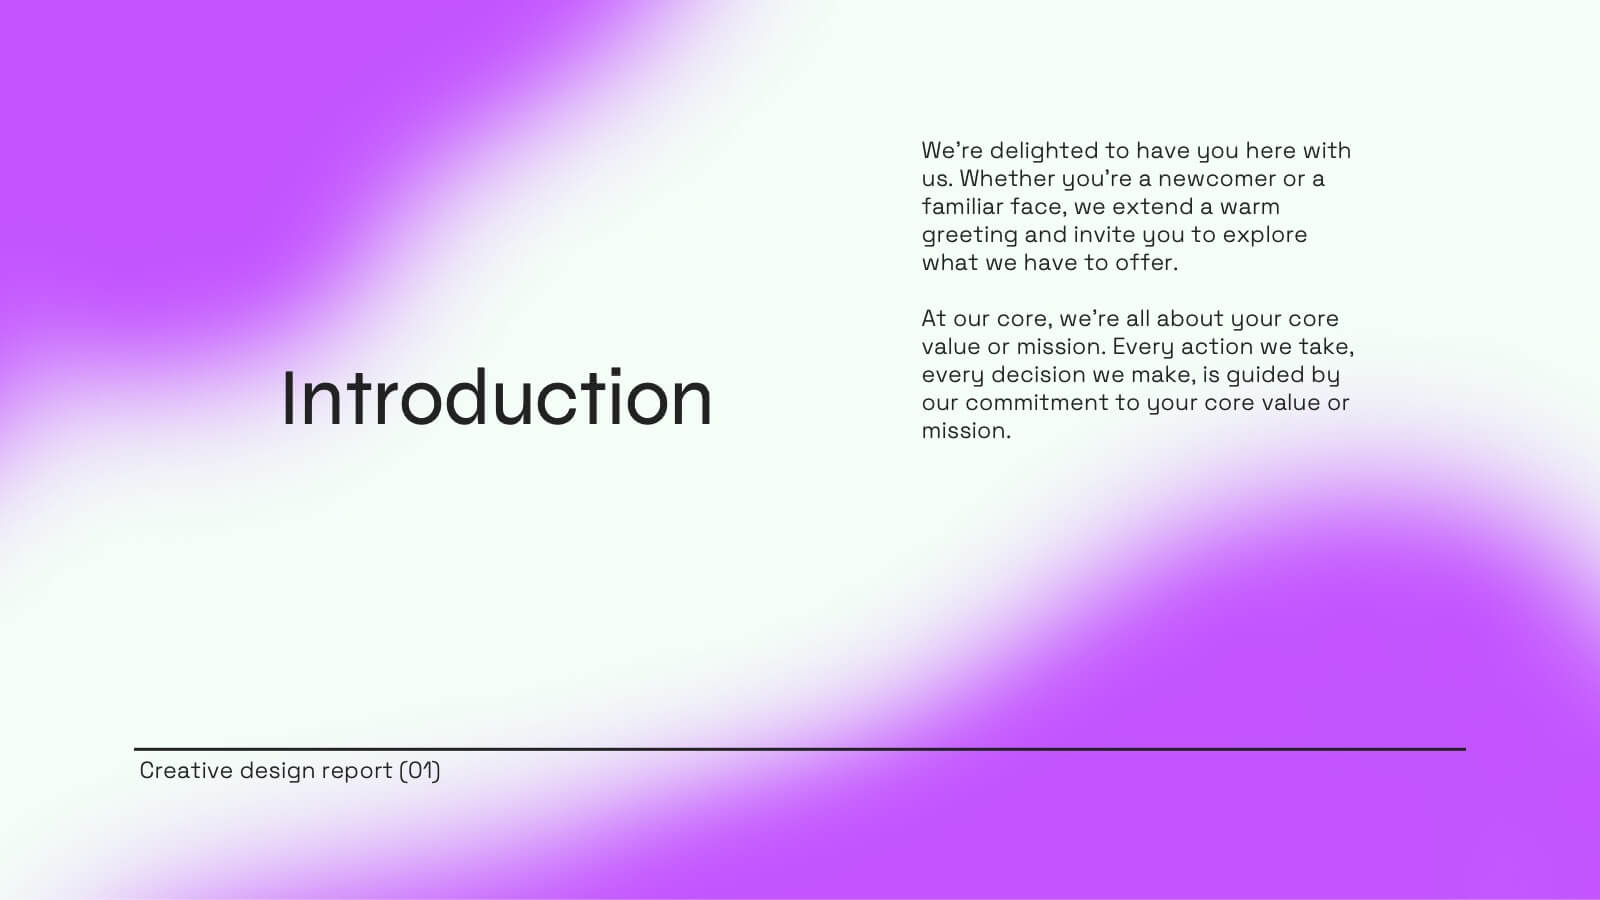
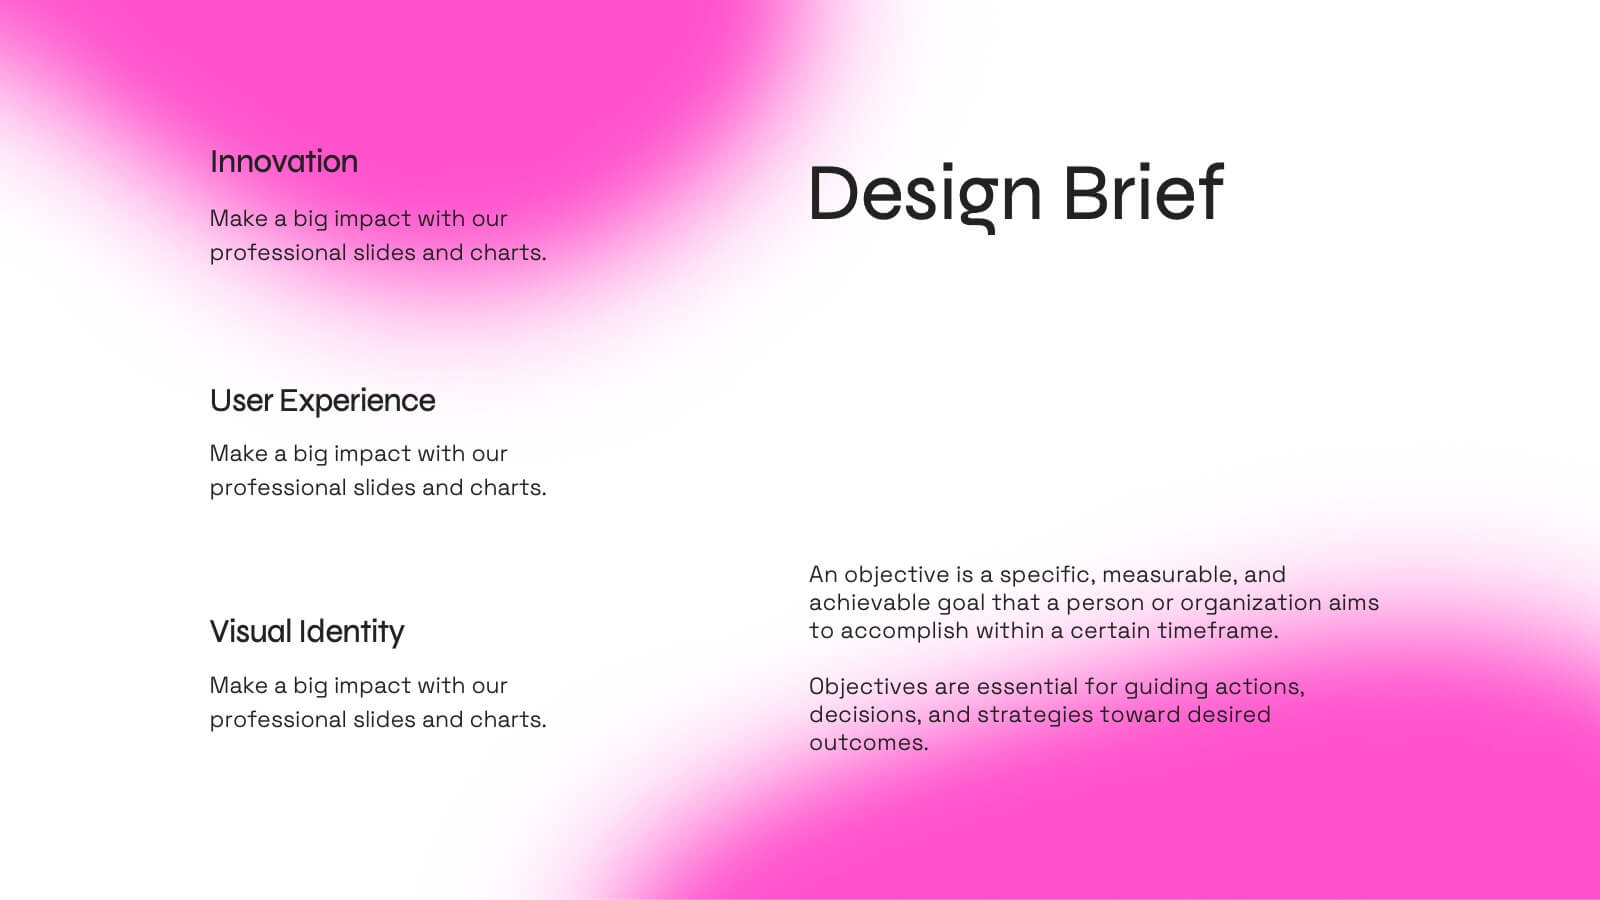
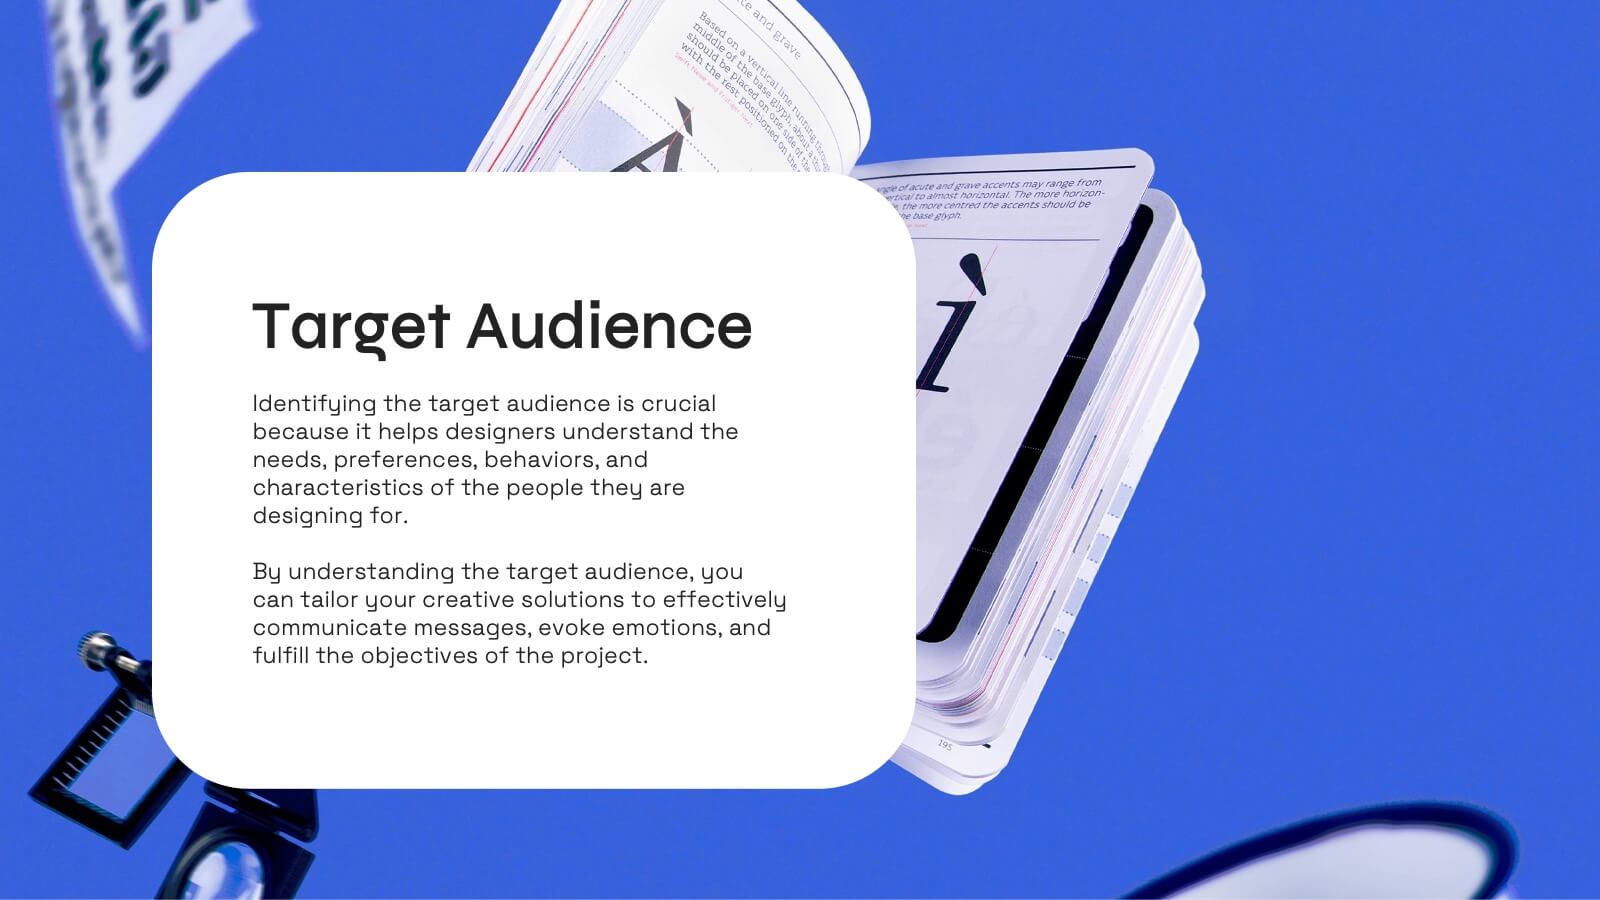
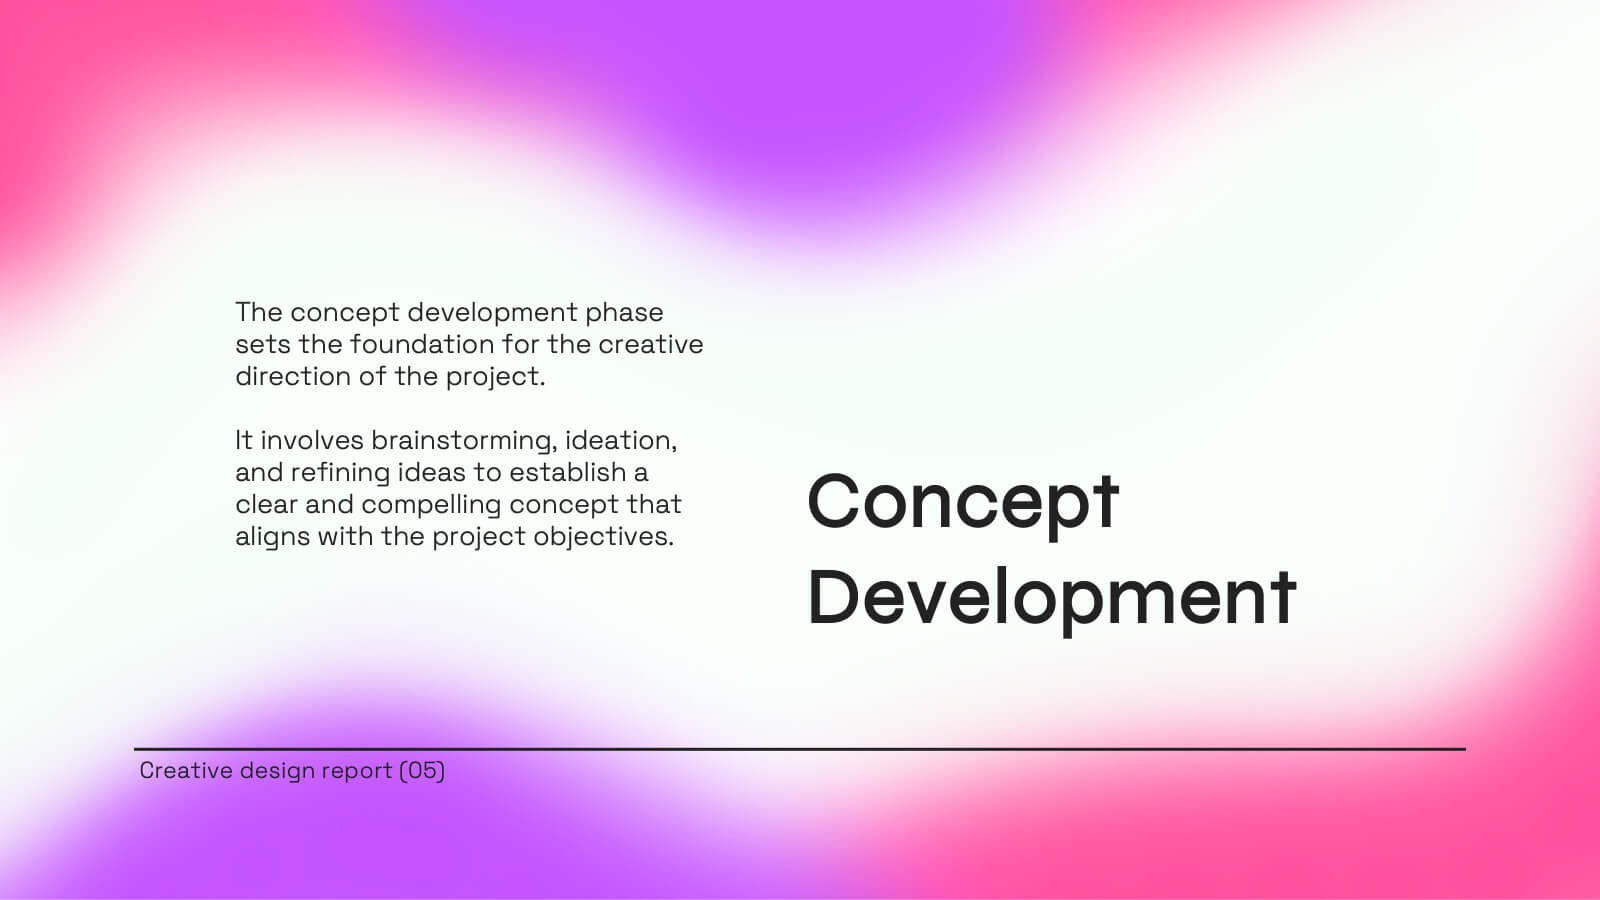
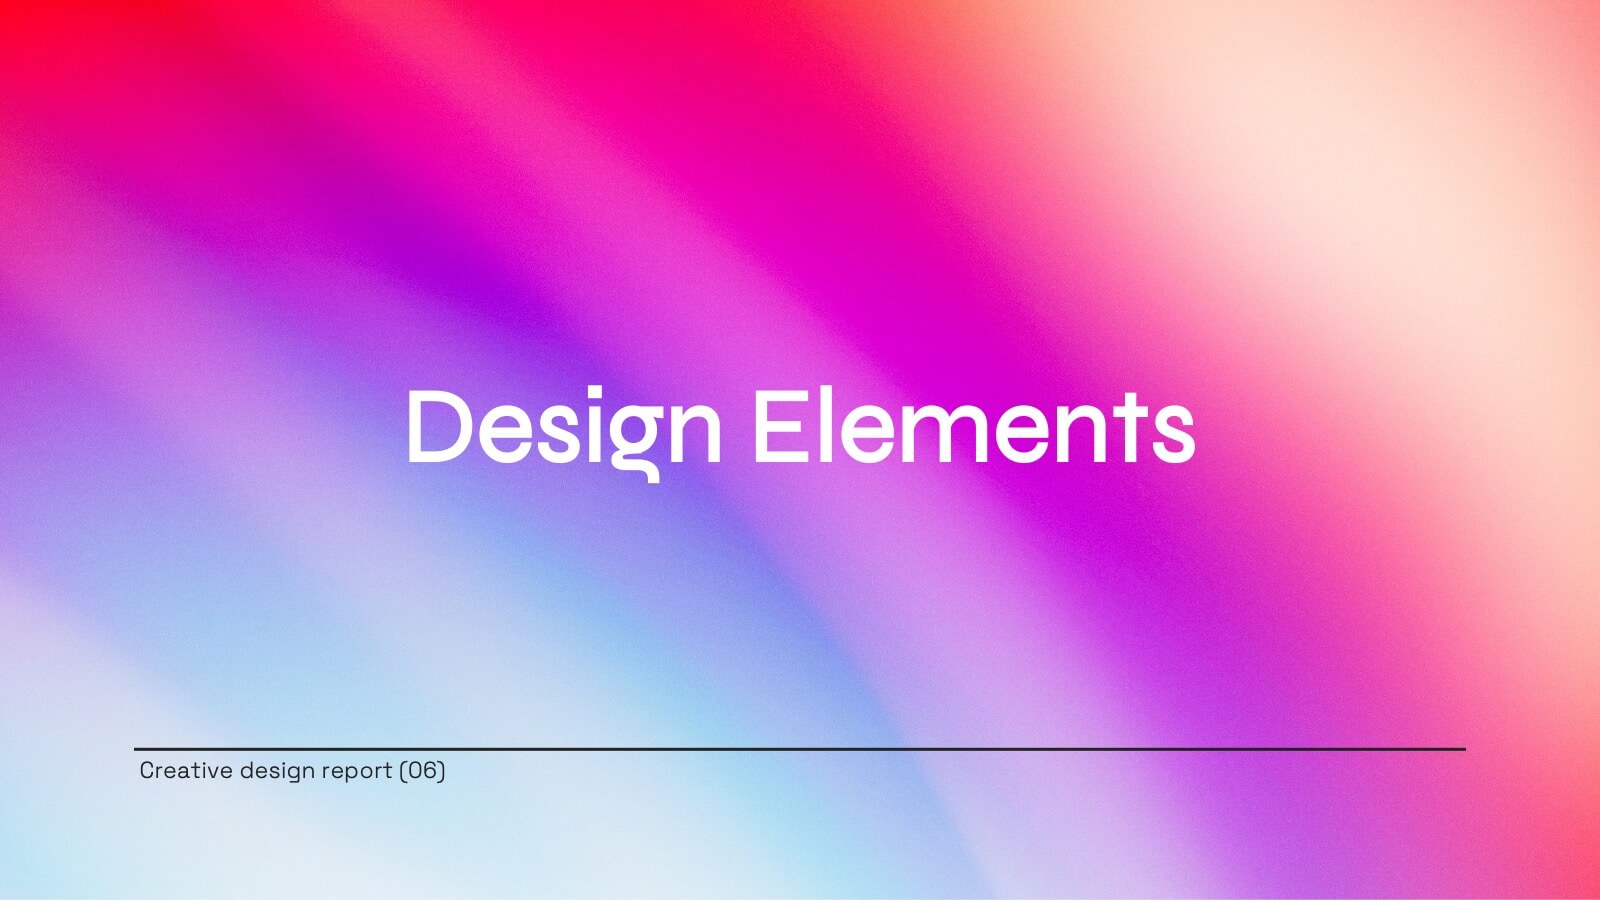
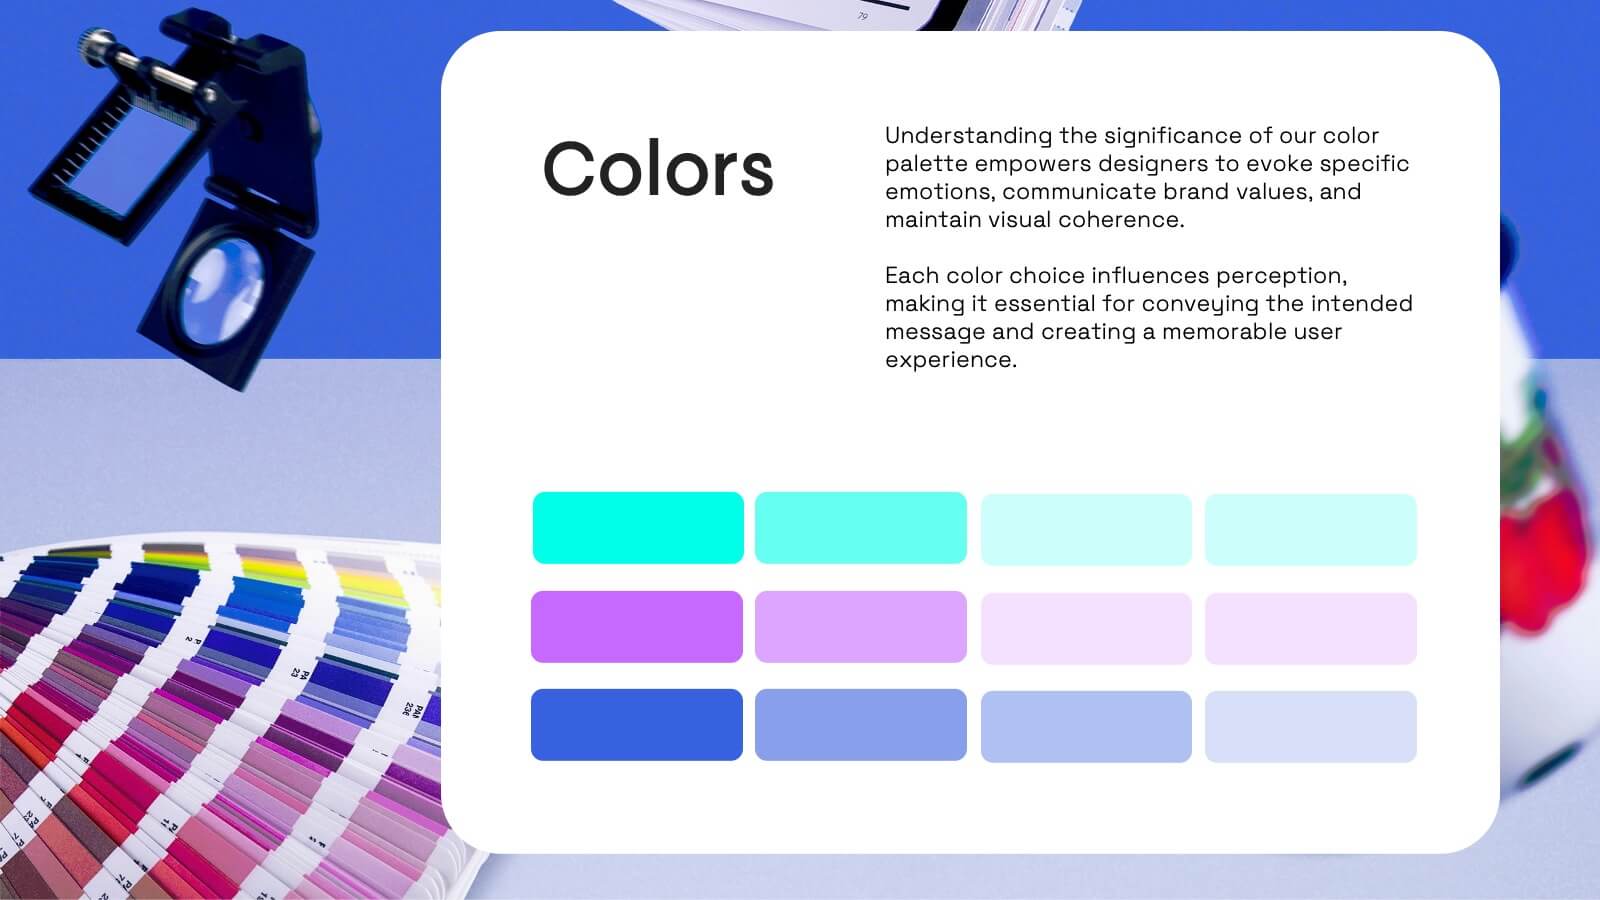
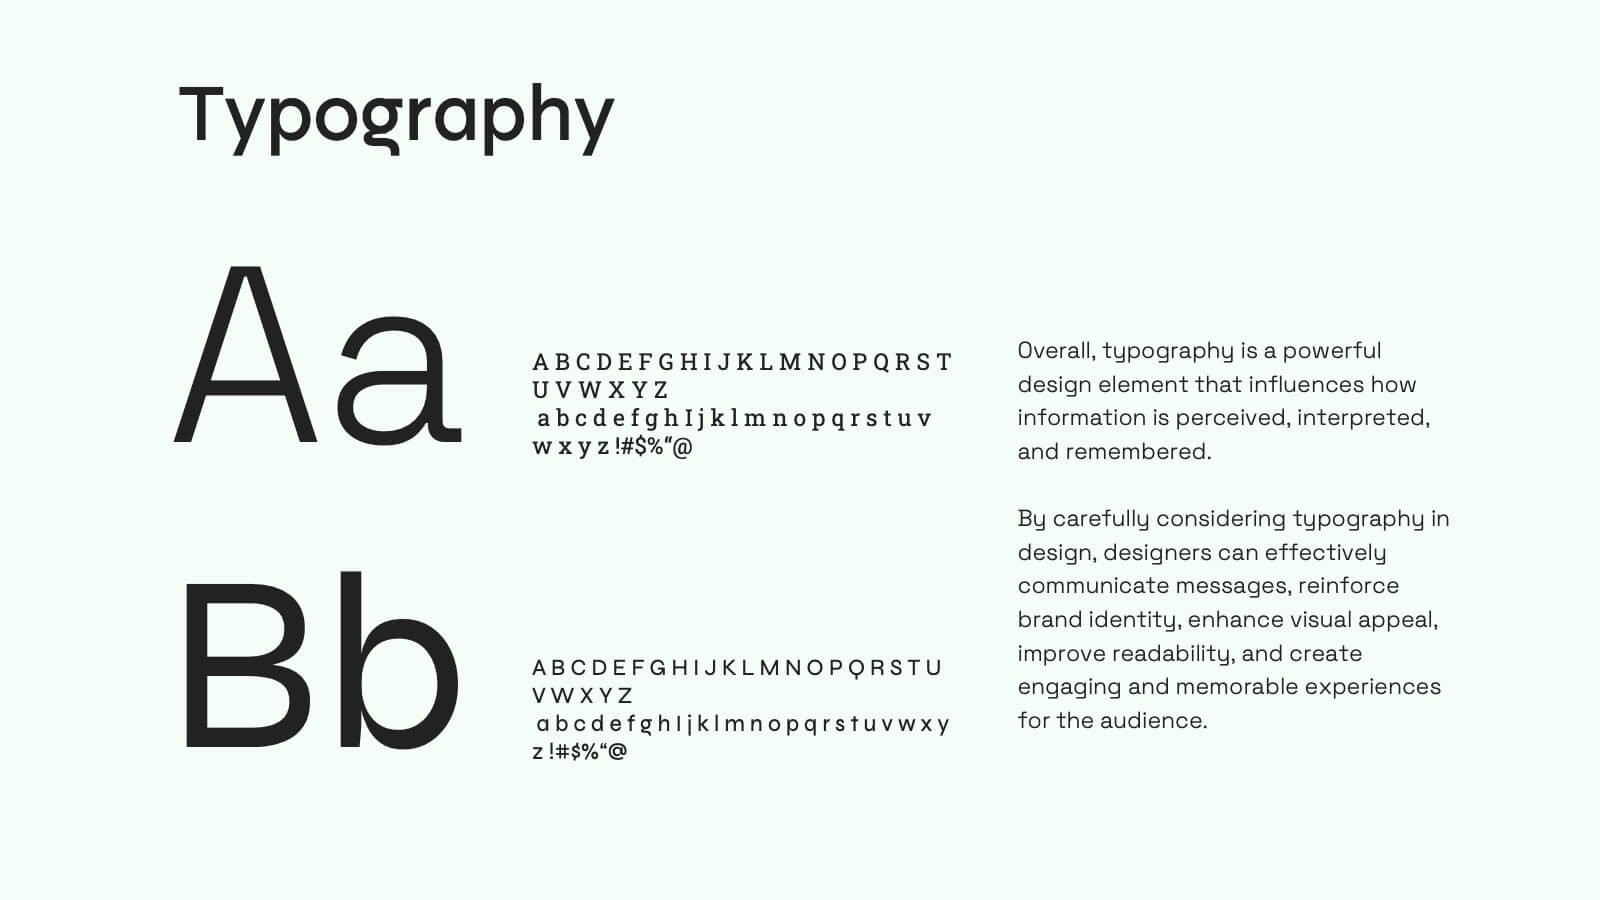
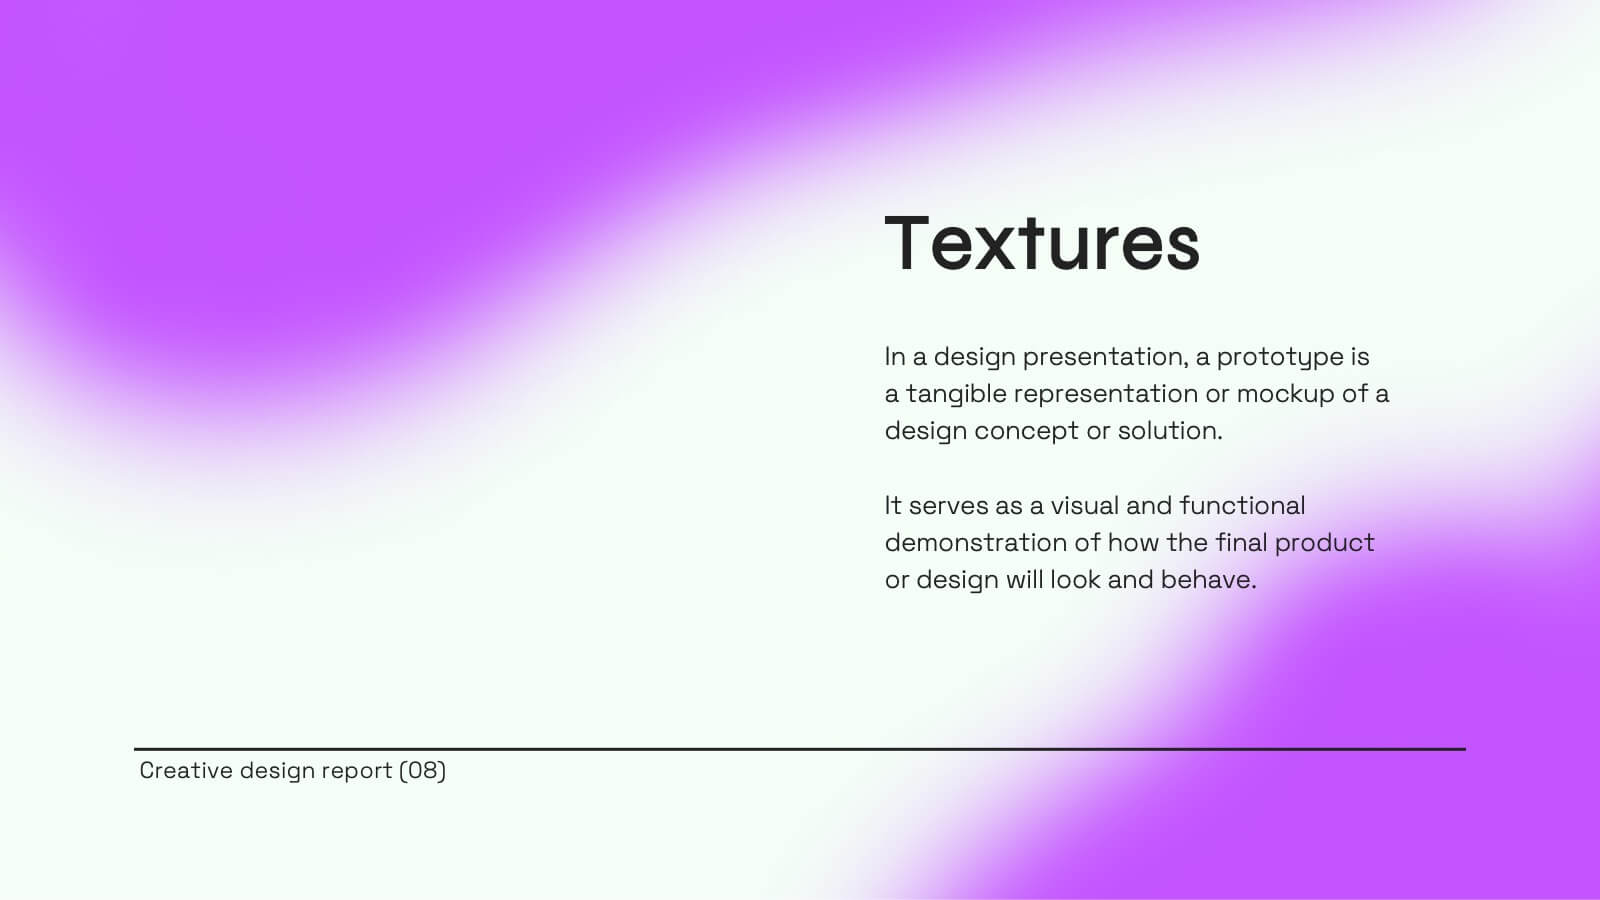
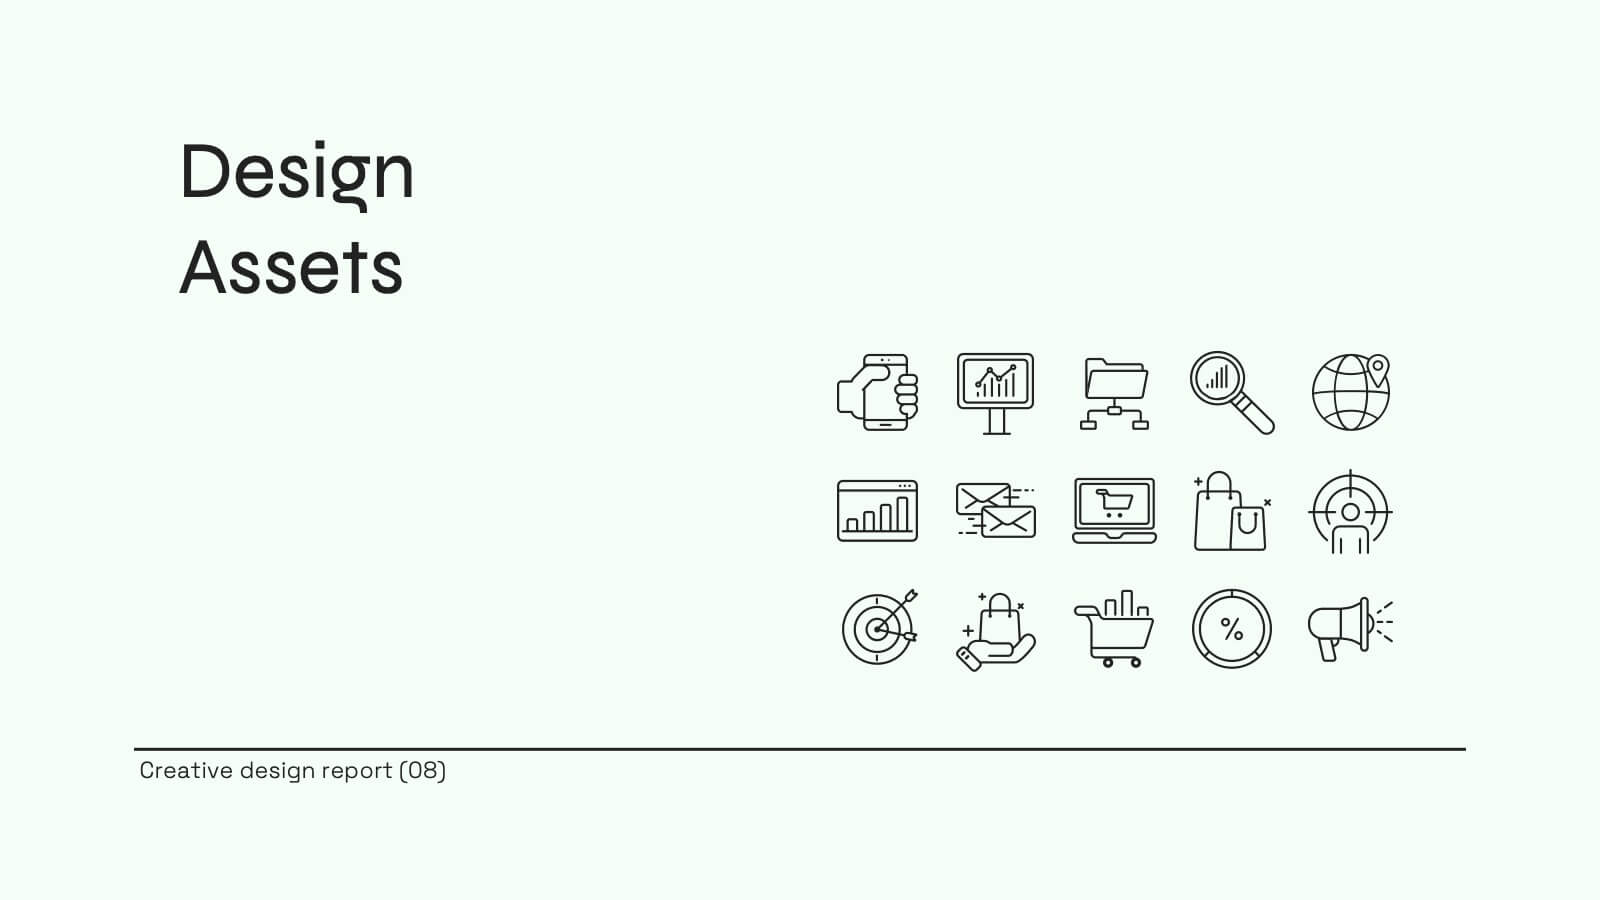
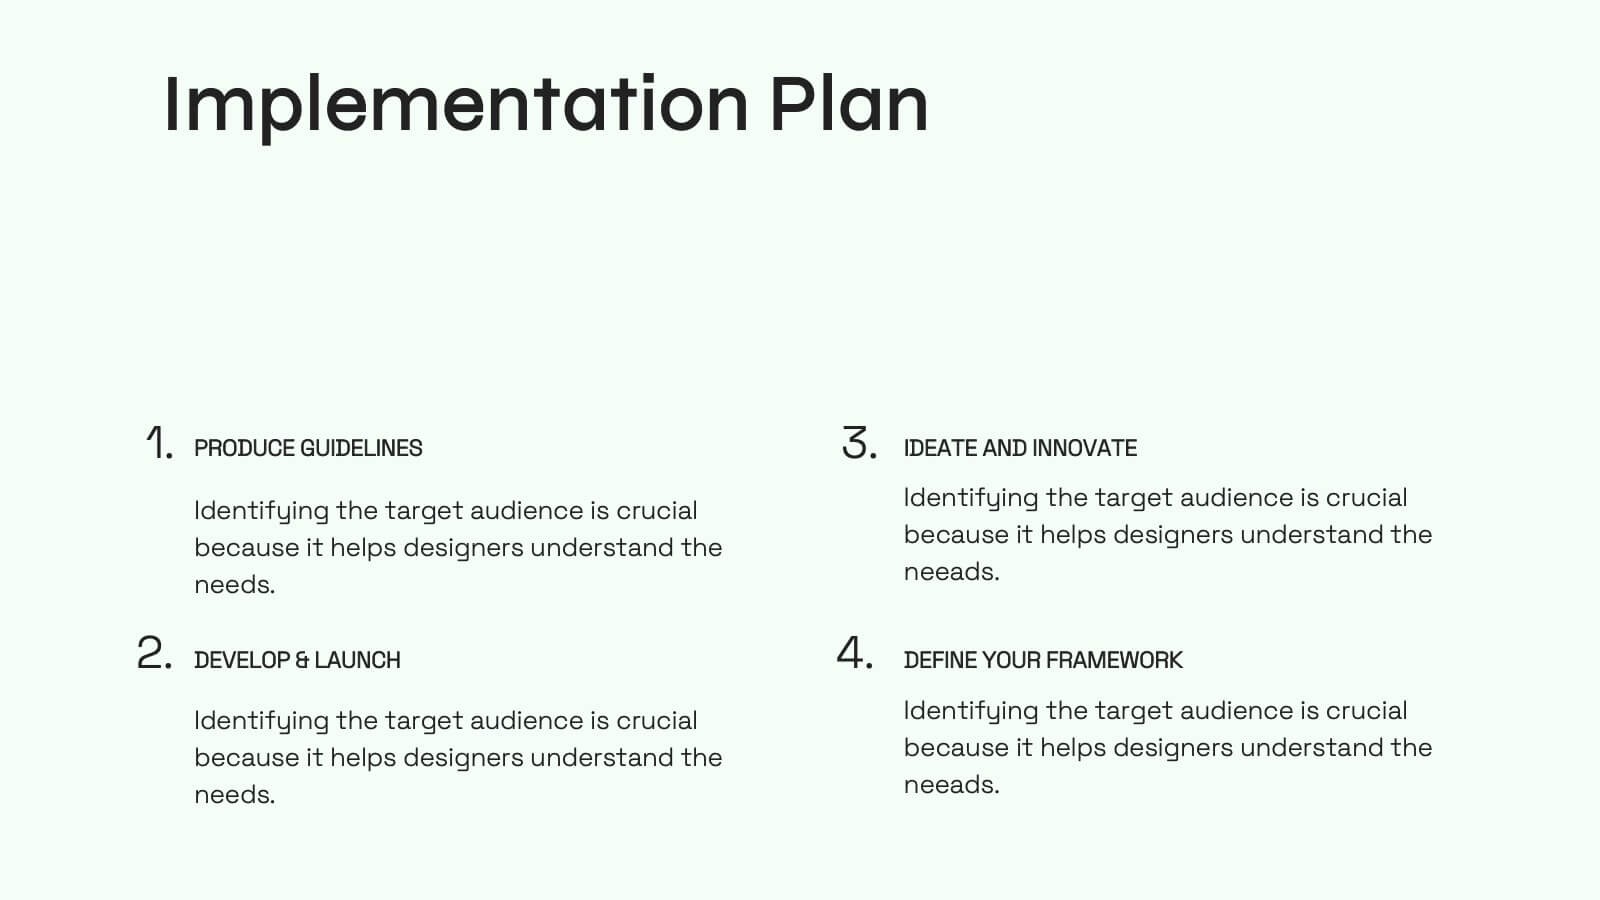
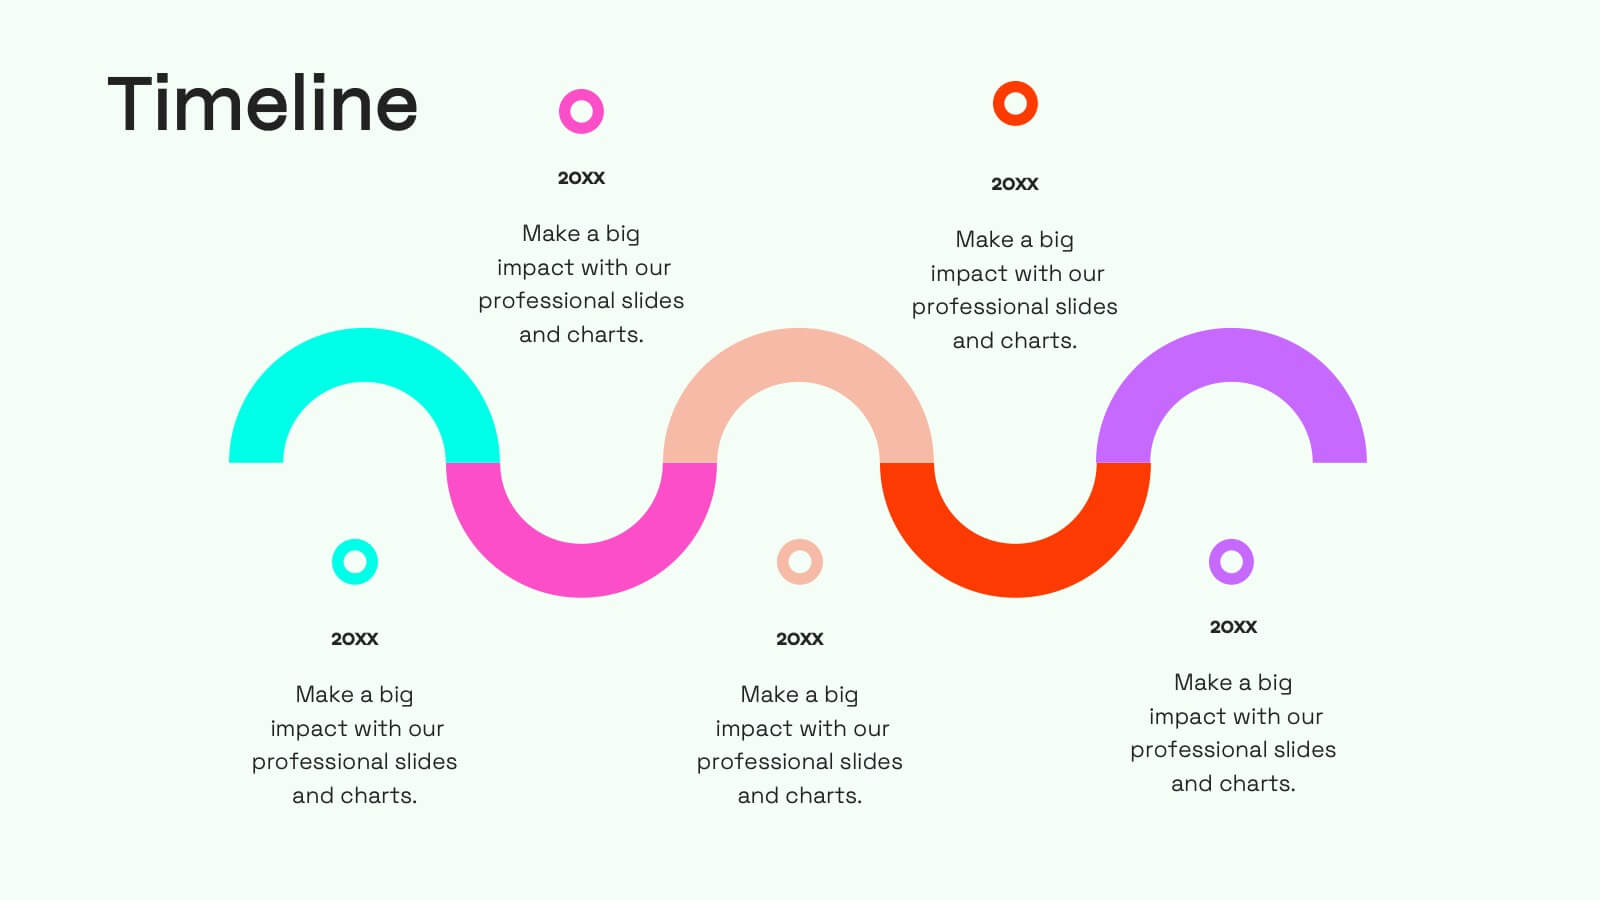
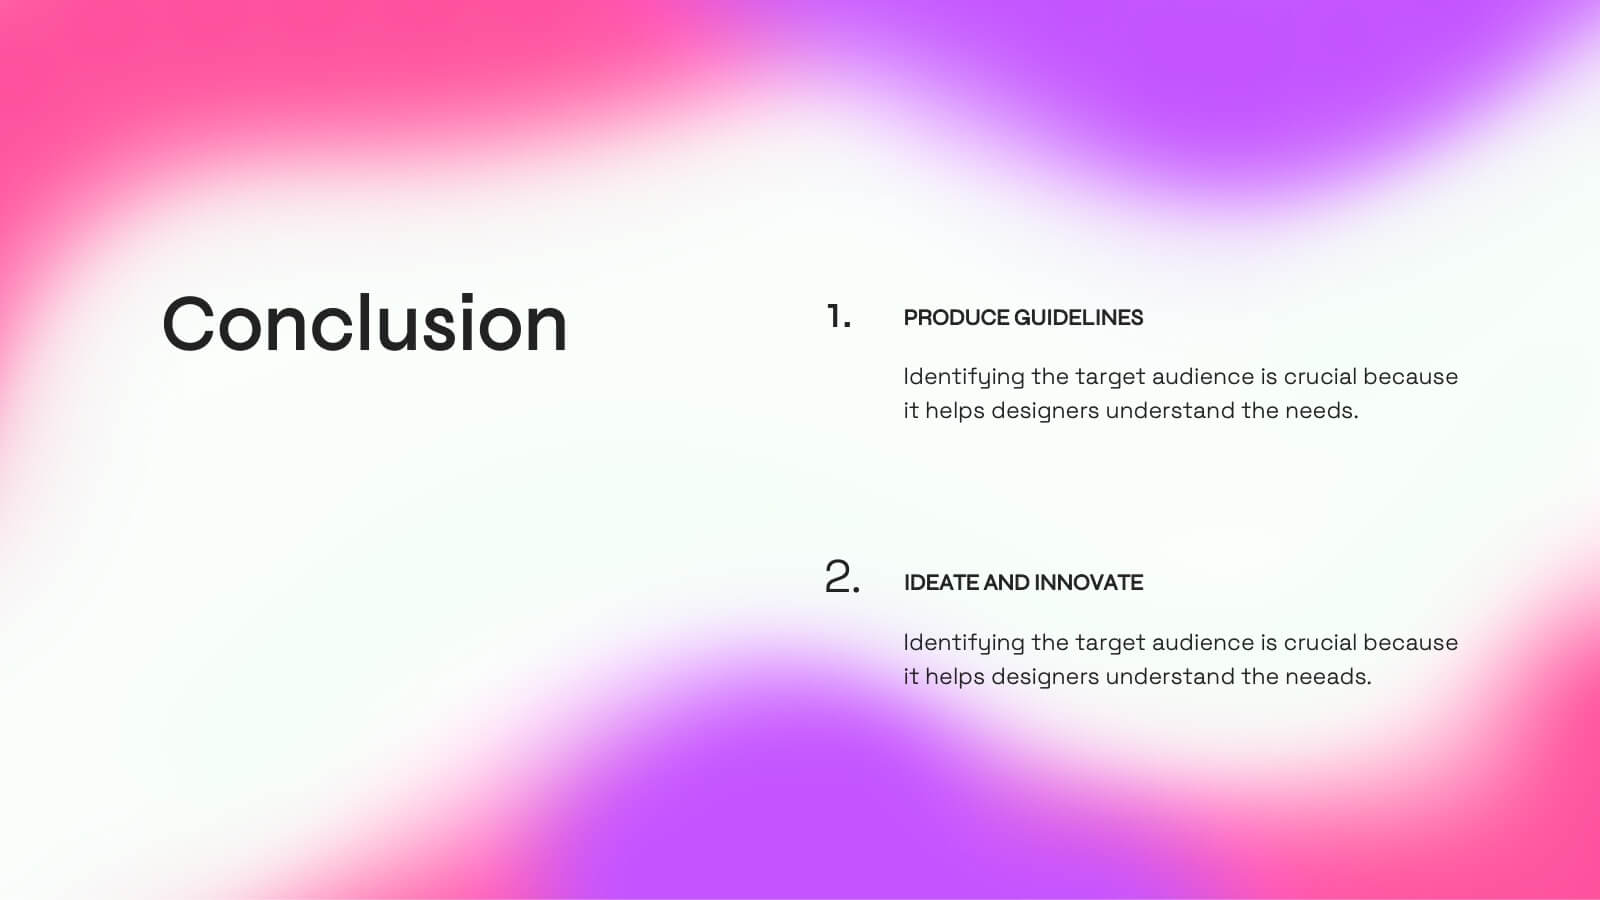
Jade Creative Design Report Presentation
Transform your design report into a captivating visual experience with this elegant jade-themed presentation template! Ideal for showcasing your creative projects, it effectively highlights key concepts, methodologies, and outcomes in a polished format. With its striking design, your work will impress clients and stakeholders alike. Compatible with PowerPoint, Keynote, and Google Slides.


4 diapositivas
Task and Role Allocation Matrix
Clarify team responsibilities with this modern Task and Role Allocation Matrix. Easily visualize who is Responsible, Accountable, Contributing, and Informed for each task. Ideal for team leaders, HR planners, and project coordinators. Fully customizable in PowerPoint, Keynote, and Google Slides.


22 diapositivas
Wave Startup Strategy Presentation
Pitch your startup strategy with this modern, vibrant template! It covers essentials like mission, vision, product overview, market analysis, and growth plans. Perfect for highlighting your team, financials, and milestones. Seamlessly compatible with PowerPoint, Keynote, and Google Slides for a smooth, professional presentation every time.


4 diapositivas
Global Business Distribution Layout Presentation
Visualize your company’s international footprint with this Global Business Distribution Layout. Perfect for showcasing market reach, branch networks, or regional performance. Features a clean world map design with customizable highlight zones. Fully editable in PowerPoint, Keynote, and Google Slides—ideal for corporate overviews, investor decks, and business expansion presentations.