


Características


¿Tienes alguna pregunta?
Recomendar


23 diapositivas
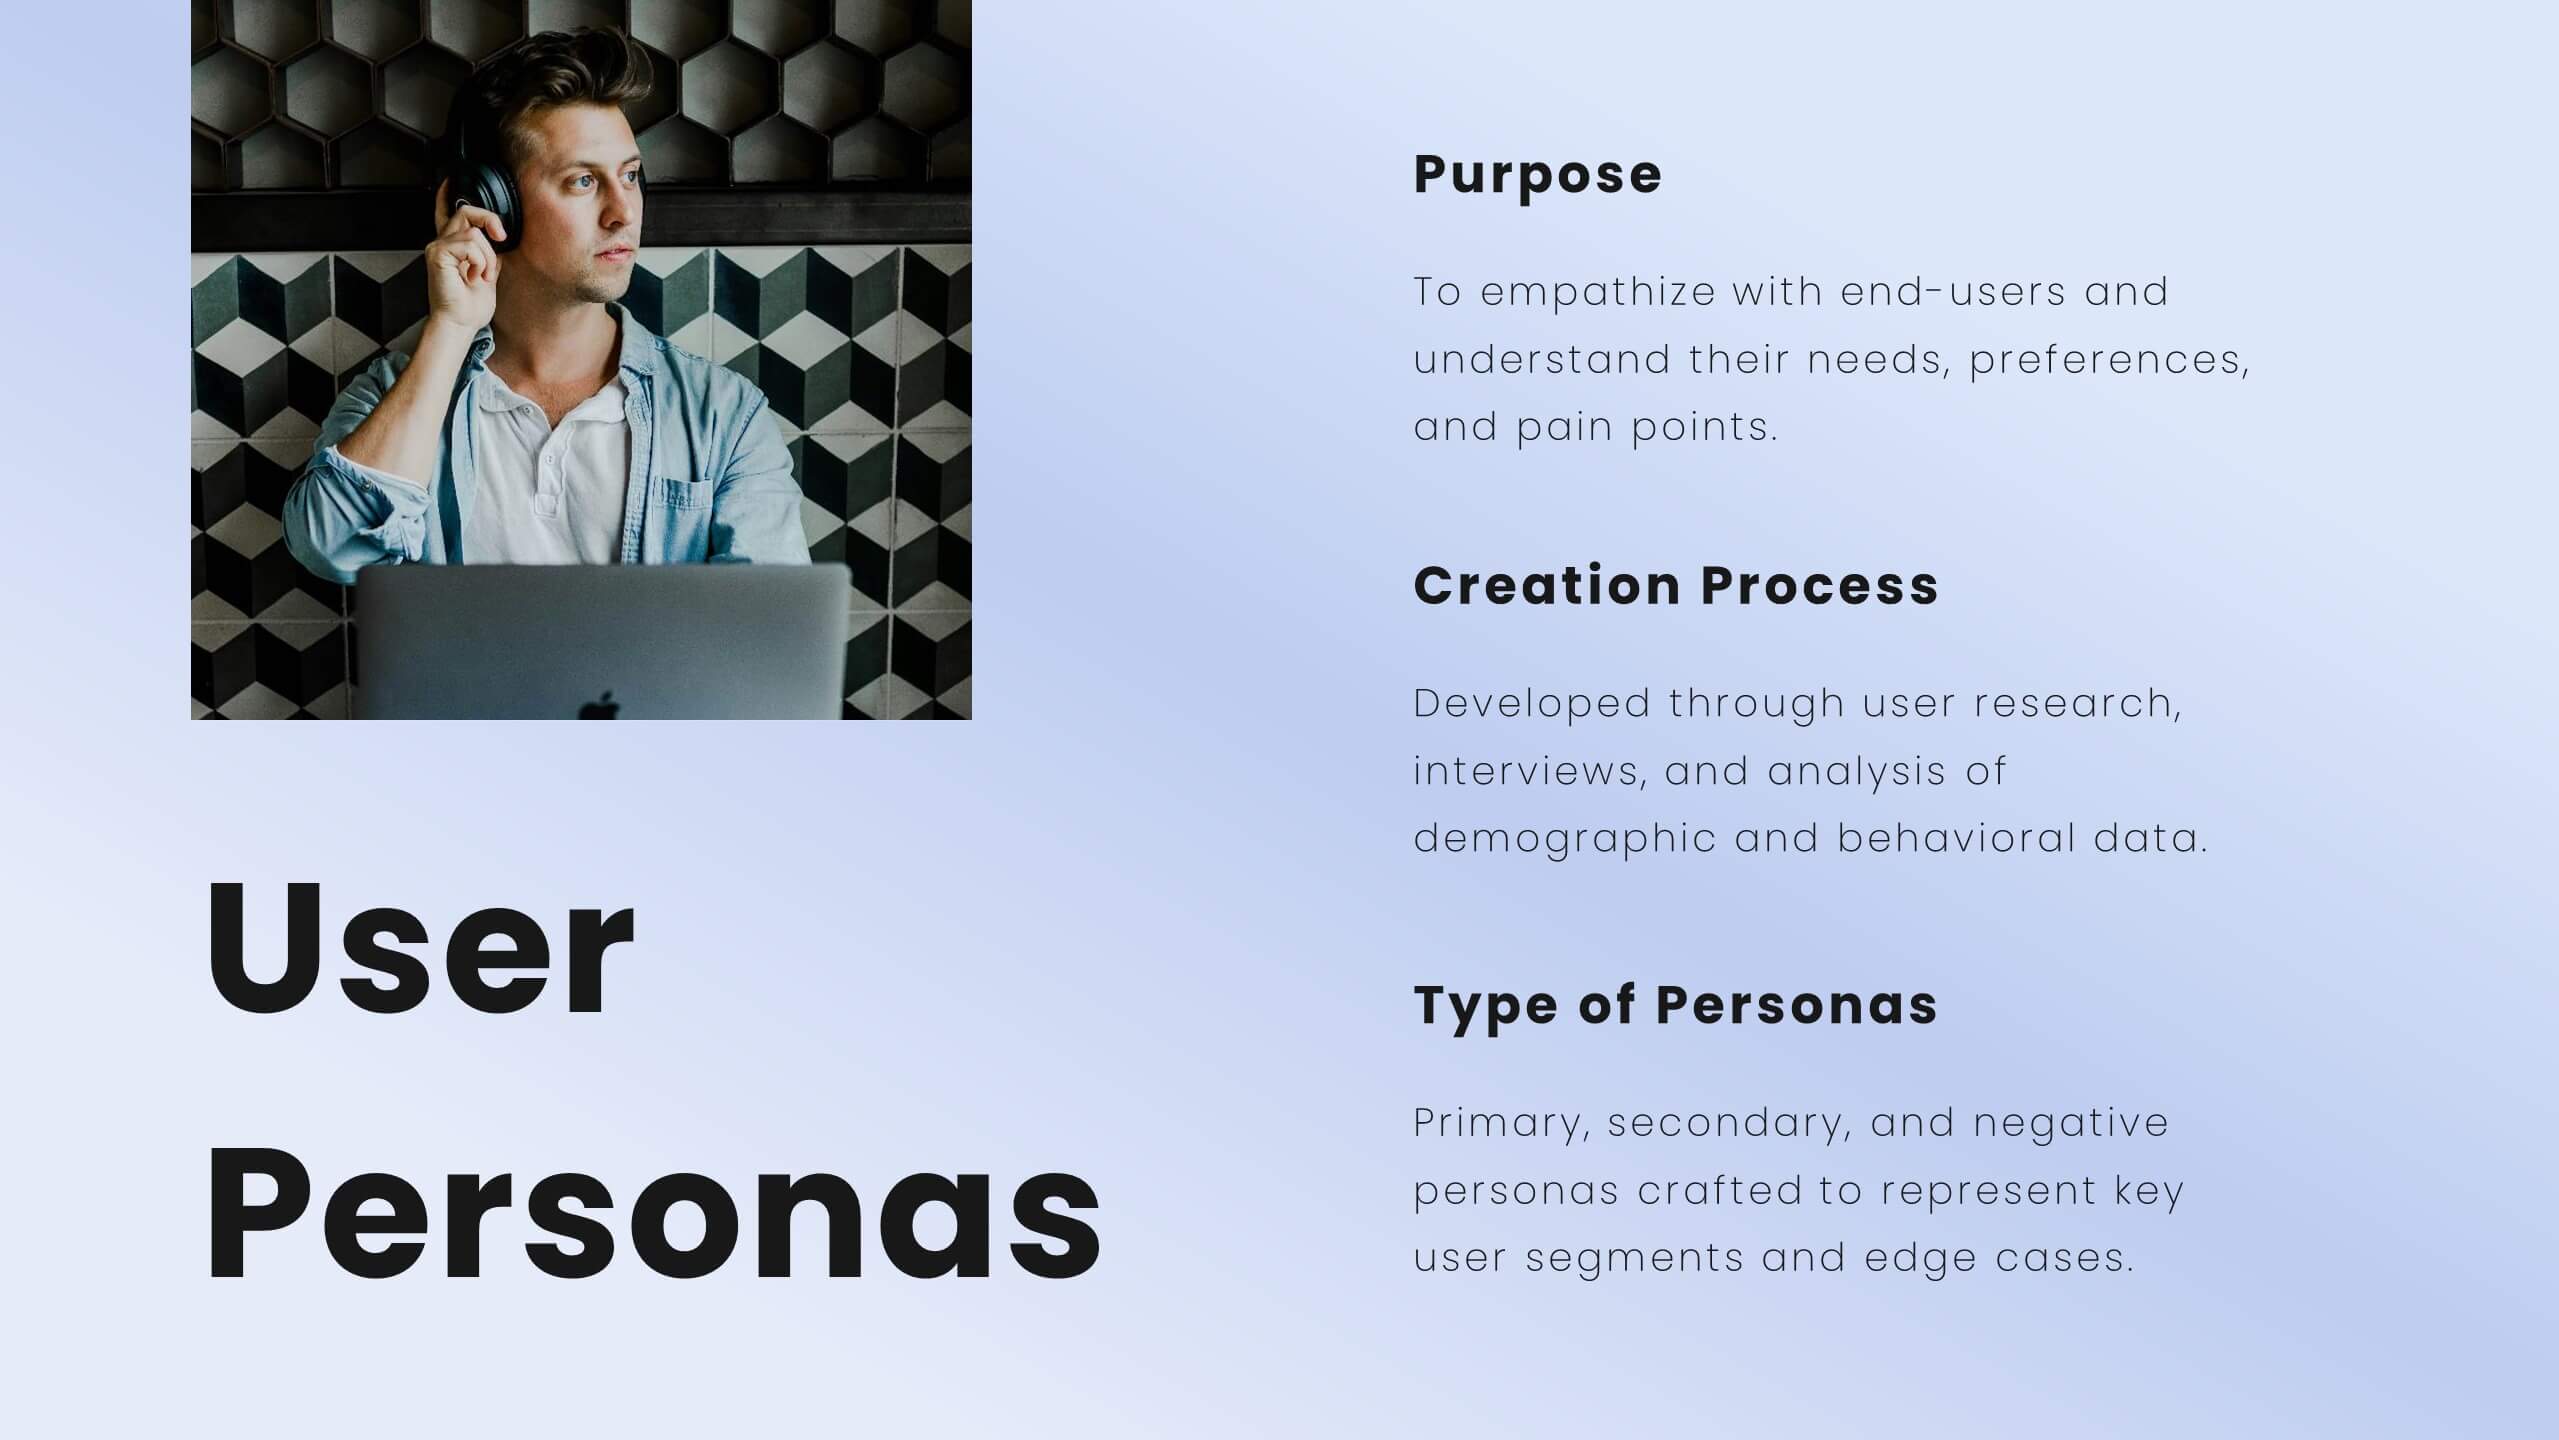
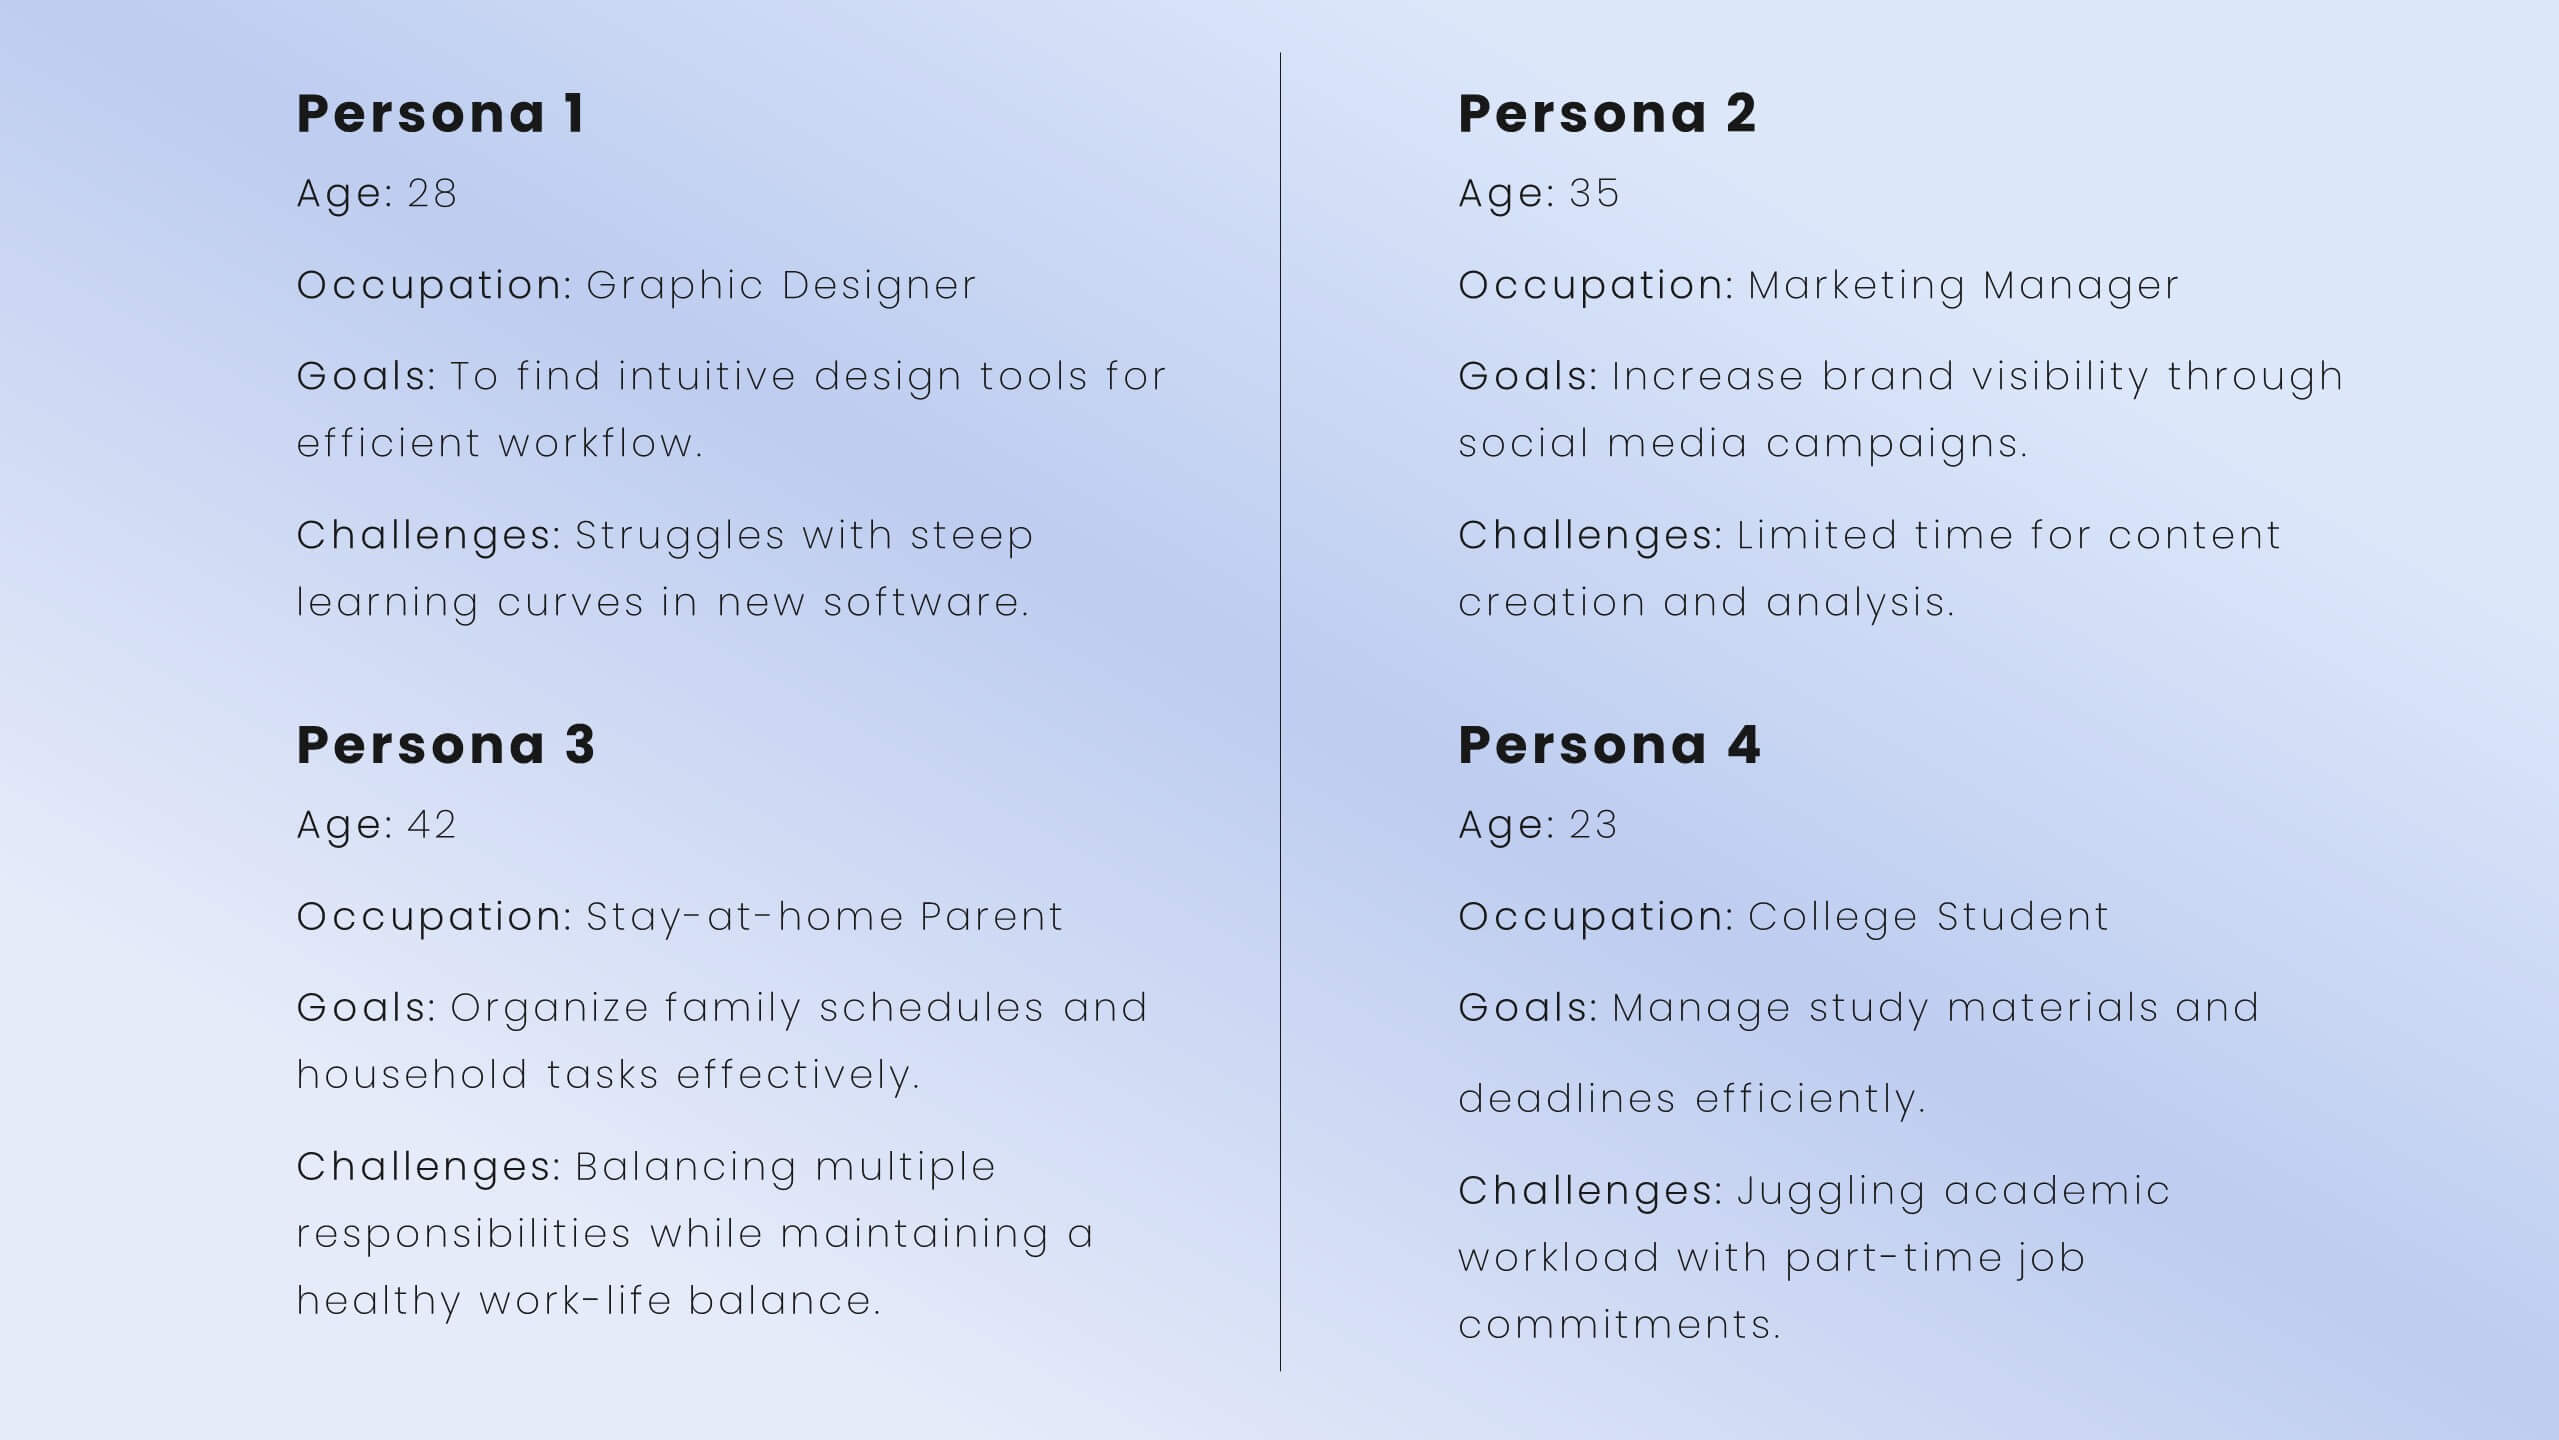
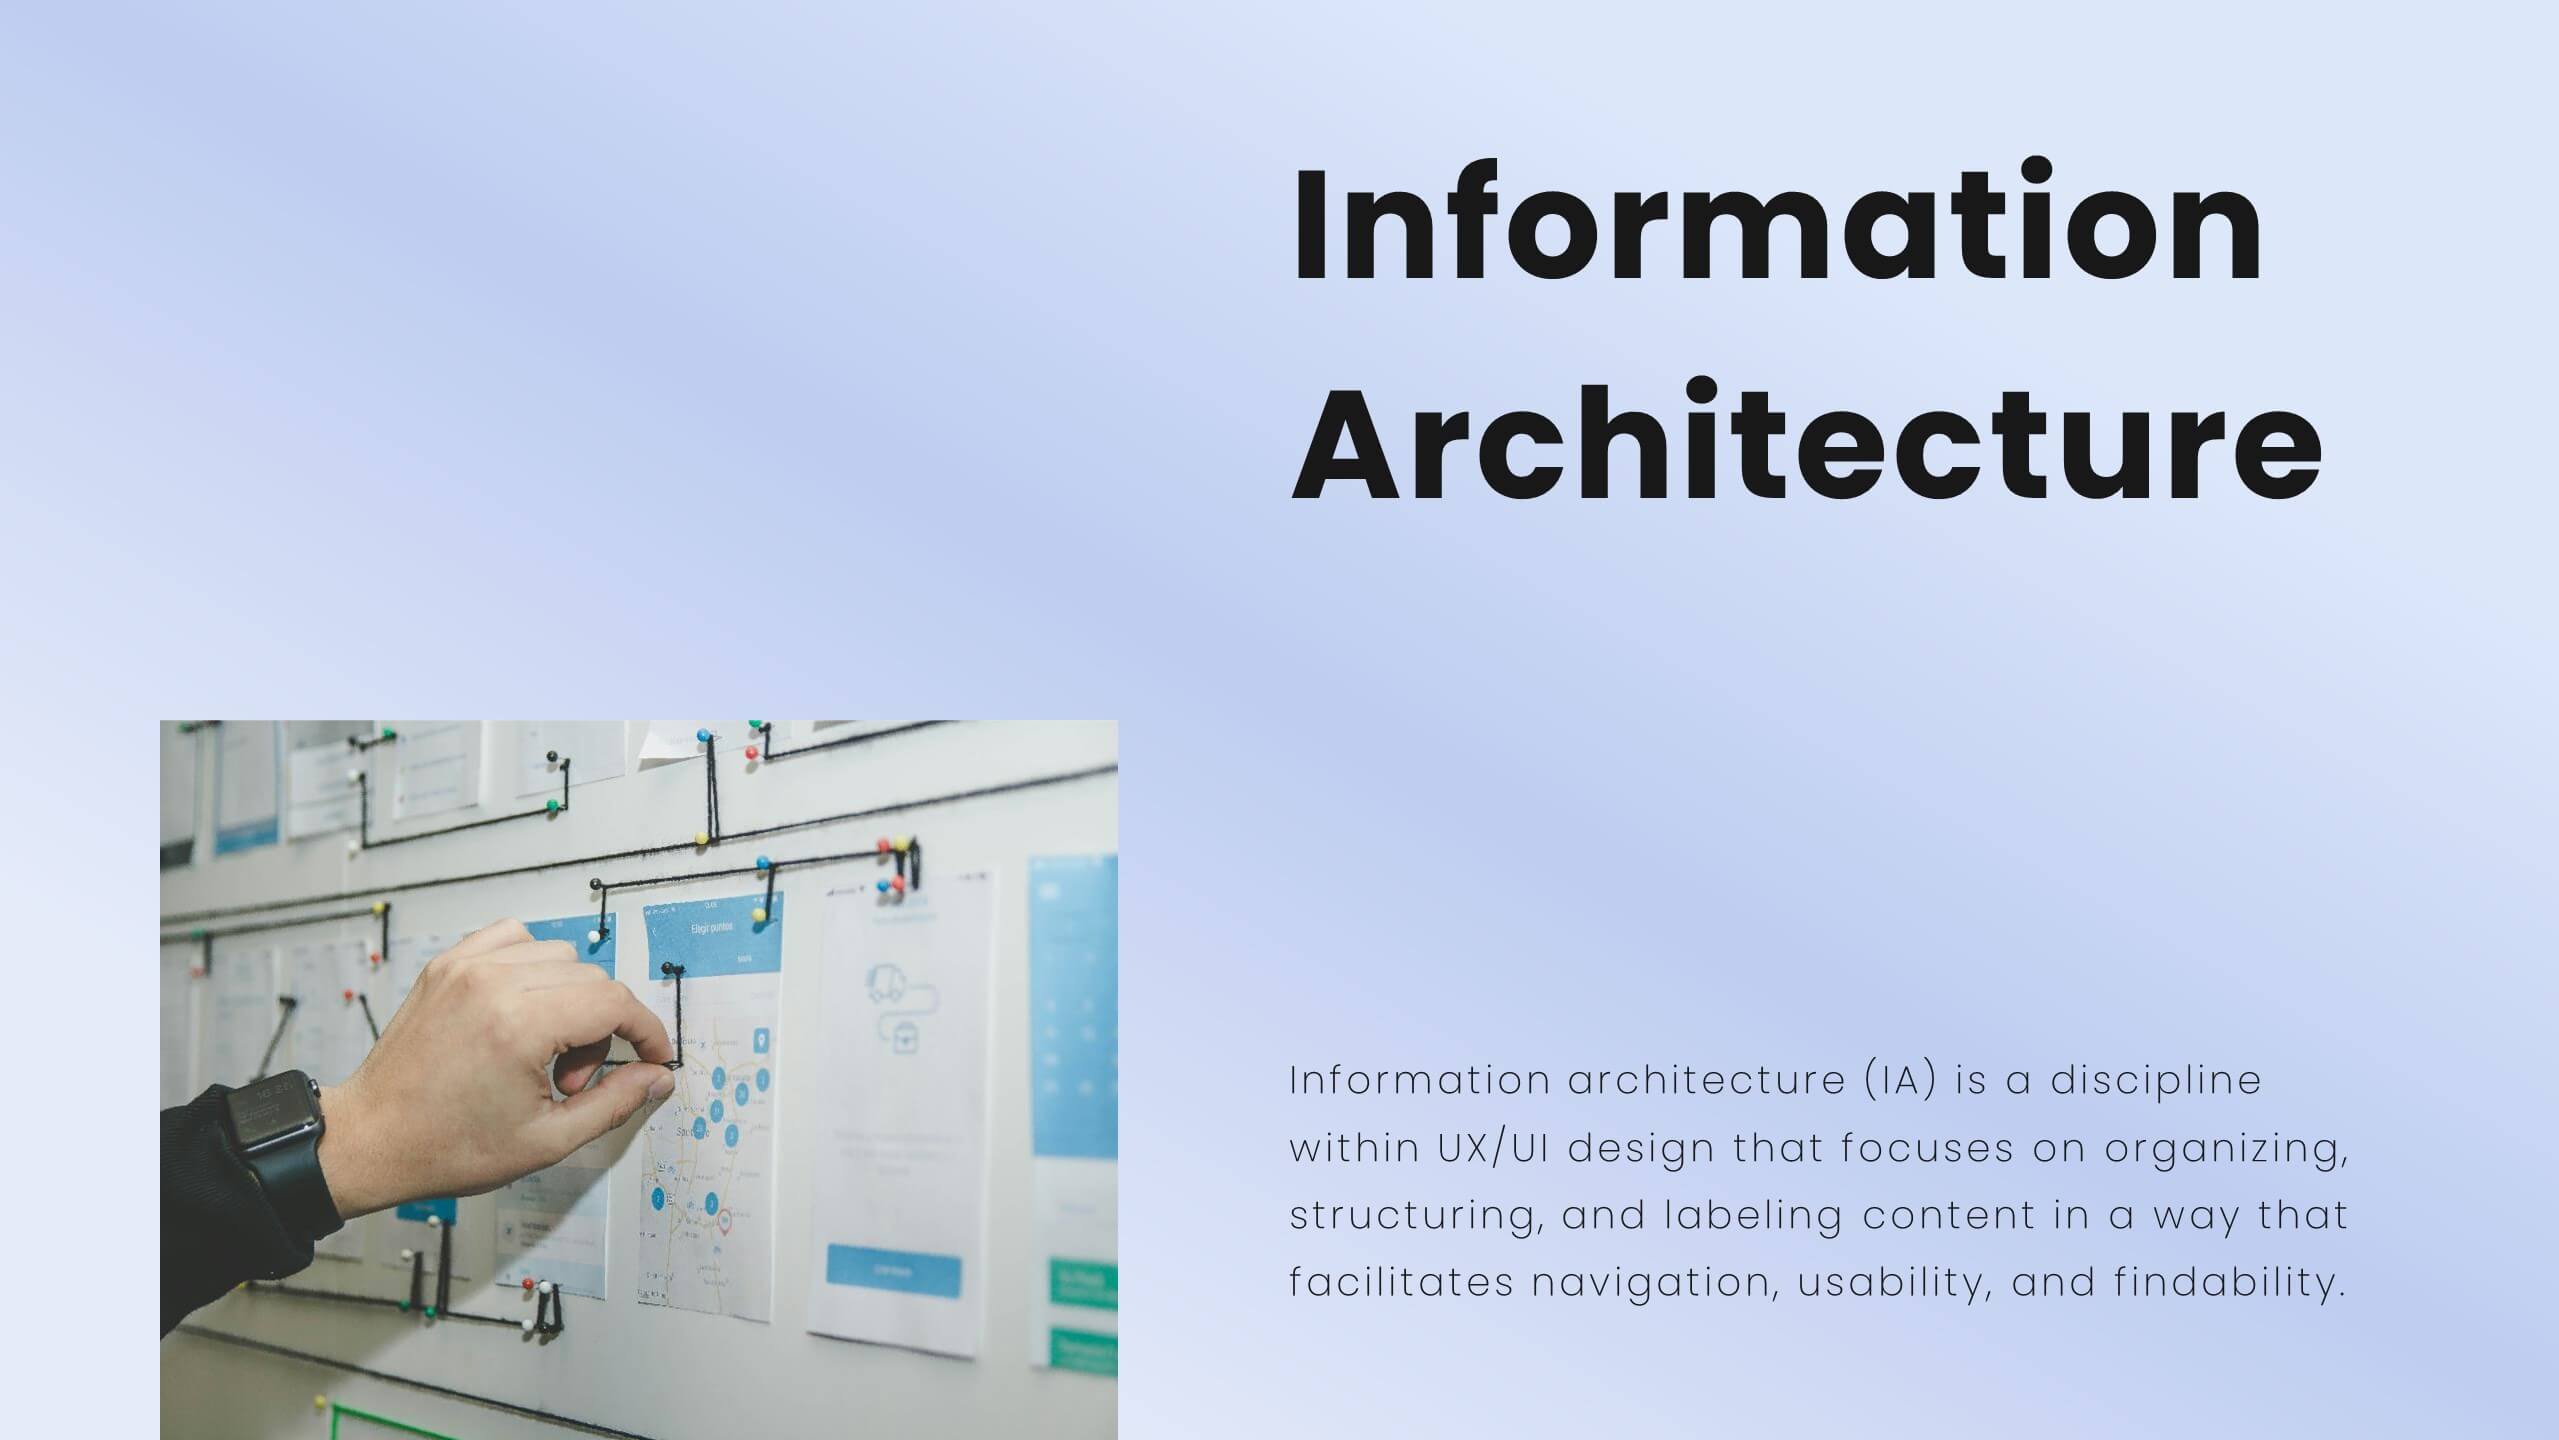
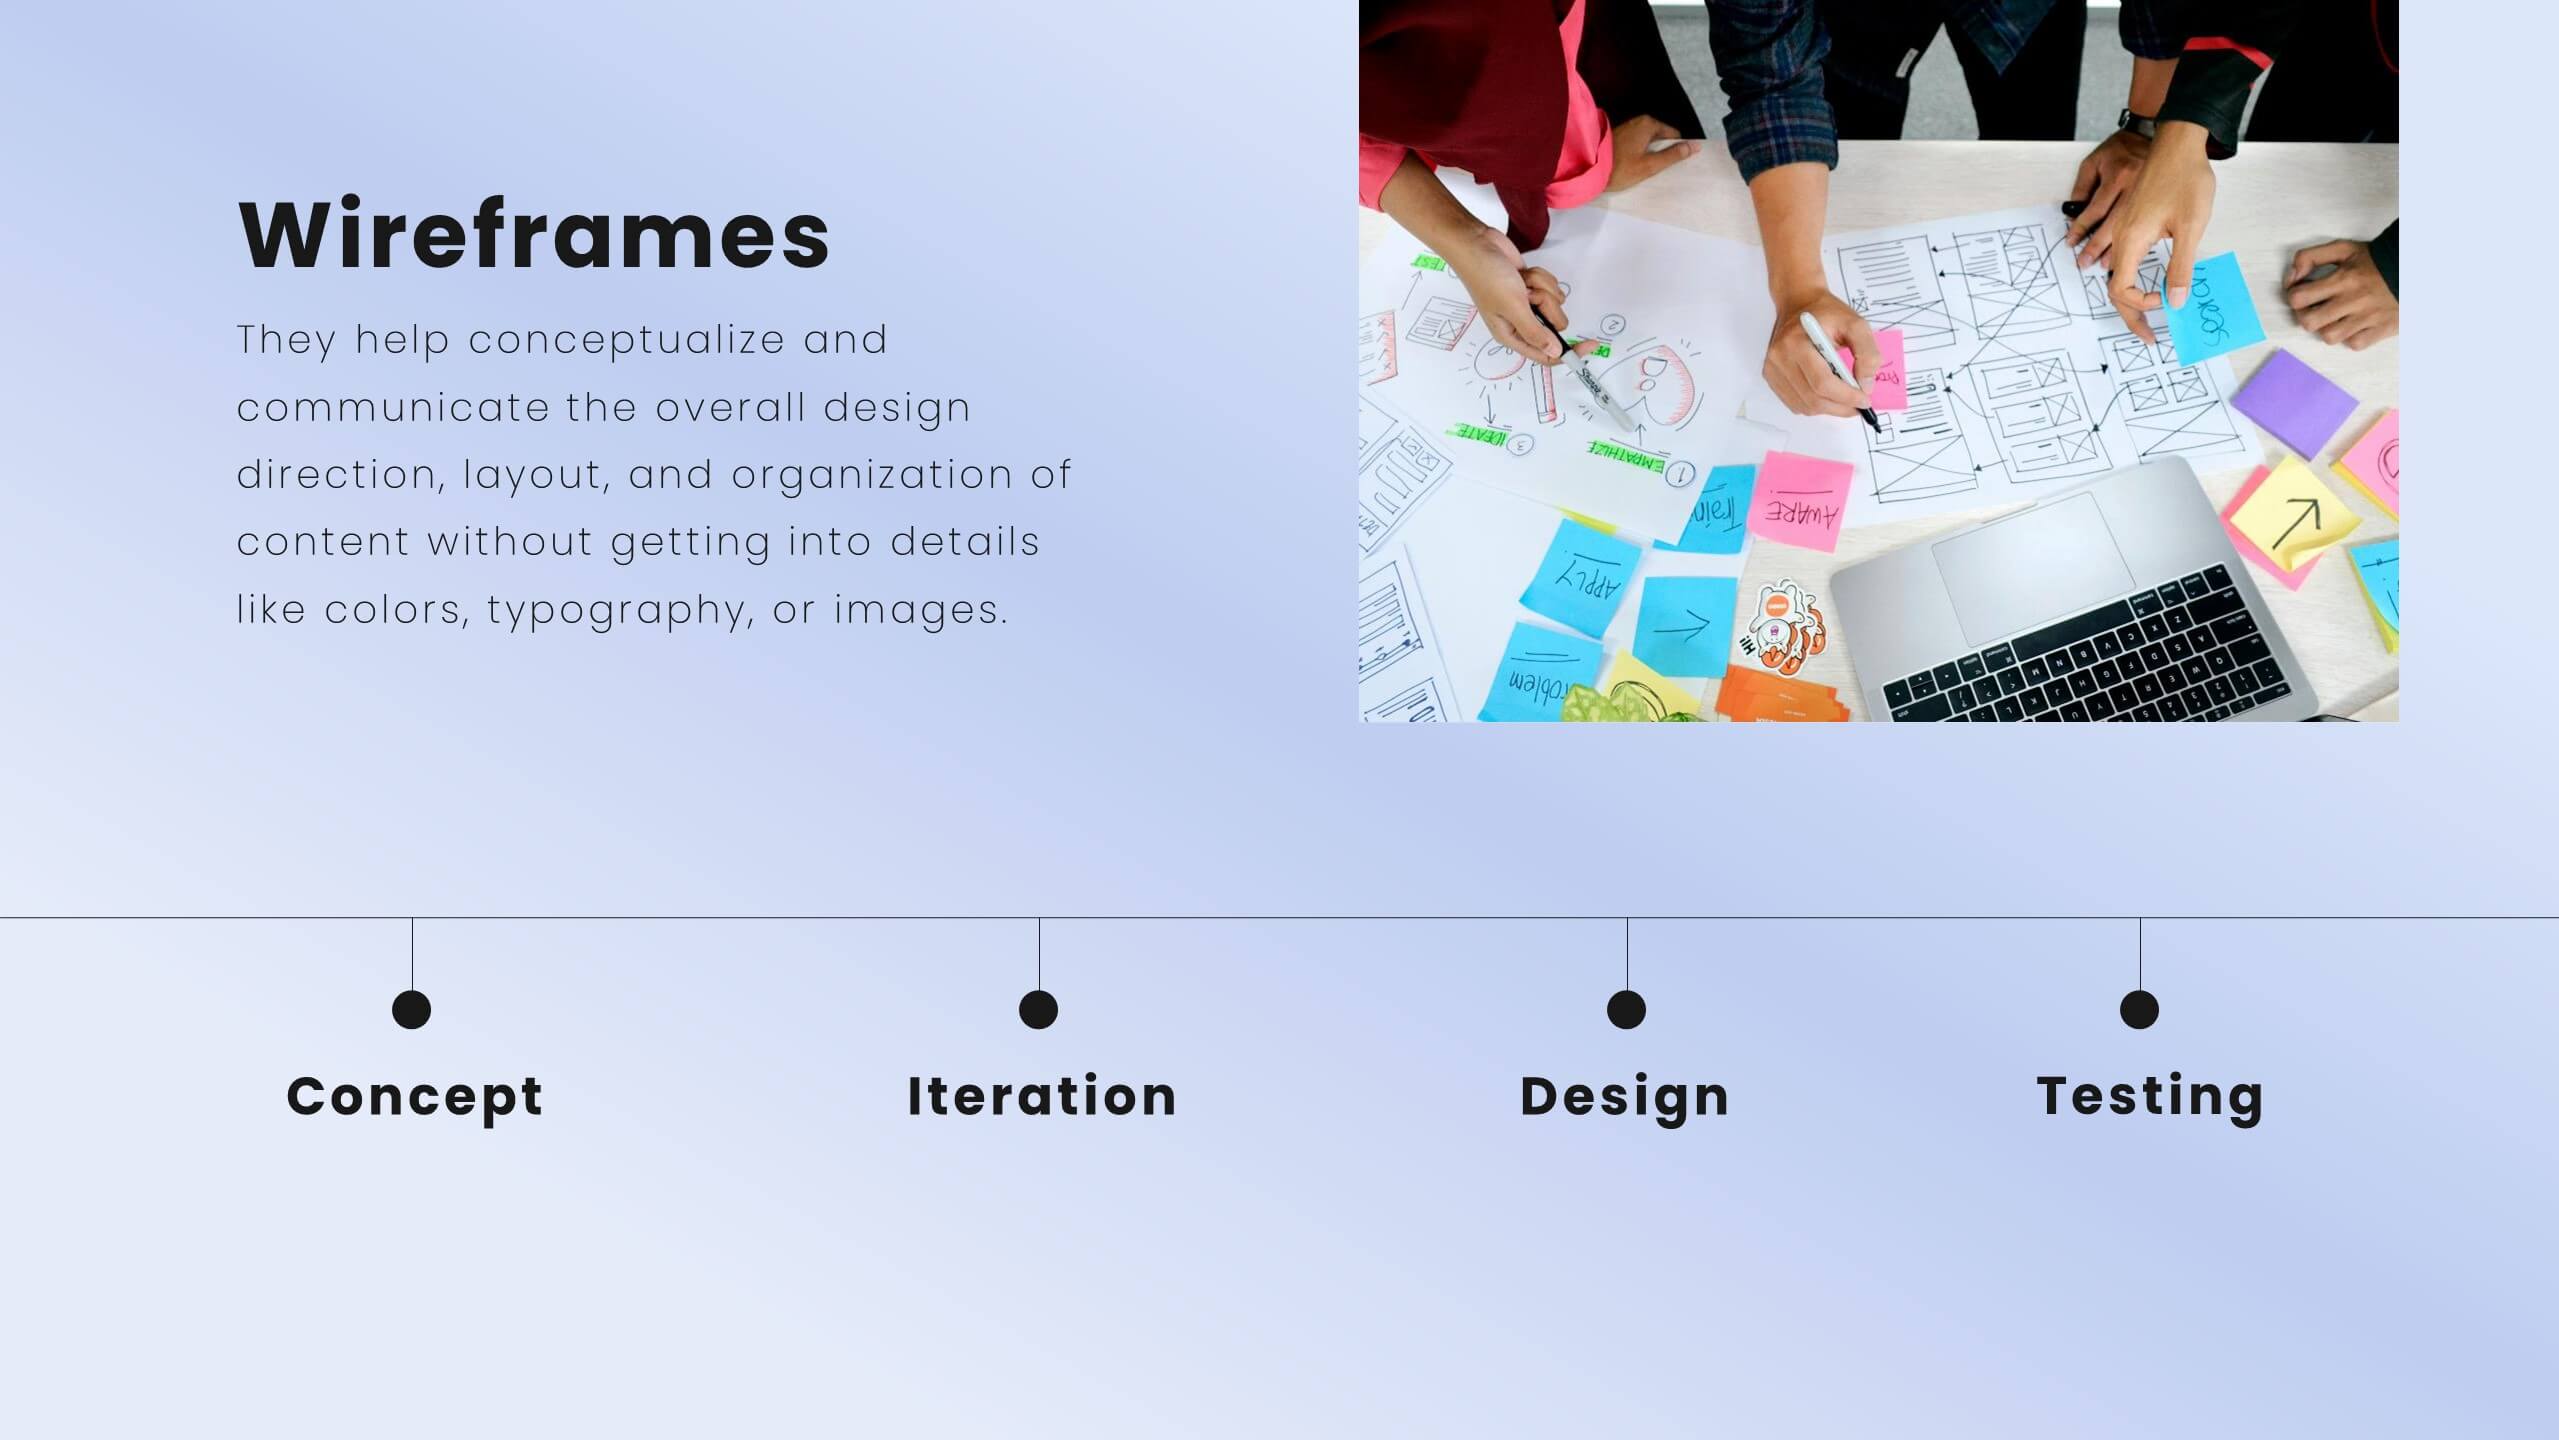
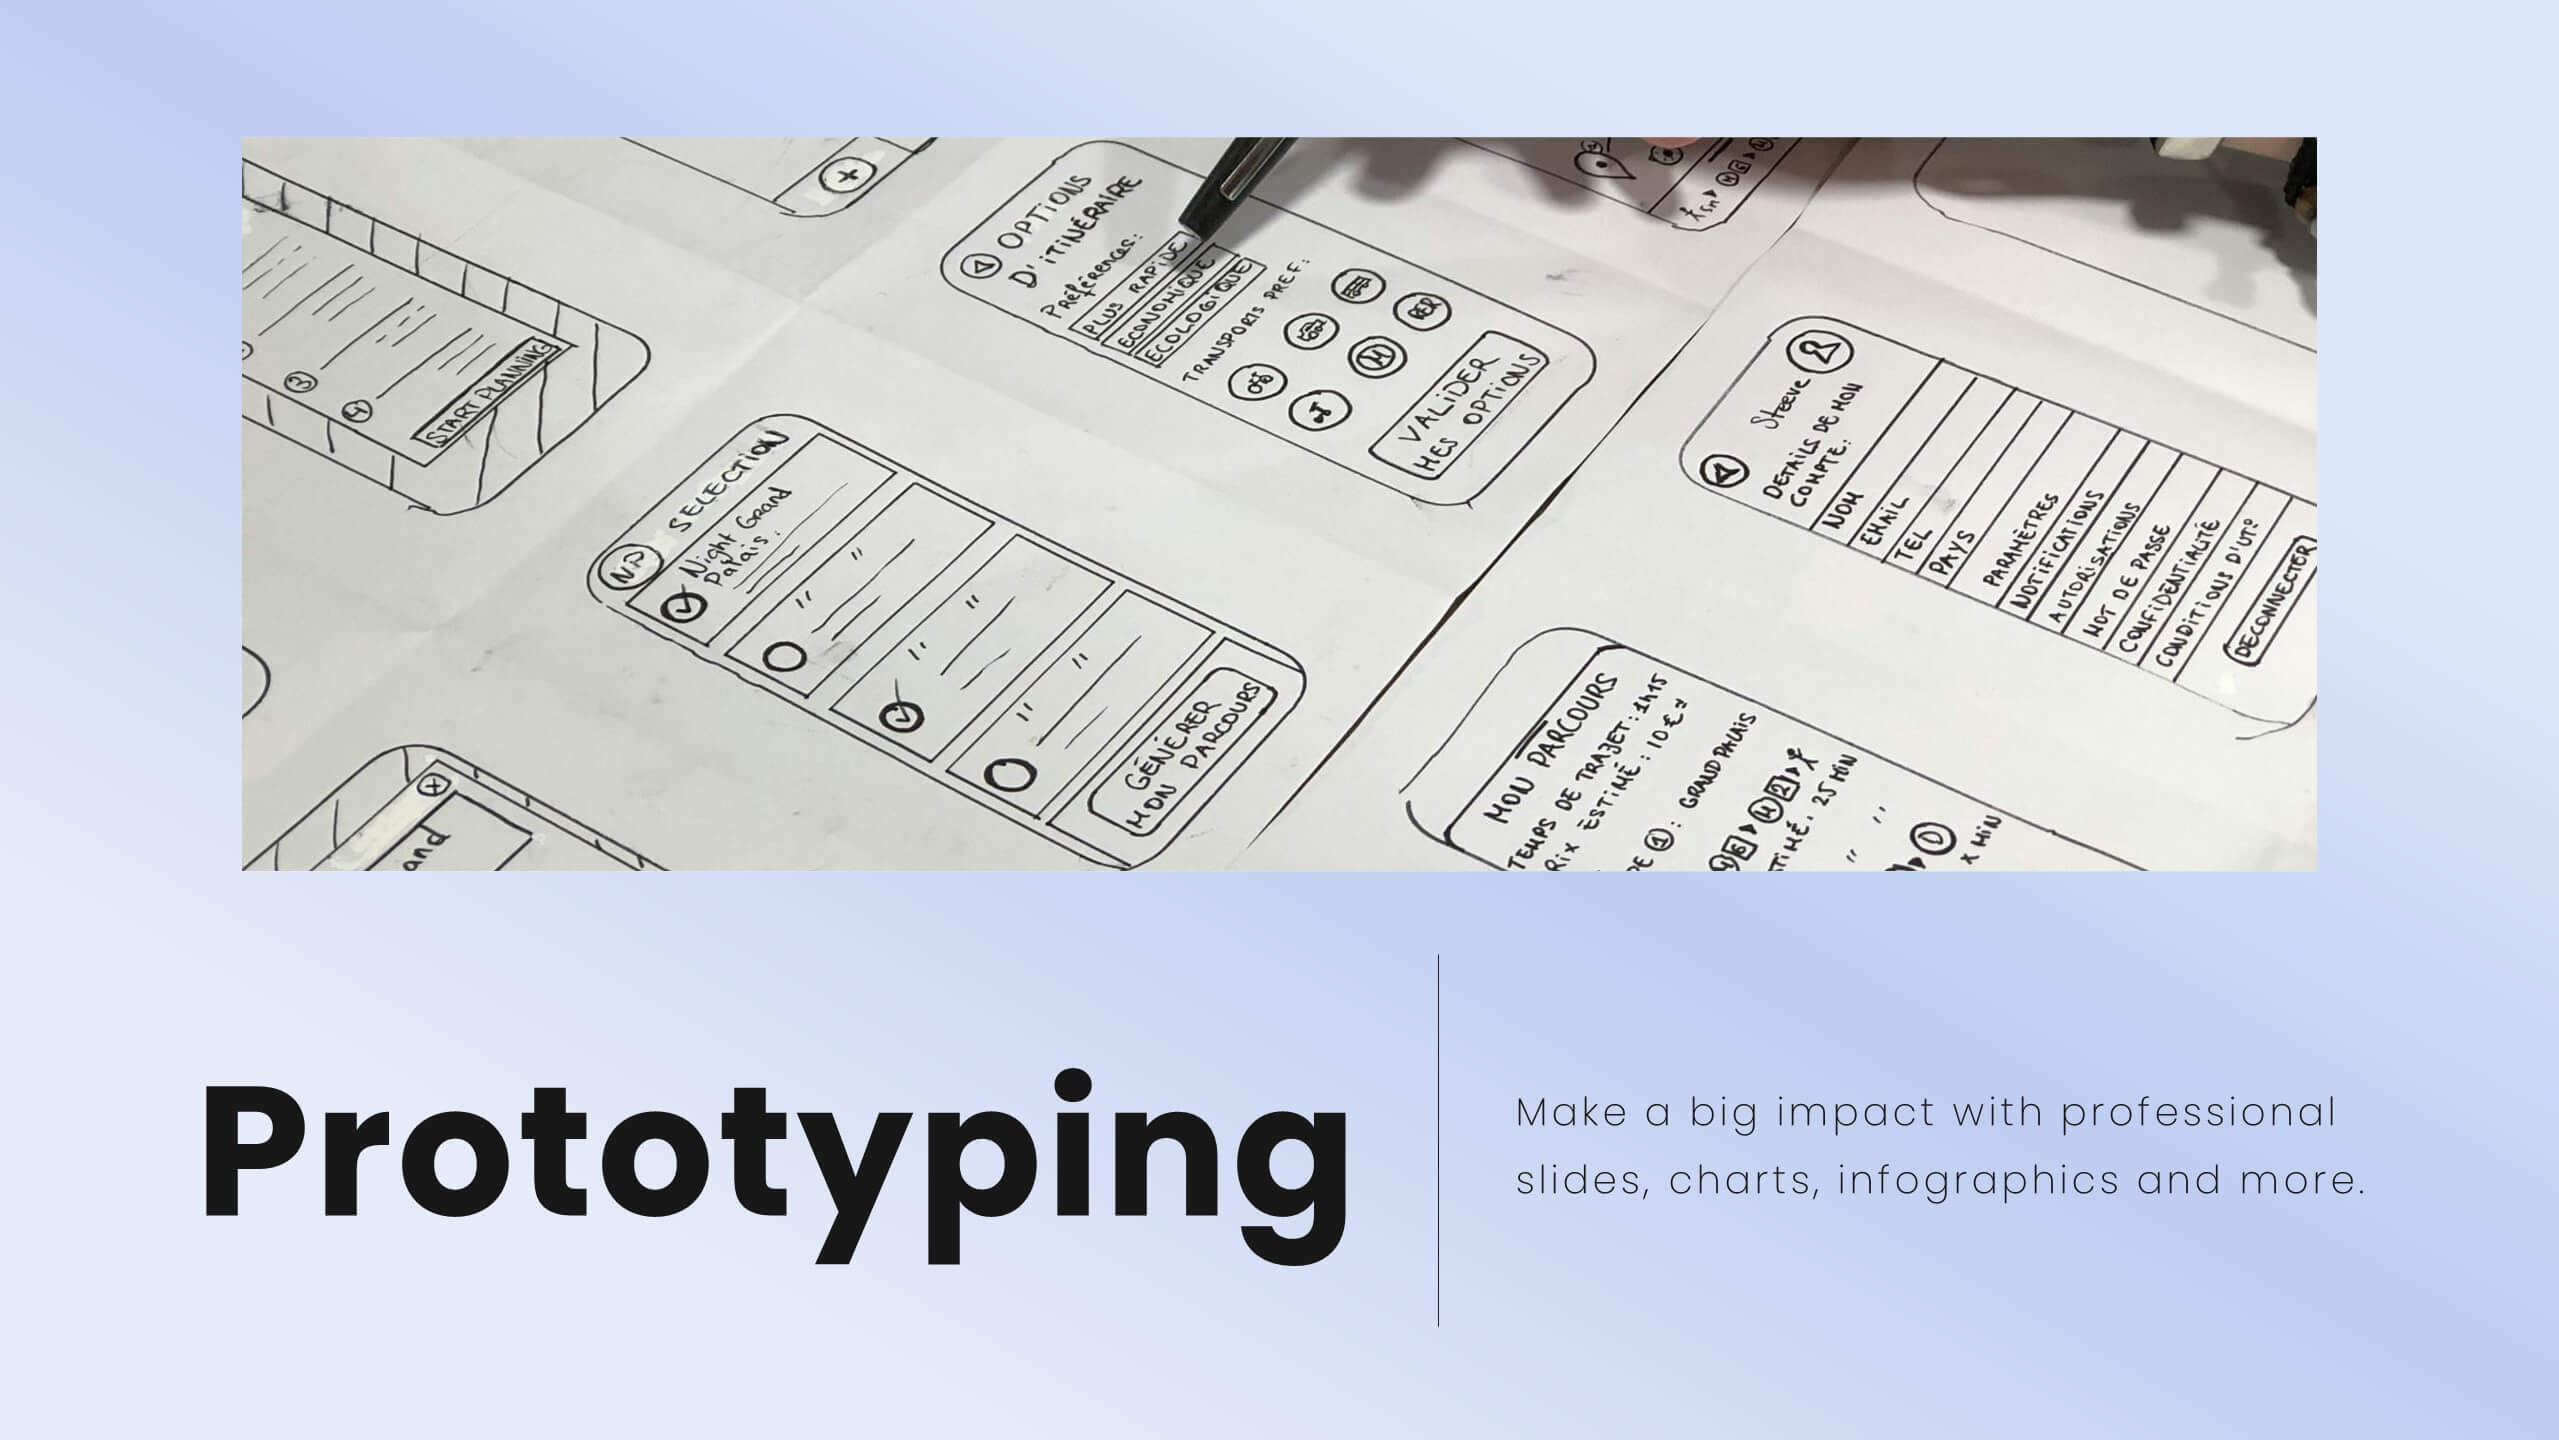
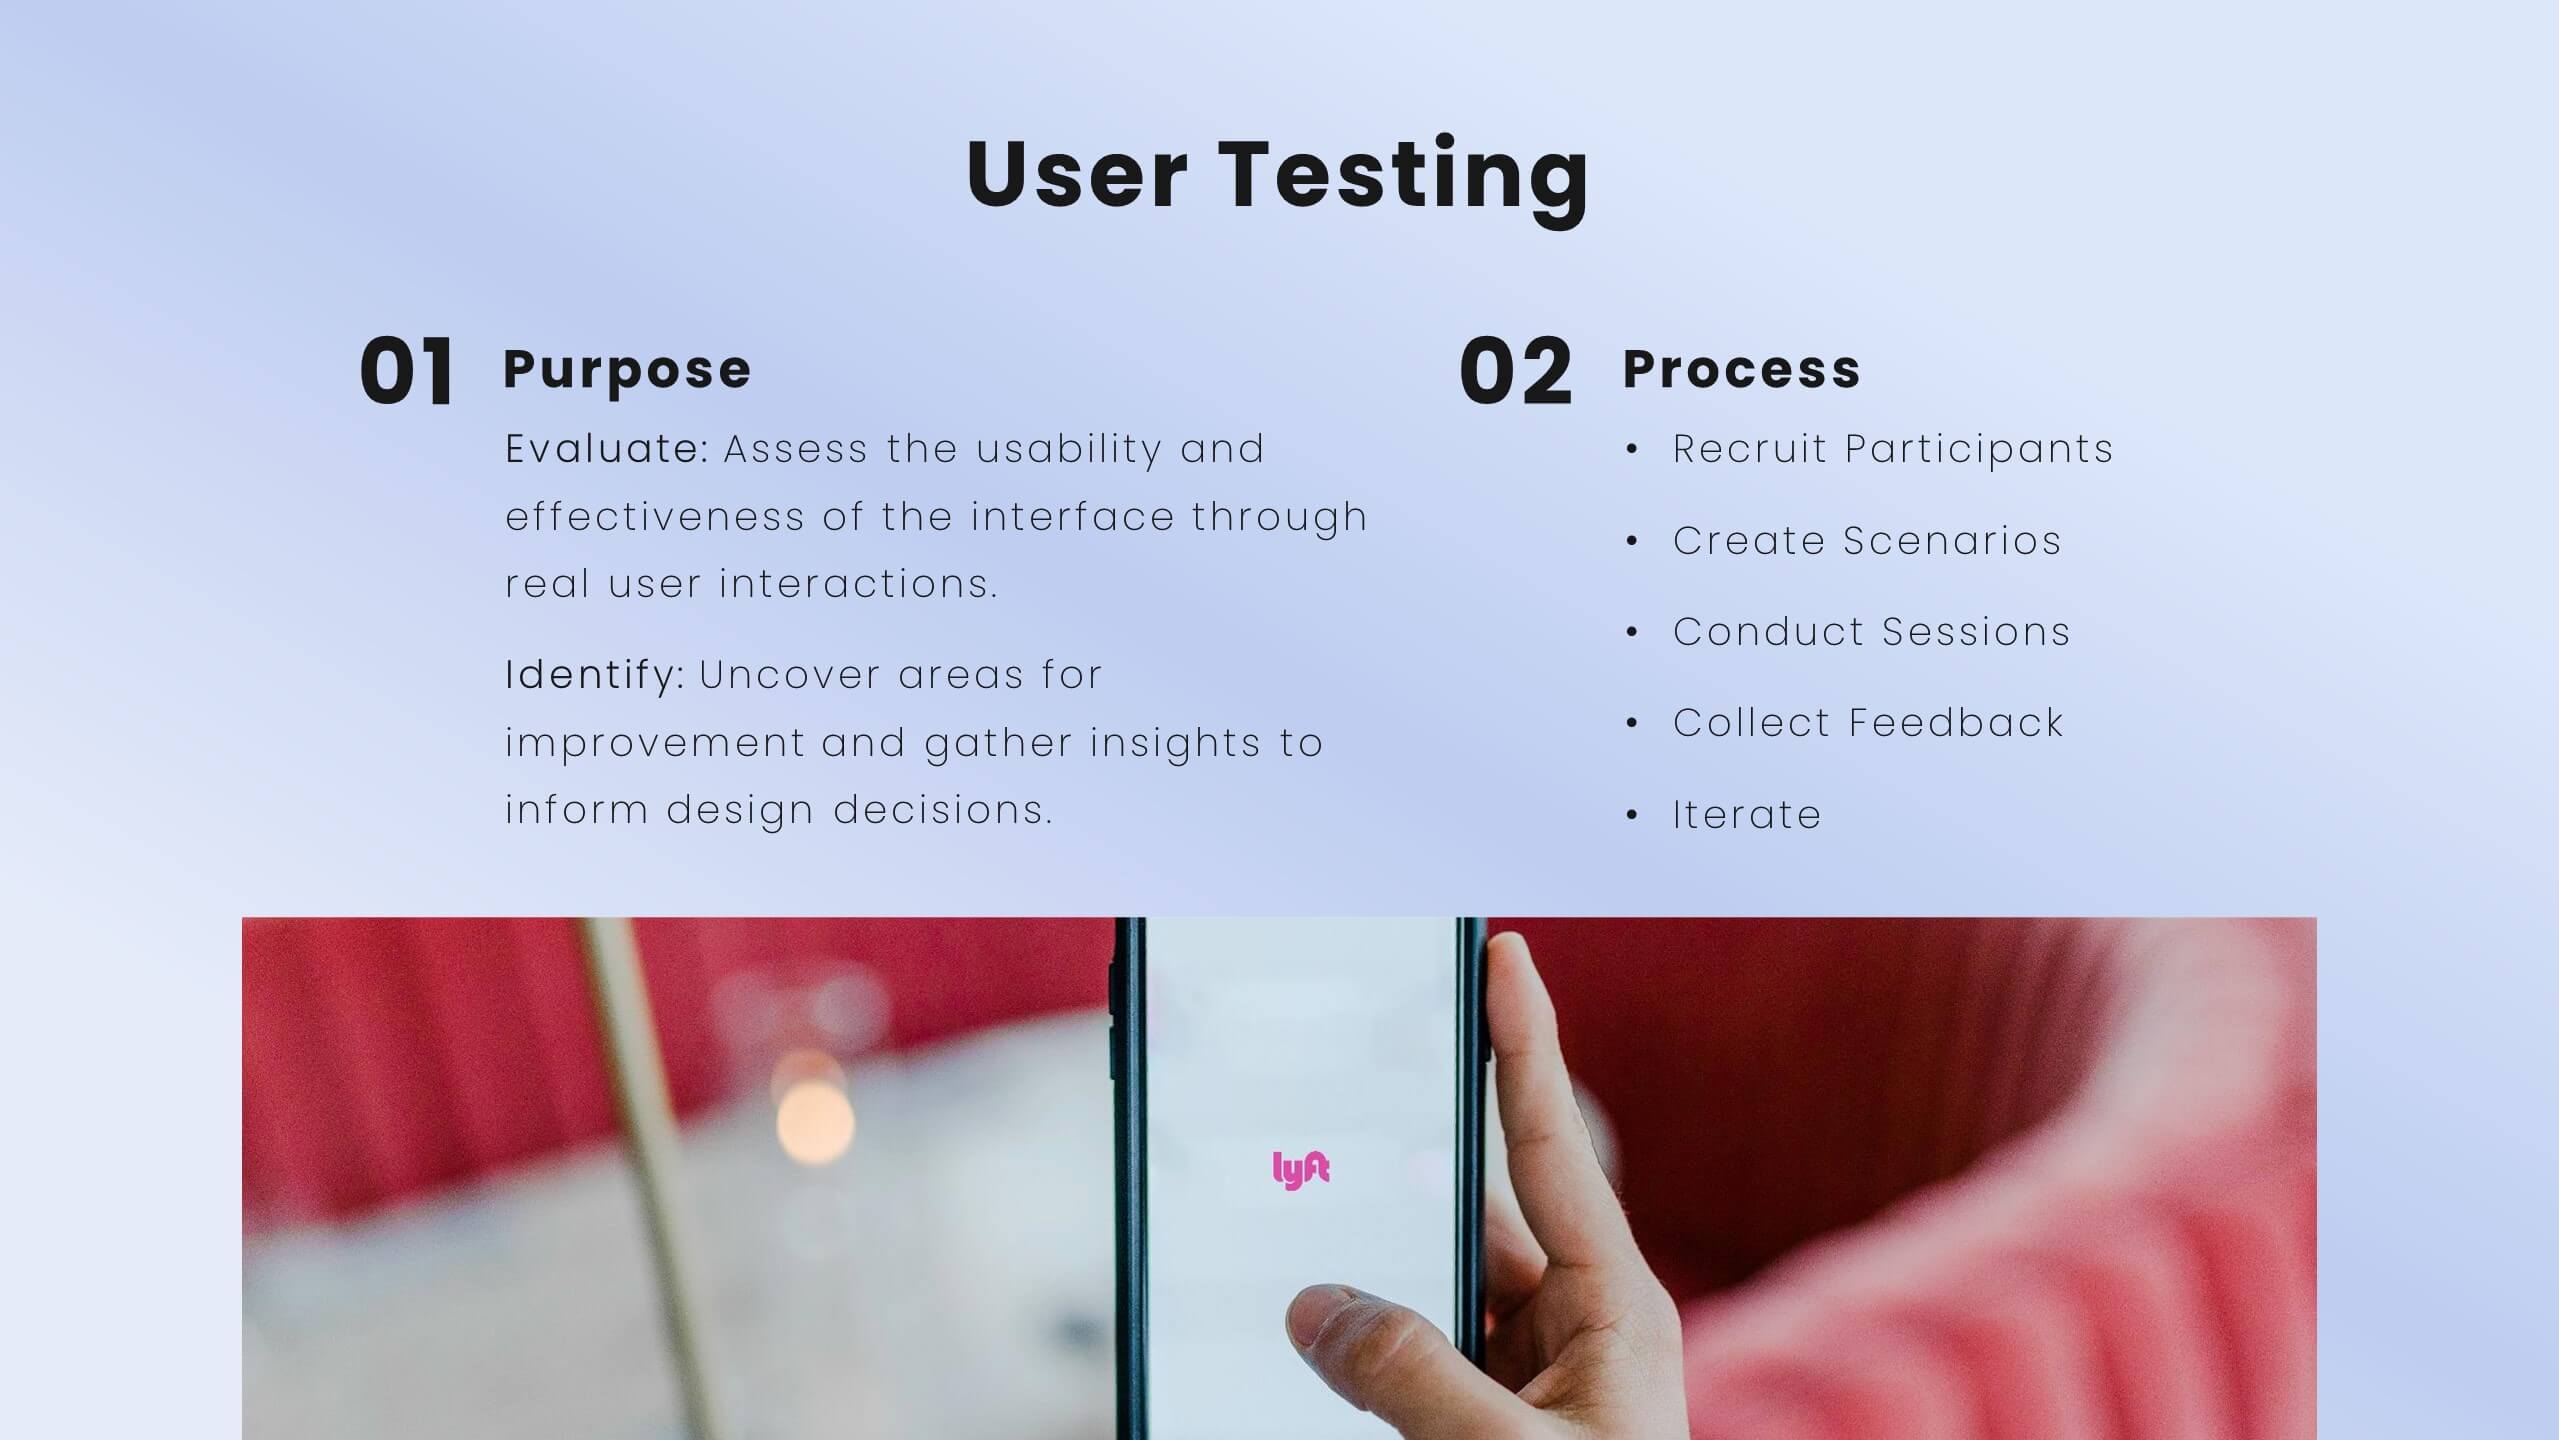
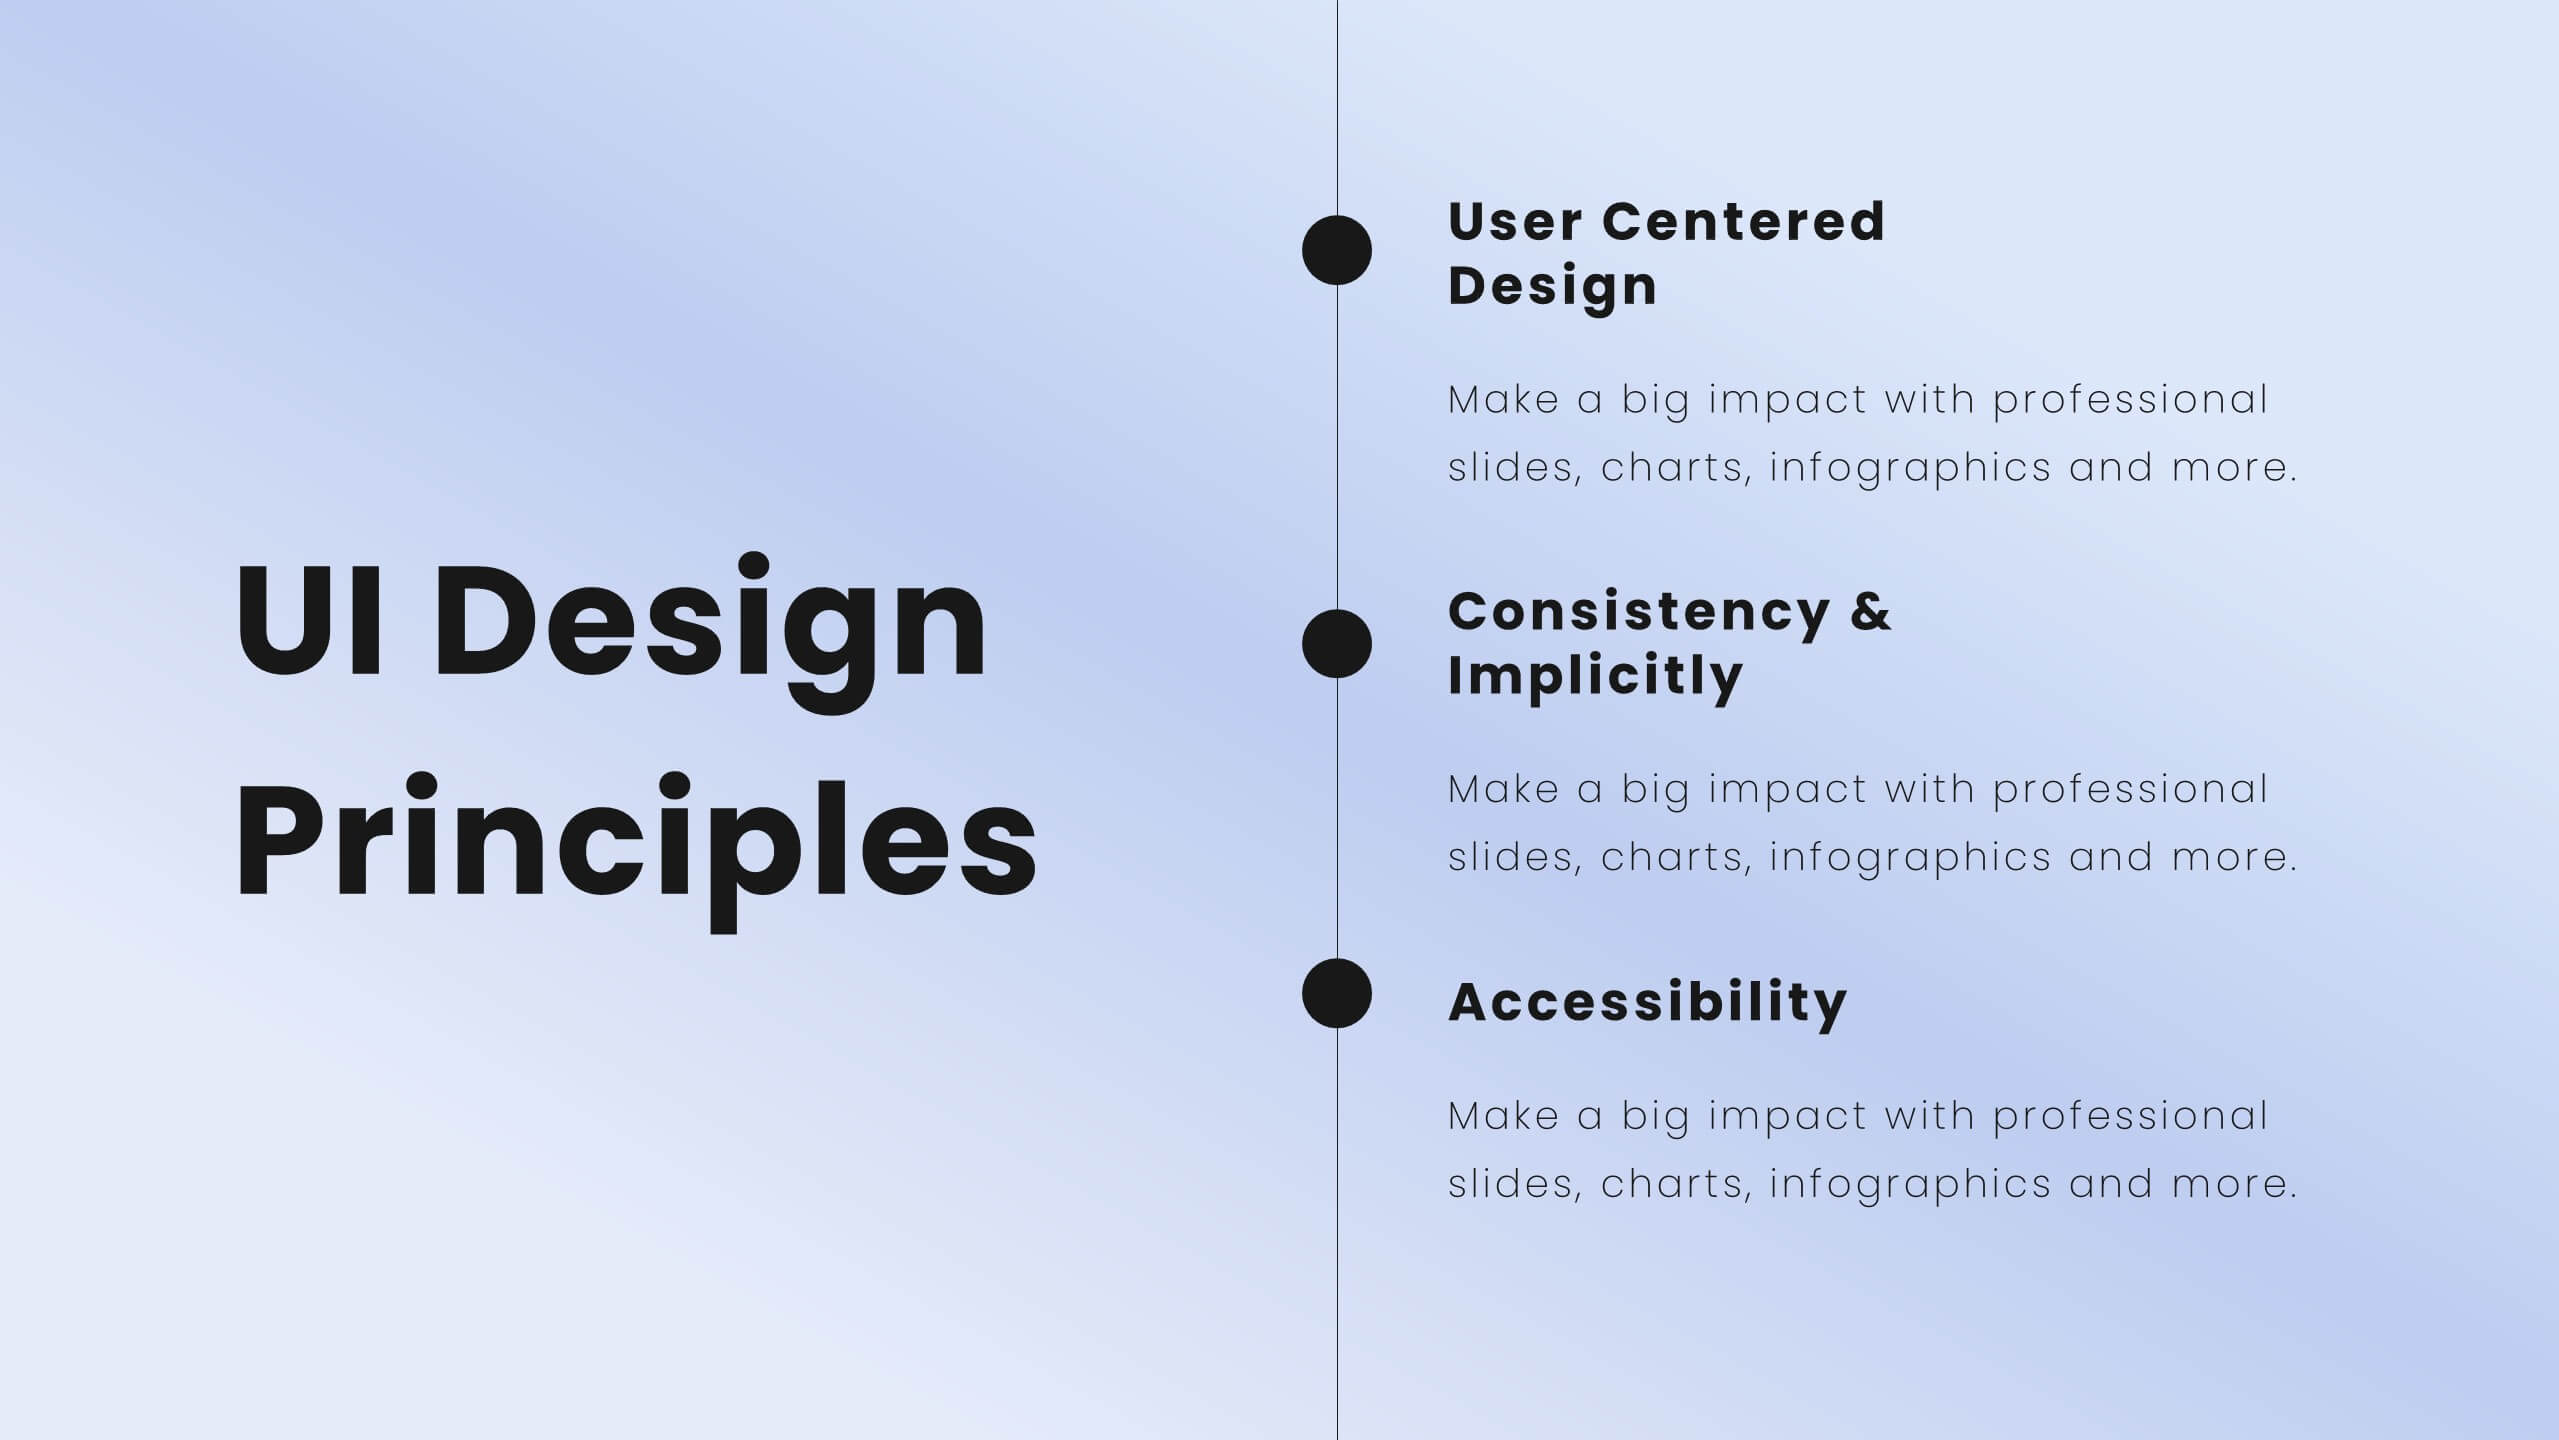
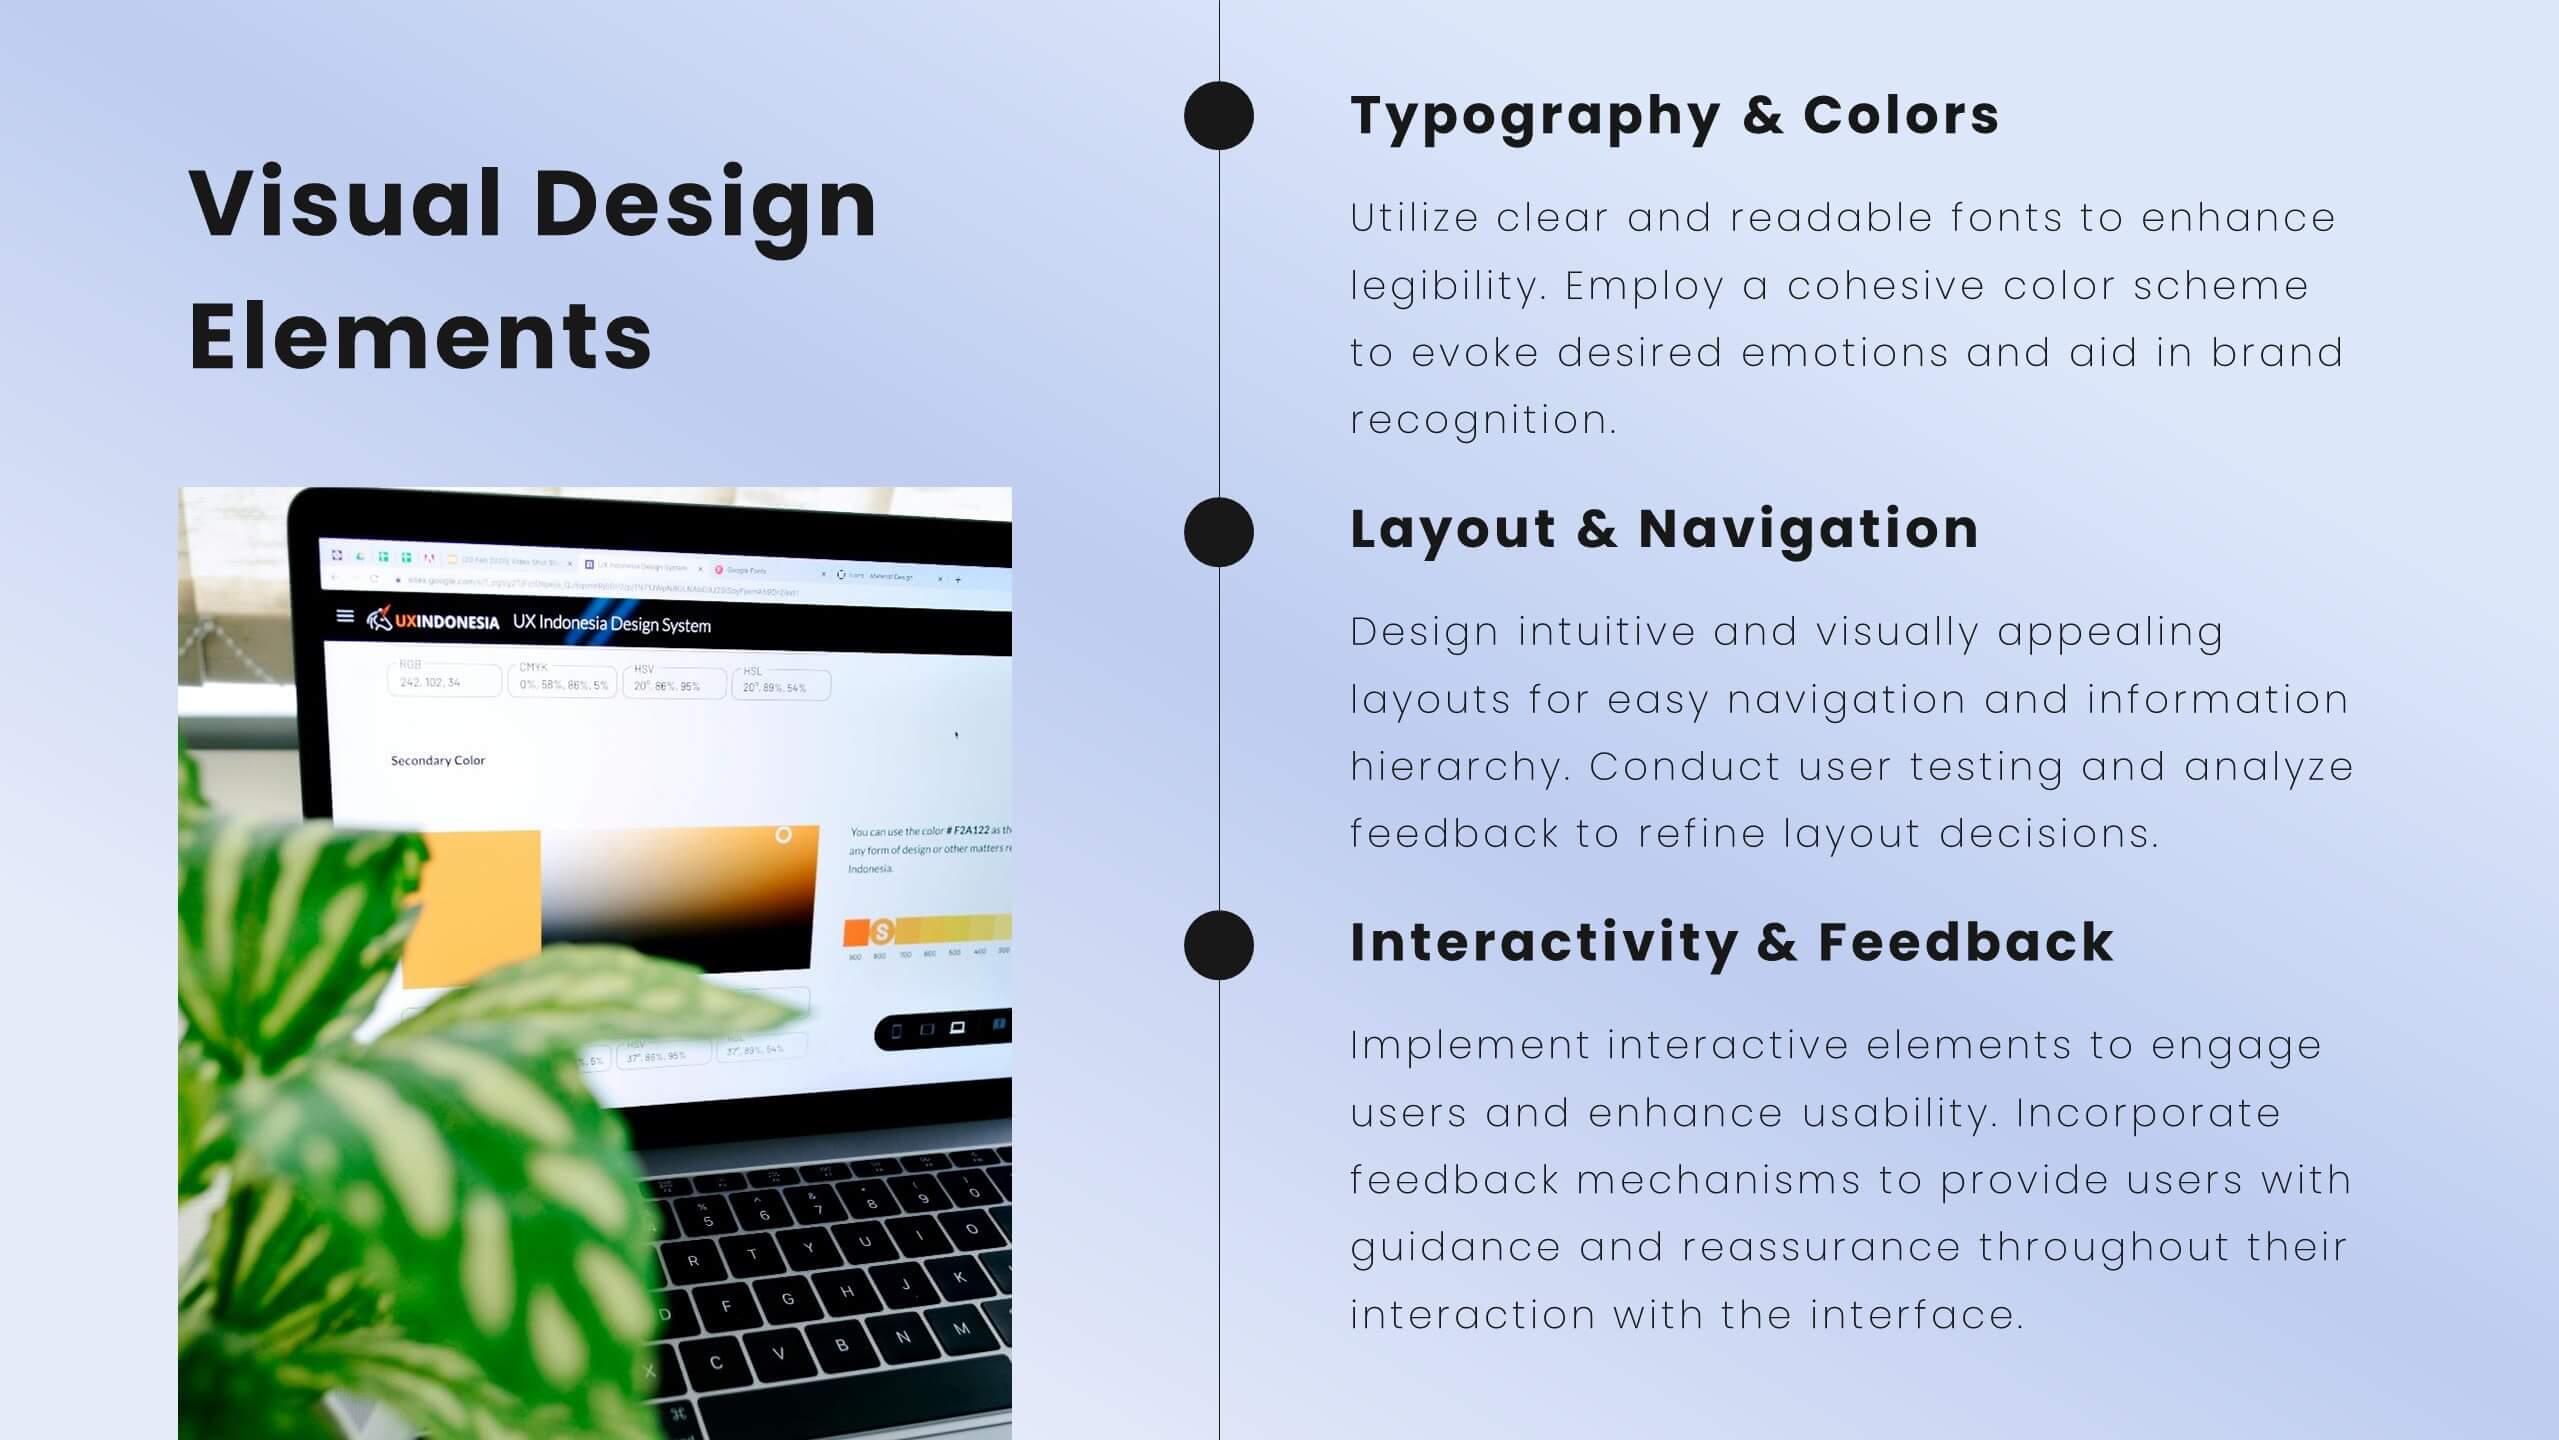
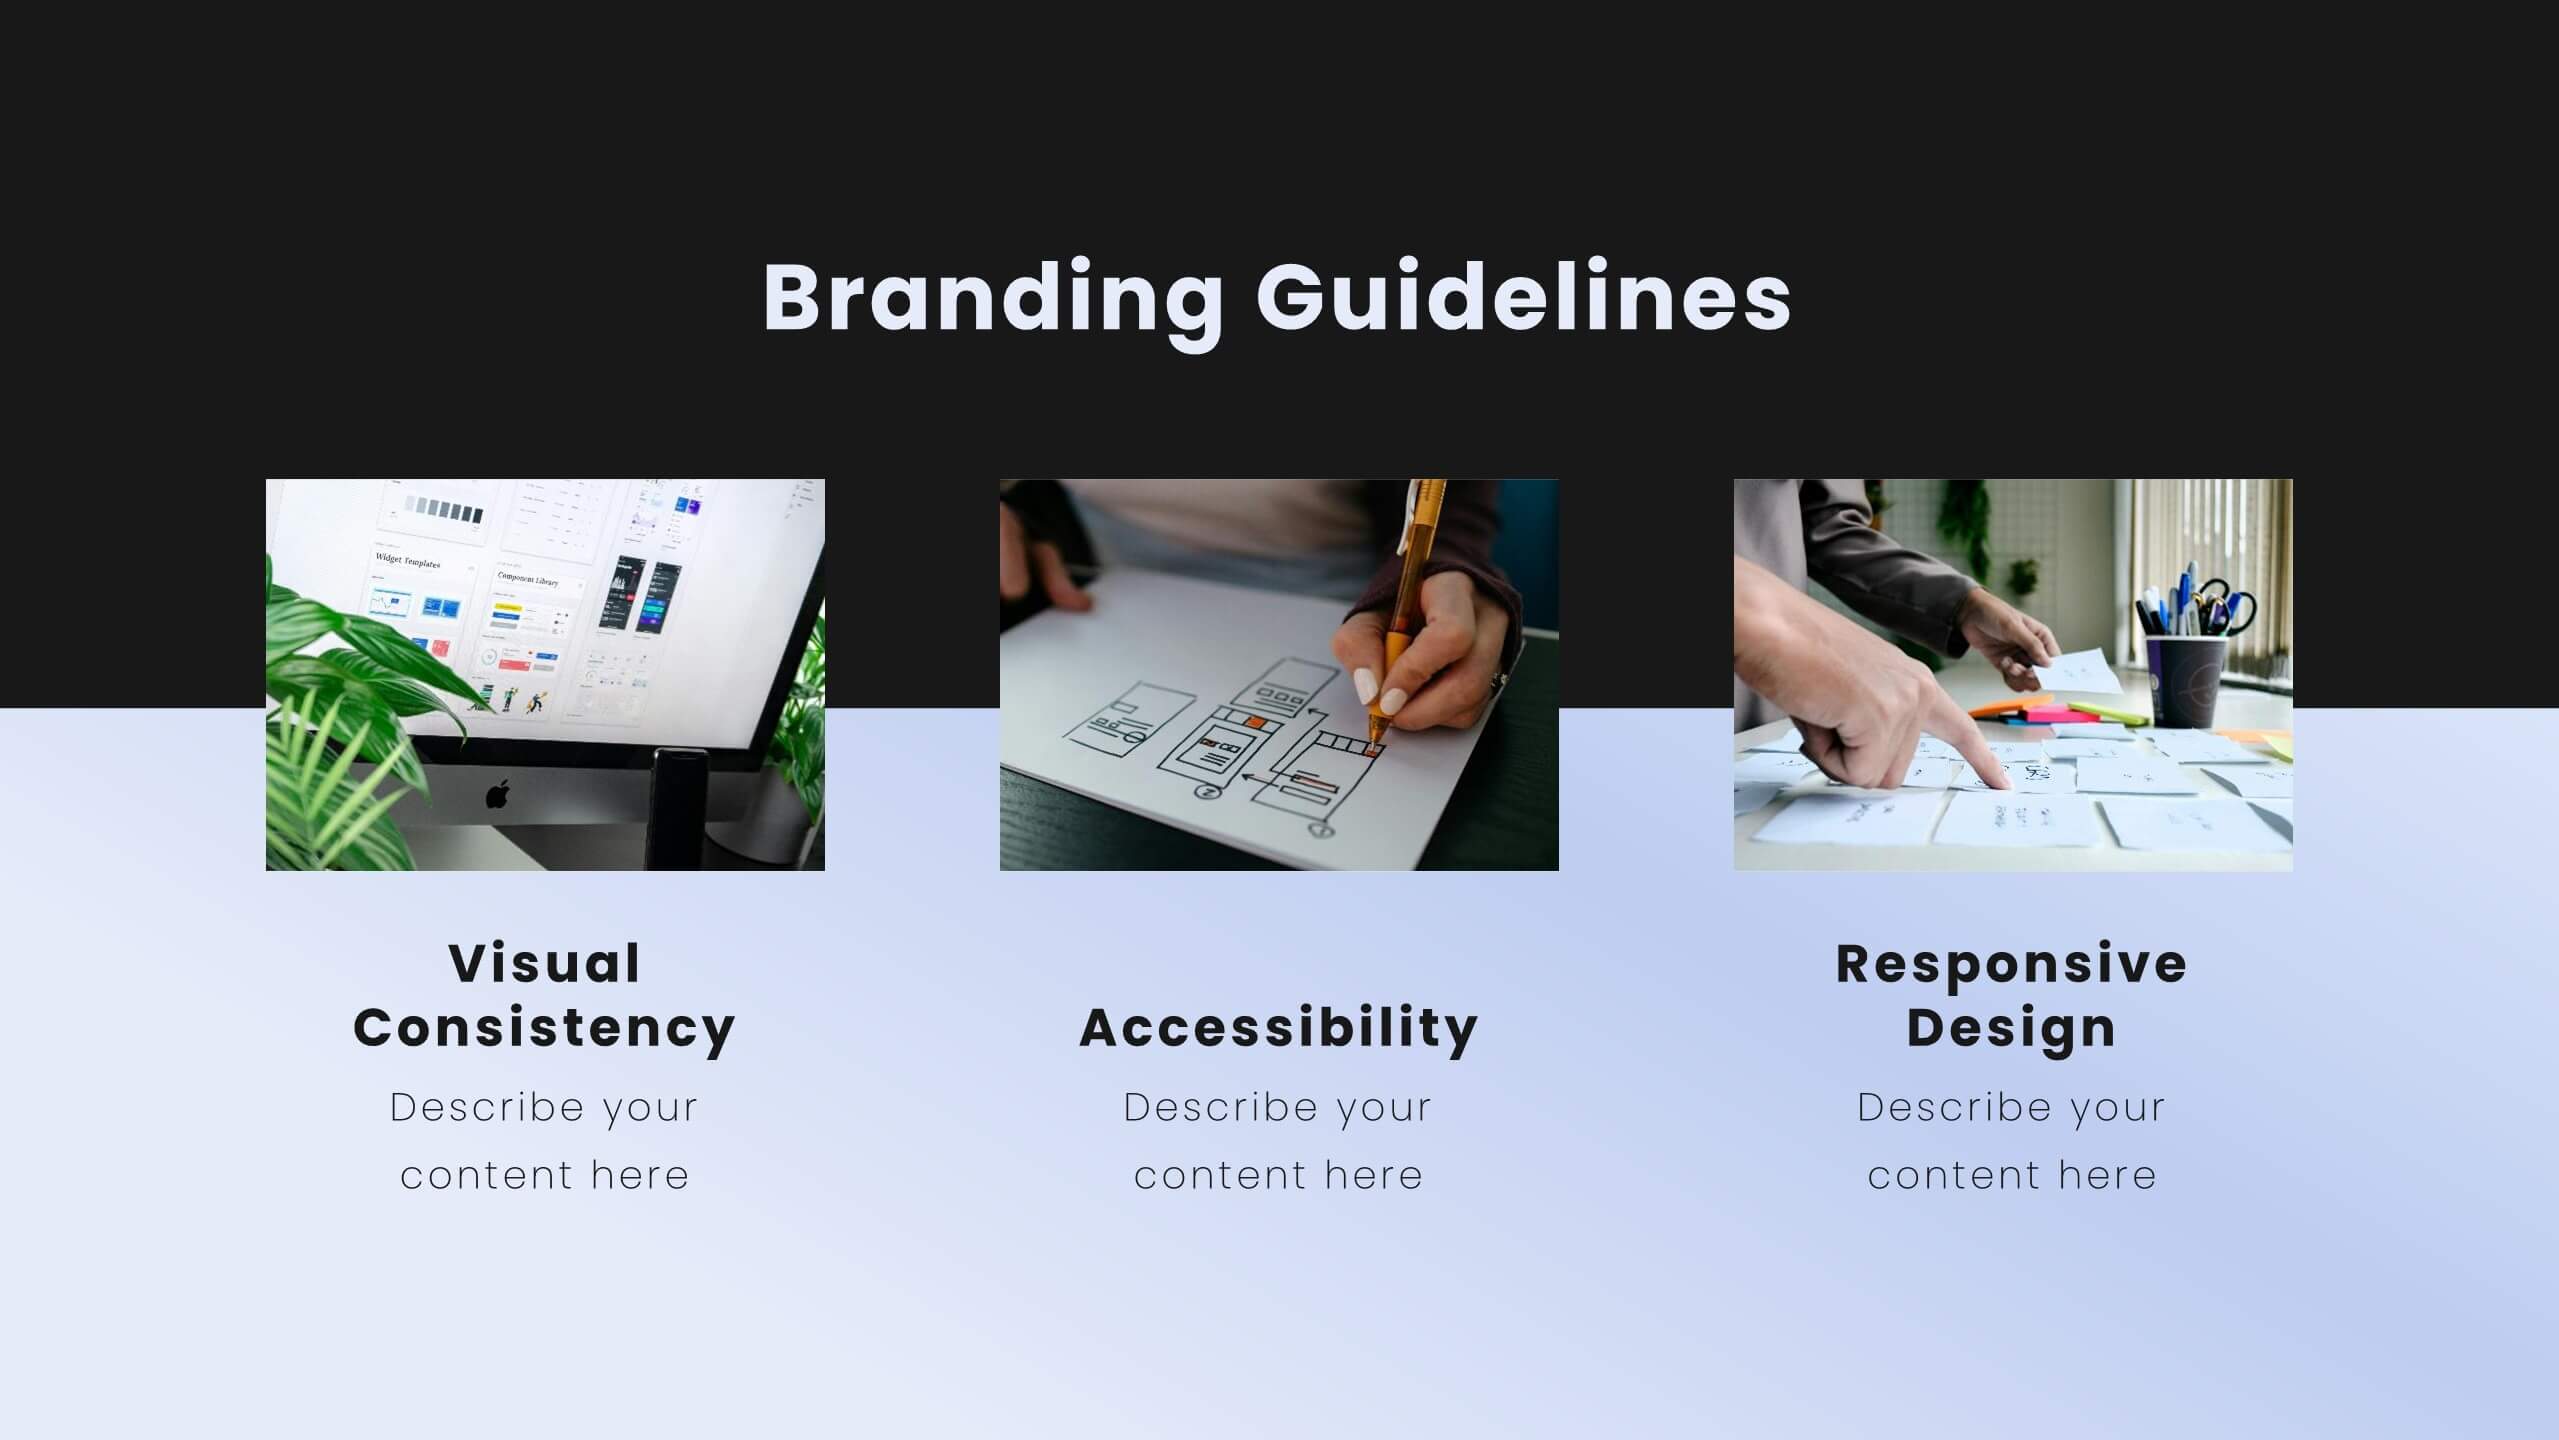
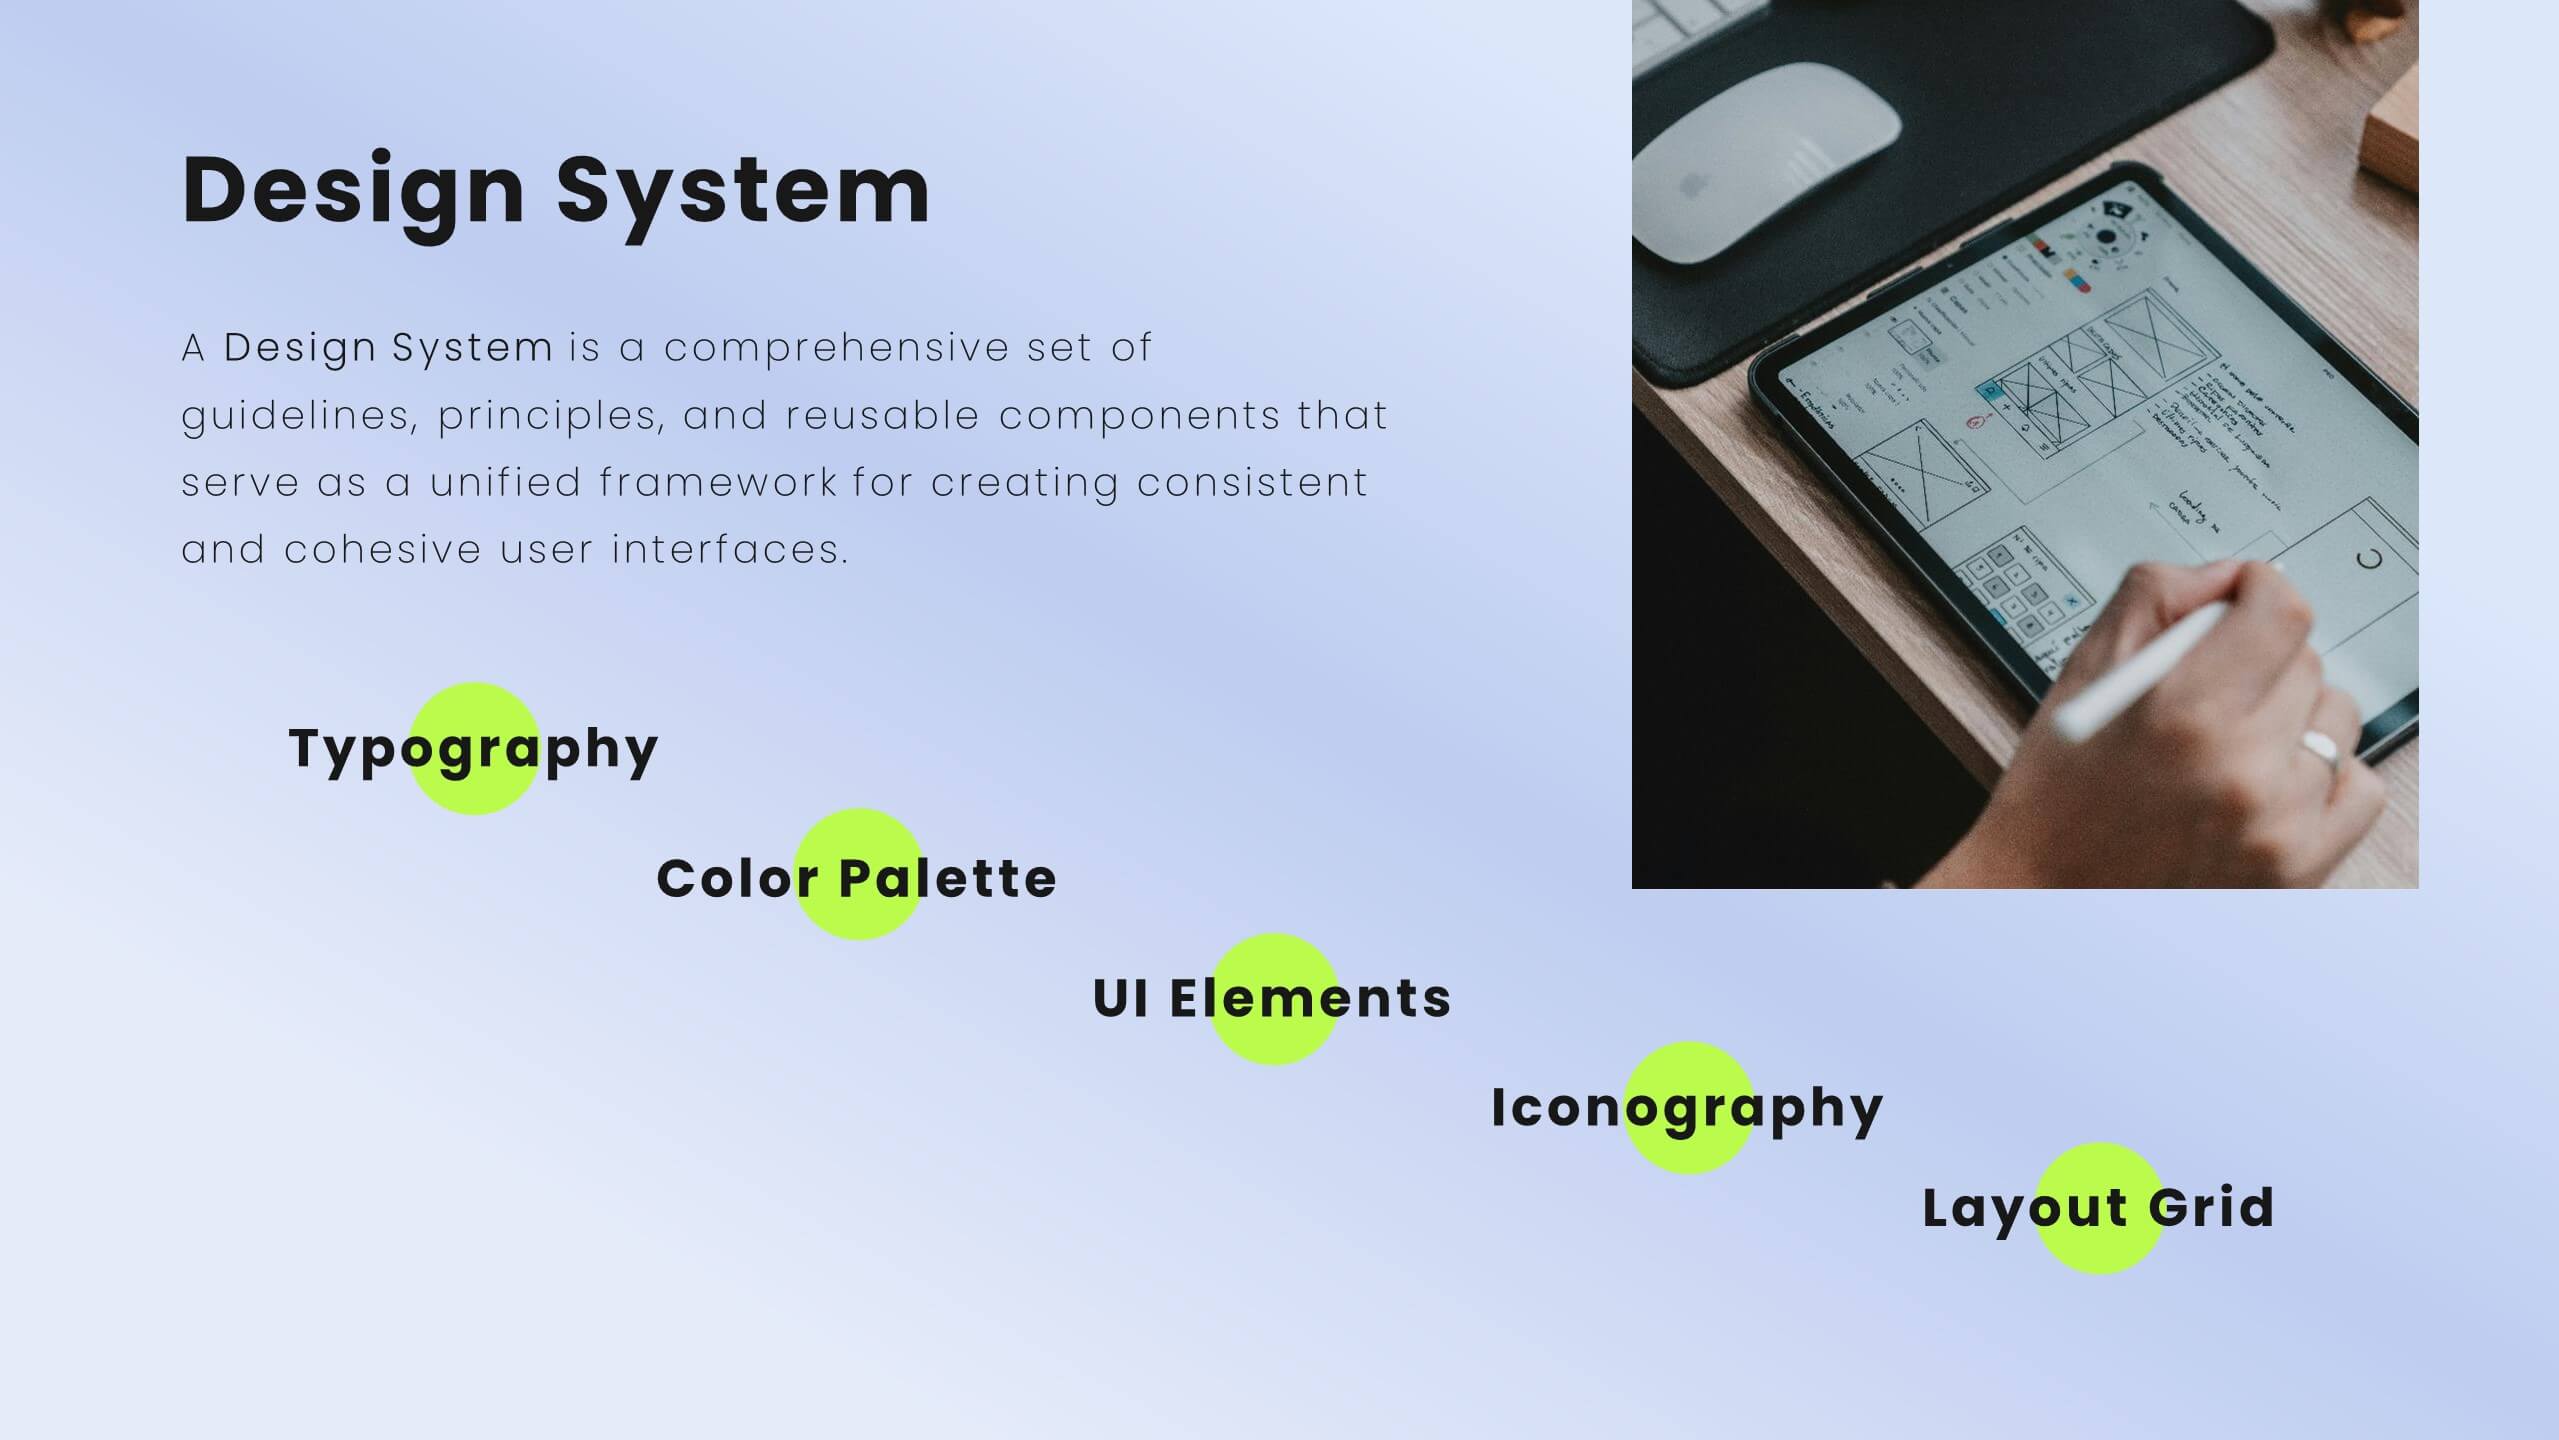
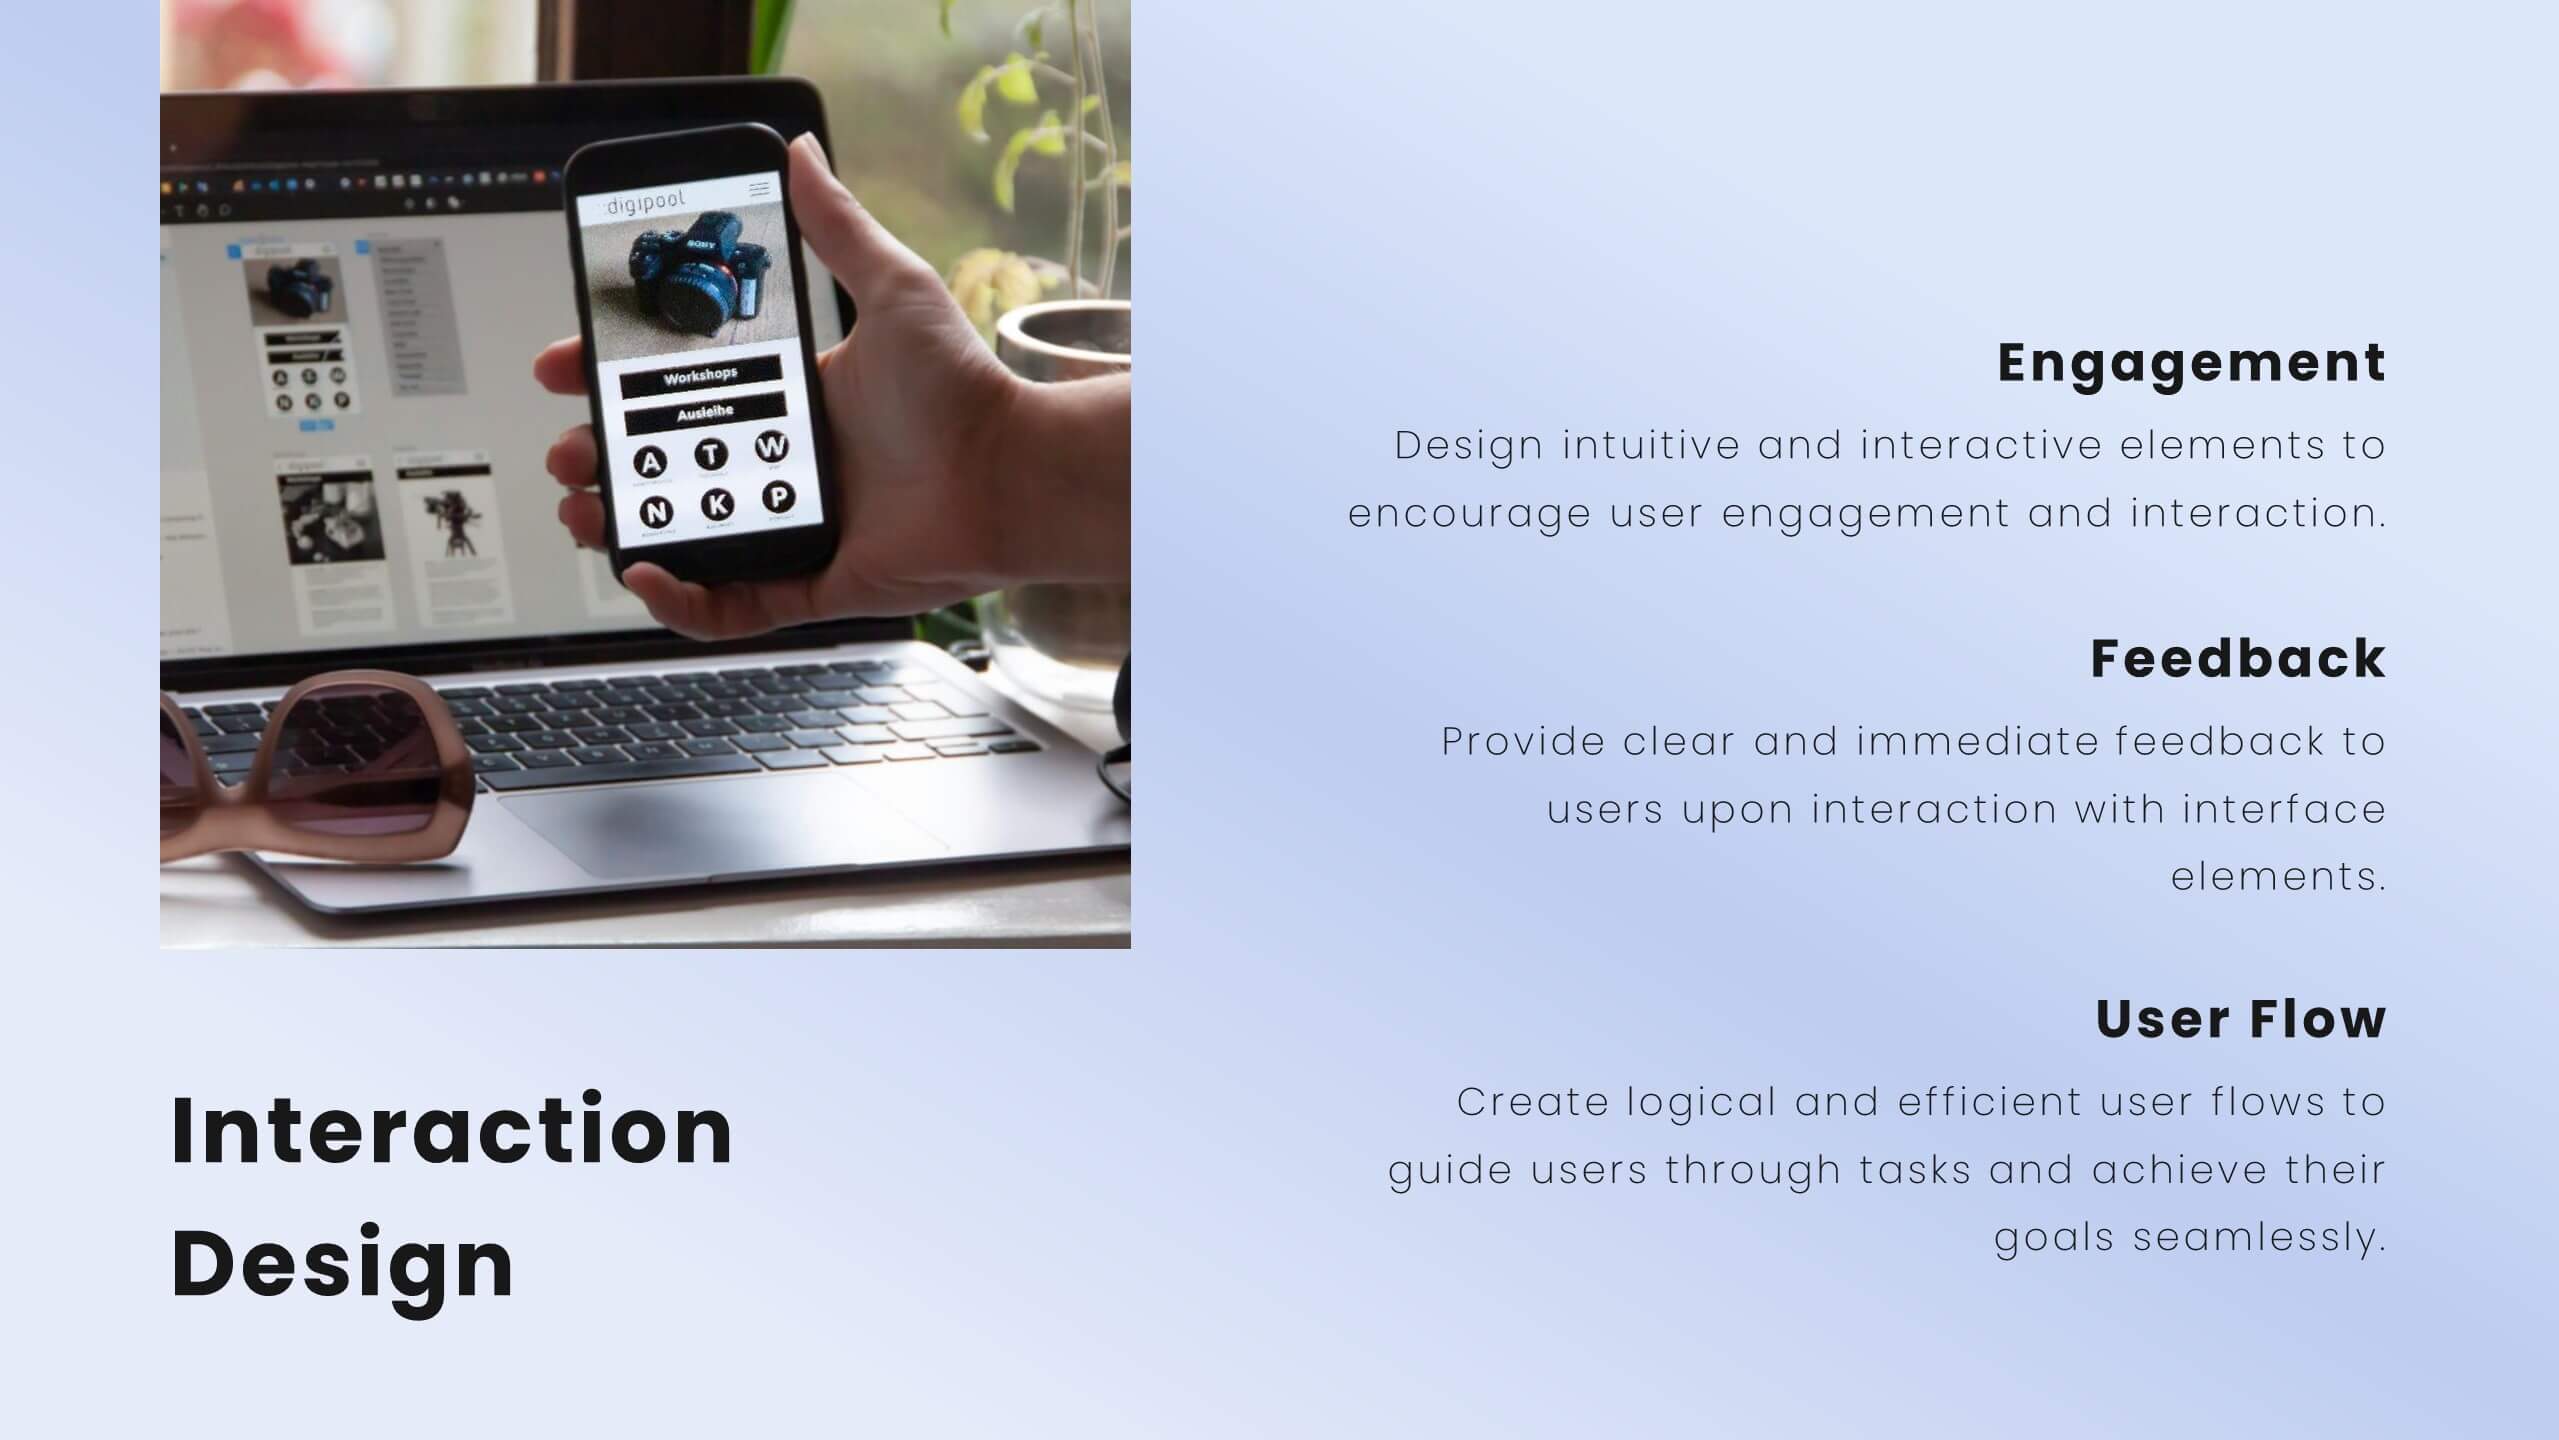
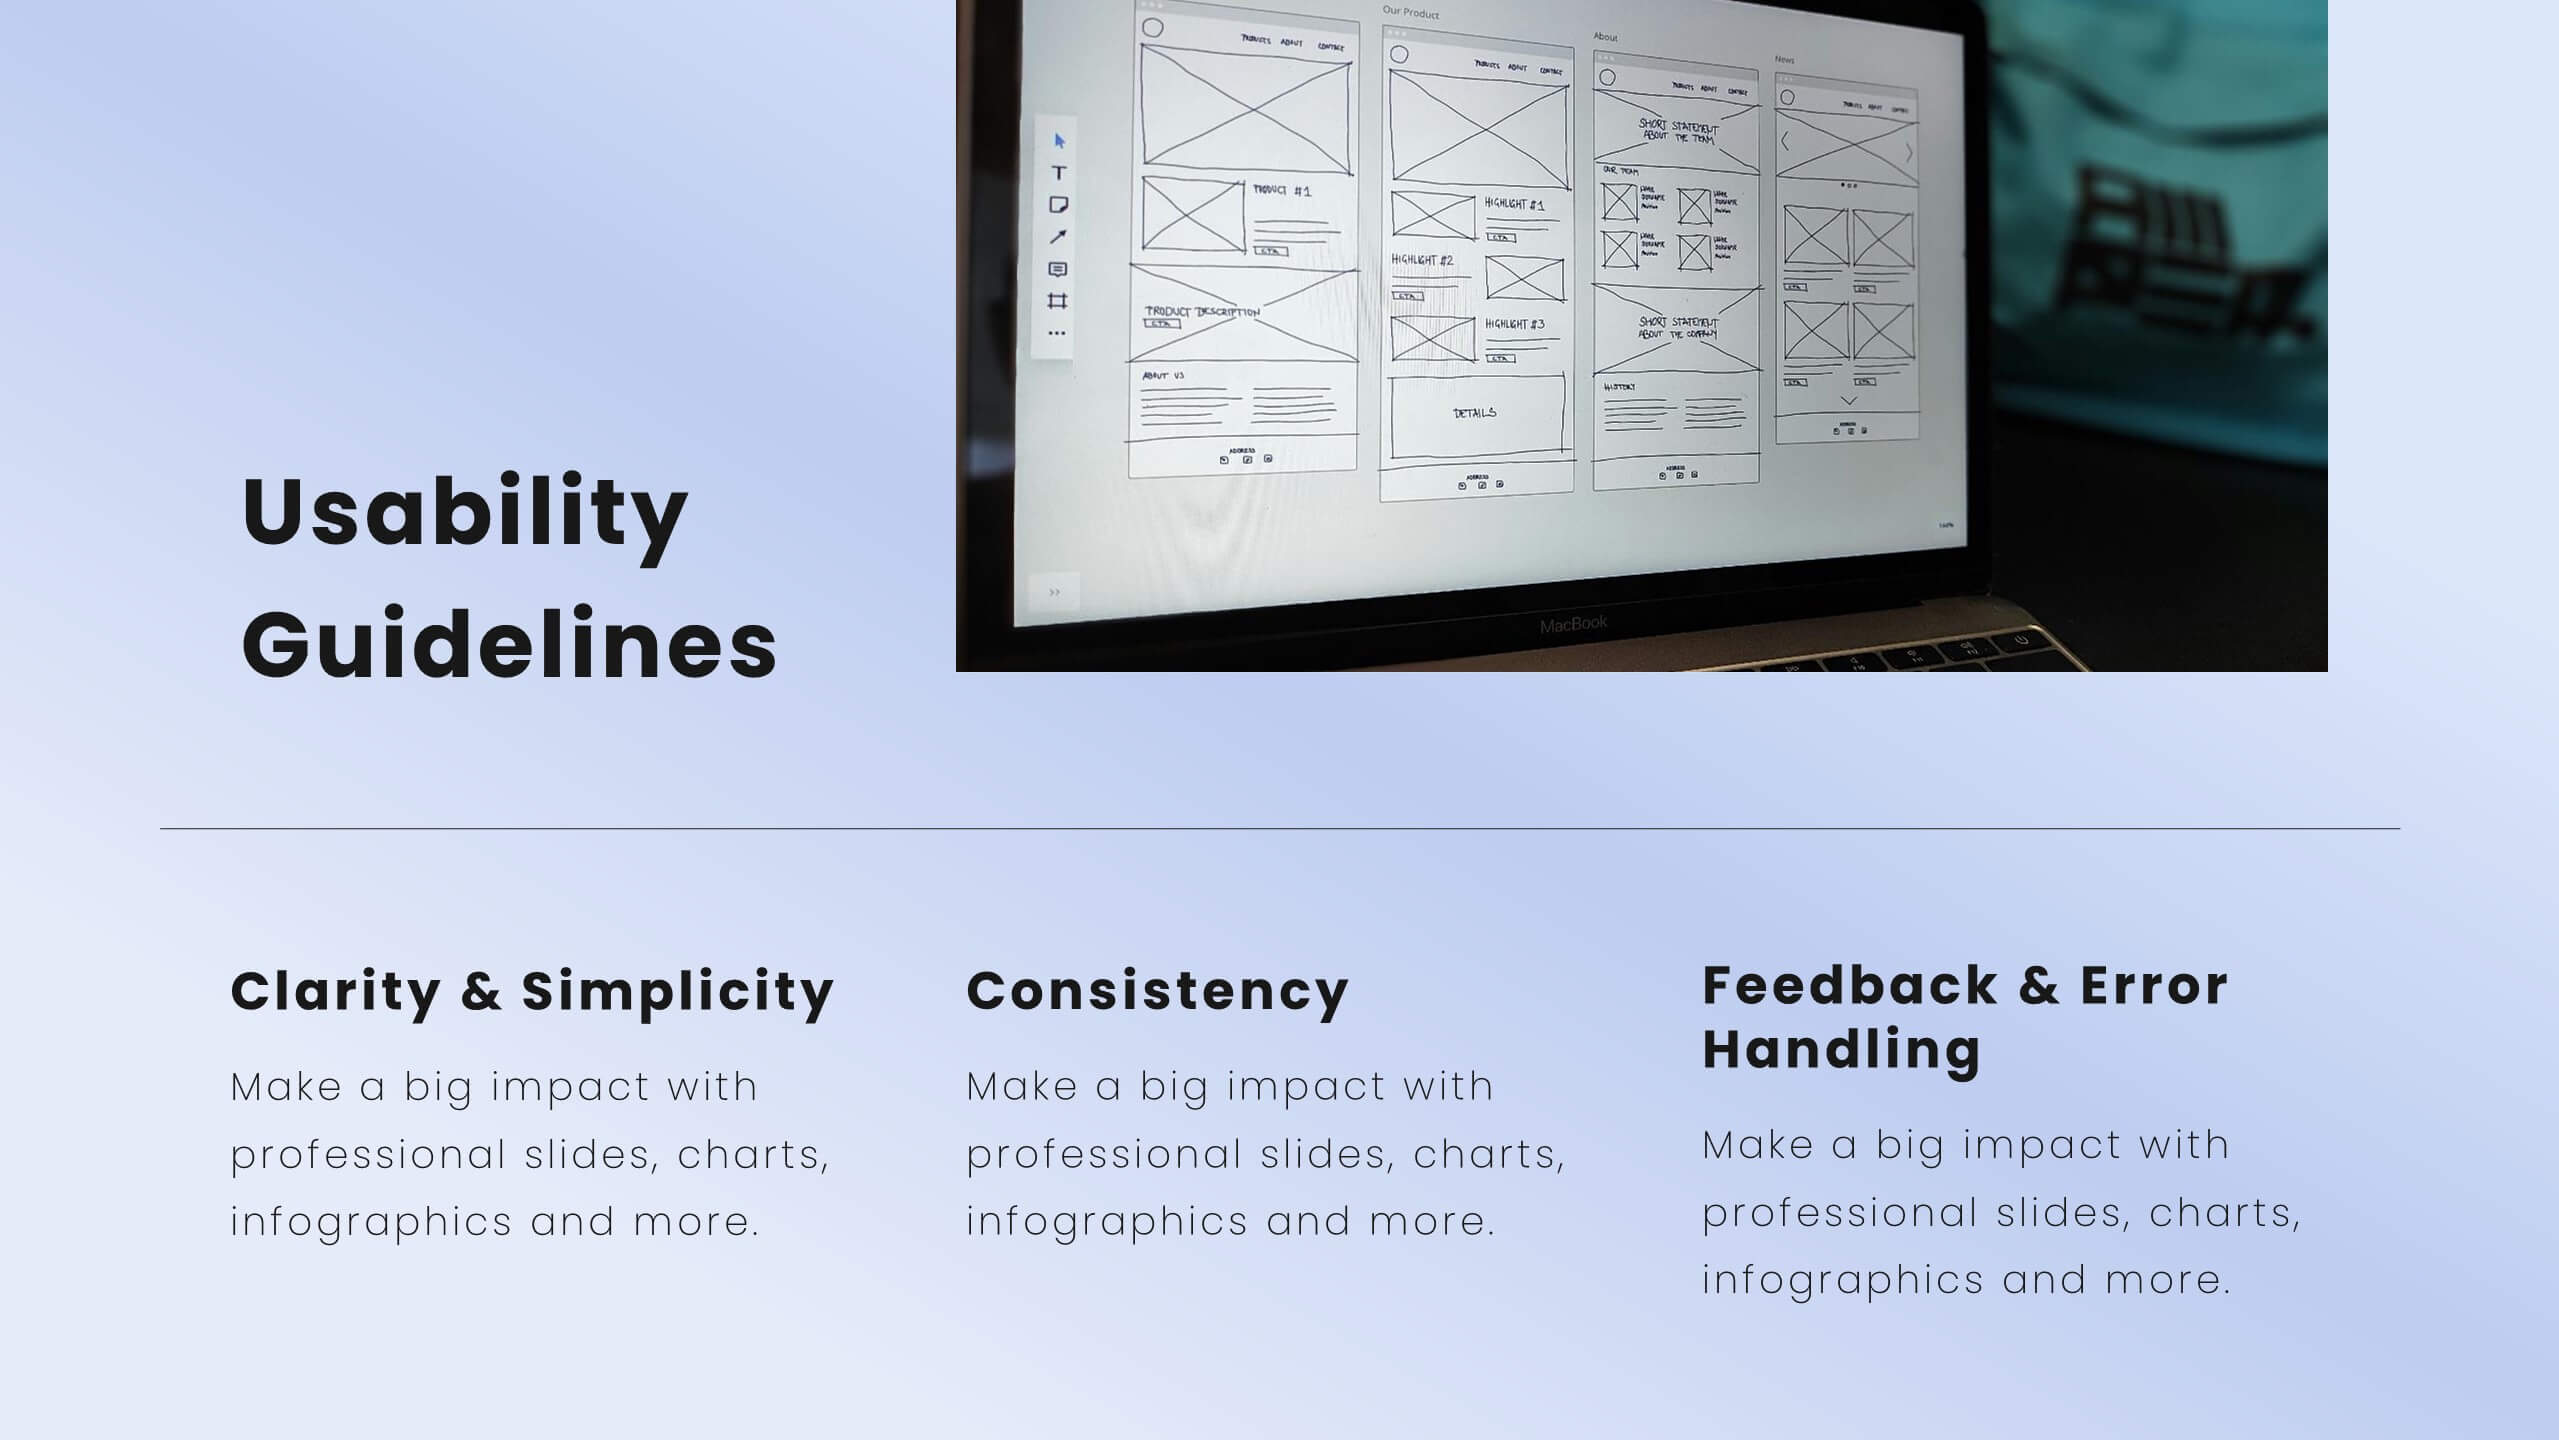
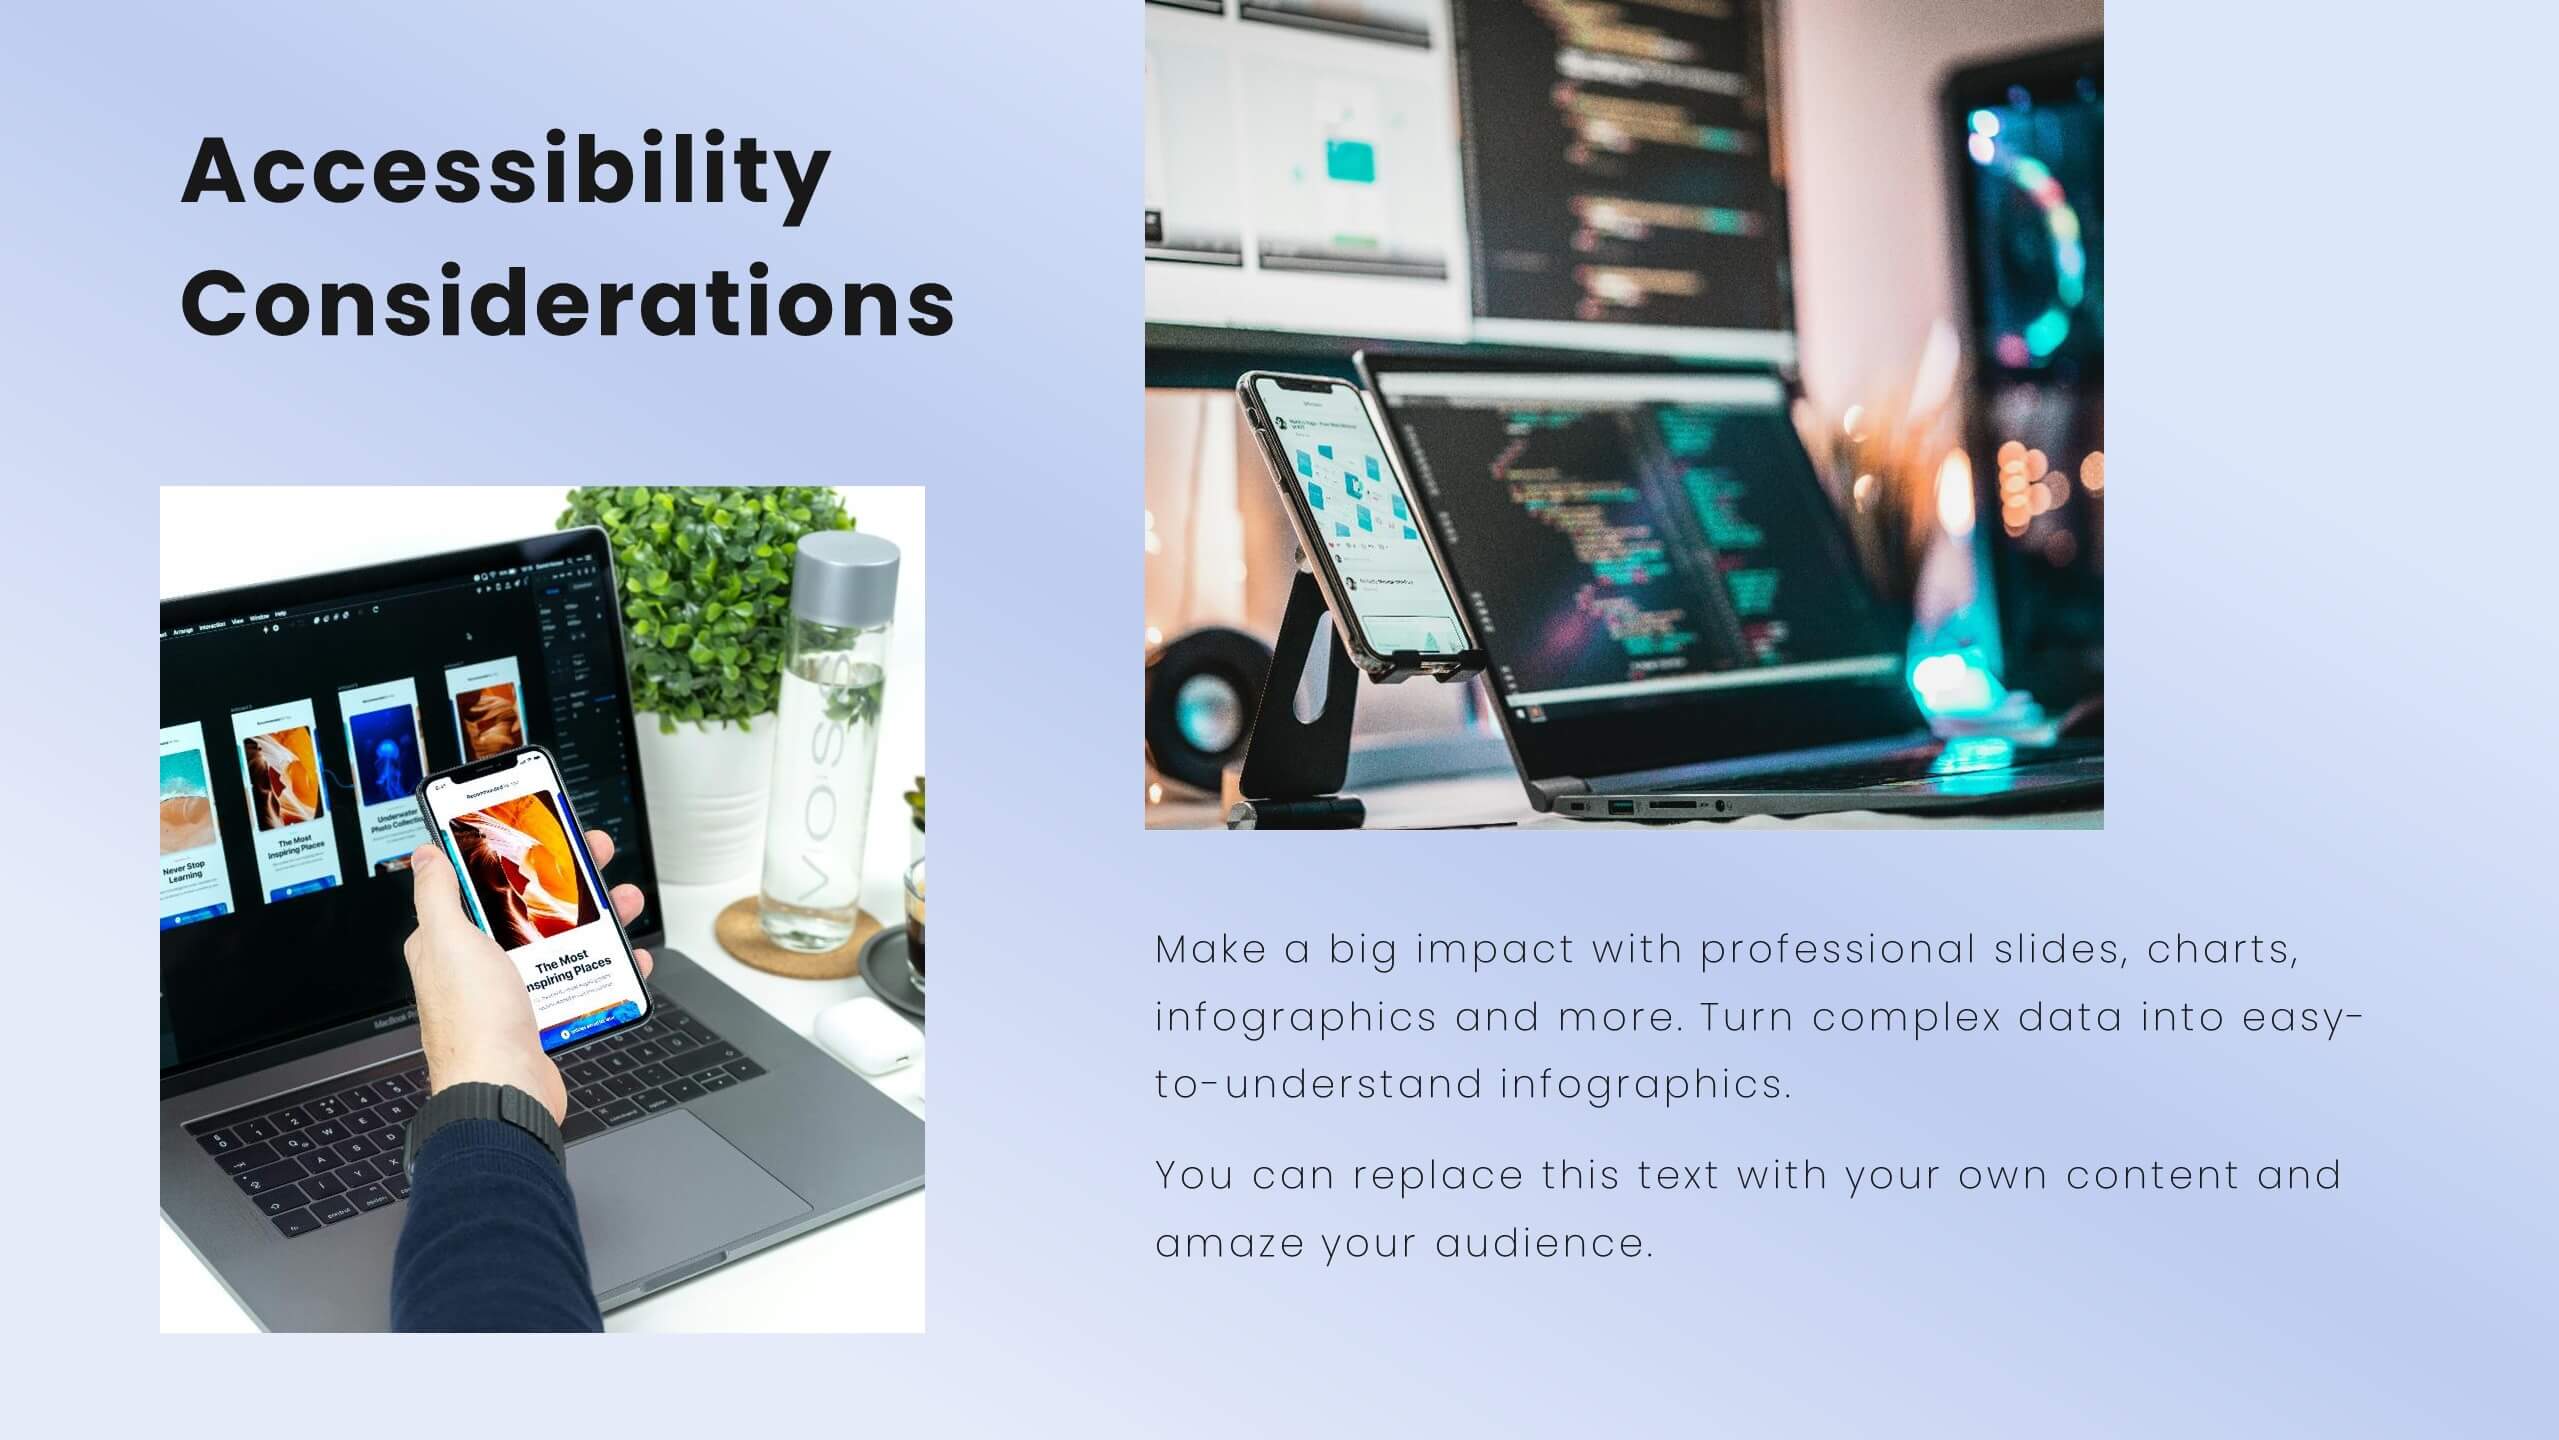
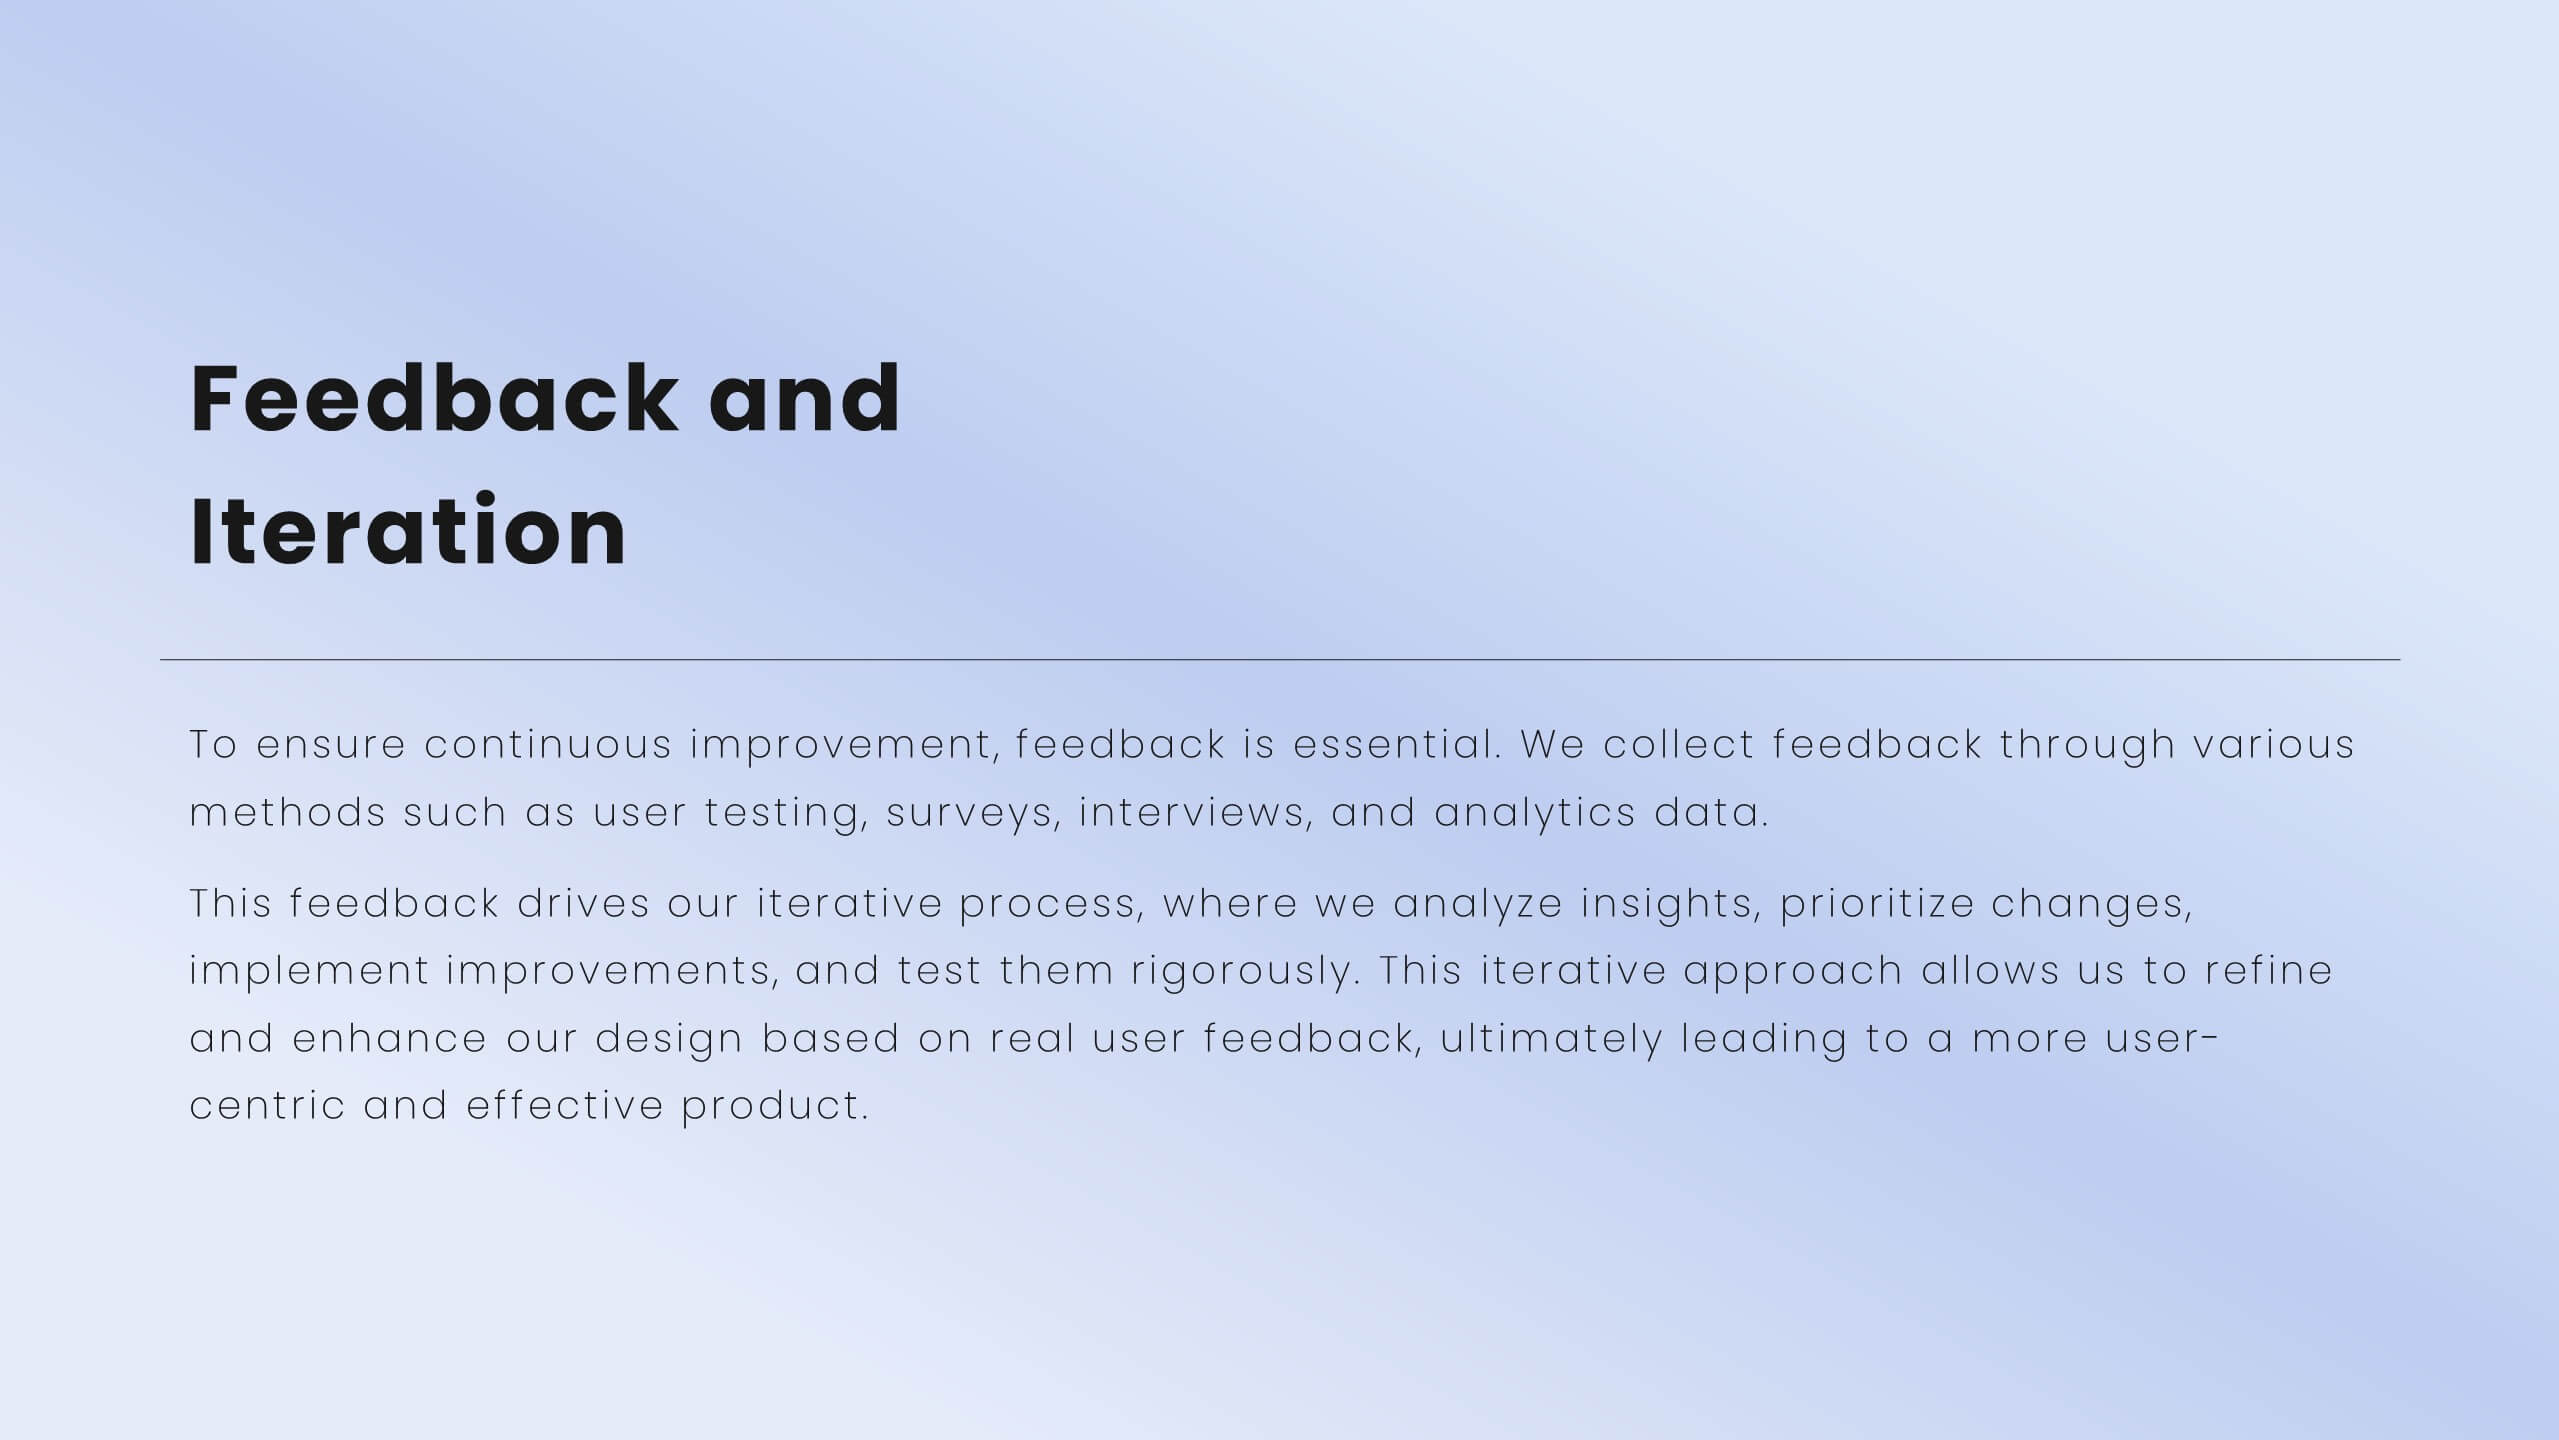
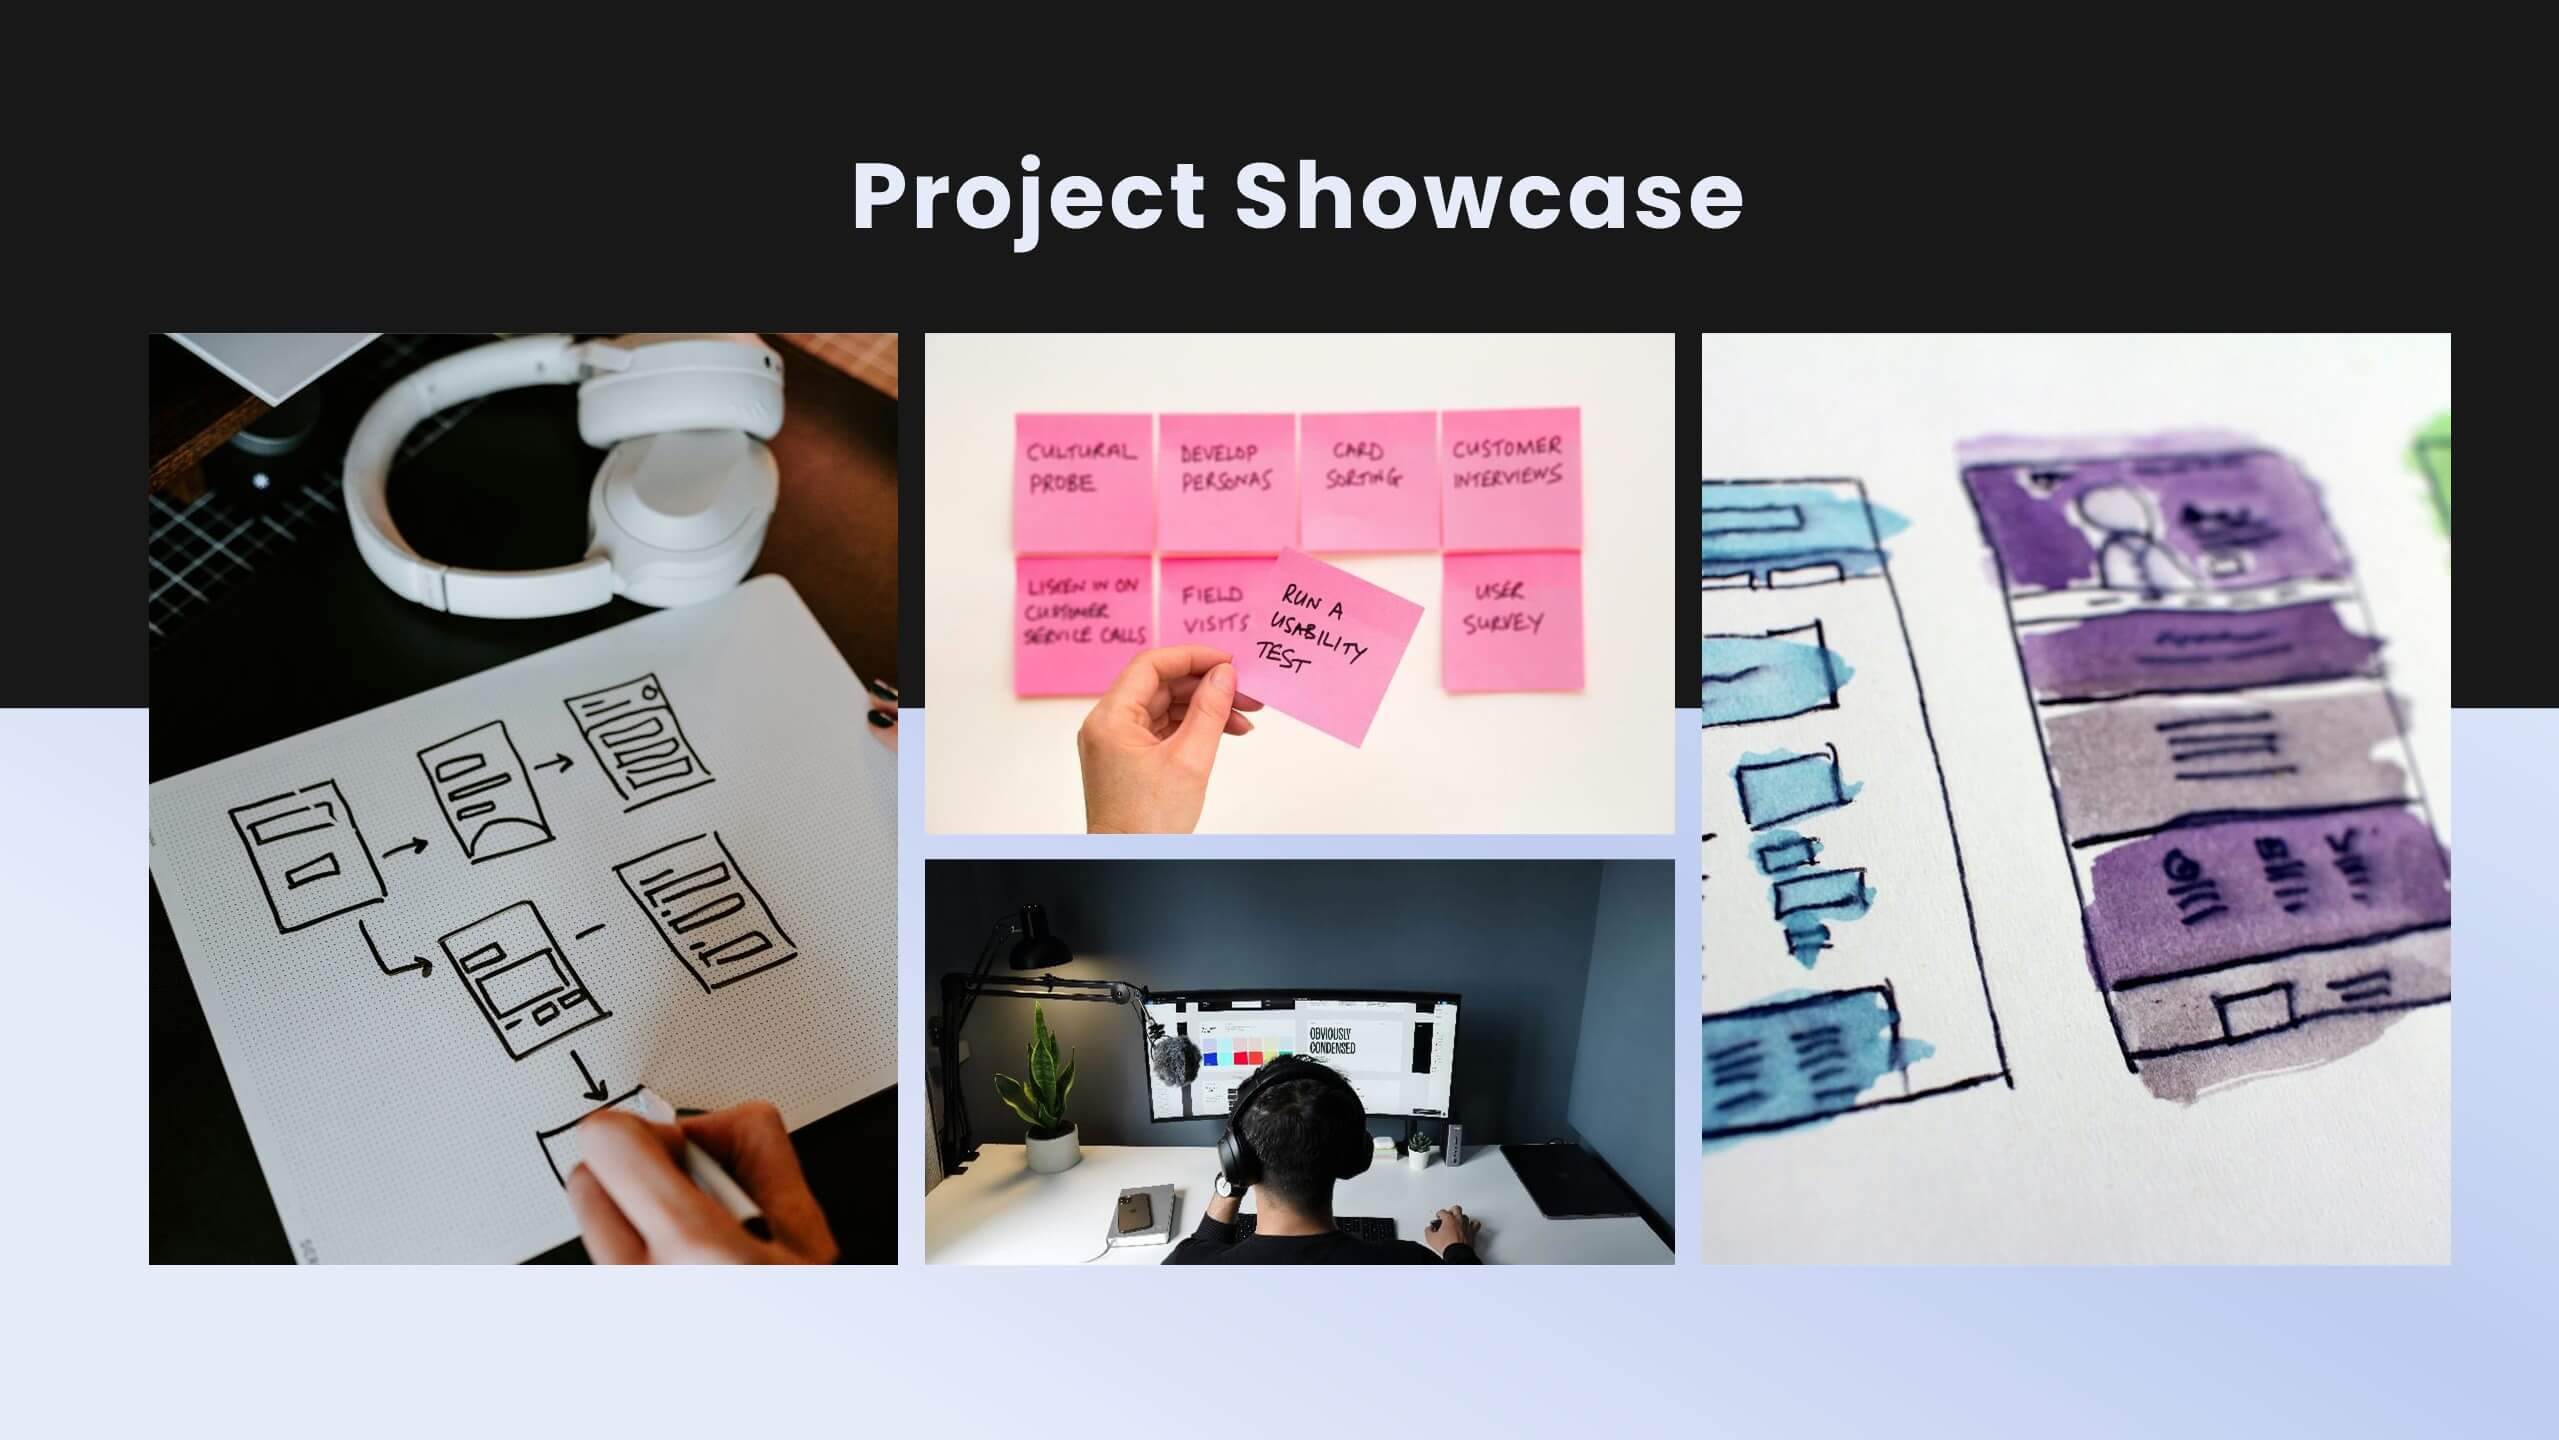
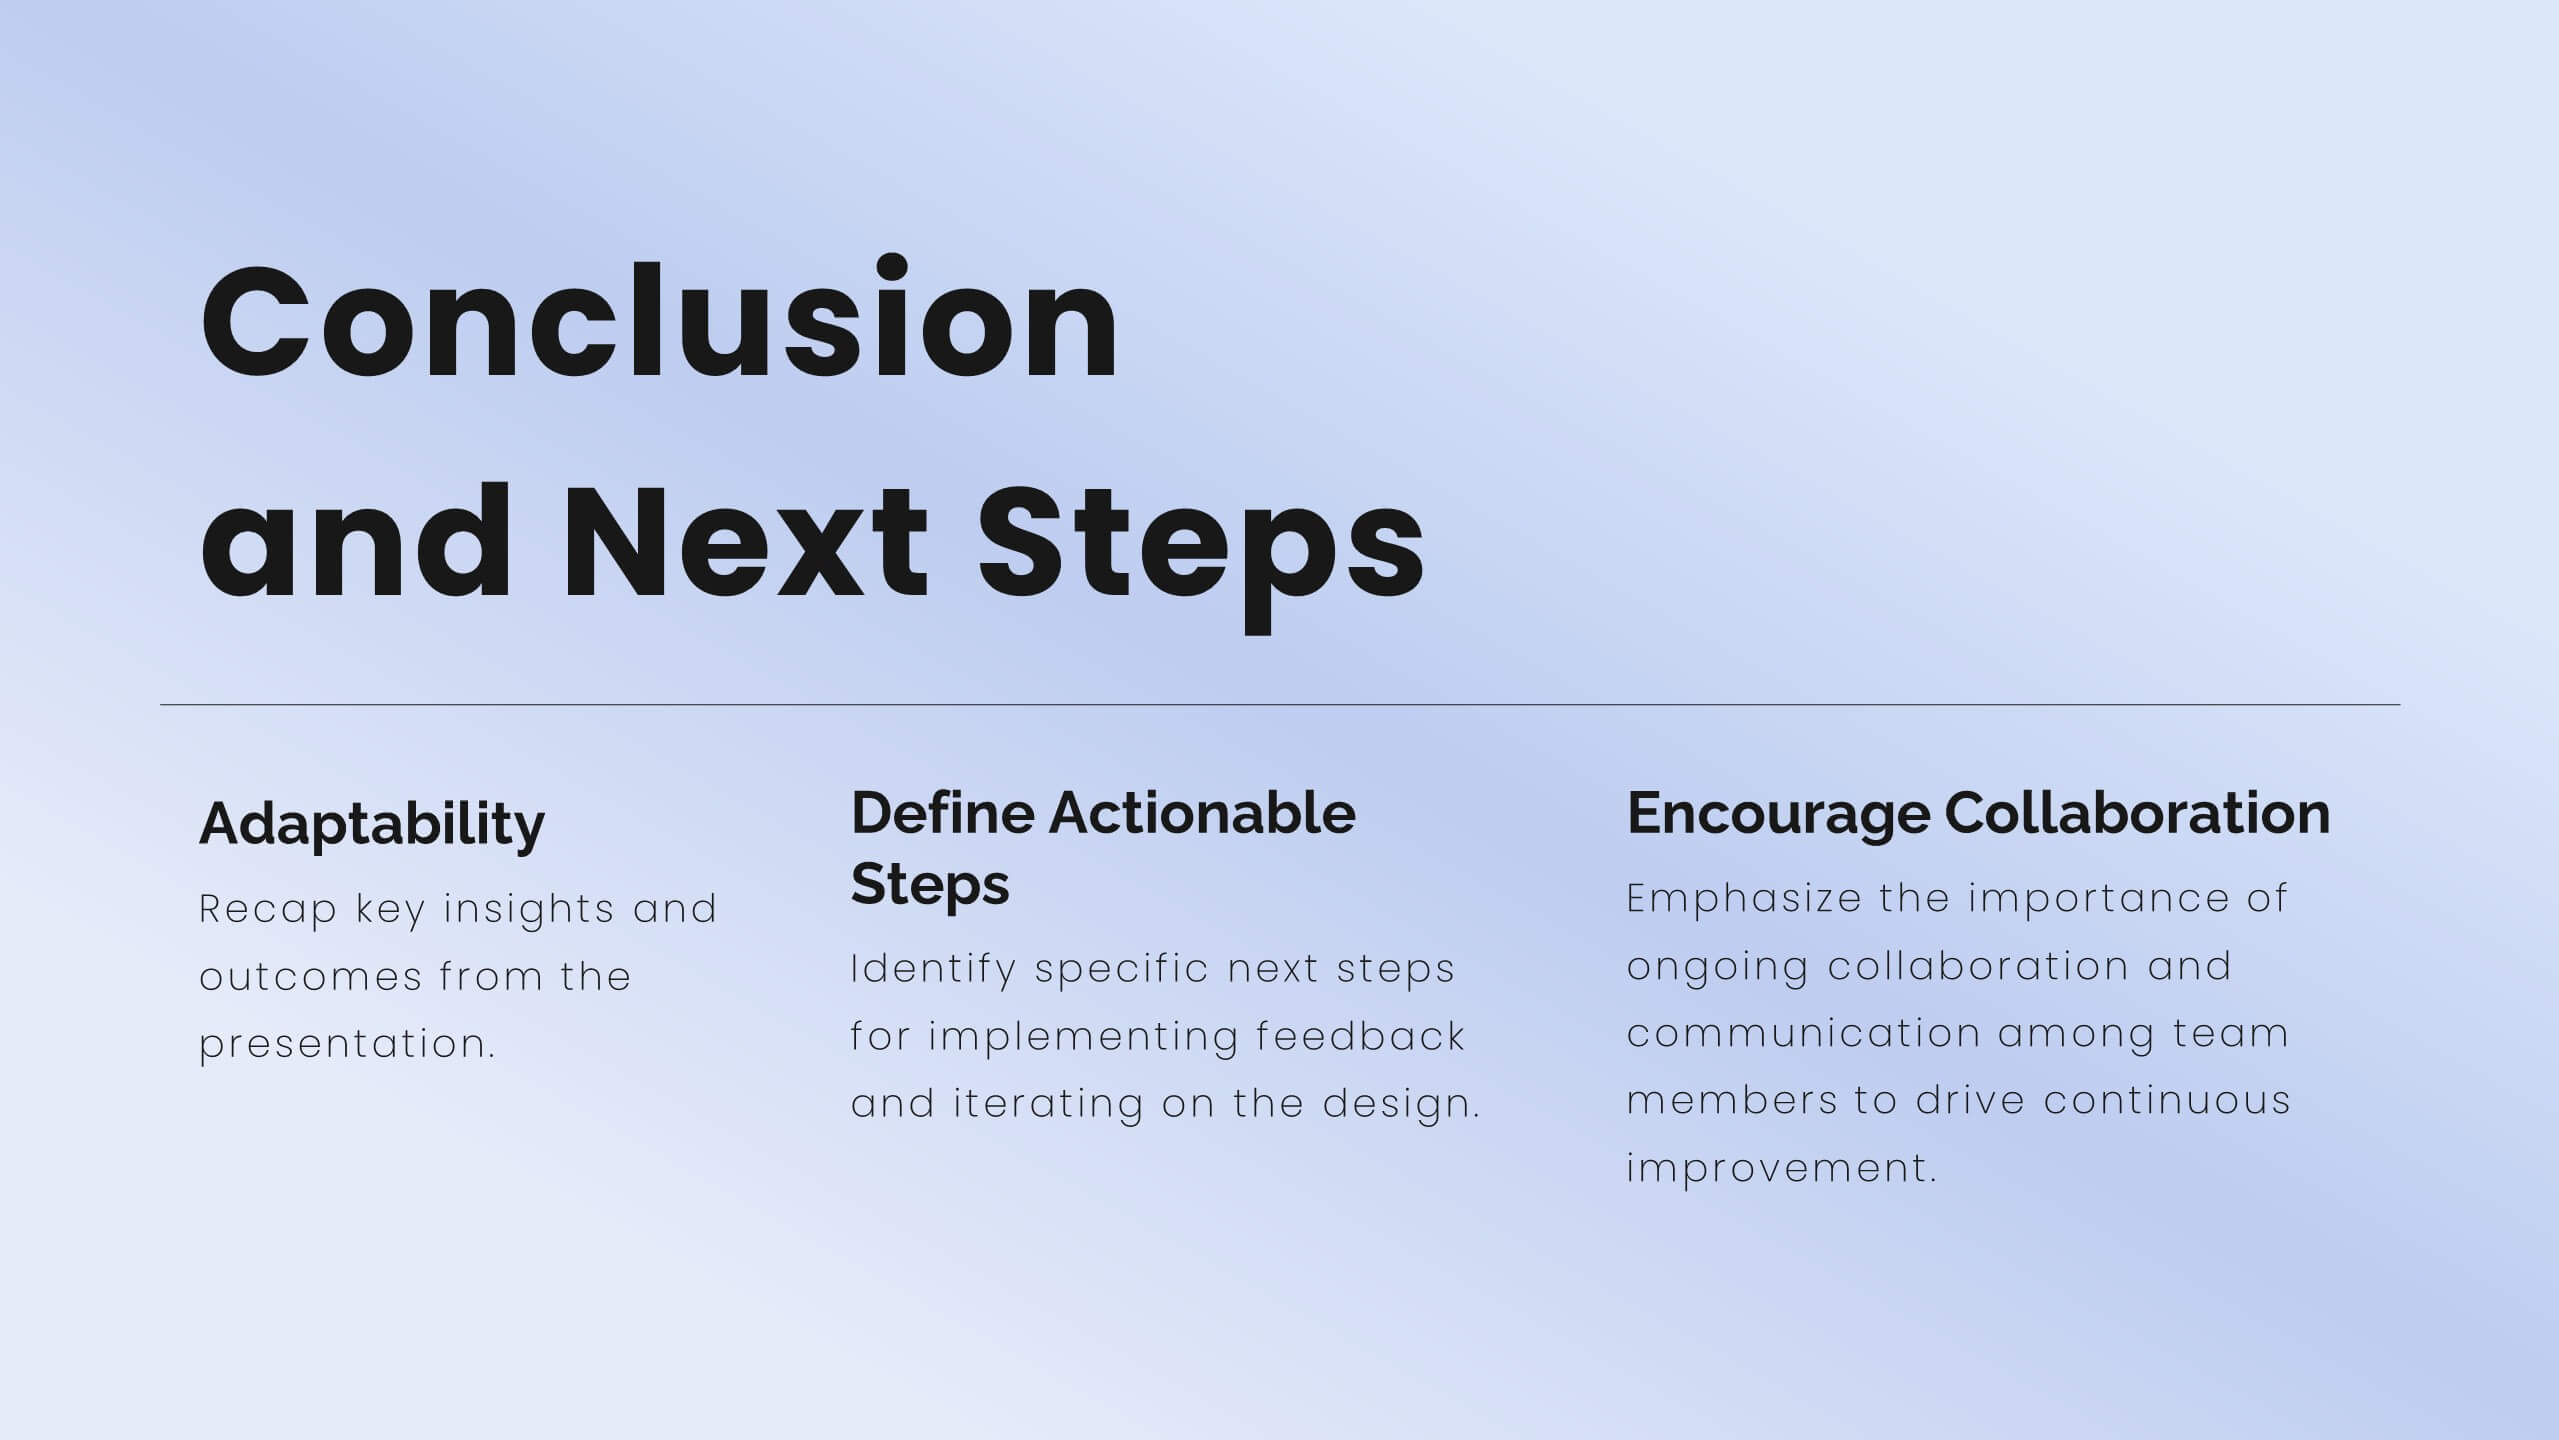
Jigsaw User Experience Proposal Presentation
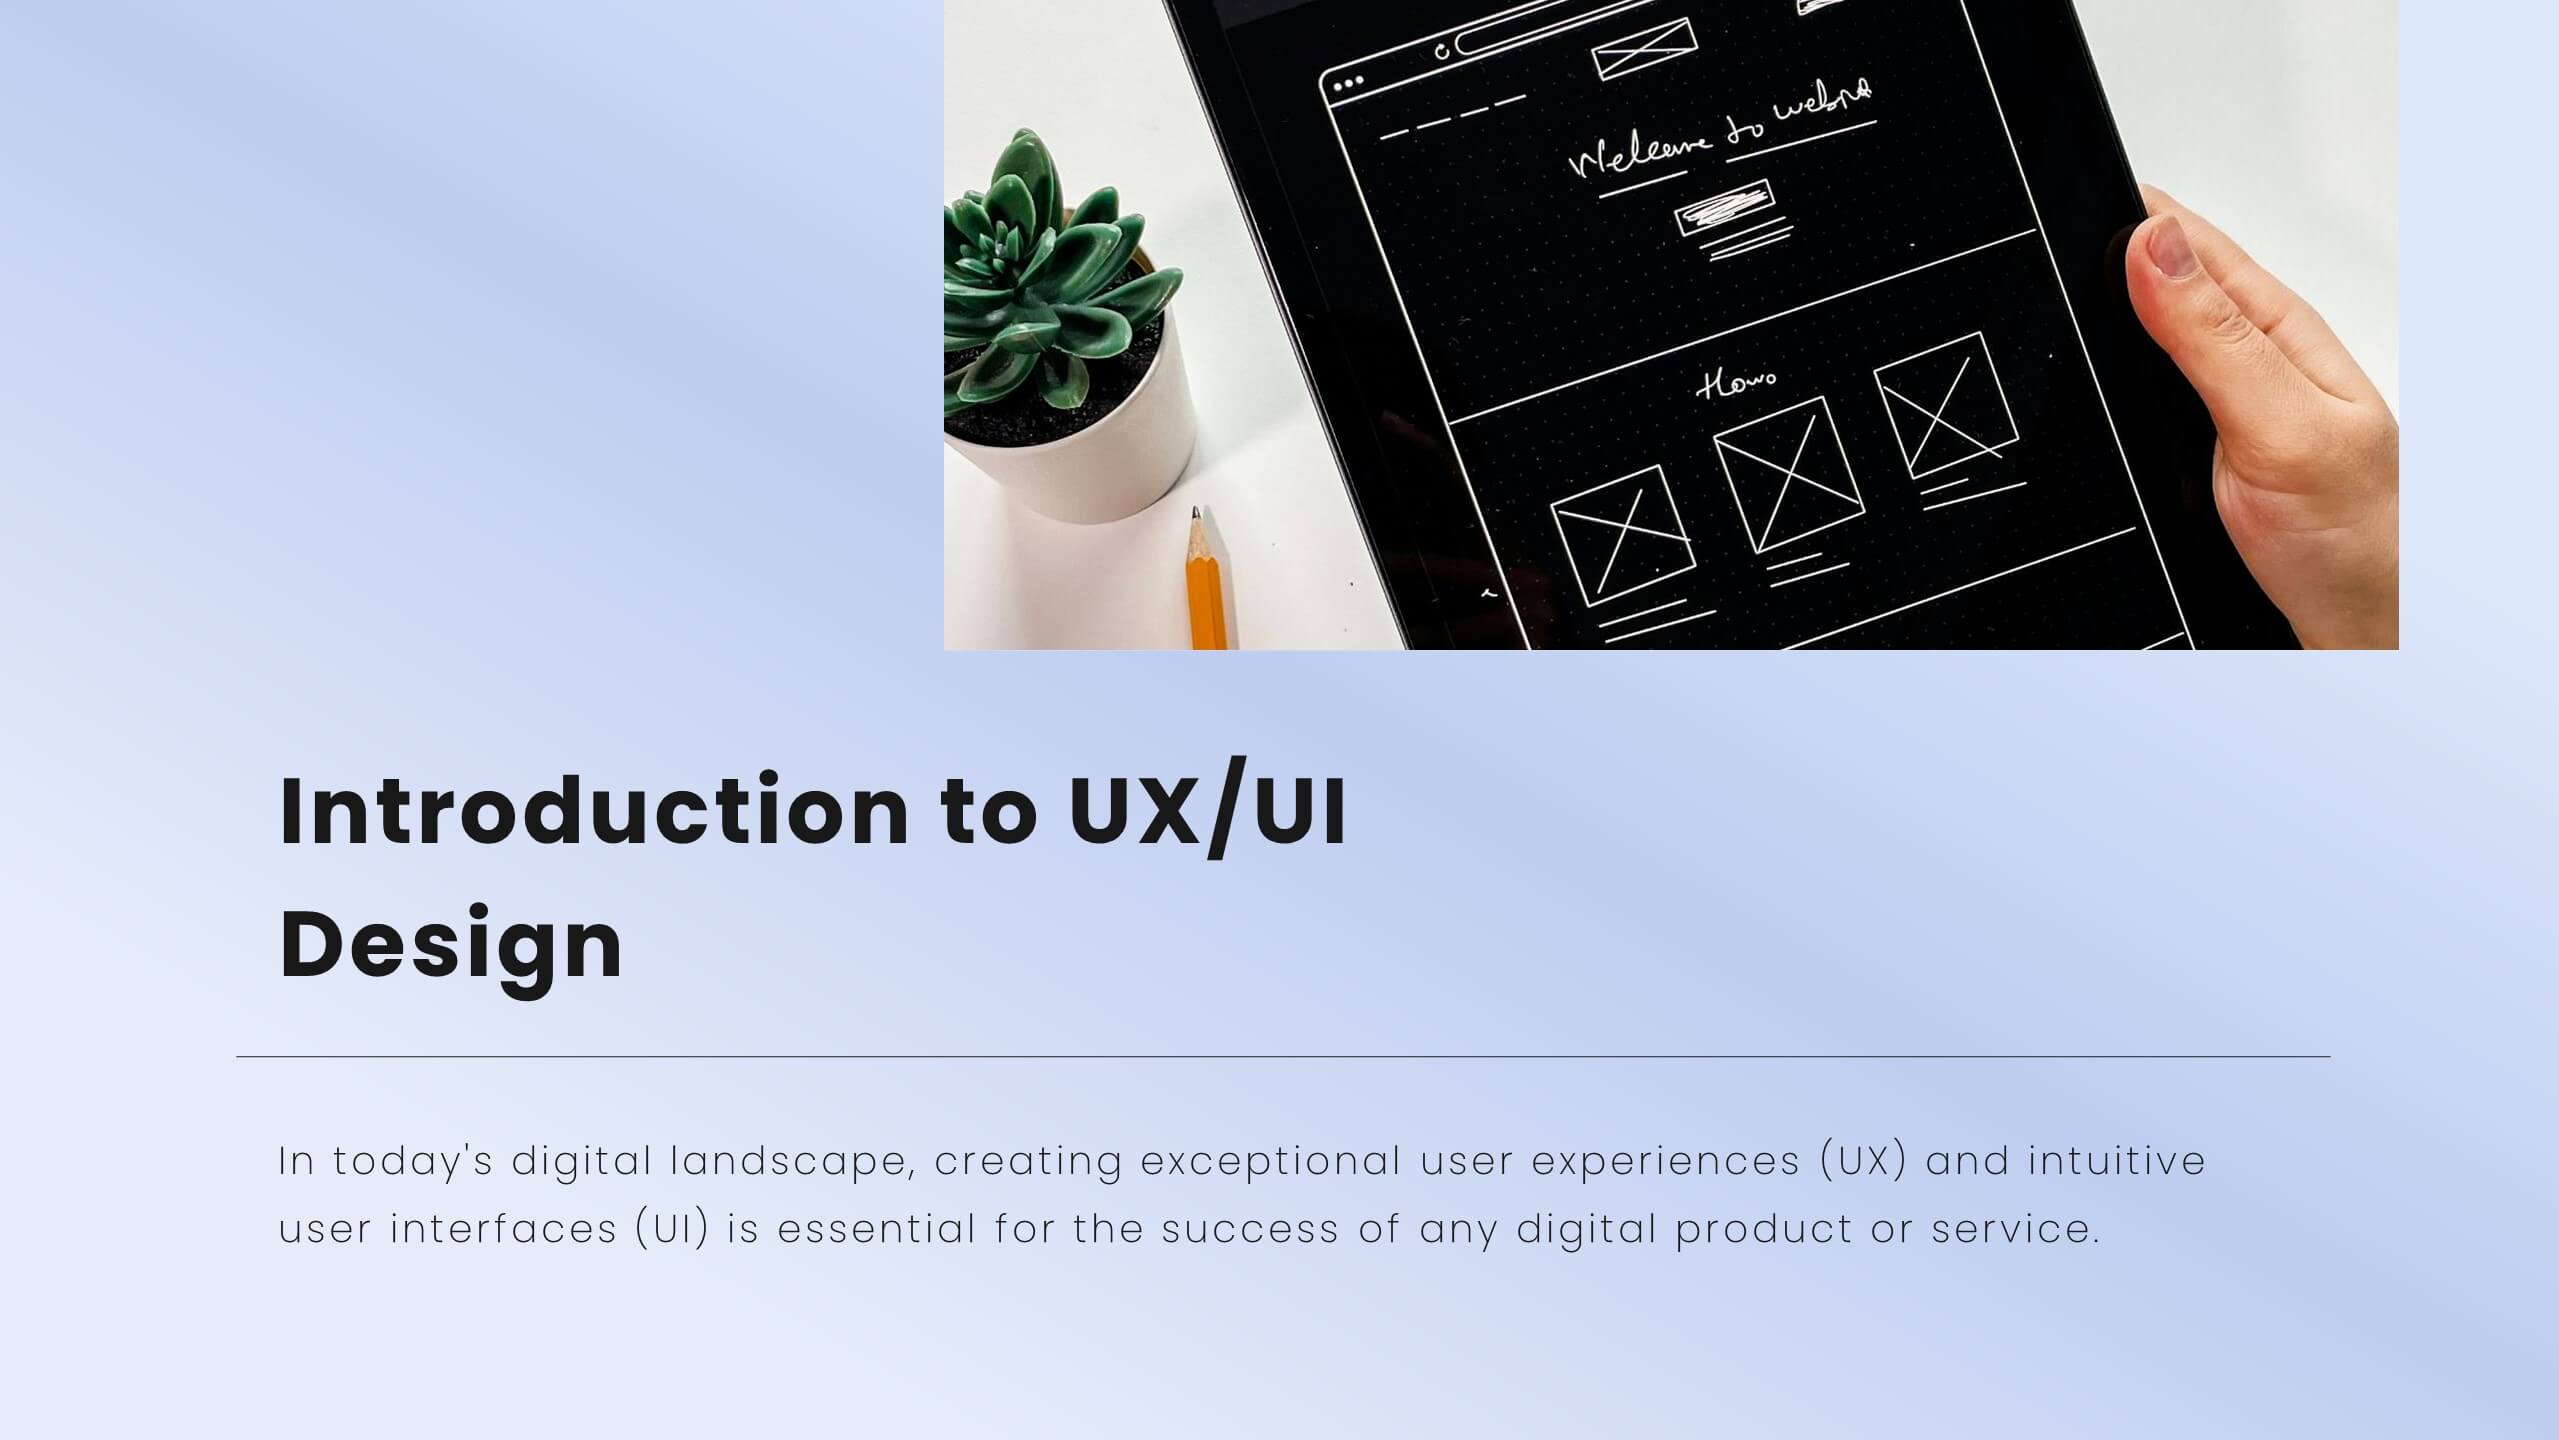
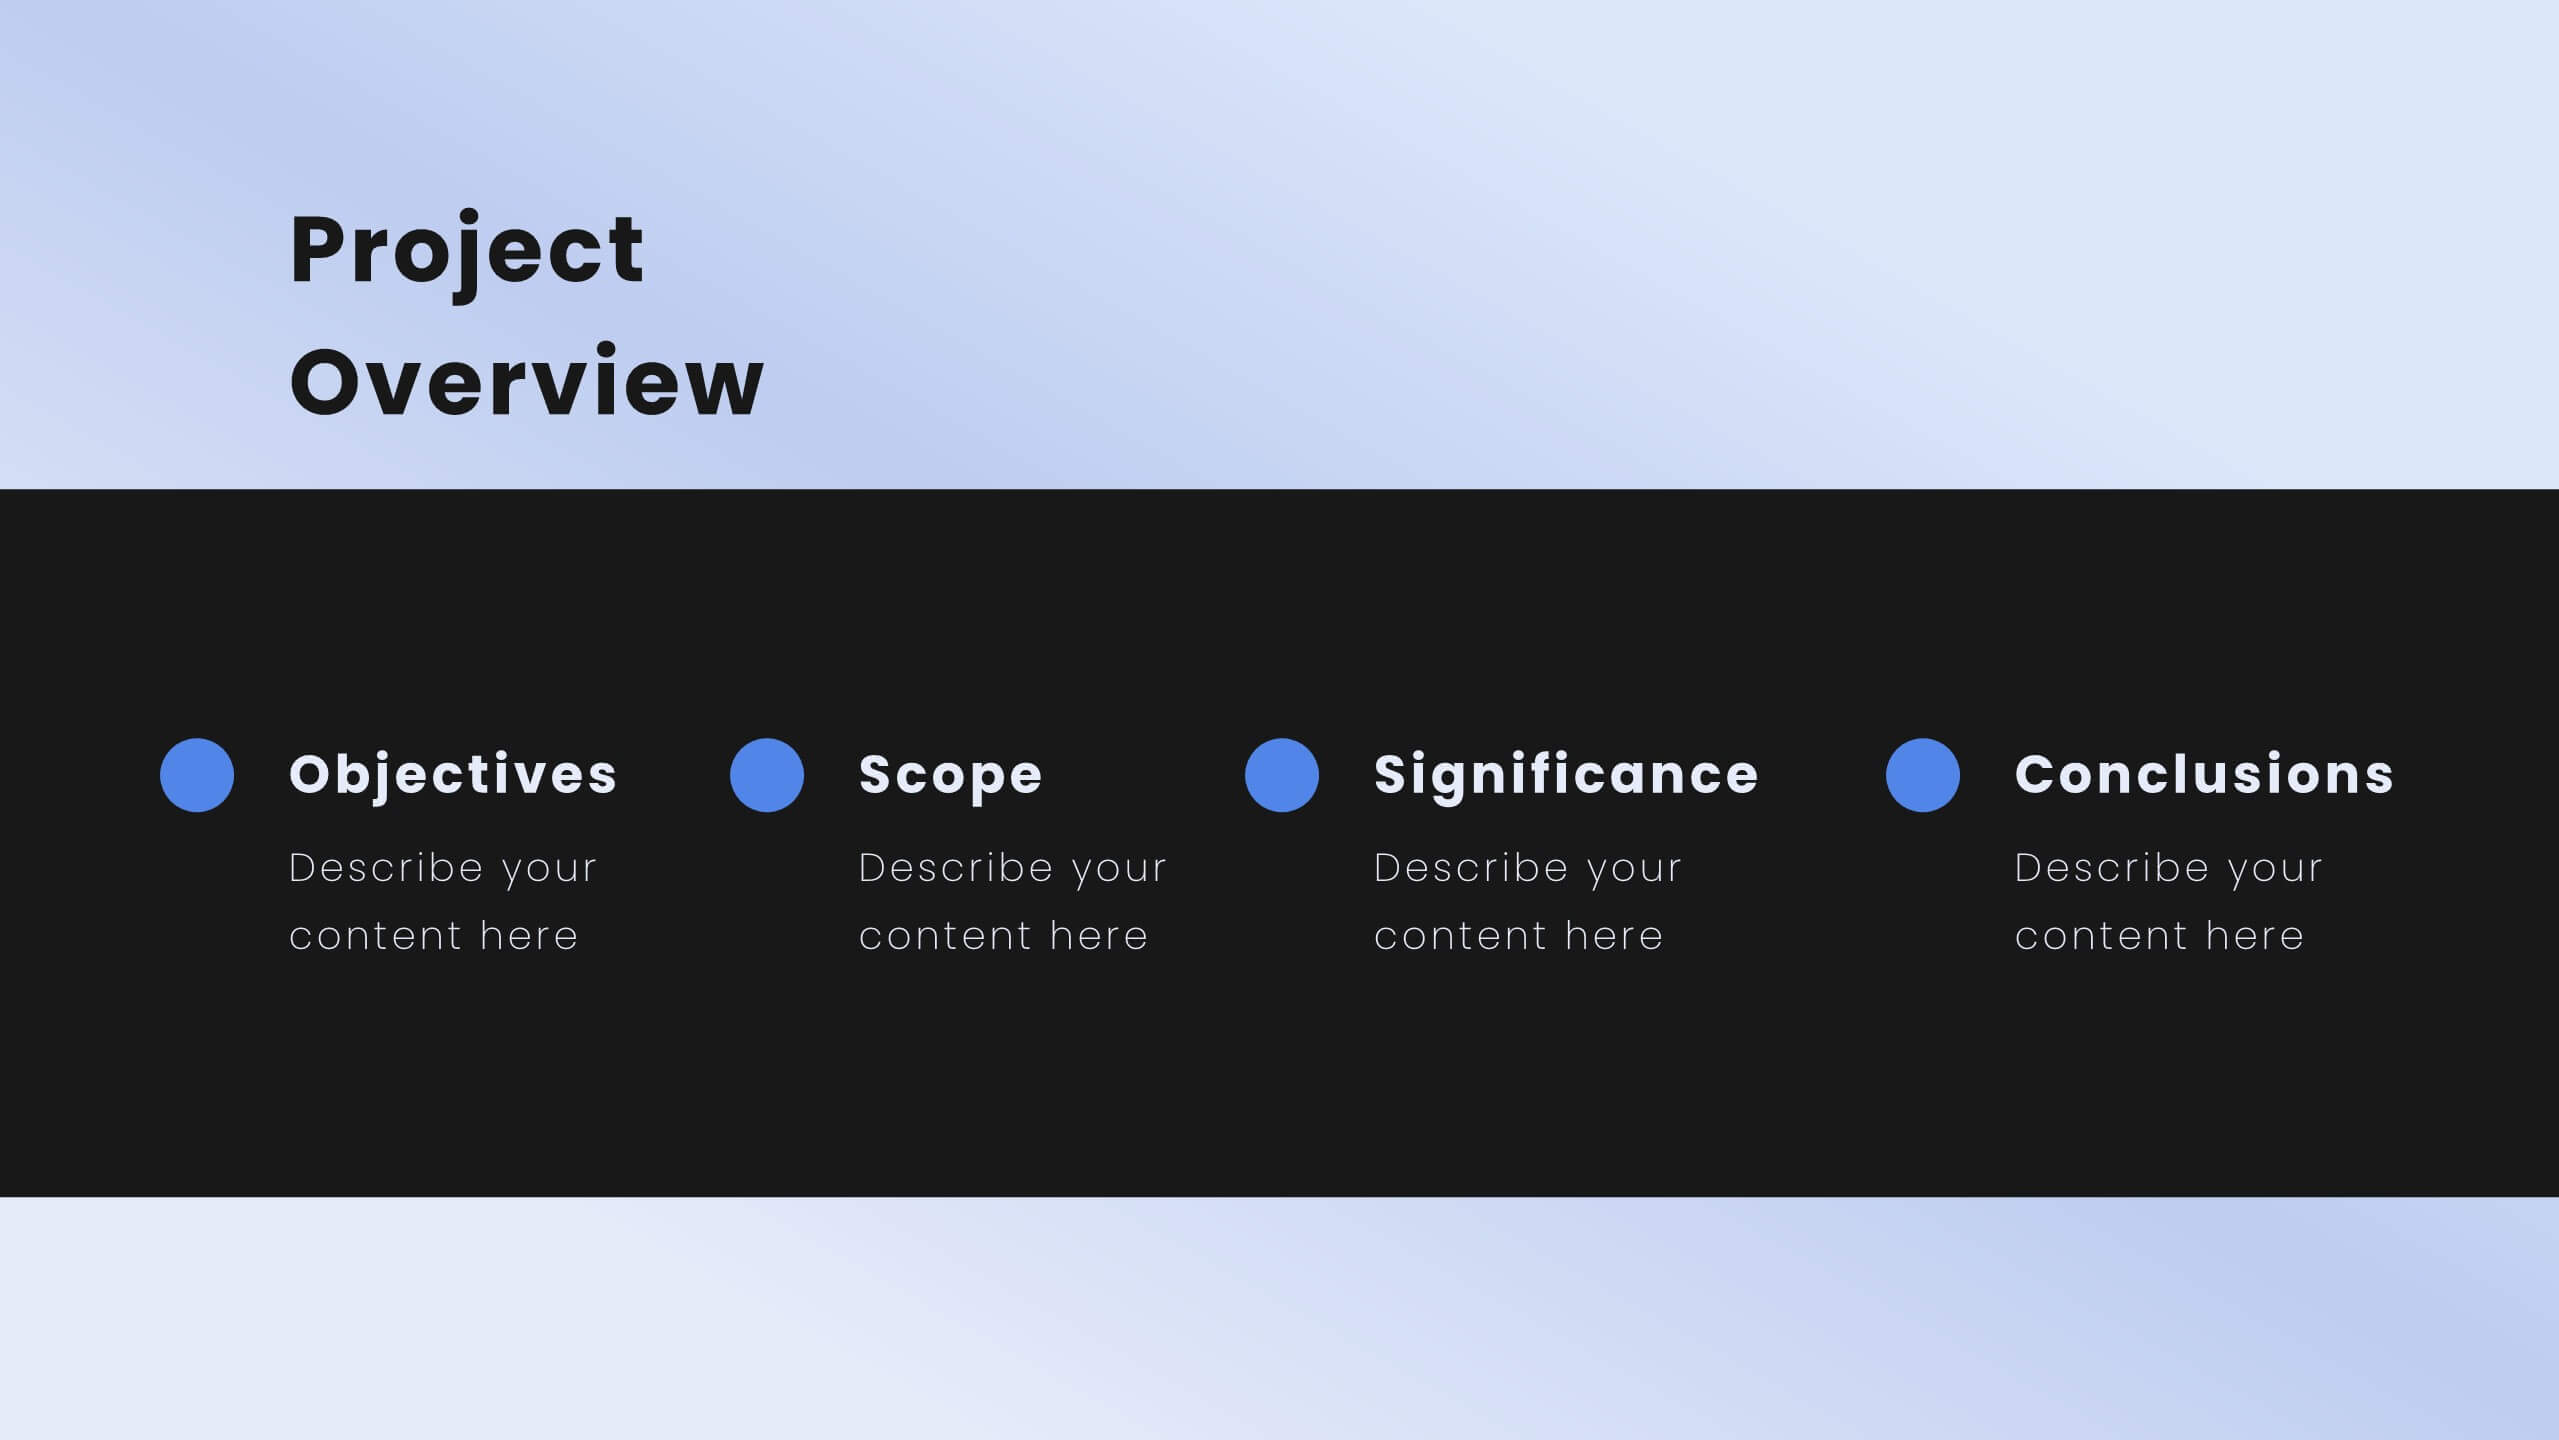
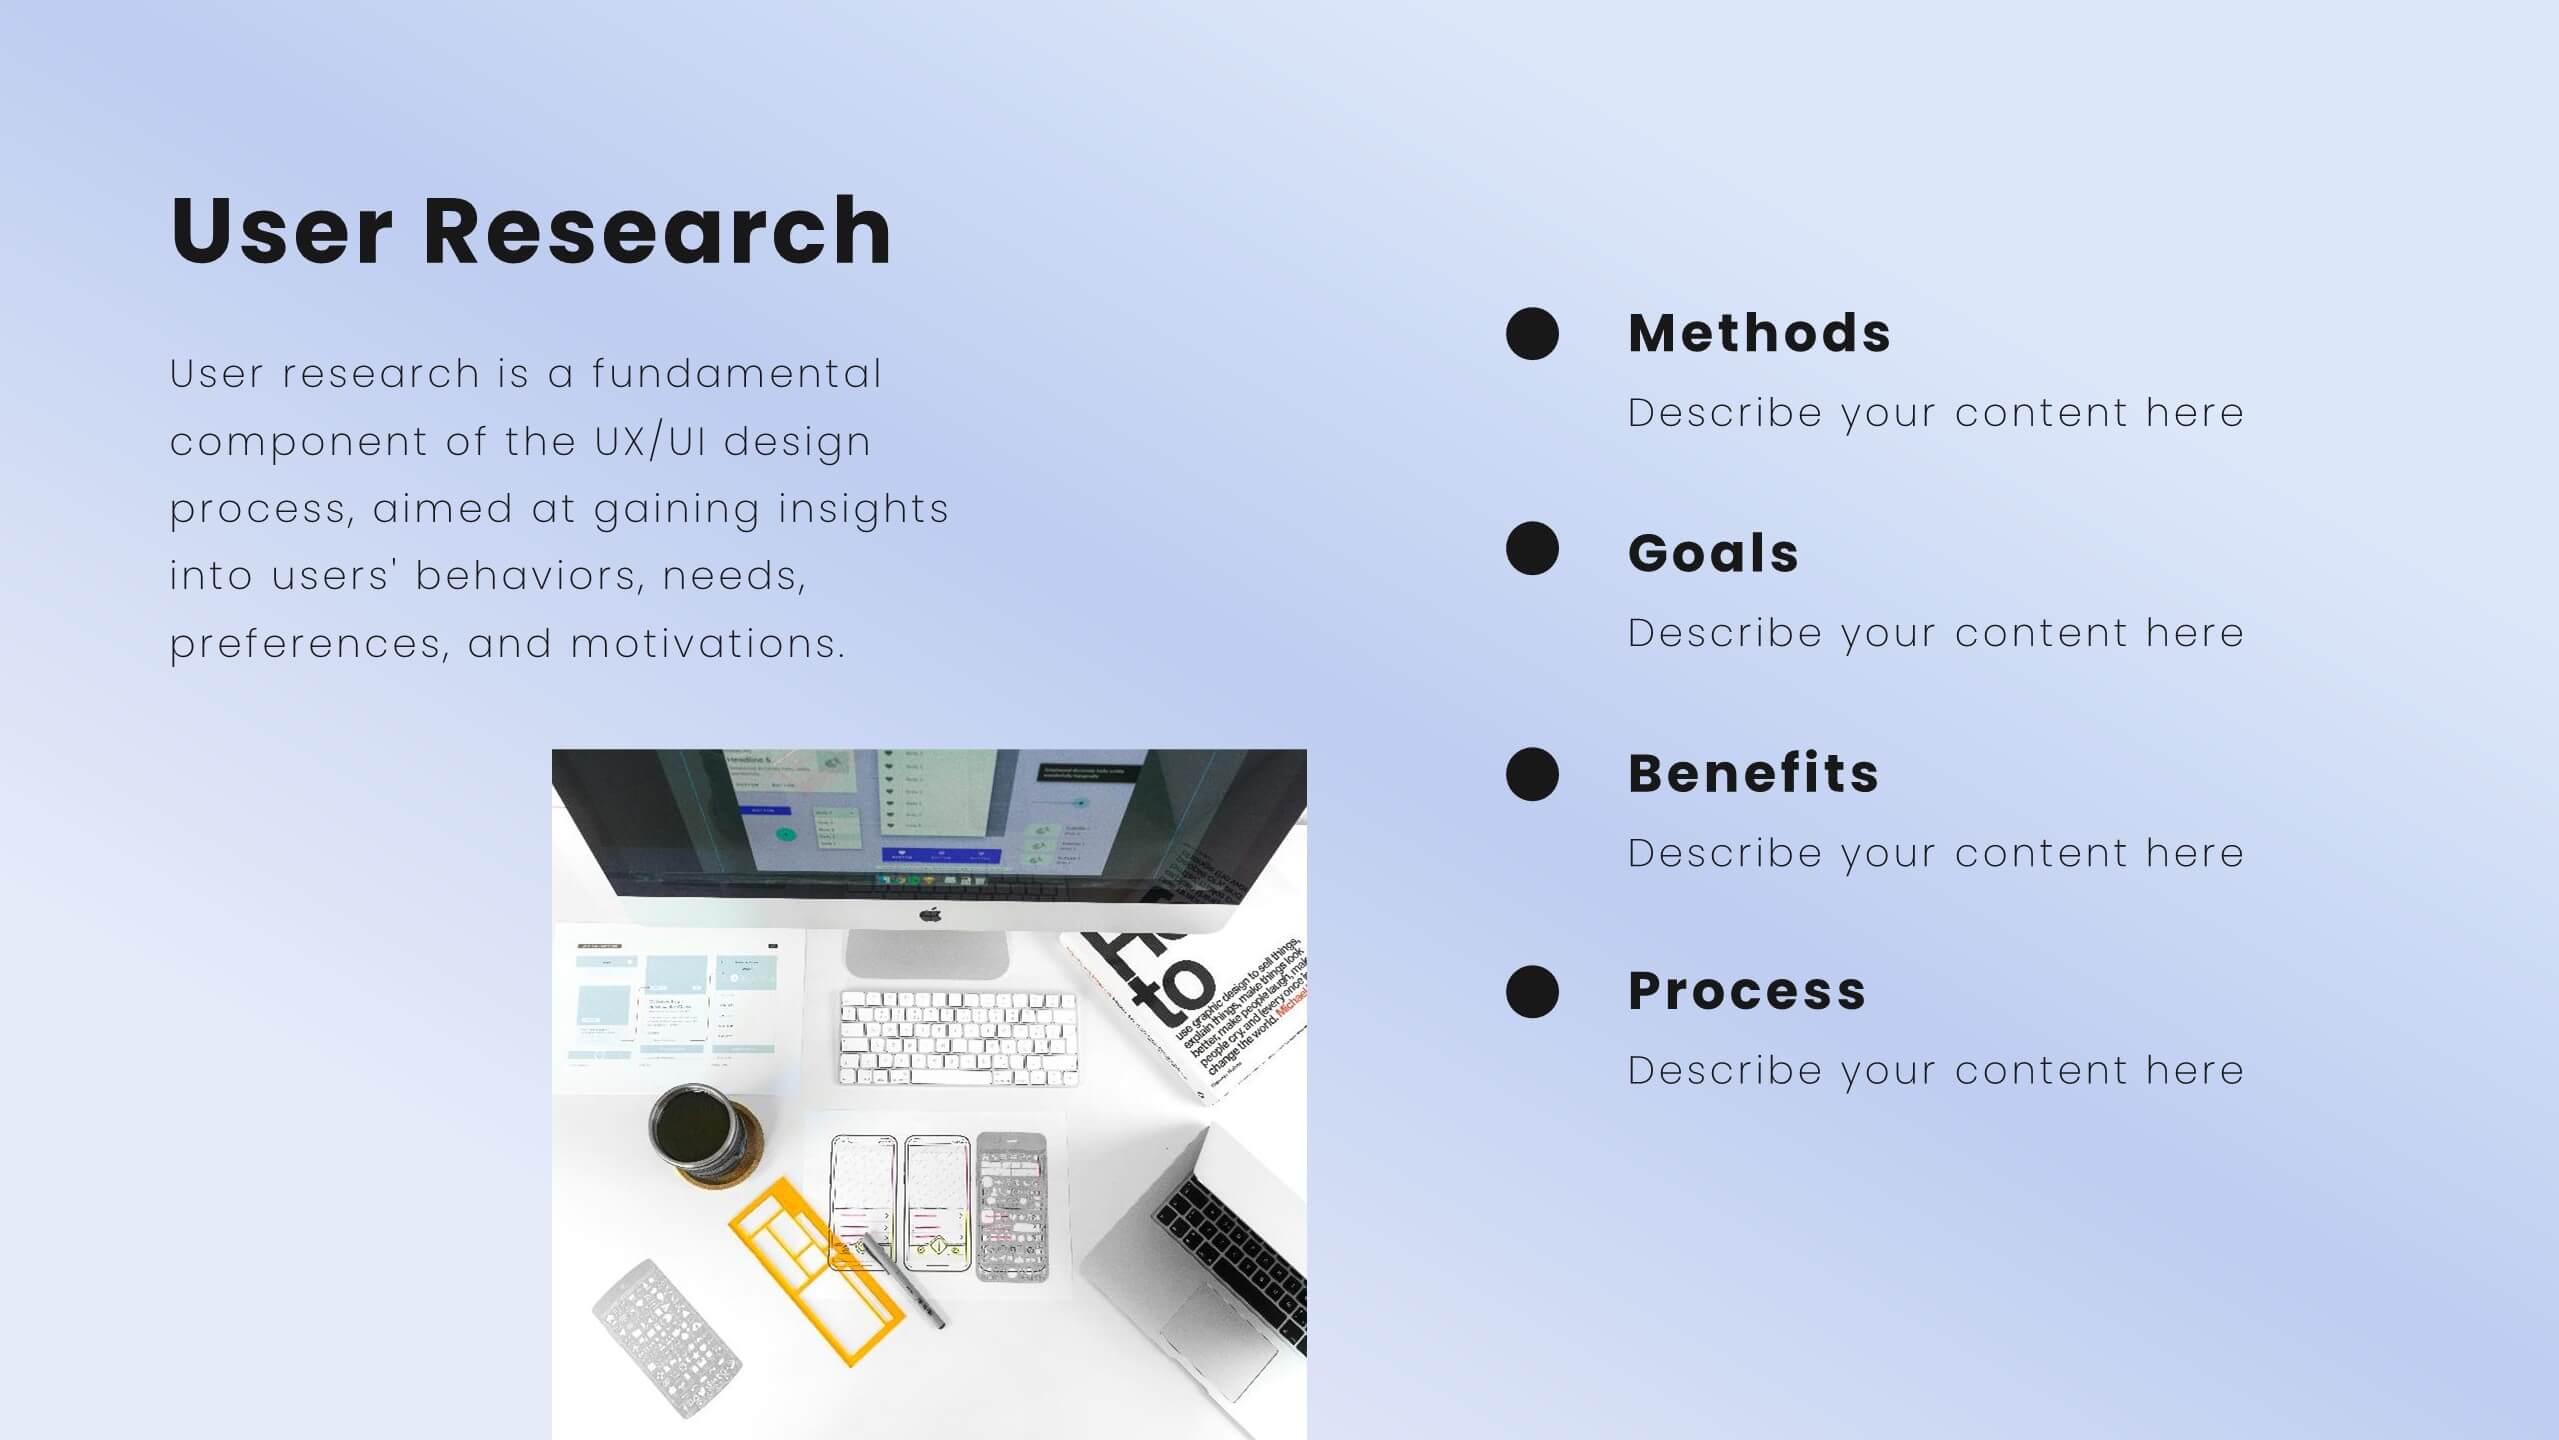
Enhance user experience with this comprehensive UX proposal template! Perfect for outlining user research, personas, and design principles. Ideal for UX/UI designers aiming to present their strategies and solutions. Compatible with PowerPoint, Keynote, and Google Slides, this template ensures your UX proposals are clear, professional, and impactful. Create exceptional user experiences today!


5 diapositivas
Editable Data Charts Presentation
Bring your data to life with a clean, engaging layout that makes every insight easy to understand. This presentation helps you explain percentages, comparisons, and key metrics with clarity while keeping your narrative smooth and professional. Designed for clear data storytelling and effortless editing, it's fully compatible with PowerPoint, Keynote, and Google Slides.


5 diapositivas
Messaging Strategy and Flow Presentation
Communicate with clarity using this streamlined messaging strategy and flow presentation template. Designed to visualize the stages of message planning—from audience segmentation to final delivery—this layout helps teams align communication goals and channels. Ideal for marketing, PR, or internal comms presentations. Fully compatible with PowerPoint, Keynote, and Google Slides.


10 diapositivas
Effective Team Communication Presentation
Streamline your Effective Team Communication with this modern infographic template. Designed to enhance collaboration and workflow clarity, this slide helps visualize key communication strategies for better team efficiency. Fully customizable in PowerPoint, Keynote, and Google Slides, making it perfect for corporate training, leadership meetings, and project planning.


5 diapositivas
Wedding Itinerary Infographics
A Wedding Itinerary is a detailed schedule or timeline that outlines the events and activities planned for a wedding day. These infographic templates aim to assist couples in creating a visually appealing and informative itinerary for their wedding events. These infographics are perfect for preparing a presentation for guests, sharing details with the wedding party, or showcasing wedding planning services, this template will help you create a memorable and well-organized wedding experience. This is compatible with PowerPoint, Keynote, and Google Slides making it easily editable to personalize the template with your information.


6 diapositivas
Matrix Diagram
A matrix diagram, also known as a matrix chart, is a visual tool used to analyze and organize complex information by displaying it in a matrix format. This infographic template provides a visual framework for analyzing complex information, and improving understanding of relationships between different elements or factors. This template allows users to effectively communicate complex relationships and categorize information using a matrix format. This is perfect to use in a wide range of contexts, including project management, problem-solving, decision-making, strategic planning, and data analysis.


7 diapositivas
Mind Map Process Infographic
A Mind Map Process Infographic is a visual representation that illustrates a process or a series of steps using the structure and principles of a mind map. This template diagram is a dynamic visual guide to help individuals and teams harness the true potential of mind mapping. This is used to visually organize information in a hierarchical and interconnected manner, often starting with a central concept or theme and branching out into related ideas or subtopics. Mind maps are the ultimate tool for brainstorming, planning, and innovating, and this template is your gateway to unlocking their full potential.


3 diapositivas
Event Agenda Layout Presentation
Bring structure and clarity to any event with a clean, modern layout that highlights key sessions, speakers, and timing at a glance. This presentation helps audiences follow the flow effortlessly while keeping information visually balanced. Perfect for workshops, conferences, and meetings. Fully compatible with PowerPoint, Keynote, and Google Slides.


24 diapositivas
Kepler Investor Pitch Presentation
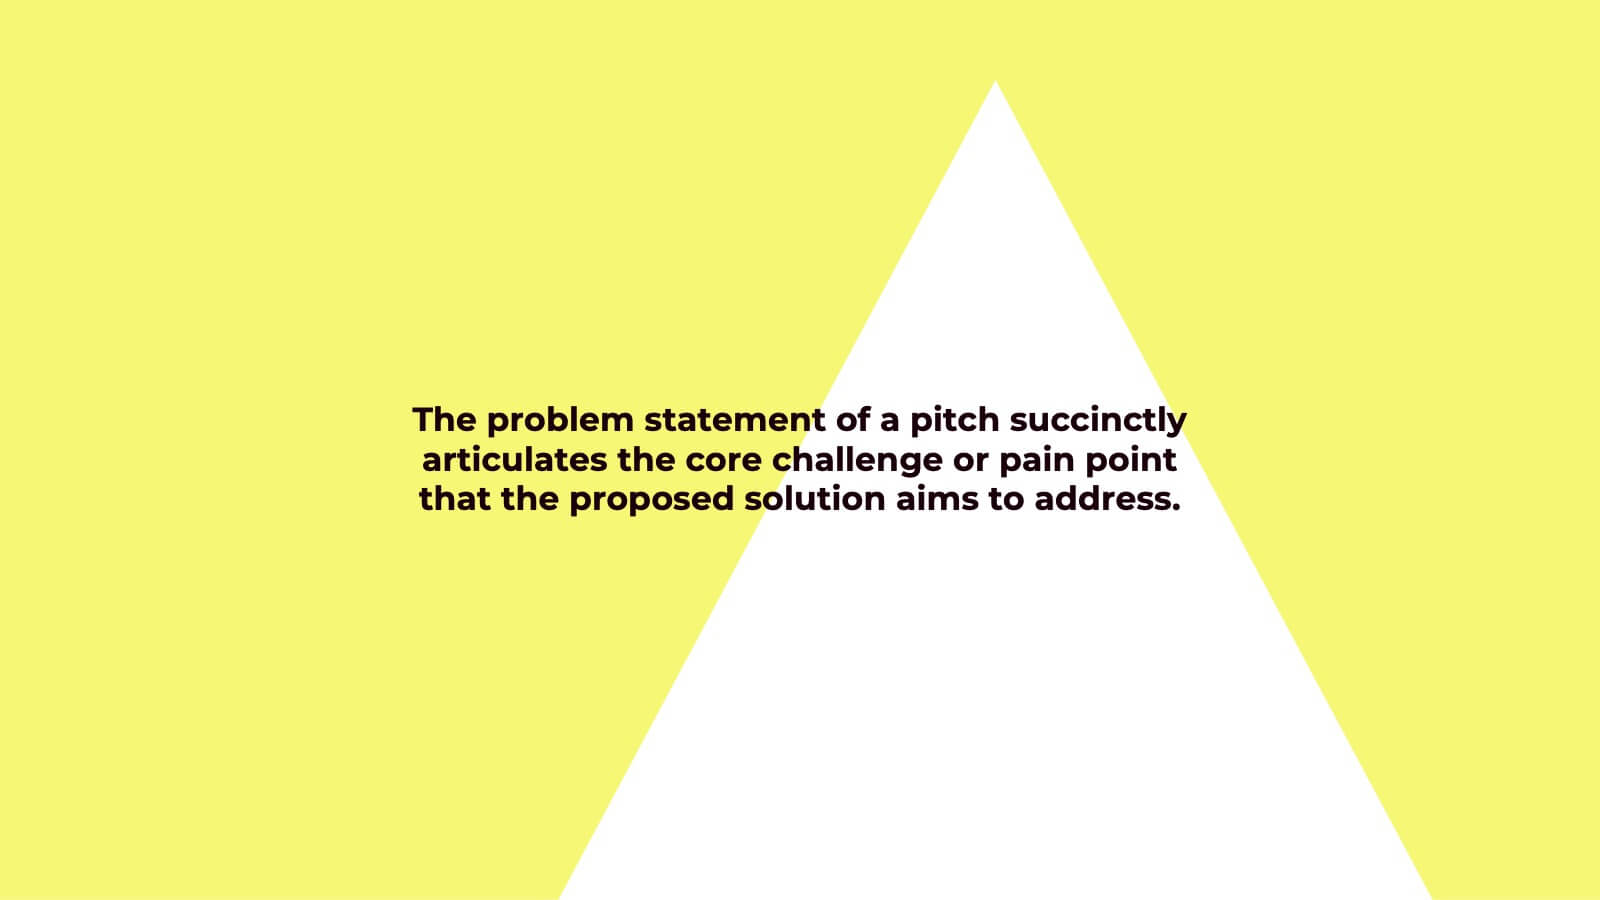
Impress potential investors with this thoughtfully crafted investor pitch presentation template. Its sleek design is tailored to captivate attention while delivering a clear and concise narrative about your business. Highlight key sections, including your company overview, problem statement, and innovative solutions, all designed to set you apart from the competition. Dive deep into your market opportunities, target audience, and revenue model, using visually engaging layouts and infographics. Showcase growth projections, financial overviews, and funding requirements with clarity and professionalism. Additionally, present your unique selling proposition, milestones, and risk analysis effectively. With dedicated slides for team introductions and a compelling close, this template is perfect for startups and established businesses alike. Fully customizable and compatible with PowerPoint, Google Slides, and Keynote, it ensures seamless branding and adaptability for any presentation. Engage your audience and secure the investment you need!


21 diapositivas
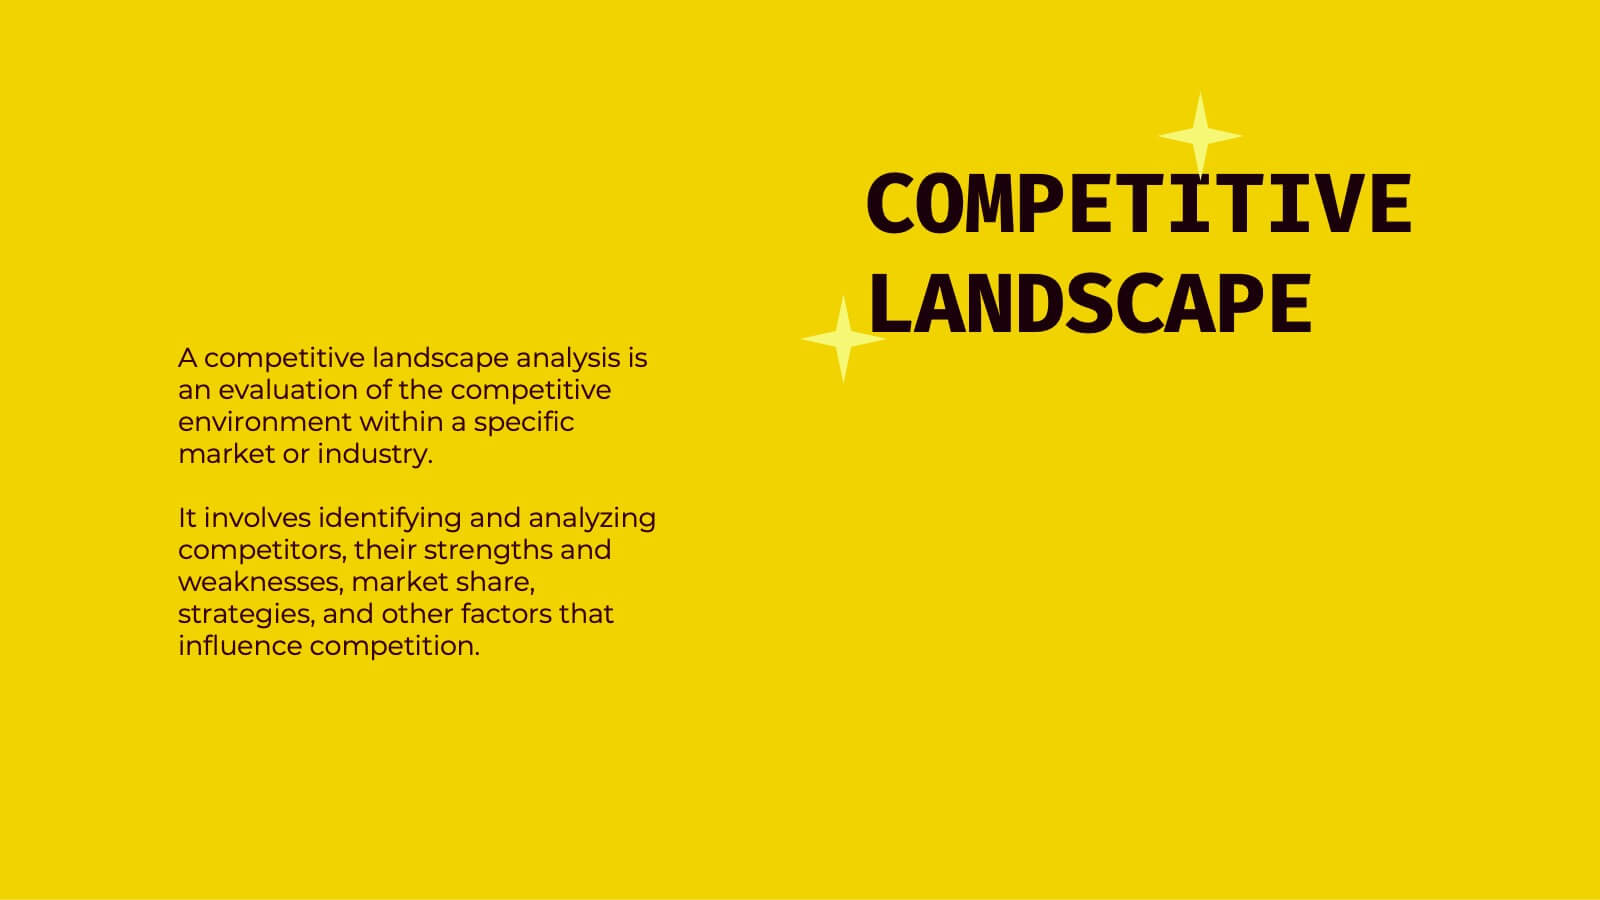
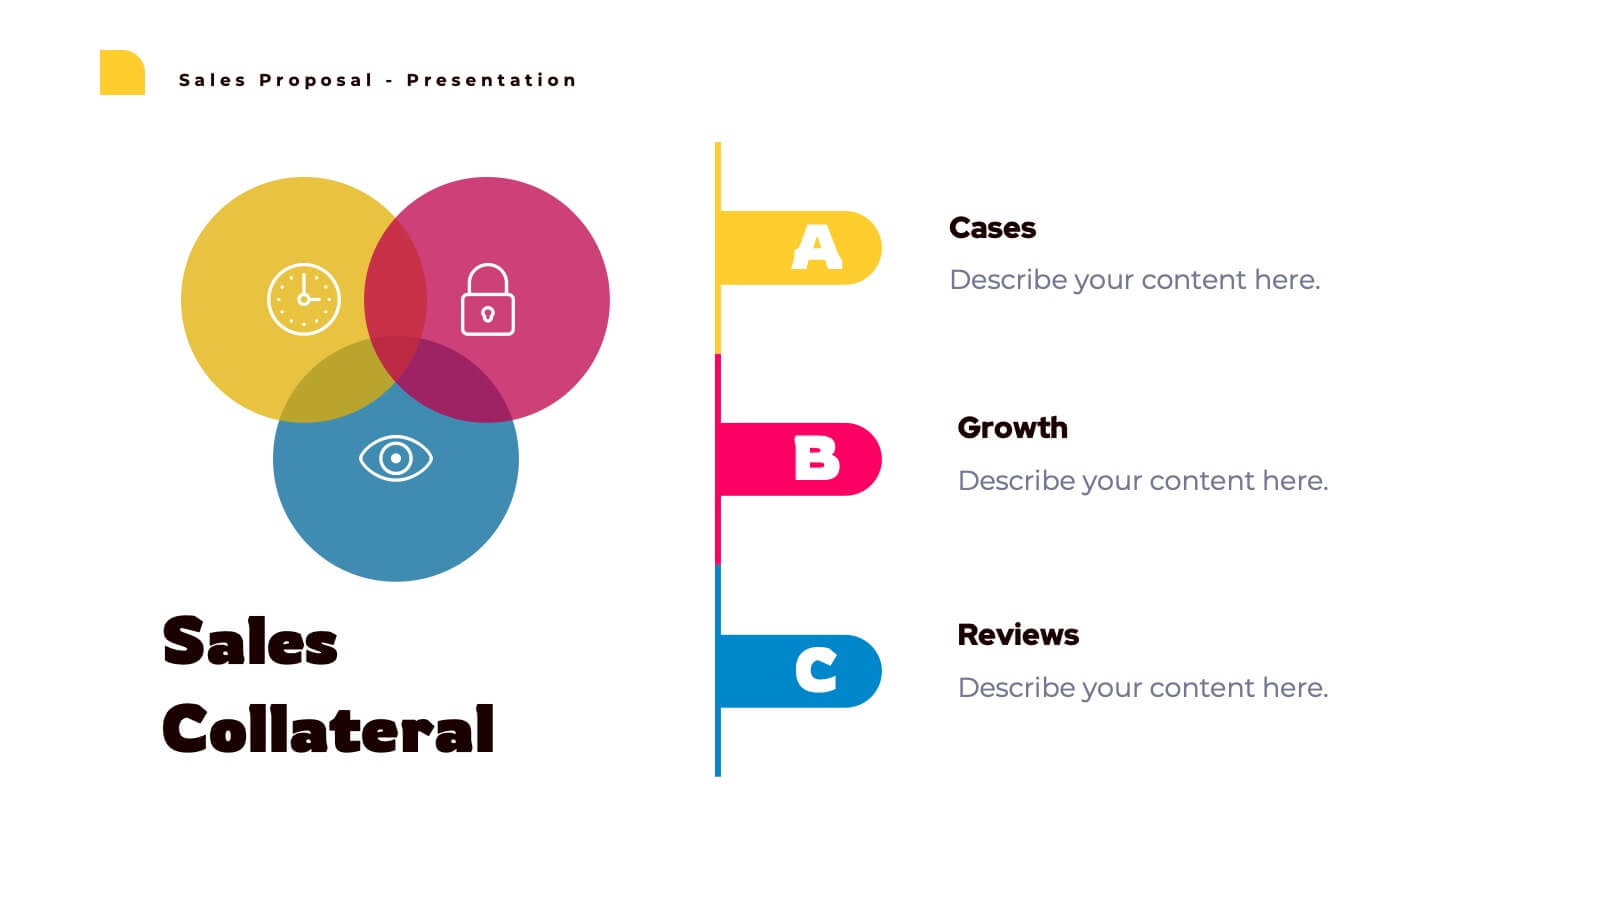
Lunaris Sales Proposal Presentation
An engaging and professional presentation designed to showcase sales proposals effectively. It features slides for objectives, market analysis, pricing strategies, team introductions, and performance metrics. The vibrant design ensures impactful communication with stakeholders. Fully editable and compatible with PowerPoint, Keynote, and Google Slides for seamless customization and presentation delivery.
21 diapositivas
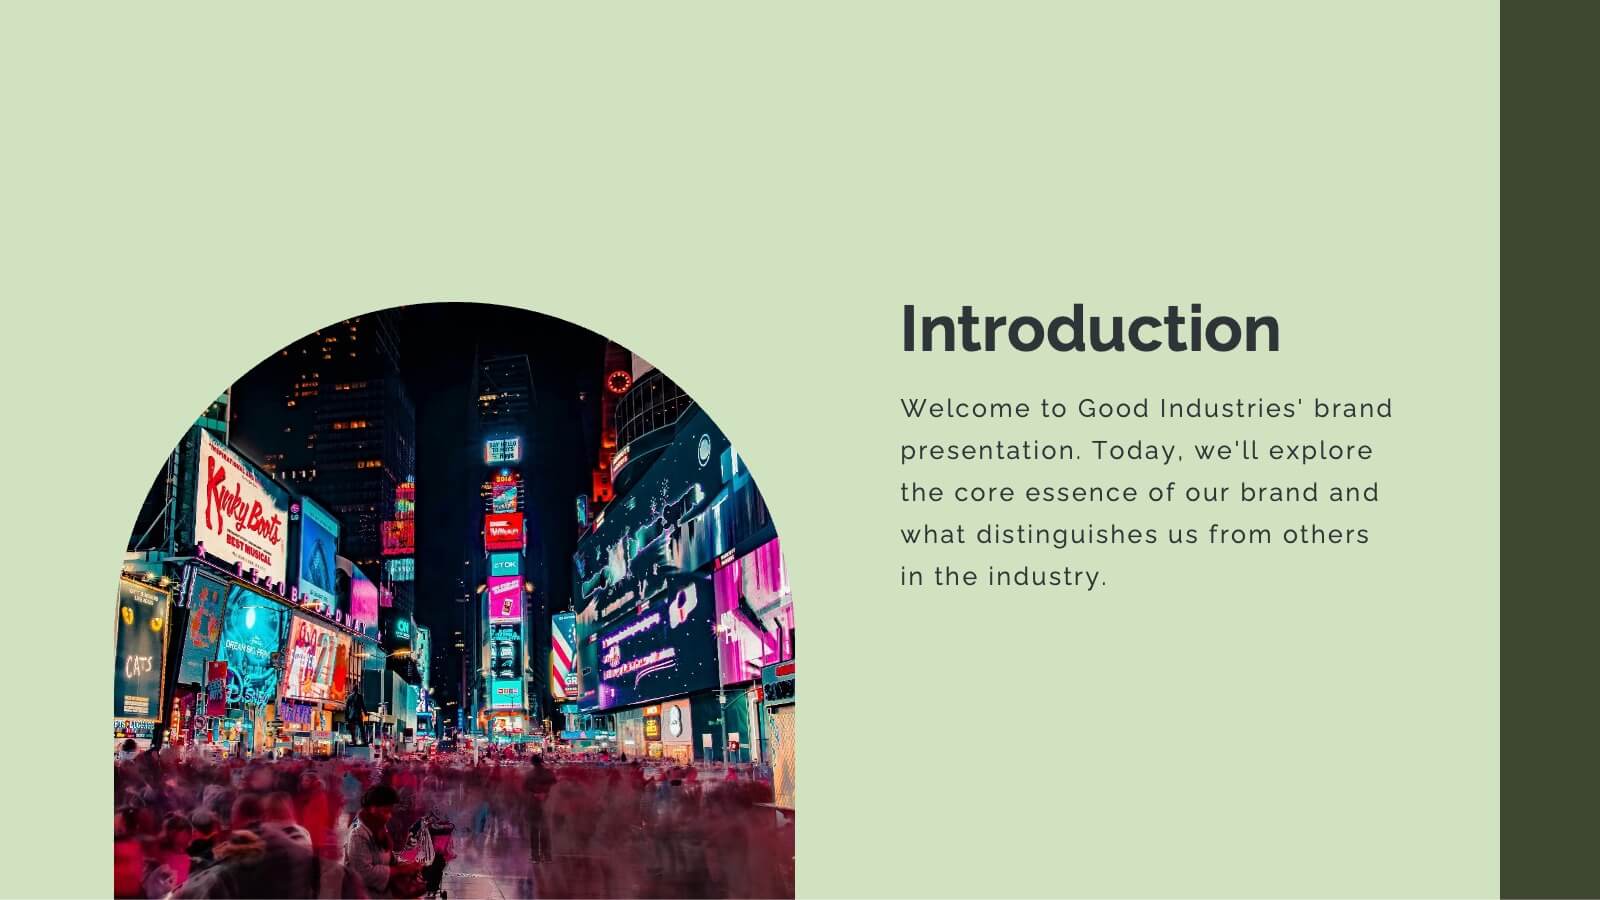
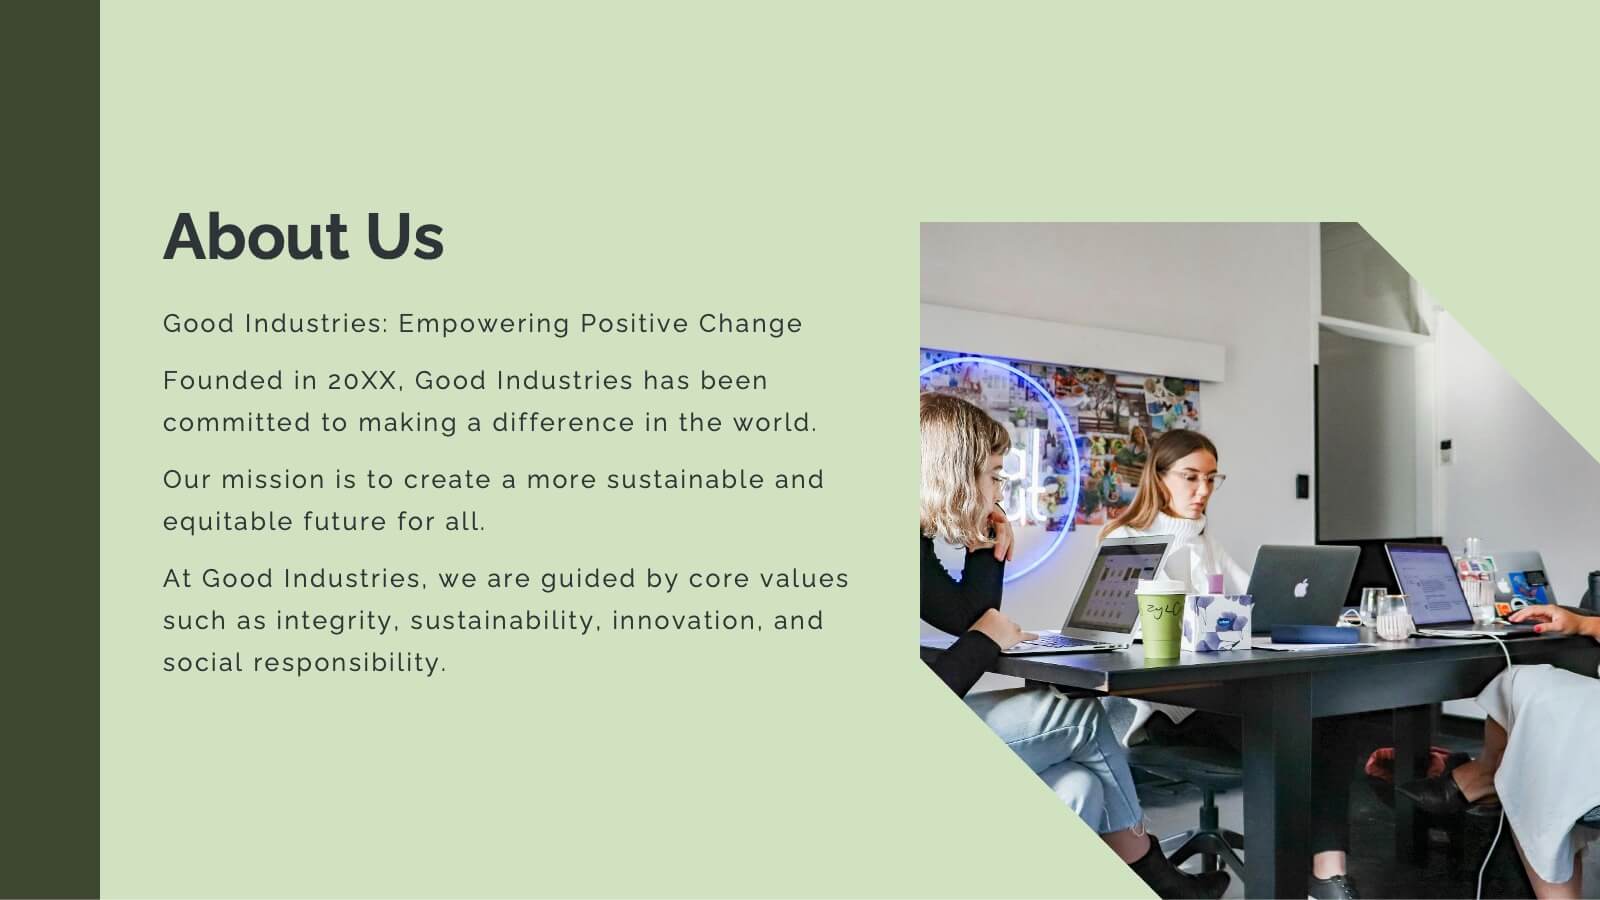
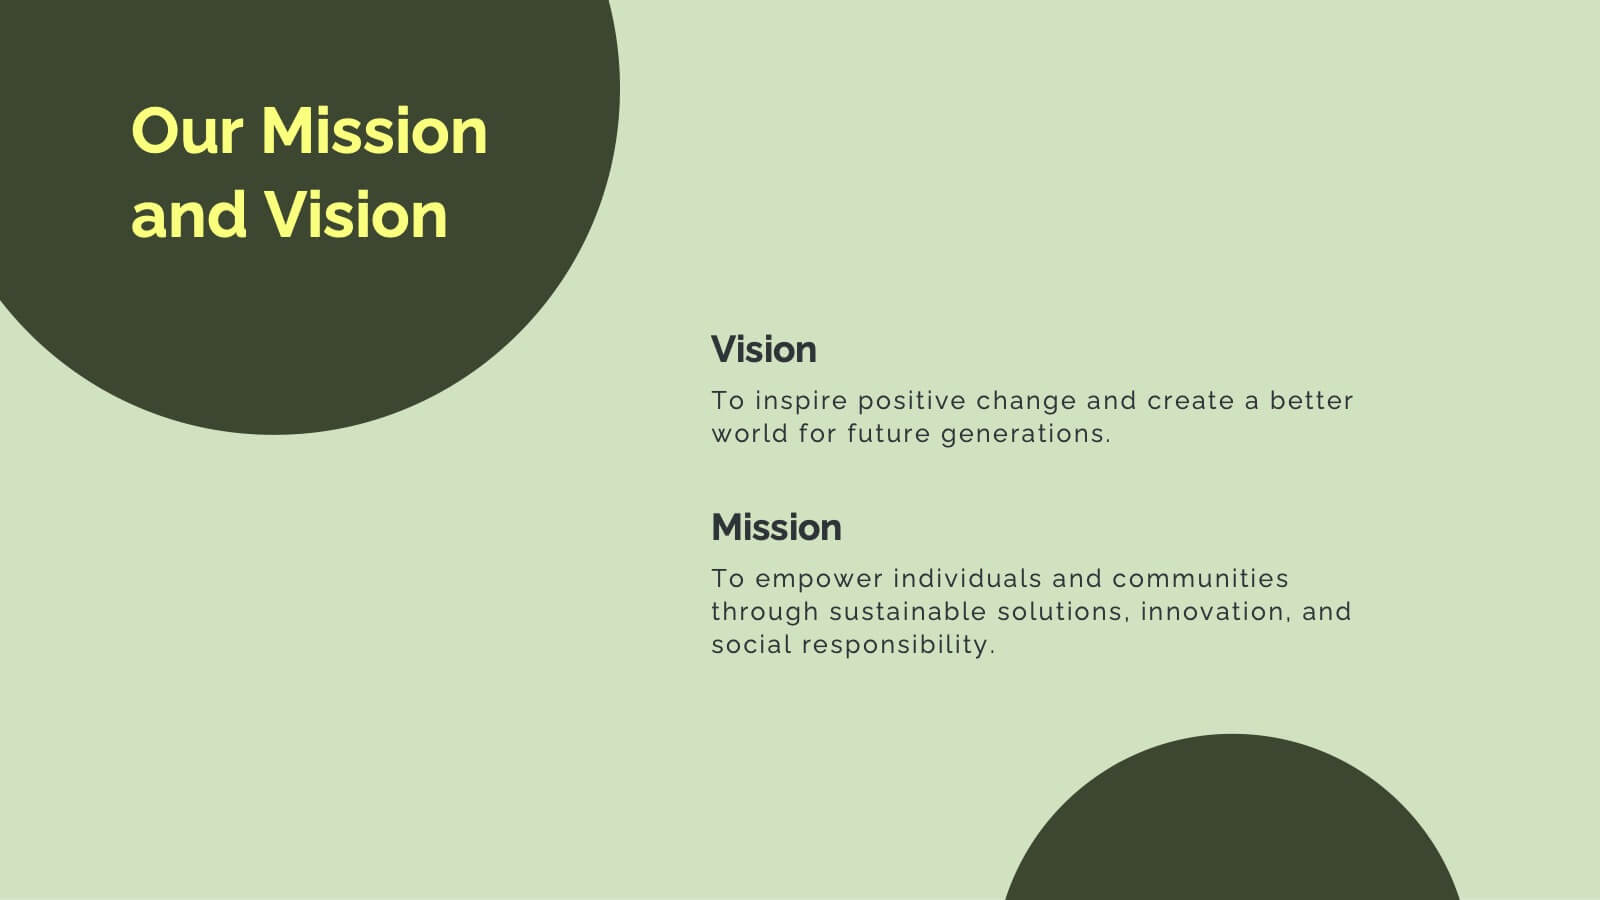
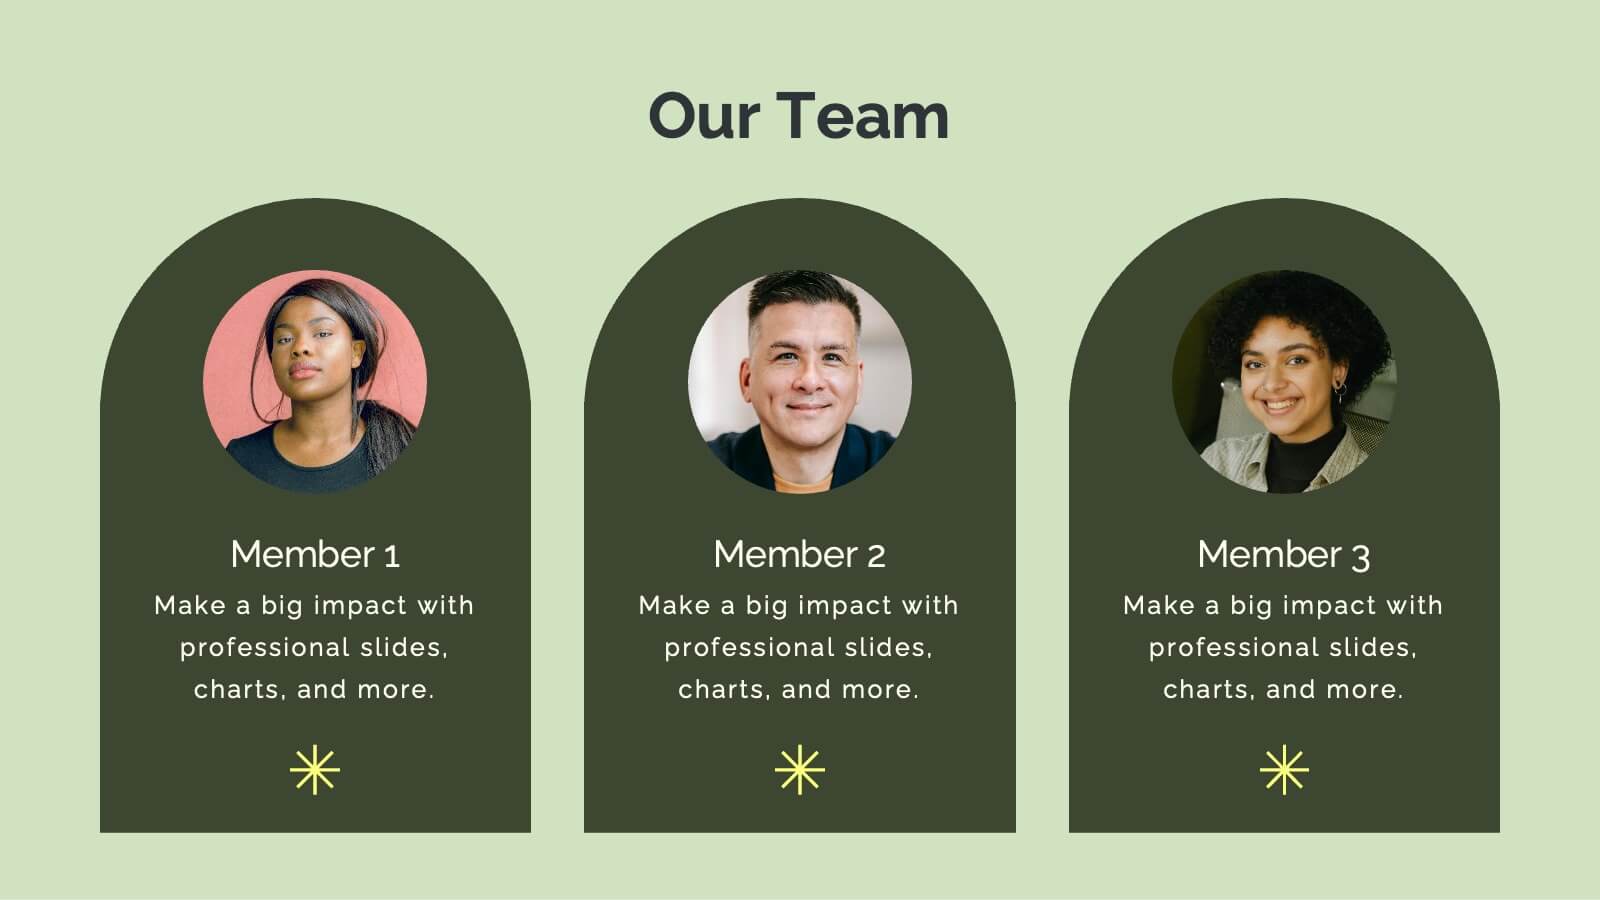
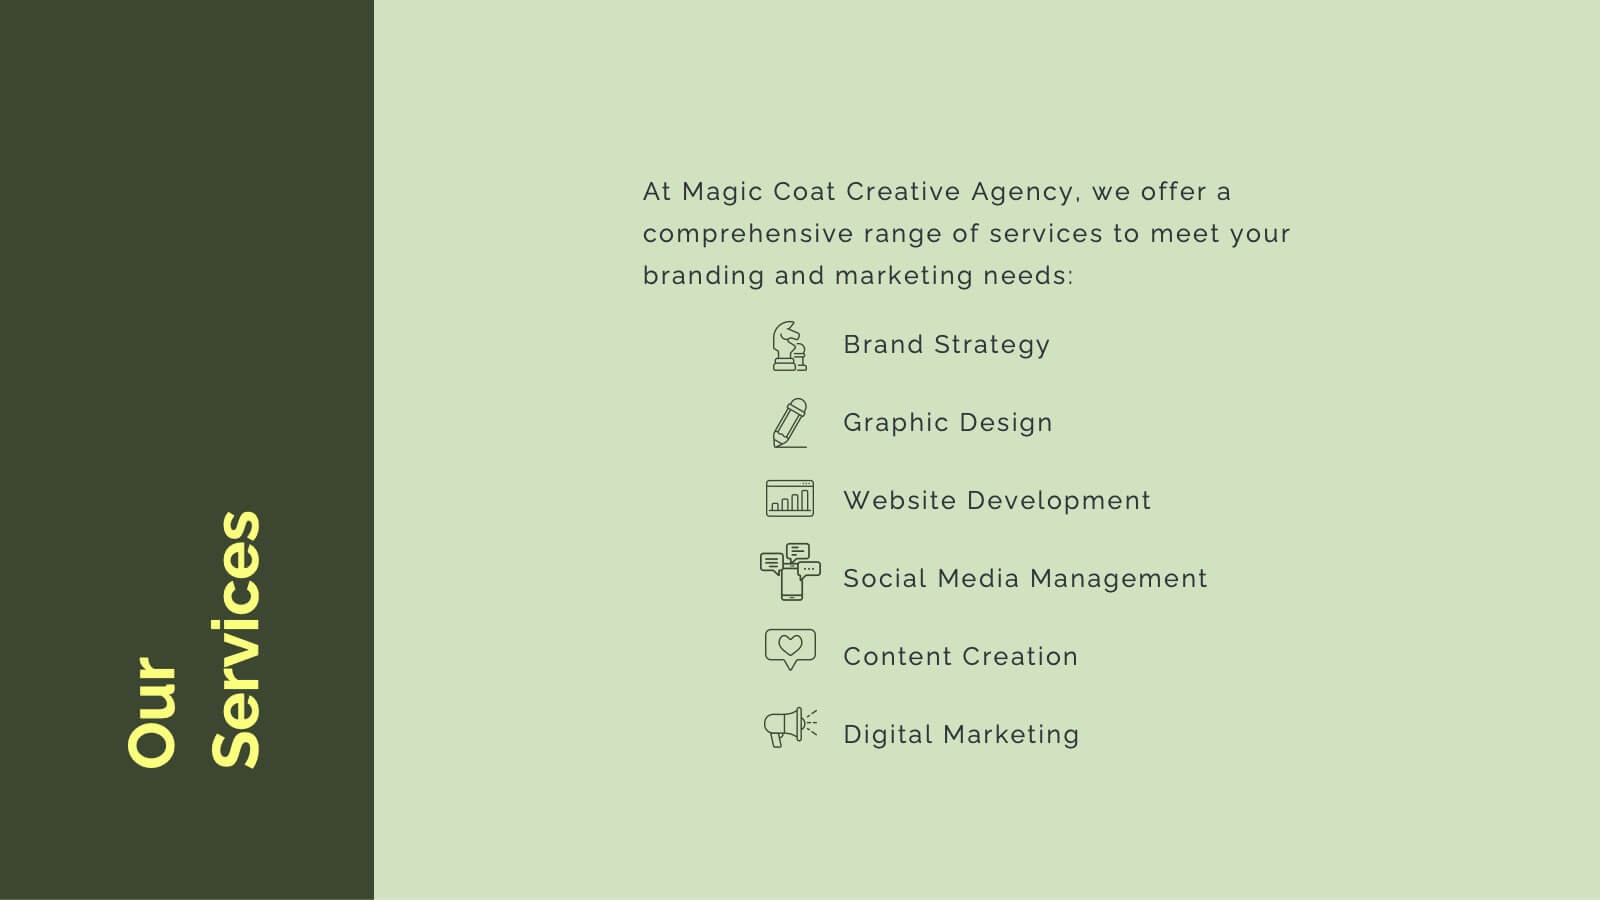
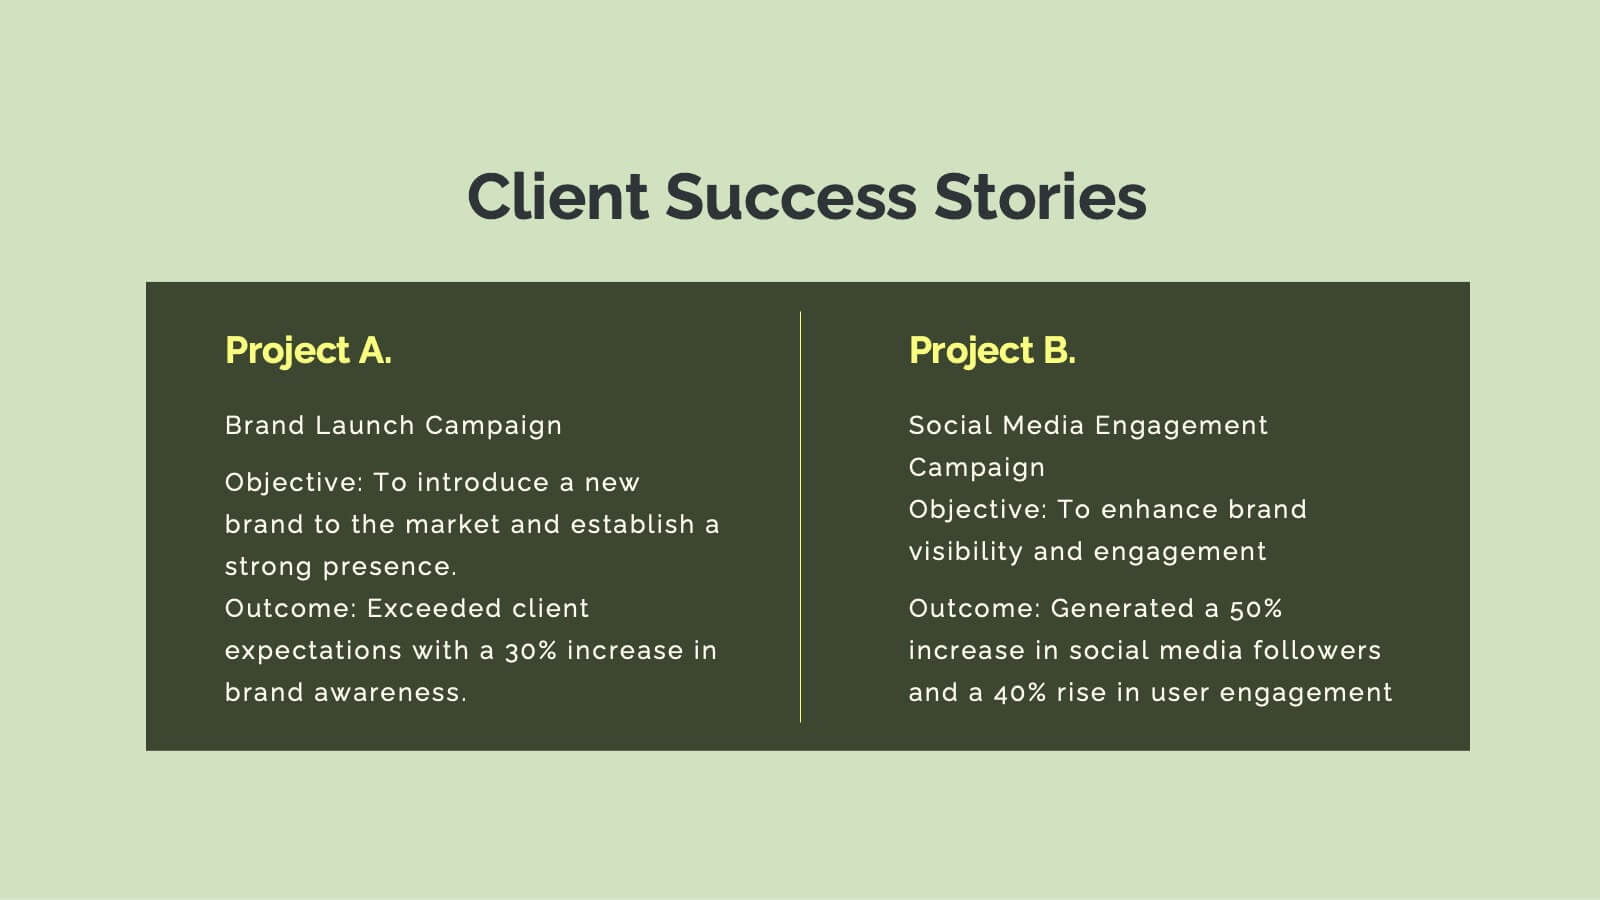
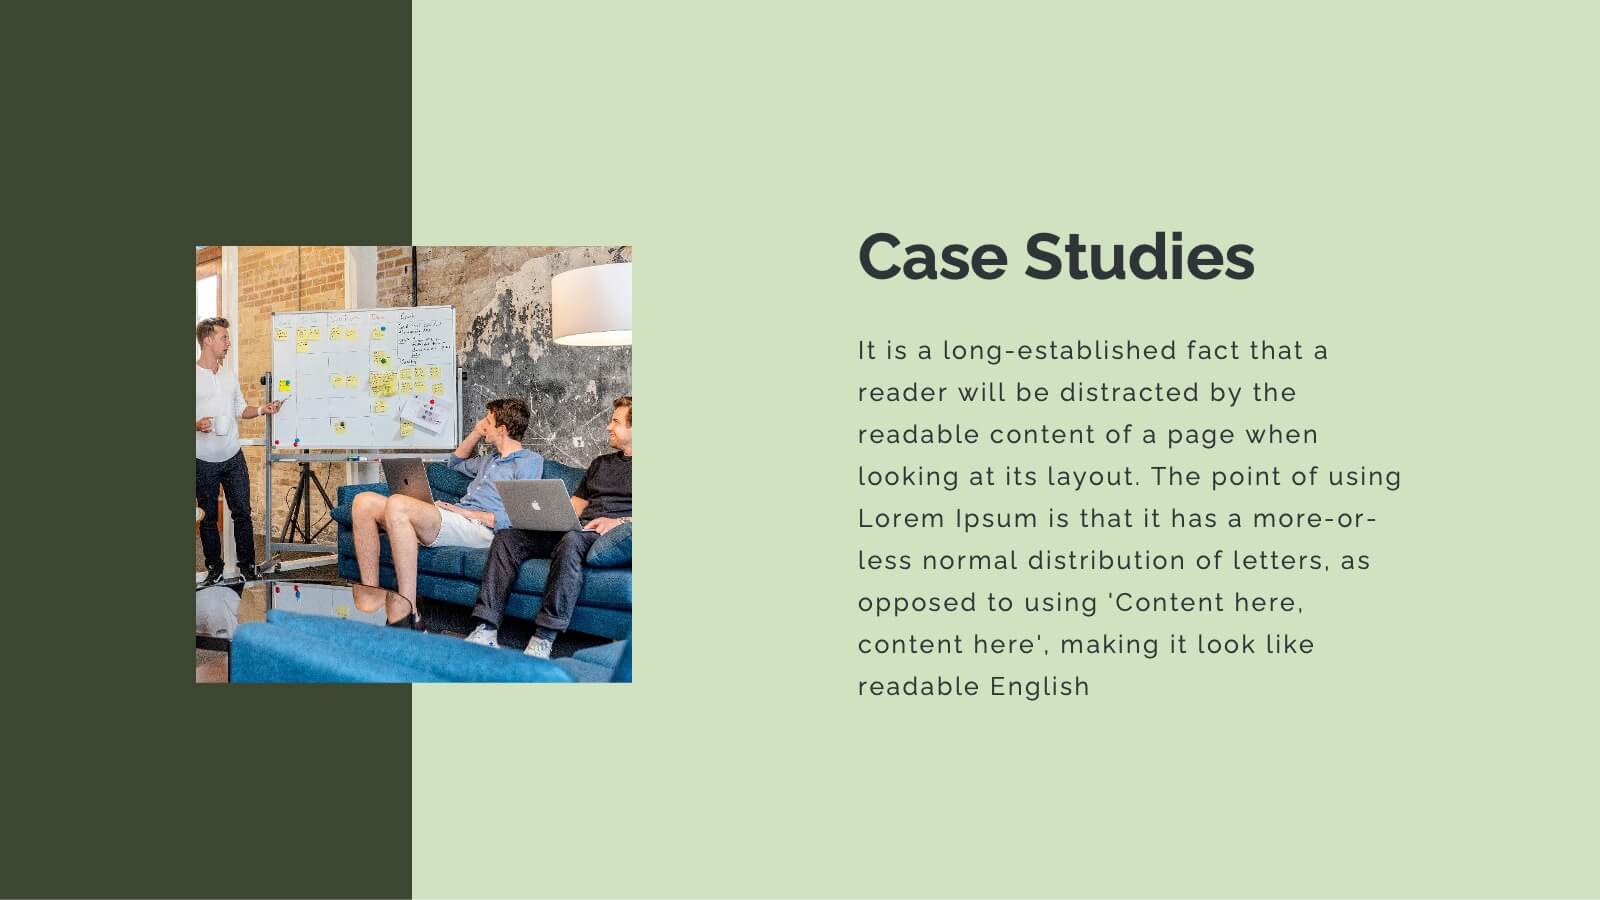
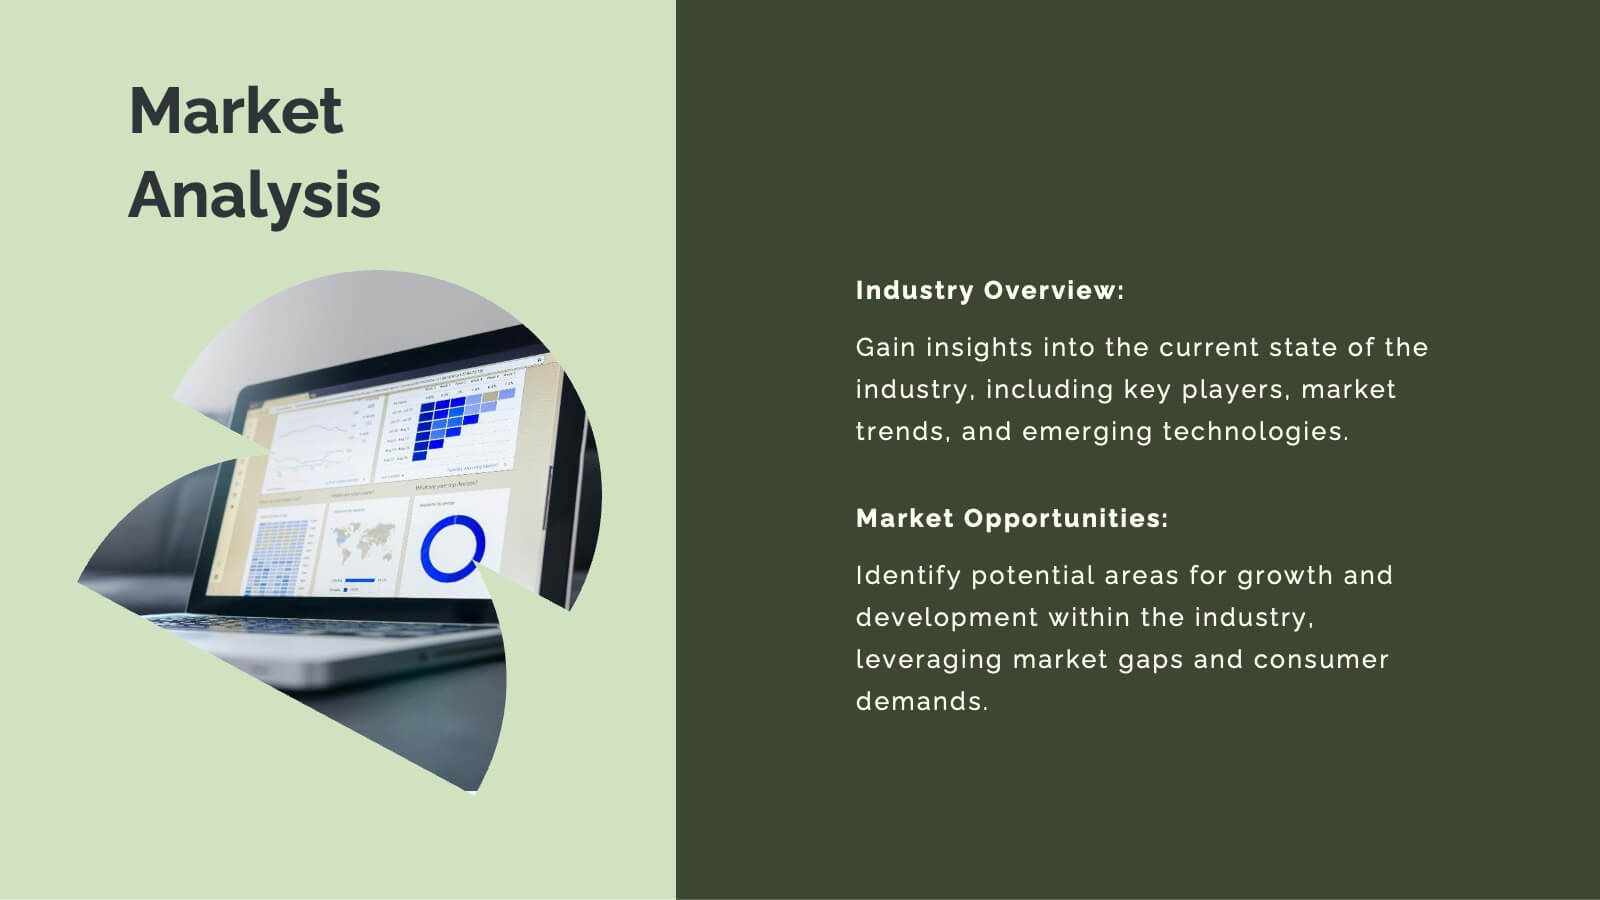
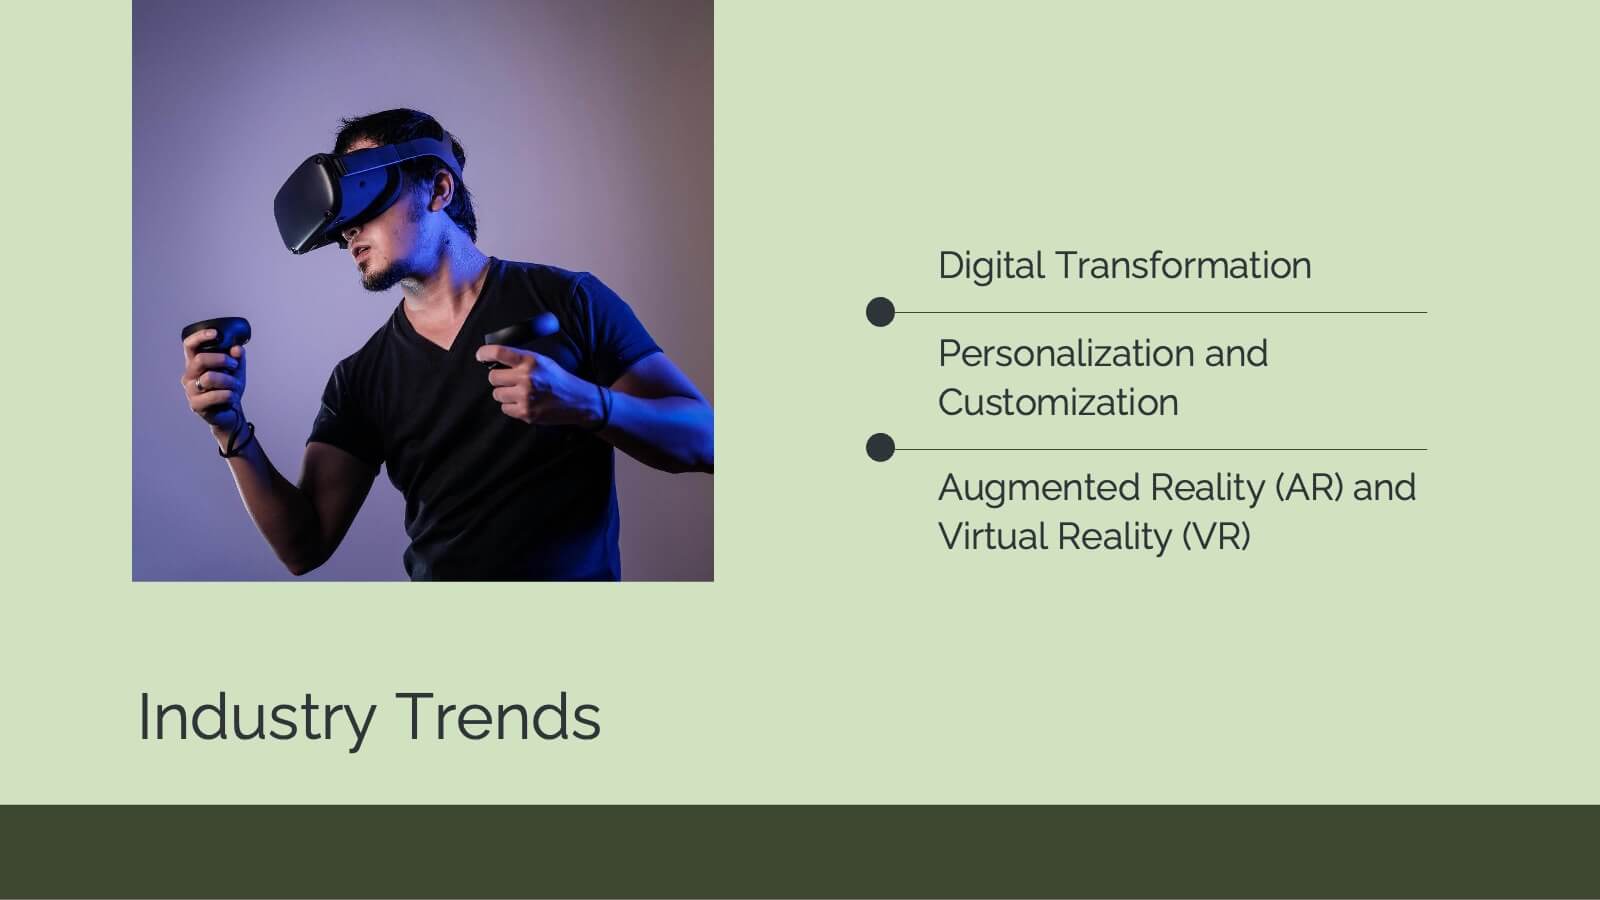
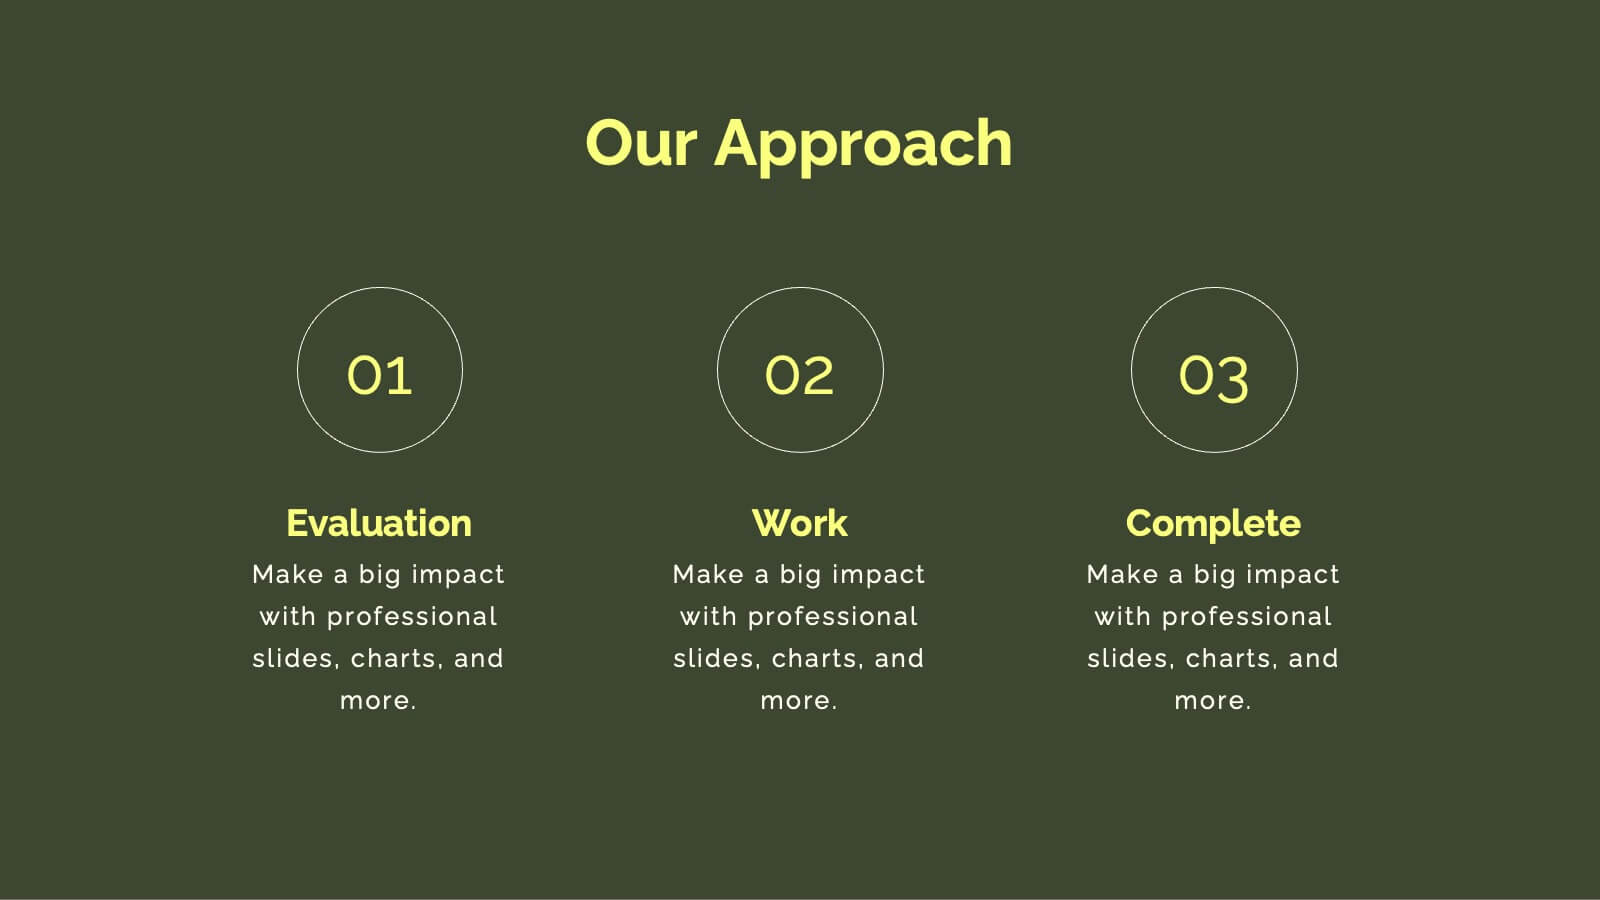
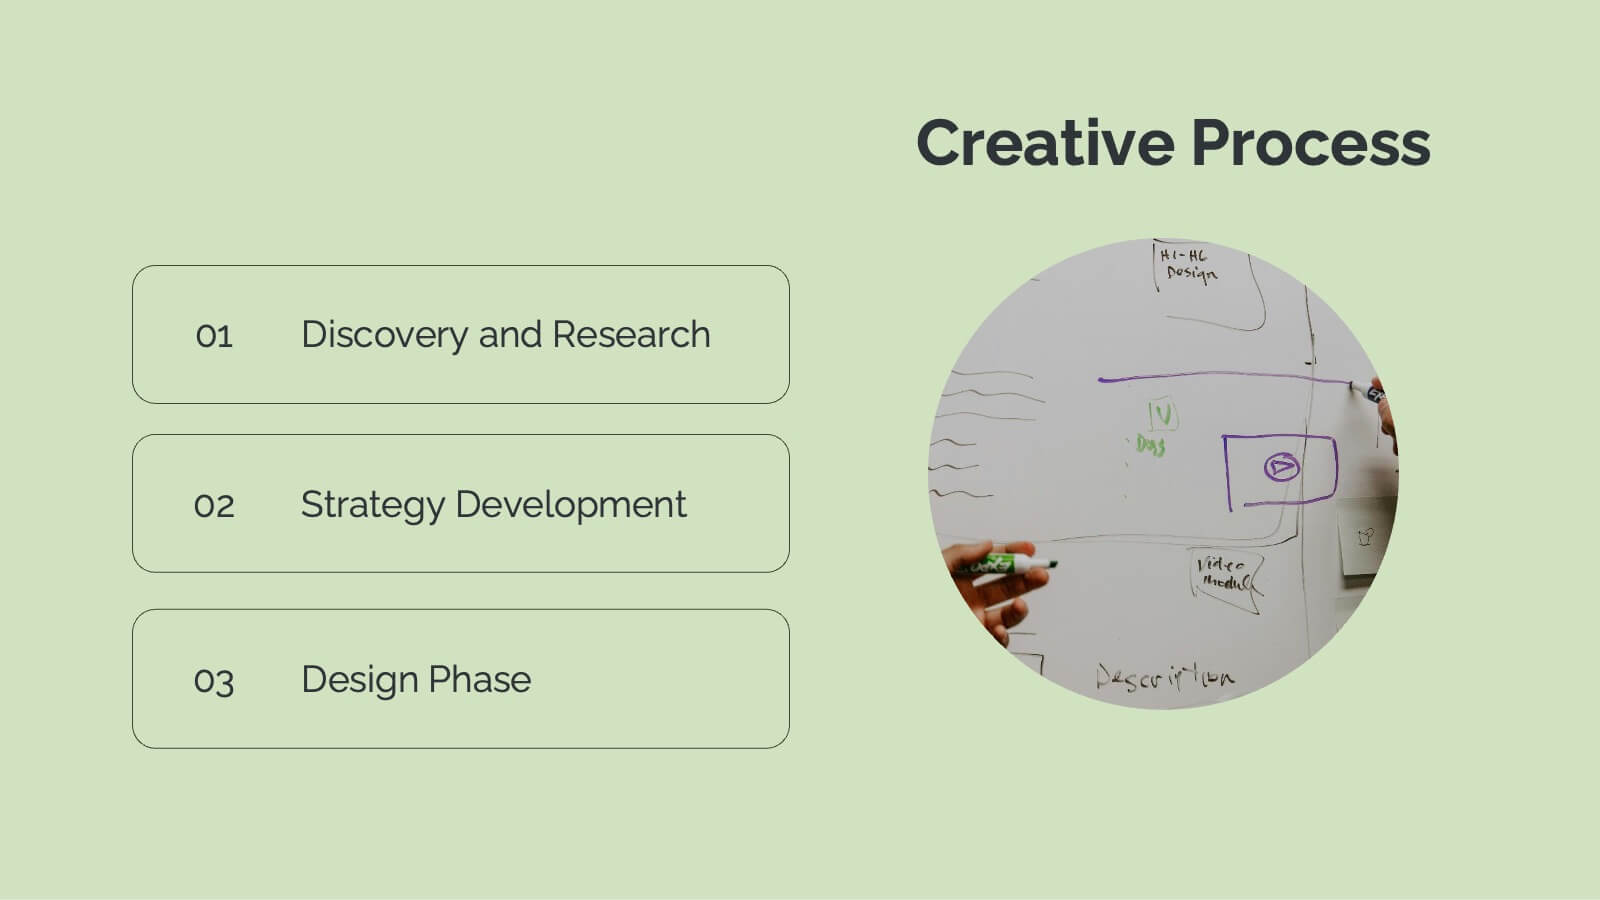
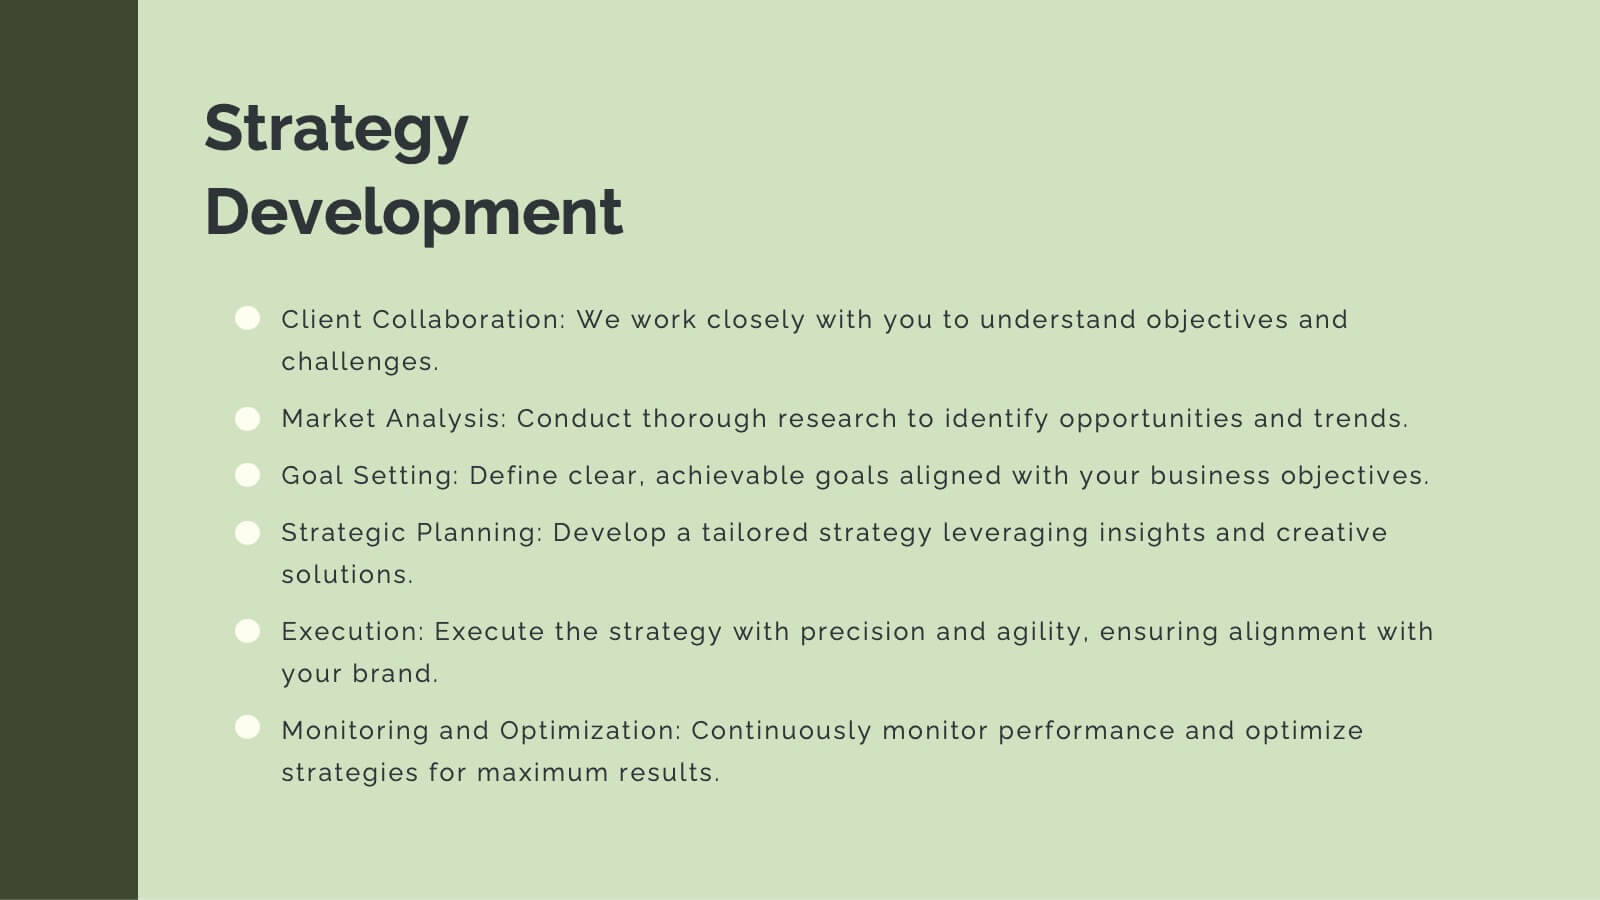
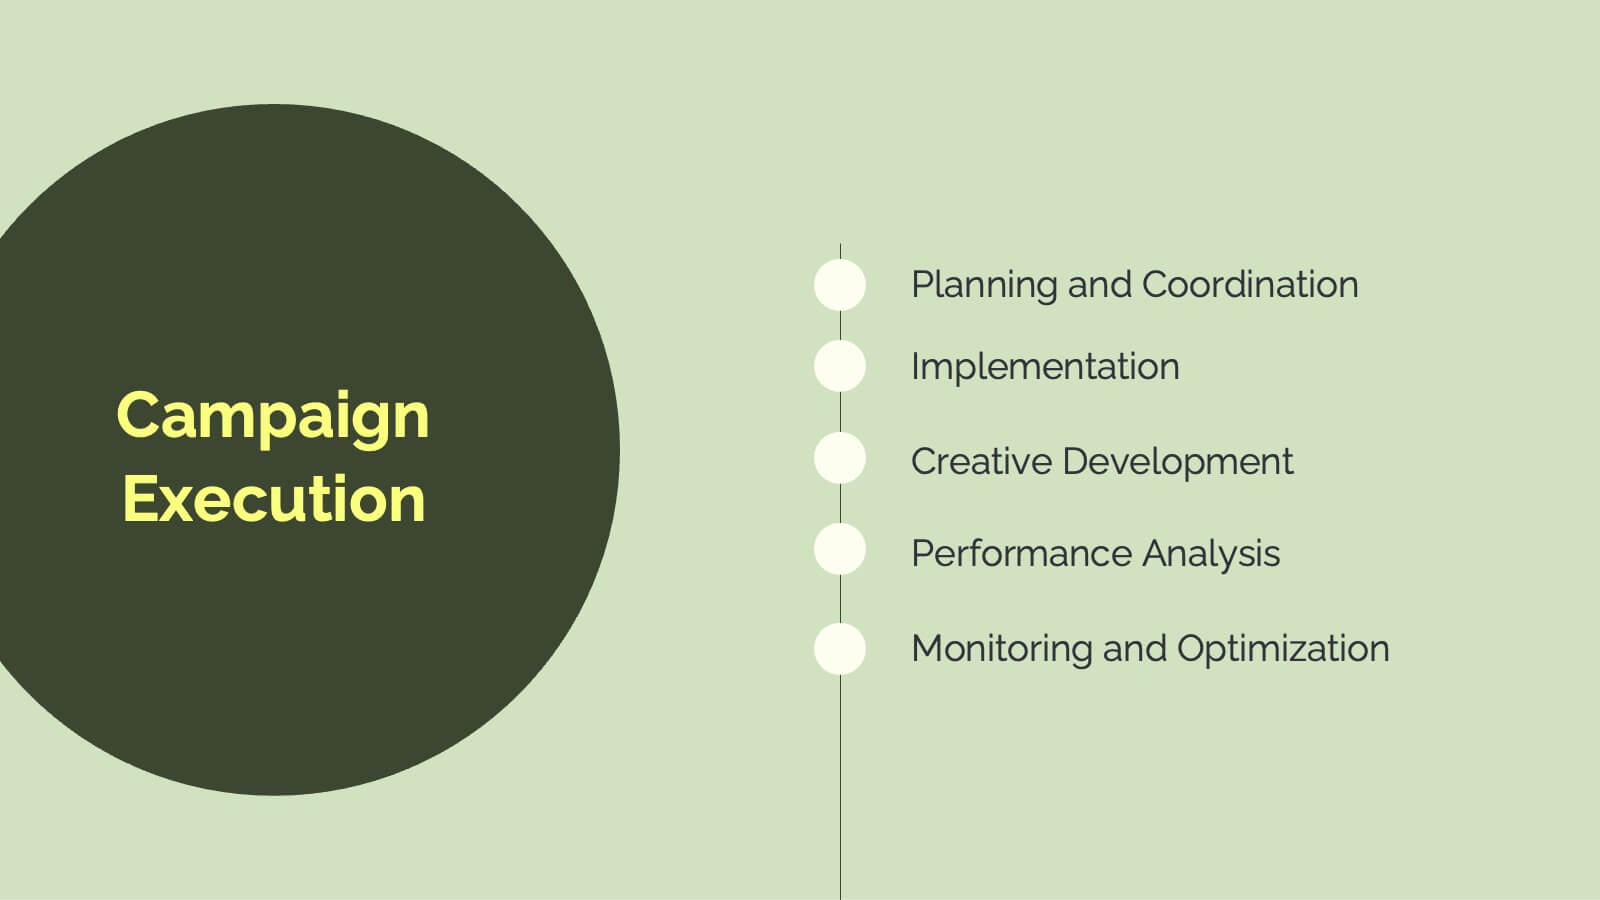
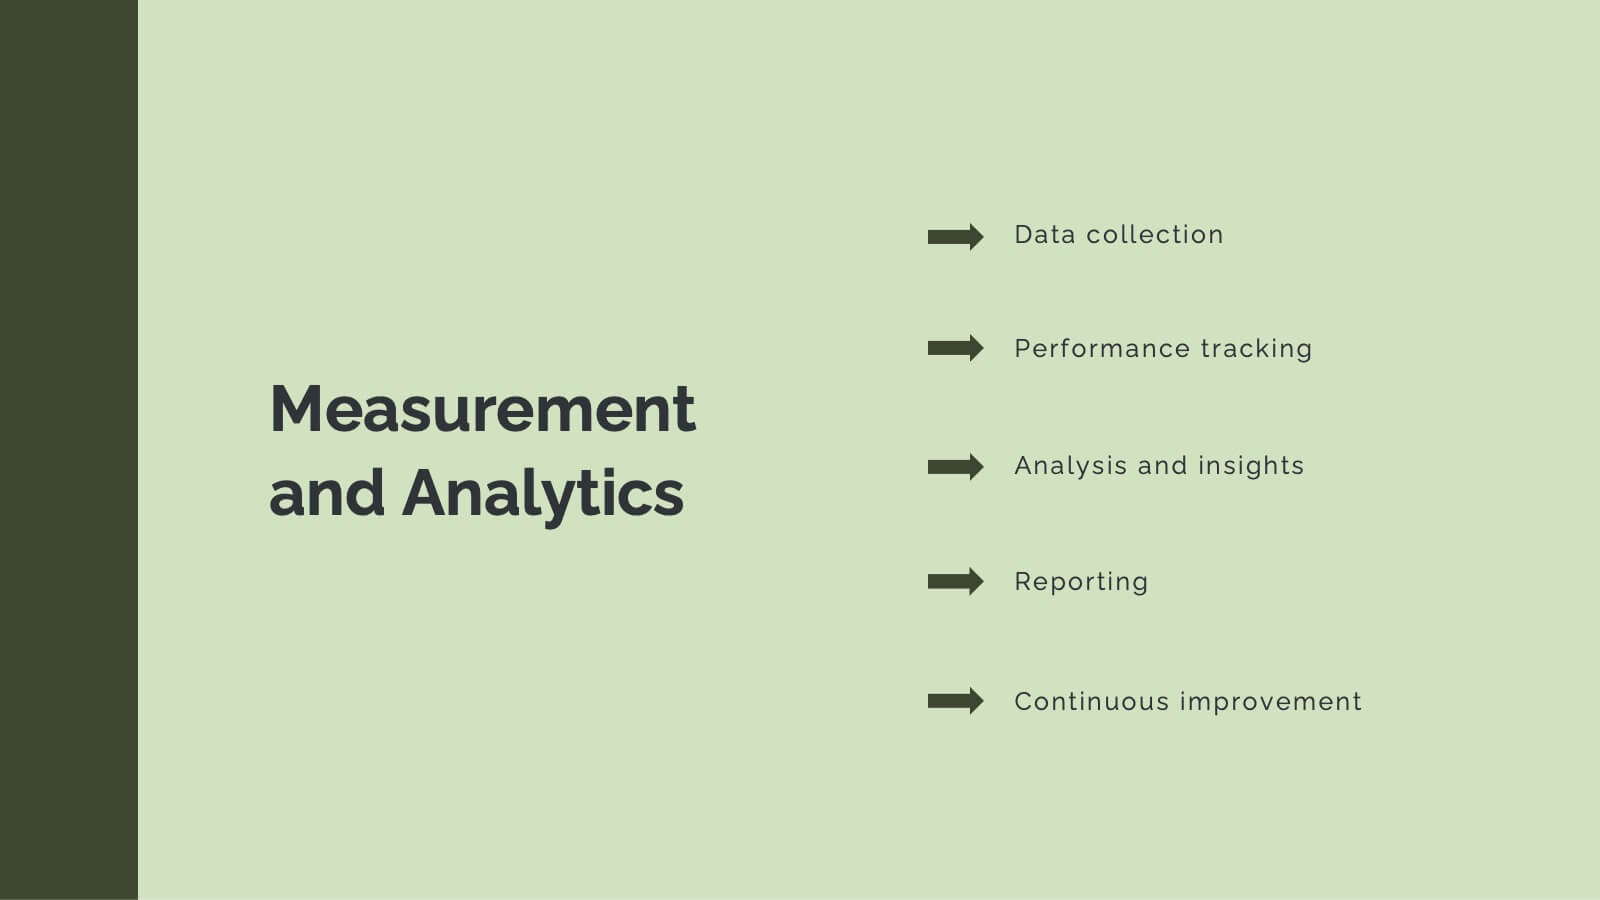
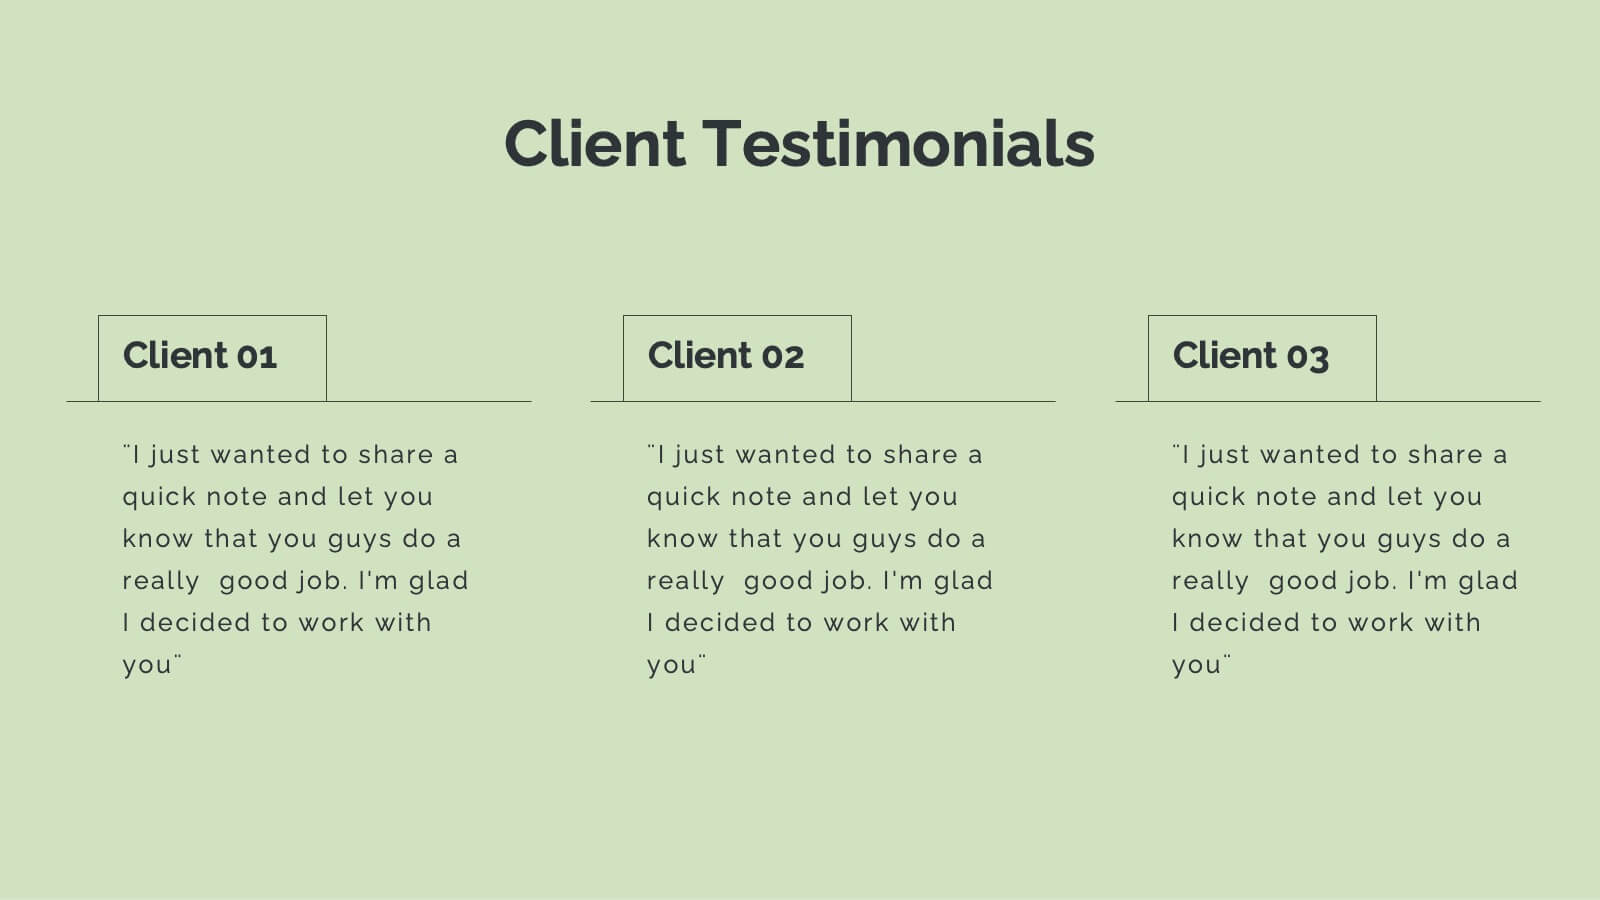
Horizon Advertising Agency Proposal Presentation
Elevate your advertising impact with this comprehensive agency proposal template. It’s meticulously designed to showcase your agency’s capabilities from strategic planning to creative execution, ensuring a persuasive presentation of services like market analysis, campaign strategies, and client success stories. Each slide is formatted to facilitate understanding and engagement, making it perfect for highlighting your team's expertise and unique approach. Compatible with major presentation platforms like PowerPoint, Google Slides, and Keynote, this template supports your efforts to secure new clients and projects seamlessly across various devices.


7 diapositivas
Product Life Cycle Infographic Presentation Template
The product life cycle is a theoretical model that describes the stages a product goes through during its lifetime, from its introduction to the market until its eventual decline and removal from the market. Use this presentation template as a visual aid to help explain the characteristics and impact of each stage, including introduction, growth, maturity and decline. Our product life cycle template can be use to teach students the concepts of product design, sales and marketing as well. This is a simple and informative way to explain the four basic stages of product development in a simple way.


7 diapositivas
Simple Schedule Infographic
Effortlessly structure your time with our simple schedule infographic. Rendered in a clean white canvas, enhanced with dependable blue tones and anchored with timeless black, our template is the epitome of clarity and organization. Equipped with streamlined infographics, universal icons, and adaptable image placeholders, it facilitates easy time management and daily planning. Seamlessly tailored for Powerpoint, Keynote, or Google Slides. A fundamental tool for project managers, event planners, educators, or any professional aiming to efficiently allocate their time. Plan with ease; let every slide bring order to your daily chaos.


10 diapositivas
Data-Driven Feedback Analysis Presentation
Gain deep insights into your business performance with the Data-Driven Feedback Analysis infographic. This dynamic visual presentation helps you track key metrics, analyze trends, and present findings with clarity. Fully customizable and compatible with PowerPoint, Keynote, and Google Slides.


34 diapositivas
MVP Startup
An MVP Startup is a type of business that focuses on developing and launching a minimal version of their product or service with the basic features required to test its viability in the market and gather feedback. This template is designed with a bold and dynamic red color palette, perfect for start-ups that want to convey a sense of passion, innovation, and urgency. It features a range of customizable slides that are specifically tailored for start-up presentations to showcase your MVP concept, market validation, and growth strategy. Compatible with Powerpoint, Keynote, and Google slides, all 34 slides are fully editable.


24 diapositivas
Spireflow Corporate Strategy Report Presentation
Showcase your business insights with this modern, dynamic presentation template designed to communicate strategic goals and objectives effectively. From SWOT analysis to sales strategy and financial performance, each slide is tailored to enhance clarity and engagement. Perfect for business strategists and teams, this template is compatible with PowerPoint, Keynote, and Google Slides.


24 diapositivas
Djinn Brand Identity Presentation
Unleash the power of your brand with this sleek and modern presentation template! From brand identity components to target audience personas, this template covers everything you need to craft a cohesive and compelling brand strategy. Whether showcasing brand guidelines or success stories, it’s designed for maximum clarity and impact. Compatible with PowerPoint, Keynote, and Google Slides for effortless presentations.