


Características


¿Tienes alguna pregunta?
Recomendar


3 diapositivas
TAM SAM SOM Strategy Slide Presentation
Transform data into strategy with a clean, layered visual that helps you present market opportunities with precision and style. Ideal for illustrating market reach and segmentation, this professional layout keeps your insights clear and impactful. Fully compatible with PowerPoint, Keynote, and Google Slides for seamless customization and presentation use.


6 diapositivas
Quarterly Sales Overview Presentation
Bring your numbers to life with a clear, colorful layout that makes quarterly progress instantly easy to understand. This presentation helps you break down trends, compare performance across quarters, and highlight key insights with simple bar visuals. Perfect for reports and meetings, and fully compatible with PowerPoint, Keynote, and Google Slides.


6 diapositivas
Project Roadmap with Strategic Phases Presentation
Visually guide your team through every phase with the Project Roadmap with Strategic Phases Presentation. This template features a curved arrow layout to illustrate project milestones, making it perfect for planning, strategy, or progress updates. Fully customizable in PowerPoint, Google Slides, and Canva for seamless integration into any workflow.


5 diapositivas
Business Insight Iceberg Presentation
Visualize surface-level data and deeper insights with the Business Insight Iceberg Presentation. Perfect for showcasing organizational structure, decision-making layers, or strategy breakdowns. Each editable layer helps communicate complexity clearly and effectively. Fully compatible with PowerPoint, Keynote, and Google Slides—ideal for professionals, analysts, and educators aiming for clarity and impact.


4 diapositivas
Operating Expenses and Cost Allocation Presentation
Clearly outline key financial movements with the Operating Expenses and Cost Allocation Presentation. This slide uses a step-arrow layout to show the relationship between spending and allocation, making it ideal for budgeting updates, operational analysis, or finance planning. Fully editable in PowerPoint, Keynote, Google Slides, and Canva for seamless customization.


4 diapositivas
Target Audience and Buyer Persona Analysis Presentation
Visually map out your core audience segments with this modern target diagram layout. This presentation features a concentric ring graphic to represent buyer personas and user data, alongside three editable text sections with icons for clear and structured insights. Ideal for marketing strategies, customer profiling, and campaign planning. Easily customizable in PowerPoint, Keynote, and Google Slides.


5 diapositivas
European Countries Editable Map Presentation
Bring your data to life with a detailed and modern map layout that showcases insights across Europe. Perfect for visualizing country comparisons, regional statistics, or business expansion plans, this clean design ensures clarity and impact. Fully compatible with PowerPoint, Keynote, and Google Slides for easy editing and presentation.


5 diapositivas
Big Data Interpretation and Metrics Presentation
Break down complex data into digestible segments with the Big Data Interpretation and Metrics Presentation. Featuring a puzzle-inspired layout, this template is ideal for illustrating interconnected data points, analytics strategies, or metric-based frameworks. Fully customizable in PowerPoint, Keynote, and Google Slides.


4 diapositivas
Attention-Interest-Desire-Action Sales Strategy Presentation
Highlight each phase of your sales journey with this clean and modern AIDA model layout. Designed for clarity, it uses bold semicircle visuals and directional arrows to guide your audience from capturing attention to driving action. Perfect for sales teams, marketers, and consultants. Fully editable in PowerPoint, Keynote, and Google Slides.


21 diapositivas
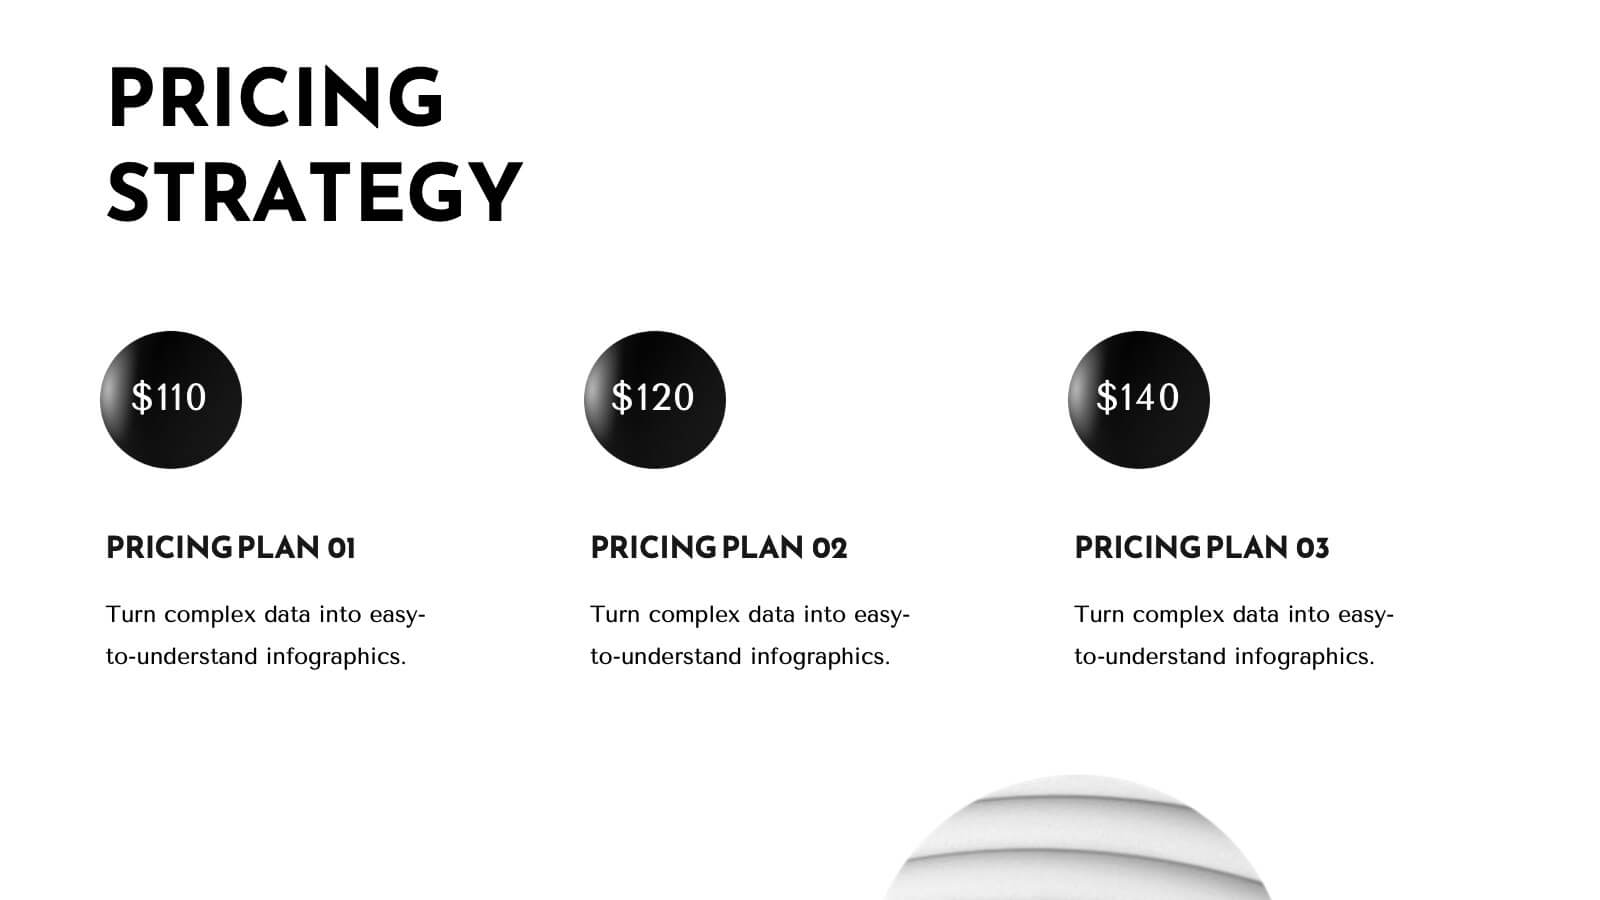
Trident Product Development Plan Presentation
Present your product development strategy with this sleek, professional template! Highlight company overview, product features, and unique selling proposition. Ideal for showcasing market analysis, pricing strategy, and production process. Perfect for developers and project managers. Compatible with PowerPoint, Keynote, and Google Slides.


7 diapositivas
Abstract Business Diagrams in Geometry
Showcase your ideas with visual impact using the Abstract Business Diagrams in Geometry Presentation. This modern layout features a six-part hexagonal structure, ideal for presenting categories, segments, or processes. Each shape is numbered, icon-supported, and color-coded for clarity and emphasis. Perfect for strategy, planning, or data overviews. Fully editable in PowerPoint, Keynote, and Google Slides.


5 diapositivas
Role Assignment Matrix Framework Presentation
Simplify task delegation with the Role Assignment Matrix Framework Presentation. Ideal for defining roles and responsibilities in a clear, table-based layout, this matrix helps organize who does what across departments or project phases. Perfect for RACI charts or team alignment. Fully editable in PowerPoint, Google Slides, Keynote, and Canva.


5 diapositivas
Business Workflow Process Presentation
Optimize your operations with the Business Workflow Process template, designed to visually map out tasks and streamline workflows. Perfect for project managers and teams, this template enhances clarity and collaboration. Fully customizable and compatible with PowerPoint, Keynote, and Google Slides, making professional workflow presentations seamless and efficient.


12 diapositivas
Leadership Development and Growth
Highlight leadership skills with this dynamic radar chart template, ideal for tracking individual or team competencies across six core areas. Use this layout to visualize progress in communication, strategy, vision, influence, adaptability, and accountability. Great for HR reviews, training evaluations, or performance dashboards. Fully editable in PowerPoint, Keynote, and Google Slides.


6 diapositivas
Multiple Business Solutions Options Slide Presentation
Explore diverse strategies with the Multiple Business Solutions Options Slide Presentation. Featuring a vertical stack of labeled briefcases (A–F), this slide is designed to compare and communicate multiple business ideas, solutions, or pathways in a clear, structured layout. Ideal for pitching product variations, workflow choices, or market entry tactics. Each option is paired with customizable text fields for added clarity. Compatible with PowerPoint, Keynote, and Google Slides for easy editing and integration into your existing decks.


8 diapositivas
Business Risk Identification and Management
Simplify complex risk factors with this visually engaging diagram. This template uses overlapping circular segments to categorize and assess risk impact across four business areas—ideal for project managers, analysts, and consultants. Customizable progress bars help communicate risk levels with clarity. Compatible with PowerPoint, Keynote, and Google Slides.


6 diapositivas
Corporate Company Profile Presentation
Showcase Your Business with a Professional Company Profile! The Corporate Company Profile template is designed to present your brand, values, and key highlights in a structured and visually appealing format. Featuring modern circular image placements, strategic content sections, and sleek infographics, this template is ideal for introducing your company, highlighting milestones, and communicating your business strategy. Fully editable in PowerPoint, Keynote, and Google Slides, this design ensures seamless customization for any industry.