


Características


¿Tienes alguna pregunta?
Recomendar


5 diapositivas
Target Audience Analysis Slide Presentation
Discover who your audience truly is with this clear and visually balanced layout designed to simplify audience insights. Perfect for marketing plans, presentations, and strategy reports, it helps you visualize key demographics and behaviors effortlessly. Fully customizable and compatible with PowerPoint, Keynote, and Google Slides for easy editing.


7 diapositivas
Social Network Infographic Presentation
A Social Network Infographic is a visual representation of data that shows the connections and relationships between individuals, groups, or organizations within a social network. Use this template to illustrate the structure of a social network, and to analyze patterns and trends in the interactions between users. This Infographic includes a visual representation of networking, in graphs and diagram, with icons representing individuals and lines representing connections between them. This template can be customized with different colors, fonts, and text in Powerpoint, Keynote, and Google Slides.


5 diapositivas
Digital Marketing Strategy Infographics
A digital marketing strategy refers to a plan of action that businesses or organizations develop to achieve their marketing goals using digital channels and technologies. These vertical infographics outline the key elements of a successful digital marketing strategy. They are designed for marketers, business owners, and individuals seeking to understand and implement effective digital marketing practices. Guide your audience through the process of defining specific objectives, such as increasing website traffic, improving lead generation, or enhancing brand awareness. These can cover strategies and leverage social media analytics.


7 diapositivas
Transportation & Logistics Management Infographic
Transportation and logistics refer to the management, planning, and coordination of the movement of goods, people, and information from one place to another. This professionally crafted template is designed to guide and inspire professionals in the fast-paced domain of transportation and logistics management. Explore key concepts, strategies, and best practices that drive operational excellence and ensure seamless supply chain movements. This is compatible with Powerpoint, Keynote, and Google Slides. This infographic is your compass through the world of transportation and logistics.


5 diapositivas
Economic Analysis of North America Map Presentation
The Economic Analysis of North America Map template provides a focused visual tool for displaying economic data across different regions. With dedicated spots for key statistics and trends, this template enhances presentations with clear, data-driven insights. It is designed to be user-friendly and is compatible with PowerPoint, Keynote, and Google Slides.


7 diapositivas
IT Architecture Services Infographic Presentation
An IT Architecture Infographic presents information related to the design, structure, and components of an organization's architecture. IT Architecture refers to the overall framework of an organization's IT systems and infrastructure. This template is designed to communicate the design, structure, and components of your organization's IT architecture. The template features a modern design with a blue color scheme, giving your presentation a professional and sleek look. It is compatible with Powerpoint, Keynote, and Google Slides, making it simple for you to create a professional presentation.


5 diapositivas
Healthcare Lifestyle Infographic
Maintaining a healthy lifestyle can prevent or manage many health problems and improve one's quality of life. These vertical infographics are an effective way to convey information about health and wellness to a wide audience. This infographic can be used to showcase statistics, health tips, and other information related to healthy living. It is a visually stunning and informative way to present important health and wellness information. This template includes special sections for showcasing key statistics and facts related to health and wellness, as well as tips for maintaining a healthy lifestyle.


3 diapositivas
First 90 Days Action Strategy Plan Presentation
Get ready to crush your first 90 days with a strategy layout that actually makes sense. This template helps you outline clear goals, actions, and milestones to hit during your critical first quarter—perfect for managers or new hires. Fully customizable and compatible with PowerPoint, Keynote, and Google Slides for easy editing.


5 diapositivas
5 Types of Credit Cards Explained Presentation
Unlock the world of smarter spending with this clear, engaging layout designed to break down different credit card types in a simple, visual way. It helps you present features, benefits, and key distinctions with ease, making financial concepts easy to understand. Fully editable and compatible with PowerPoint, Keynote, and Google Slides.


5 diapositivas
Asia Geographic and Business Analysis Map Presentation
Gain a strategic edge with the Asia Geographic and Business Analysis Map template, designed to visualize market trends and demographic data across the region. Ideal for businesses, investors, and academics, it supports PowerPoint, Keynote and Google Slides. This adaptable template is perfect for presenting geographic data analyses and exploring regional business potentials.


6 diapositivas
IT Security and Data Protection
Safeguard your digital infrastructure with this sleek 6-step IT security infographic. Centered around a shield icon, this layout is ideal for cybersecurity briefings, data compliance protocols, and risk assessments. Fully customizable in PowerPoint, Keynote, and Google Slides—perfect for IT professionals and corporate tech teams.


4 diapositivas
Case Study Insights and Outcomes Presentation
Showcase real-world takeaways with the Case Study Insights and Outcomes Presentation. This modern, folder-style infographic layout guides your audience through three key stages of a case study—process, insight, and results. Ideal for highlighting lessons learned, performance reviews, or client success journeys. Fully editable in PowerPoint, Keynote, and Google Slides.


5 diapositivas
Team and Client Feedback Collection Strategy
Gather actionable insights with the Team and Client Feedback Collection Strategy Presentation. This slide layout uses a balanced circular and rating-star design to showcase four core feedback sources—ideal for presenting survey outcomes, satisfaction metrics, and review strategies. Fully editable in PowerPoint, Keynote, and Google Slides.


7 diapositivas
Corporation Hierarchy Infographic
Discover the intricate layers of corporate structure with our corporation hierarchy infographic. Set in an appealing blend of blue, yellow, and white, this template artfully depicts the hierarchal ladder commonly seen in major corporations. From CEOs to interns, it beautifully outlines every rung. This infographic is indispensable for business students, corporate trainers, managers, and anyone seeking to understand the inner workings of a corporation. Designed with precision and clarity, it's perfectly suited for PowerPoint, Keynote, and Google Slides, making your presentations not only informative but also visually captivating.


7 diapositivas
Oceania Map Infographic Presentation Template
The Oceania Map is a geographical region comprising Australasia, Melanesia, Micronesia and Polynesia. The largest landmass of Oceania is Australia. Oceania's borders differ slightly from country to country, but its boundaries are mostly defined by the waters surrounding its many islands. This Oceania map template is the first step to creating an engaging and informative map. It features the entire continent, surrounding islands, and sub-regions. The white background makes it easy to fill out with your colorful content. This template is suitable for school projects or business presentations.


5 diapositivas
Strategic Inquiry Mapping Presentation
Bring your ideas to life with a fresh visual flow that maps key questions into action. This strategic template helps you organize complex inquiries across five stages—from insights and communication to analysis and execution. Fully editable and easy to use in PowerPoint, Keynote, and Google Slides for clear visual storytelling.


20 diapositivas
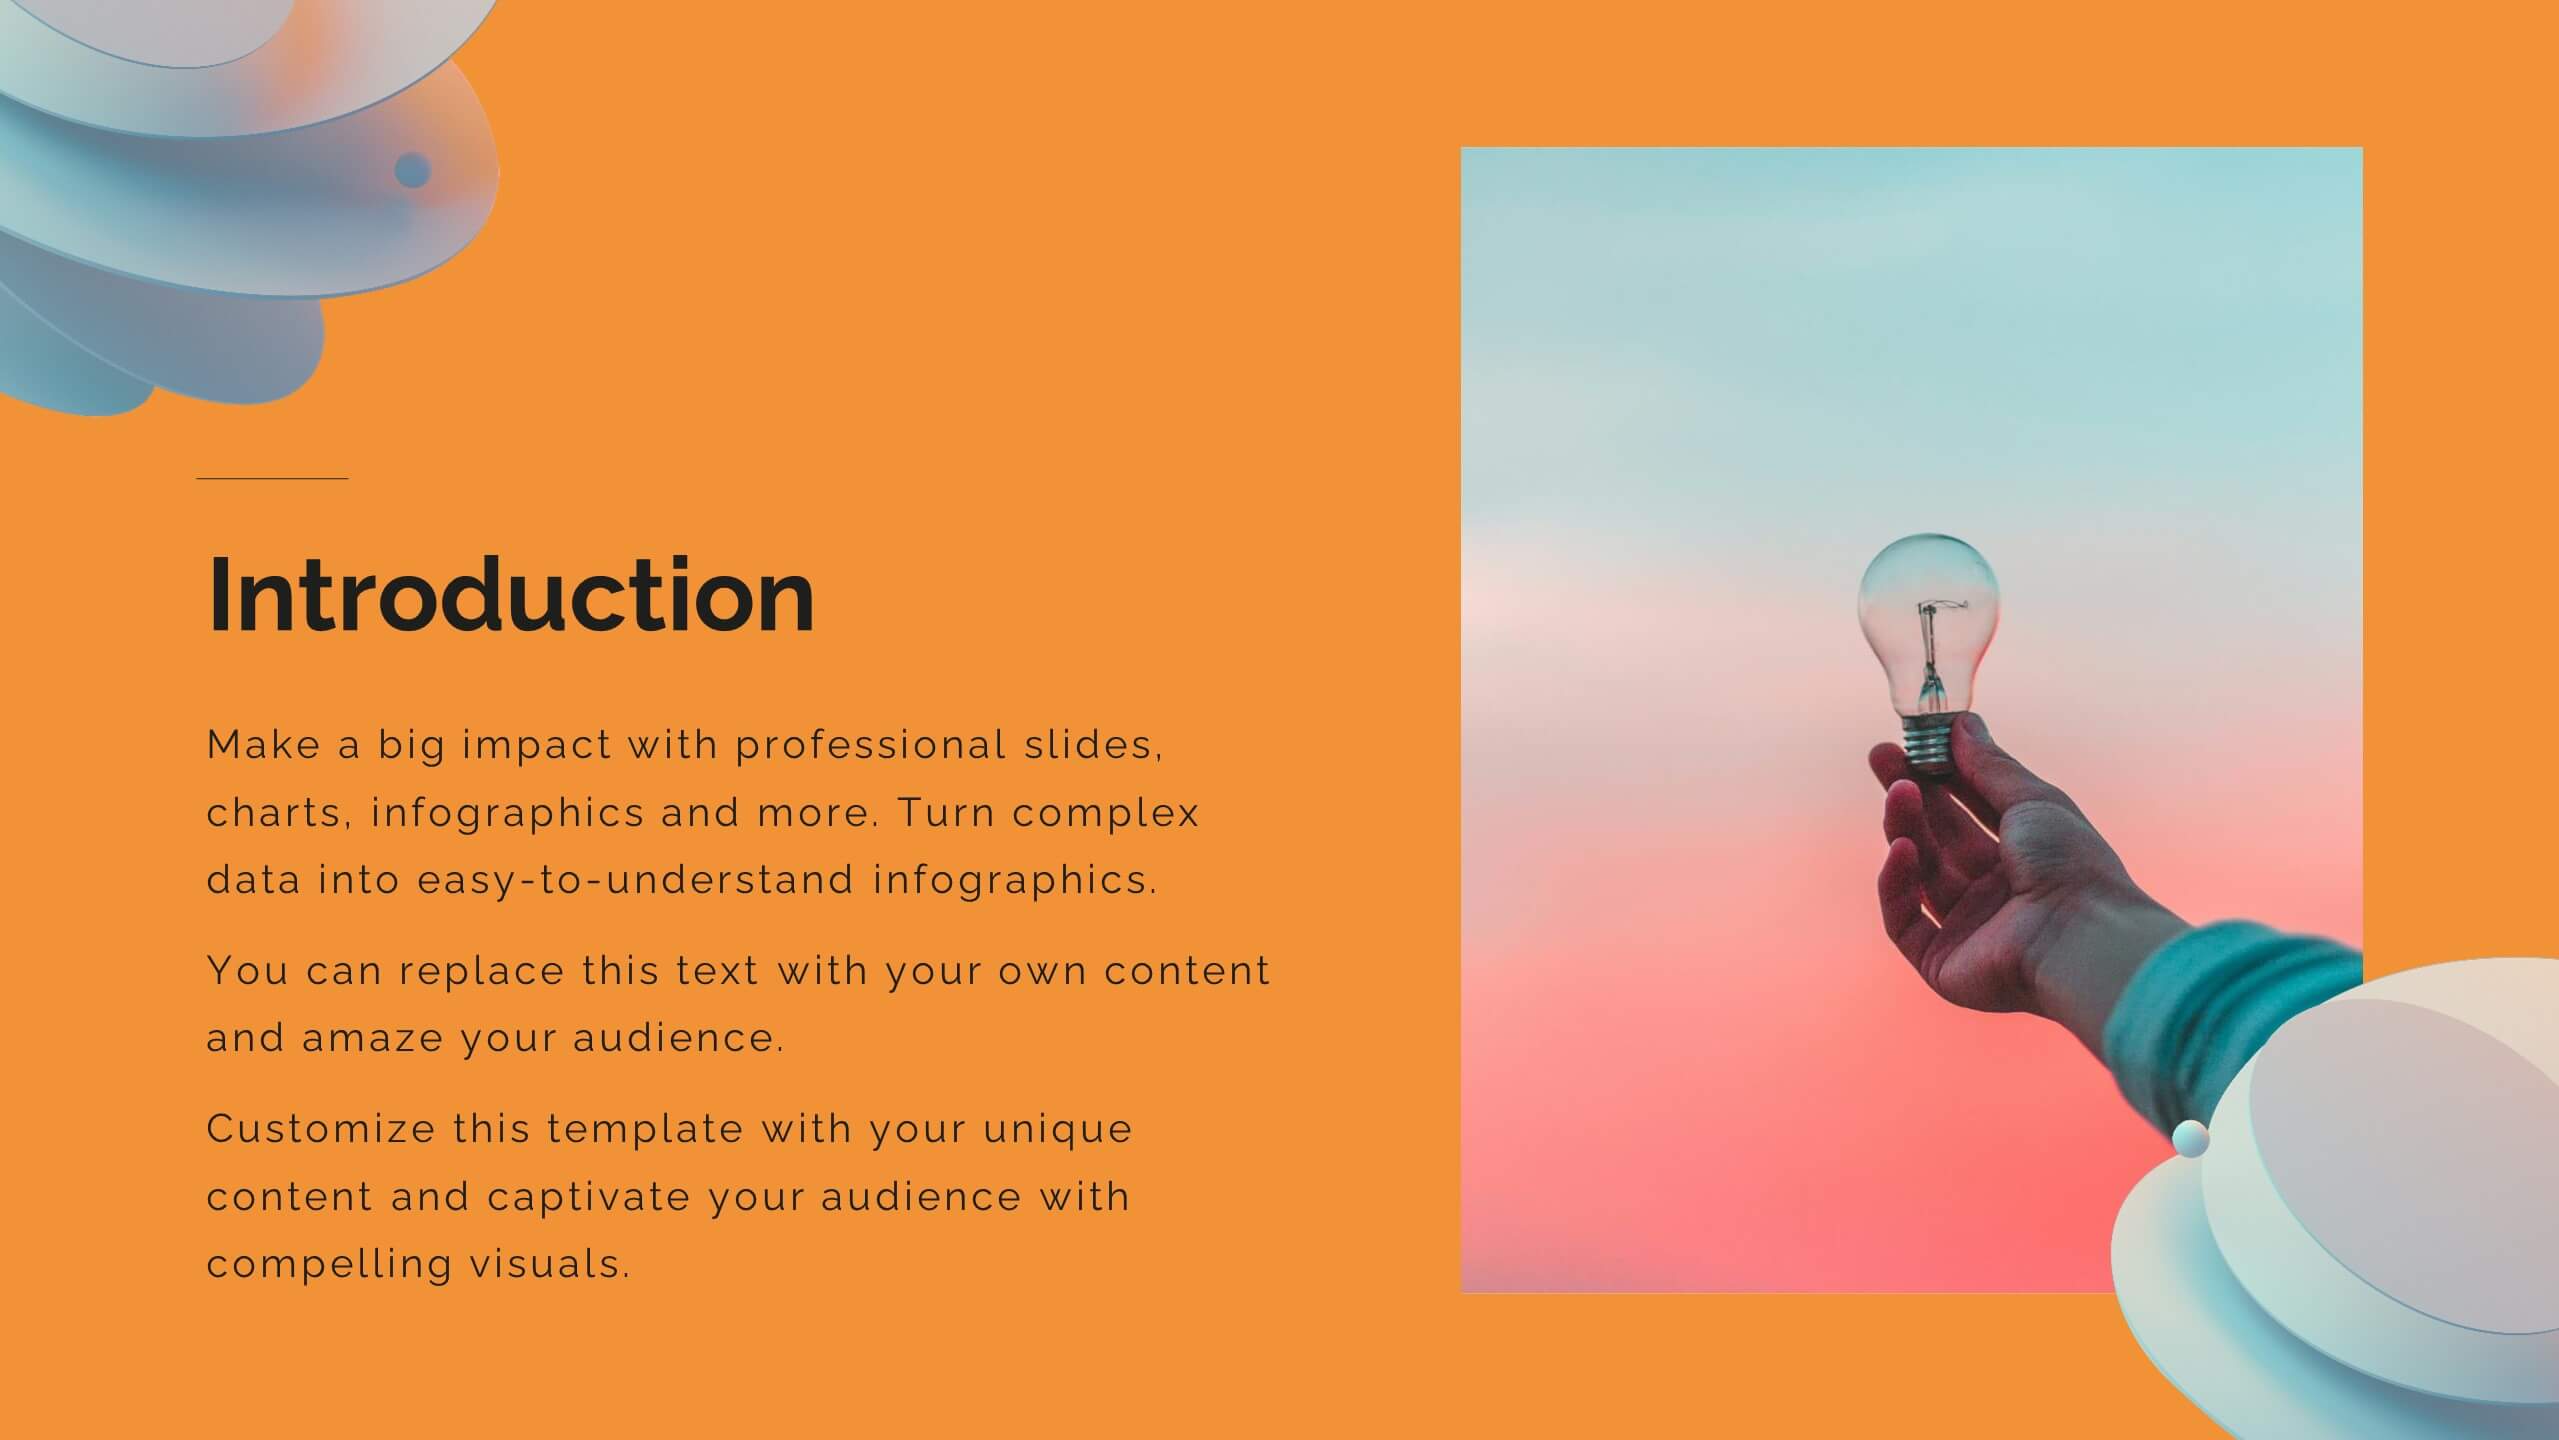
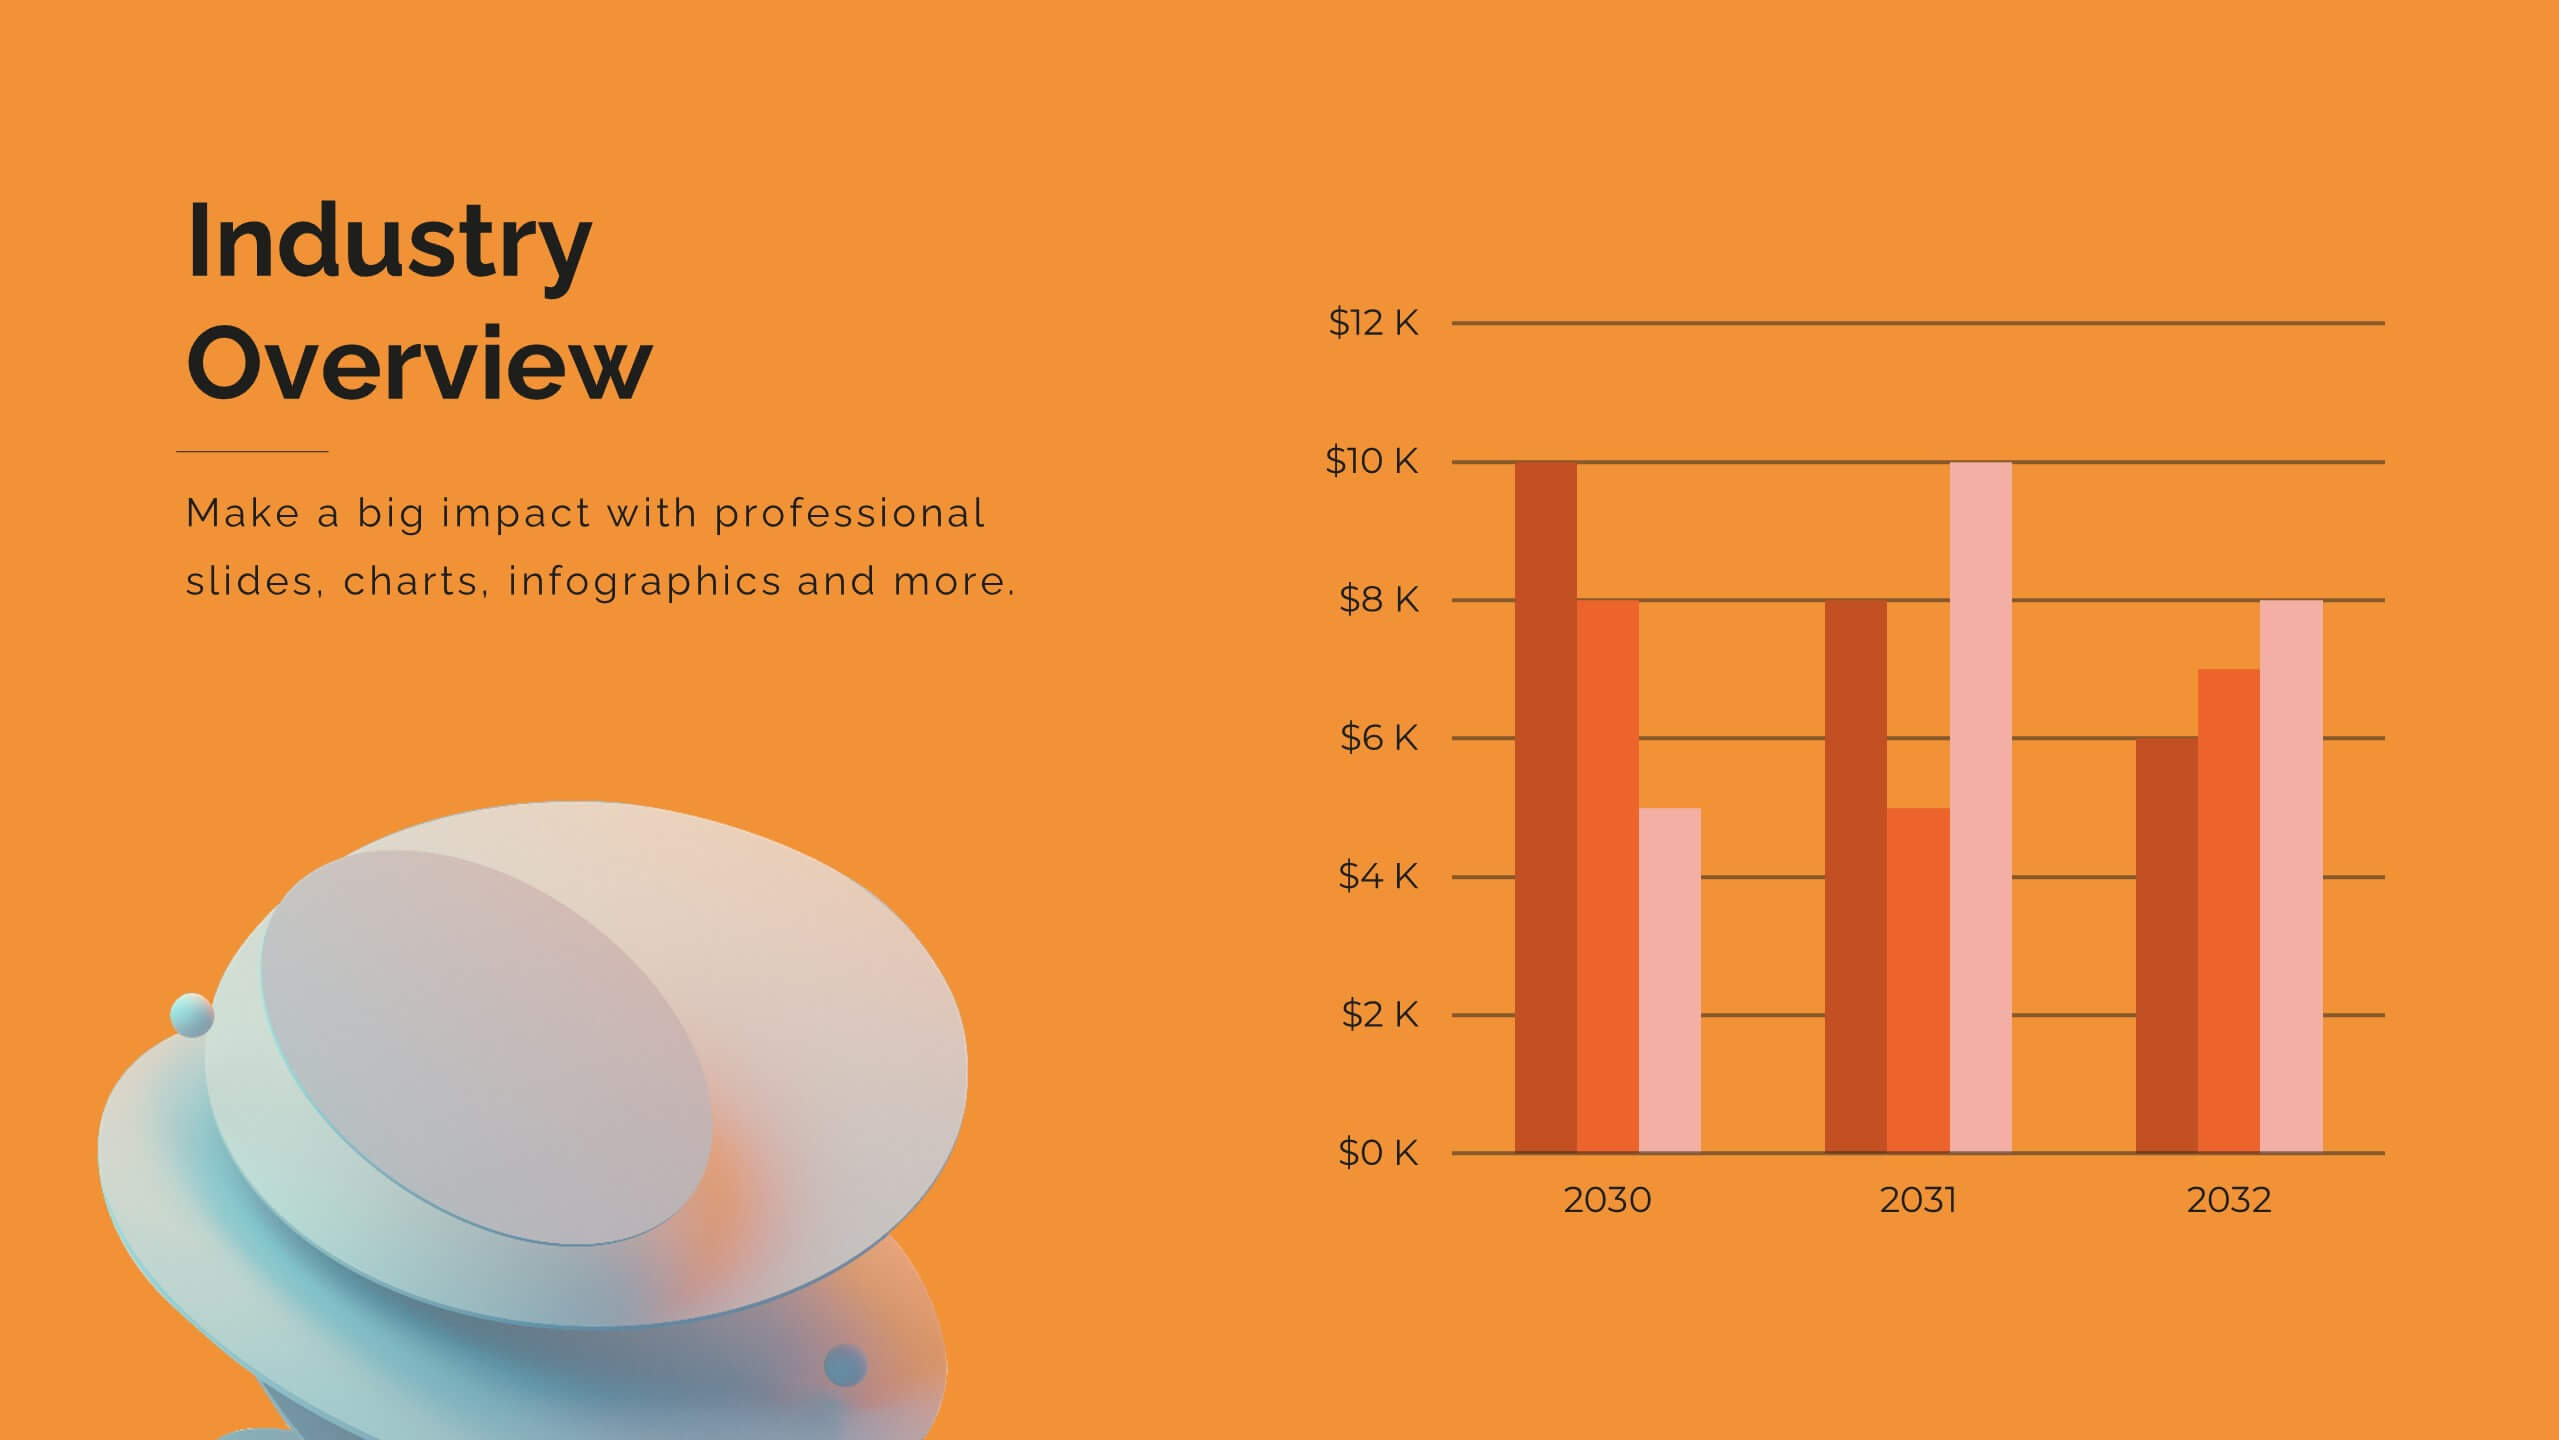
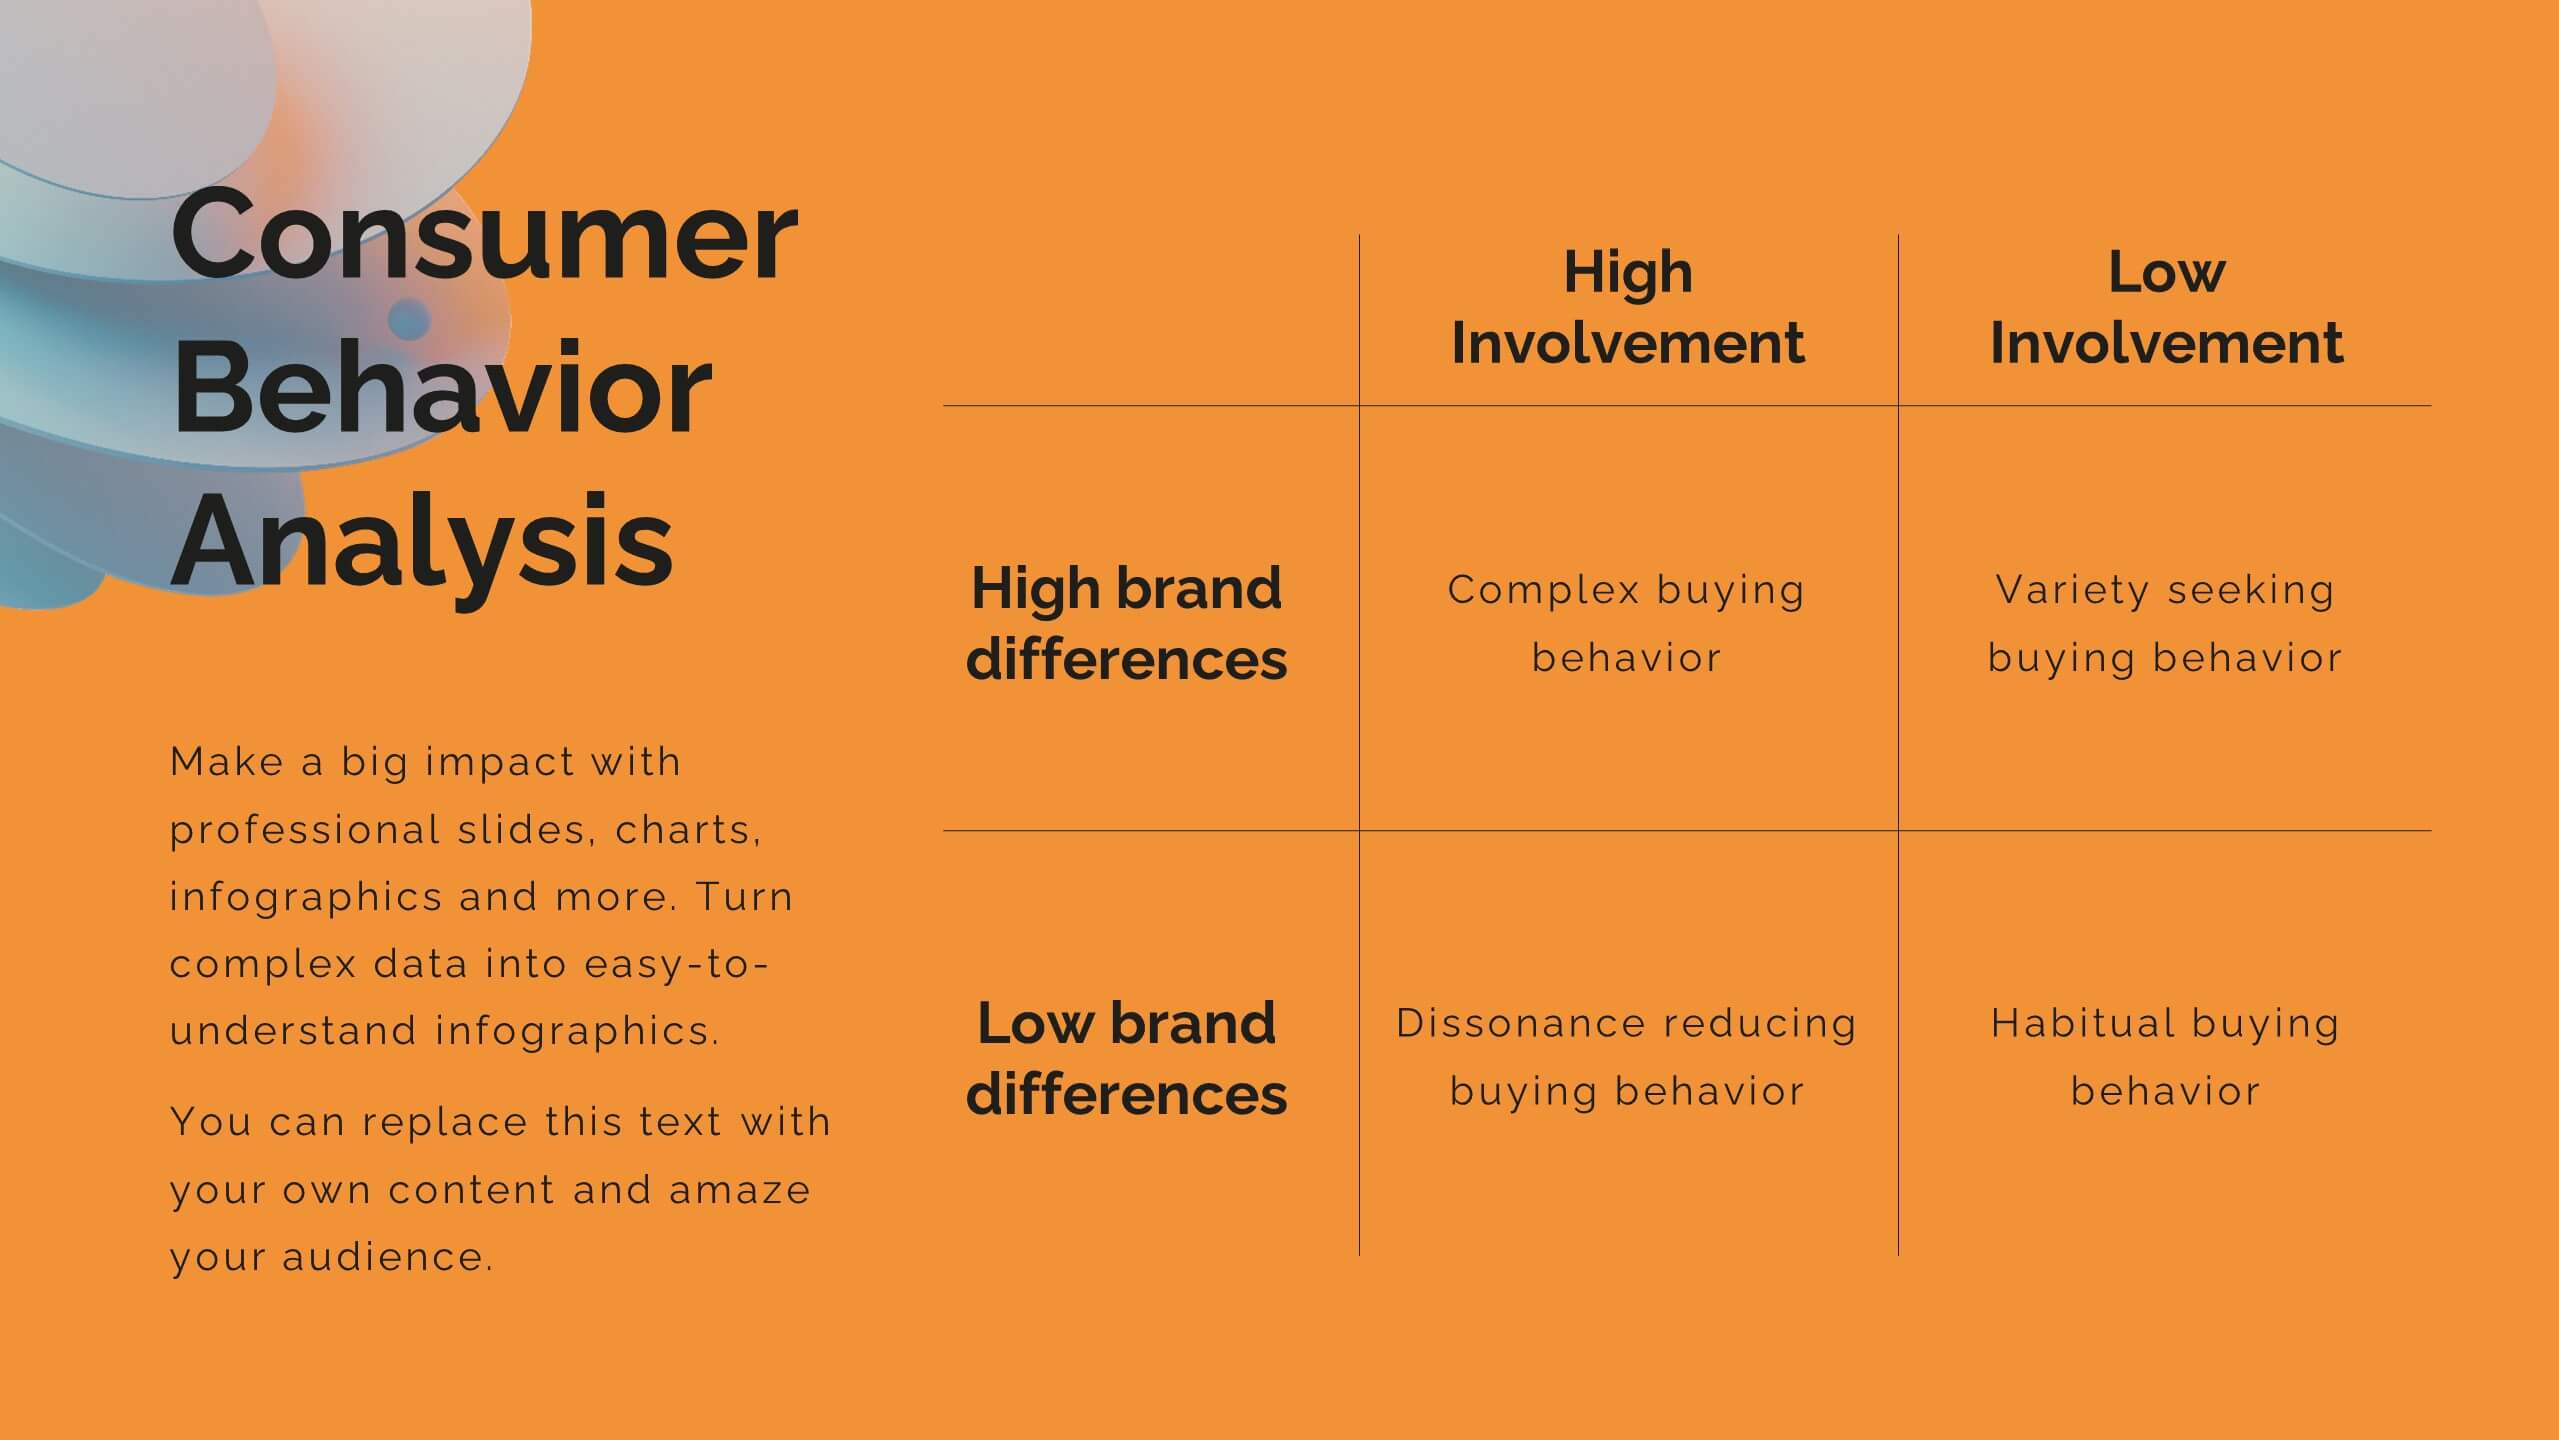
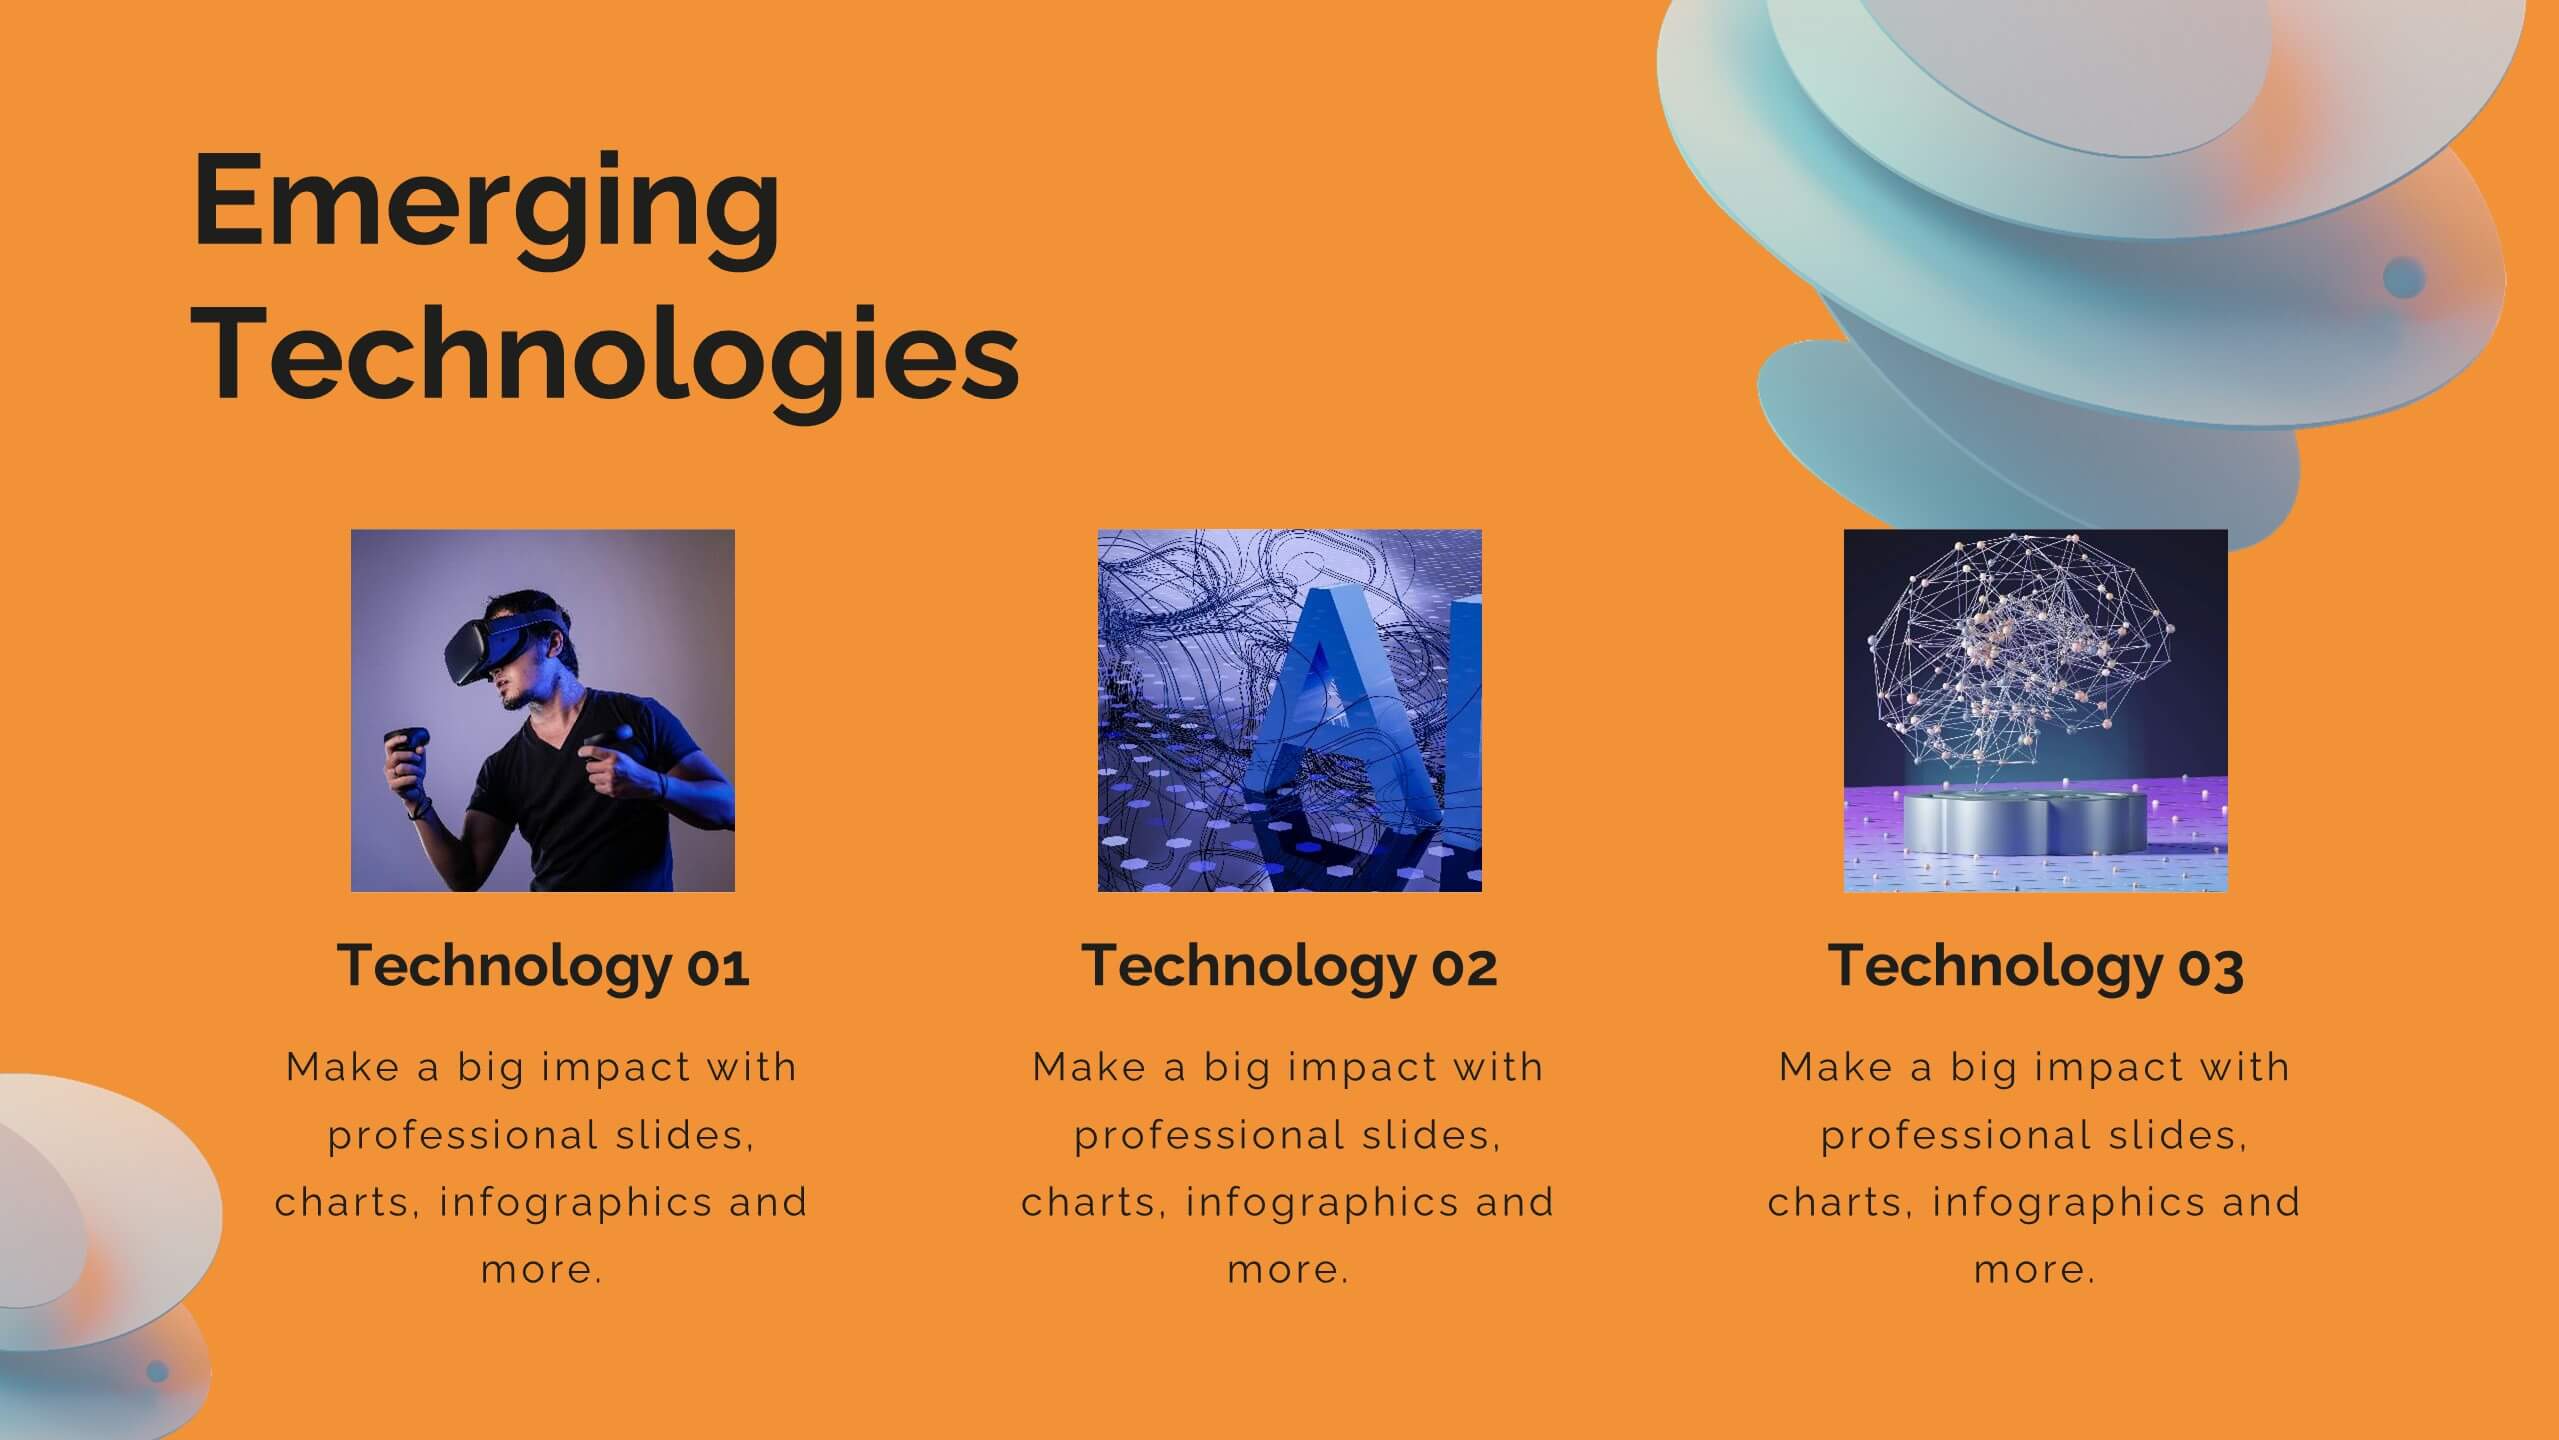
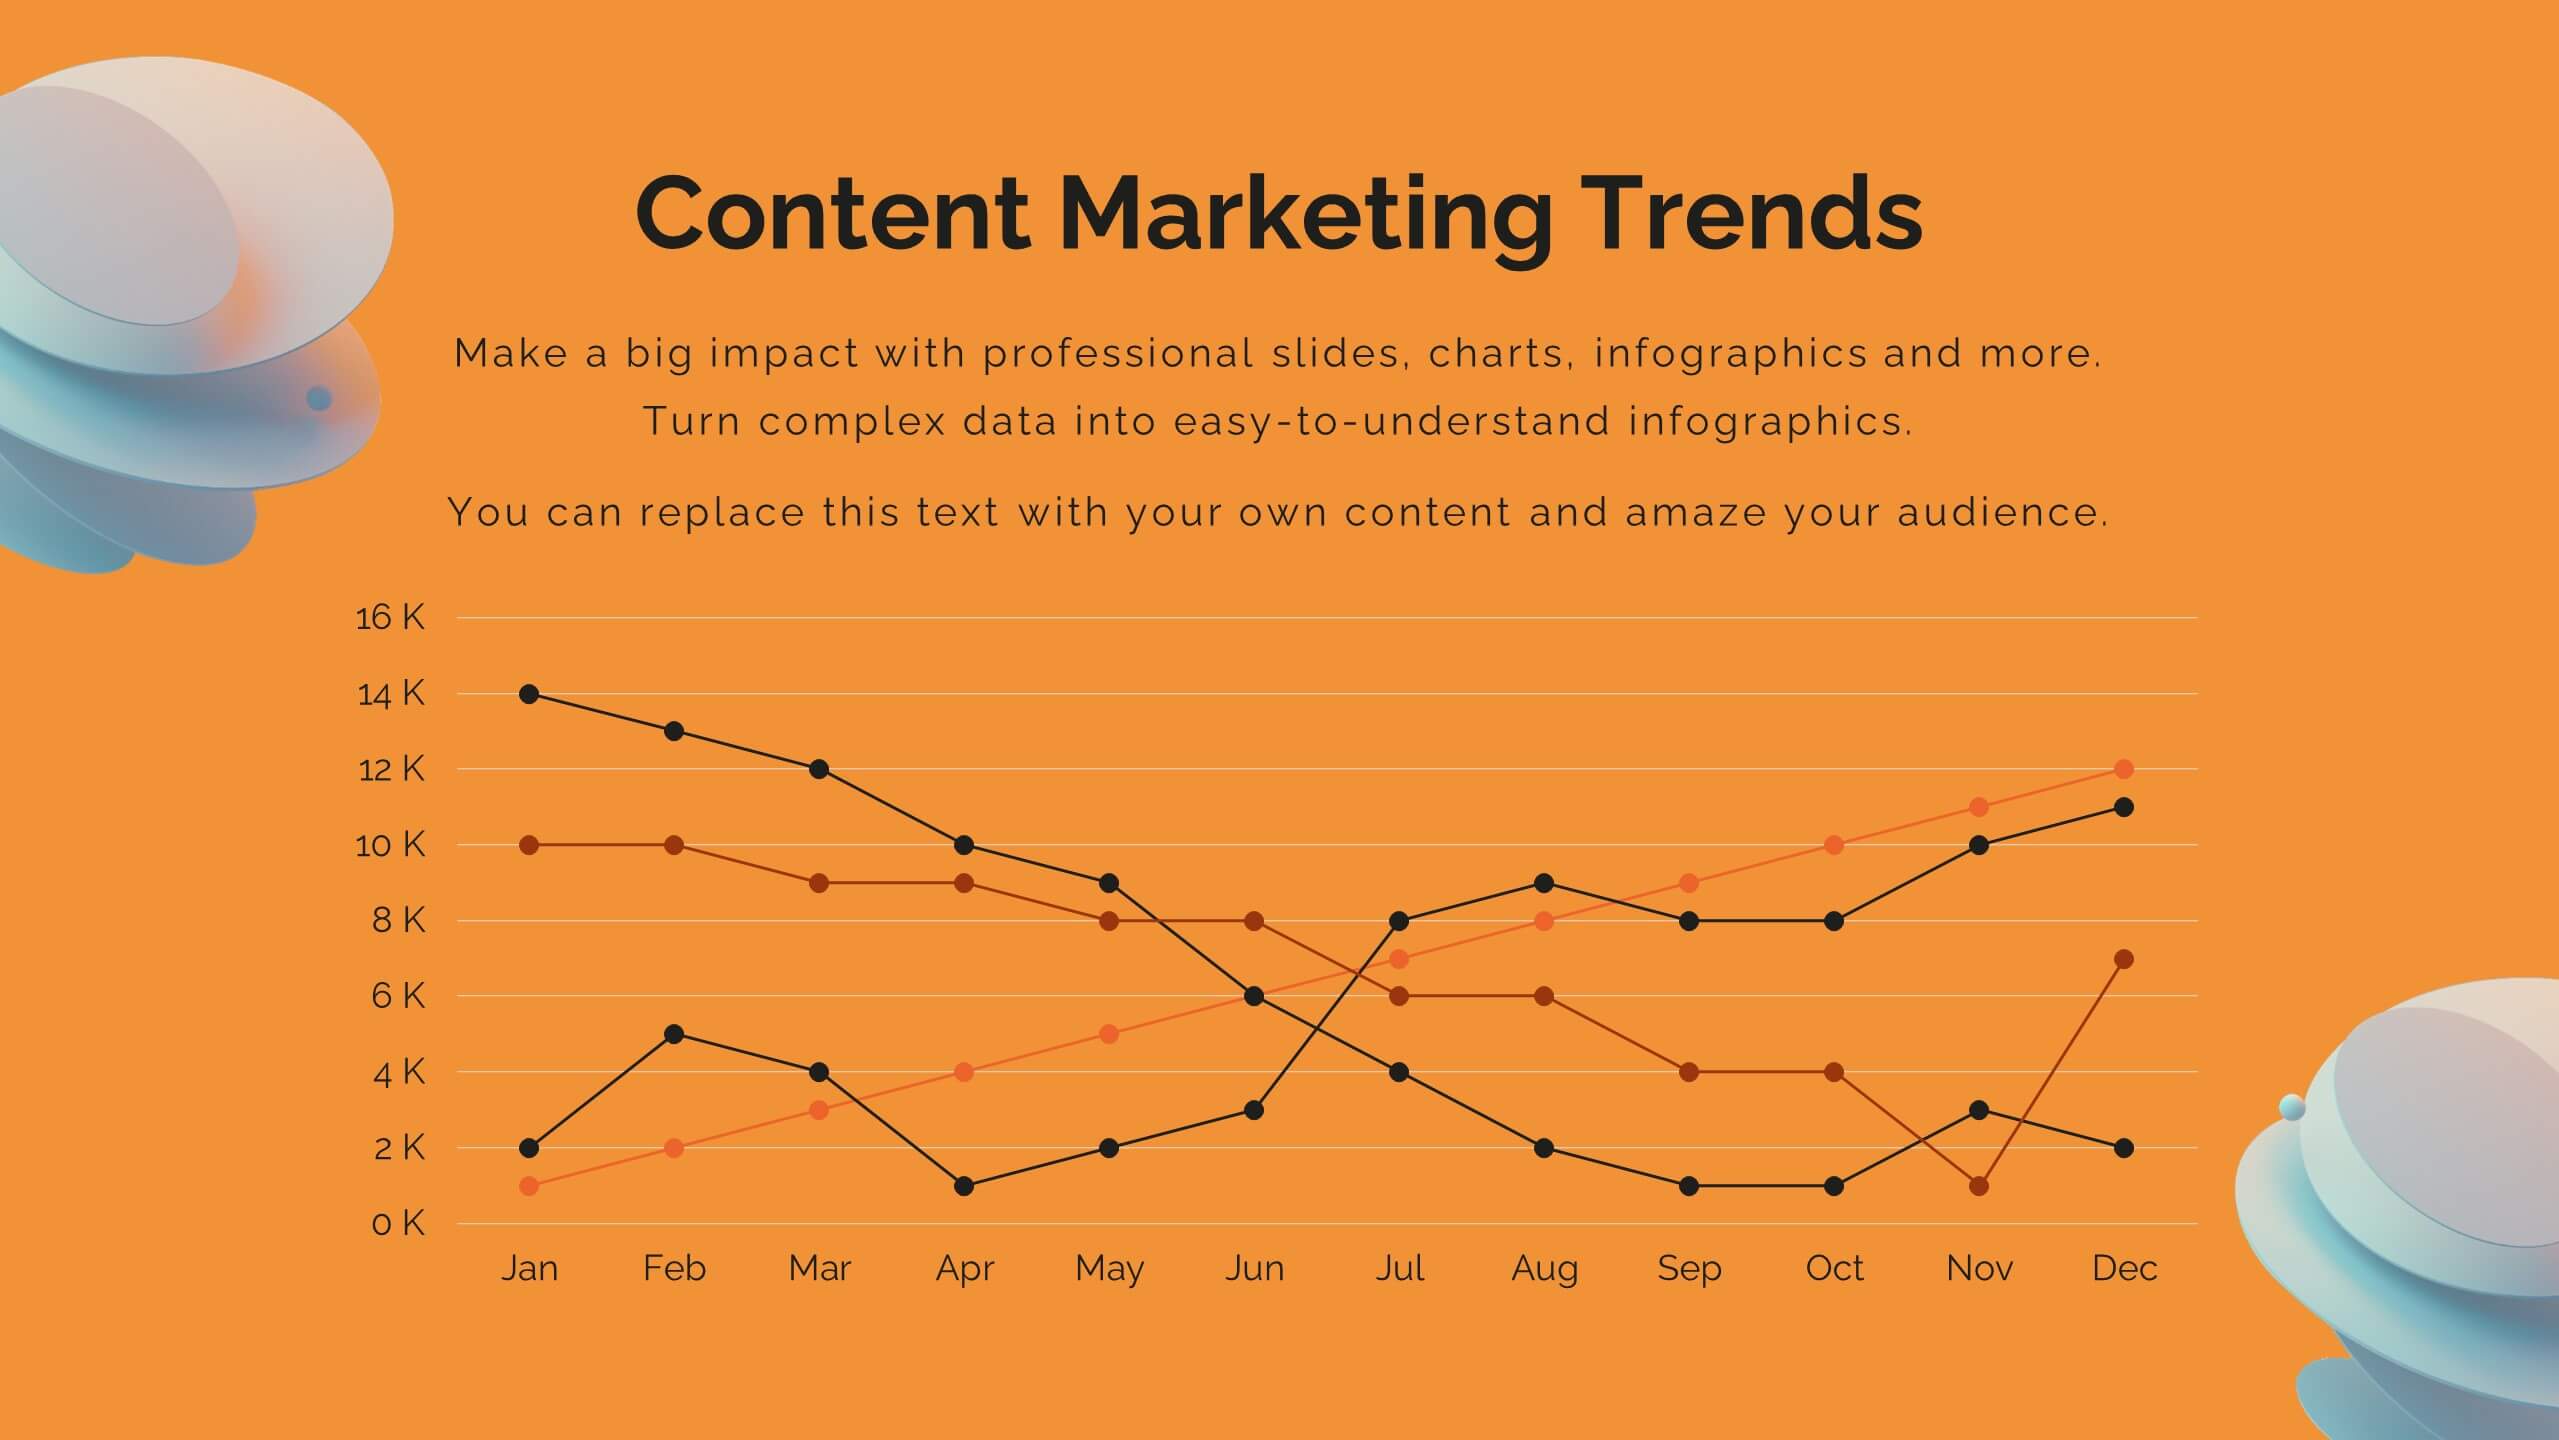
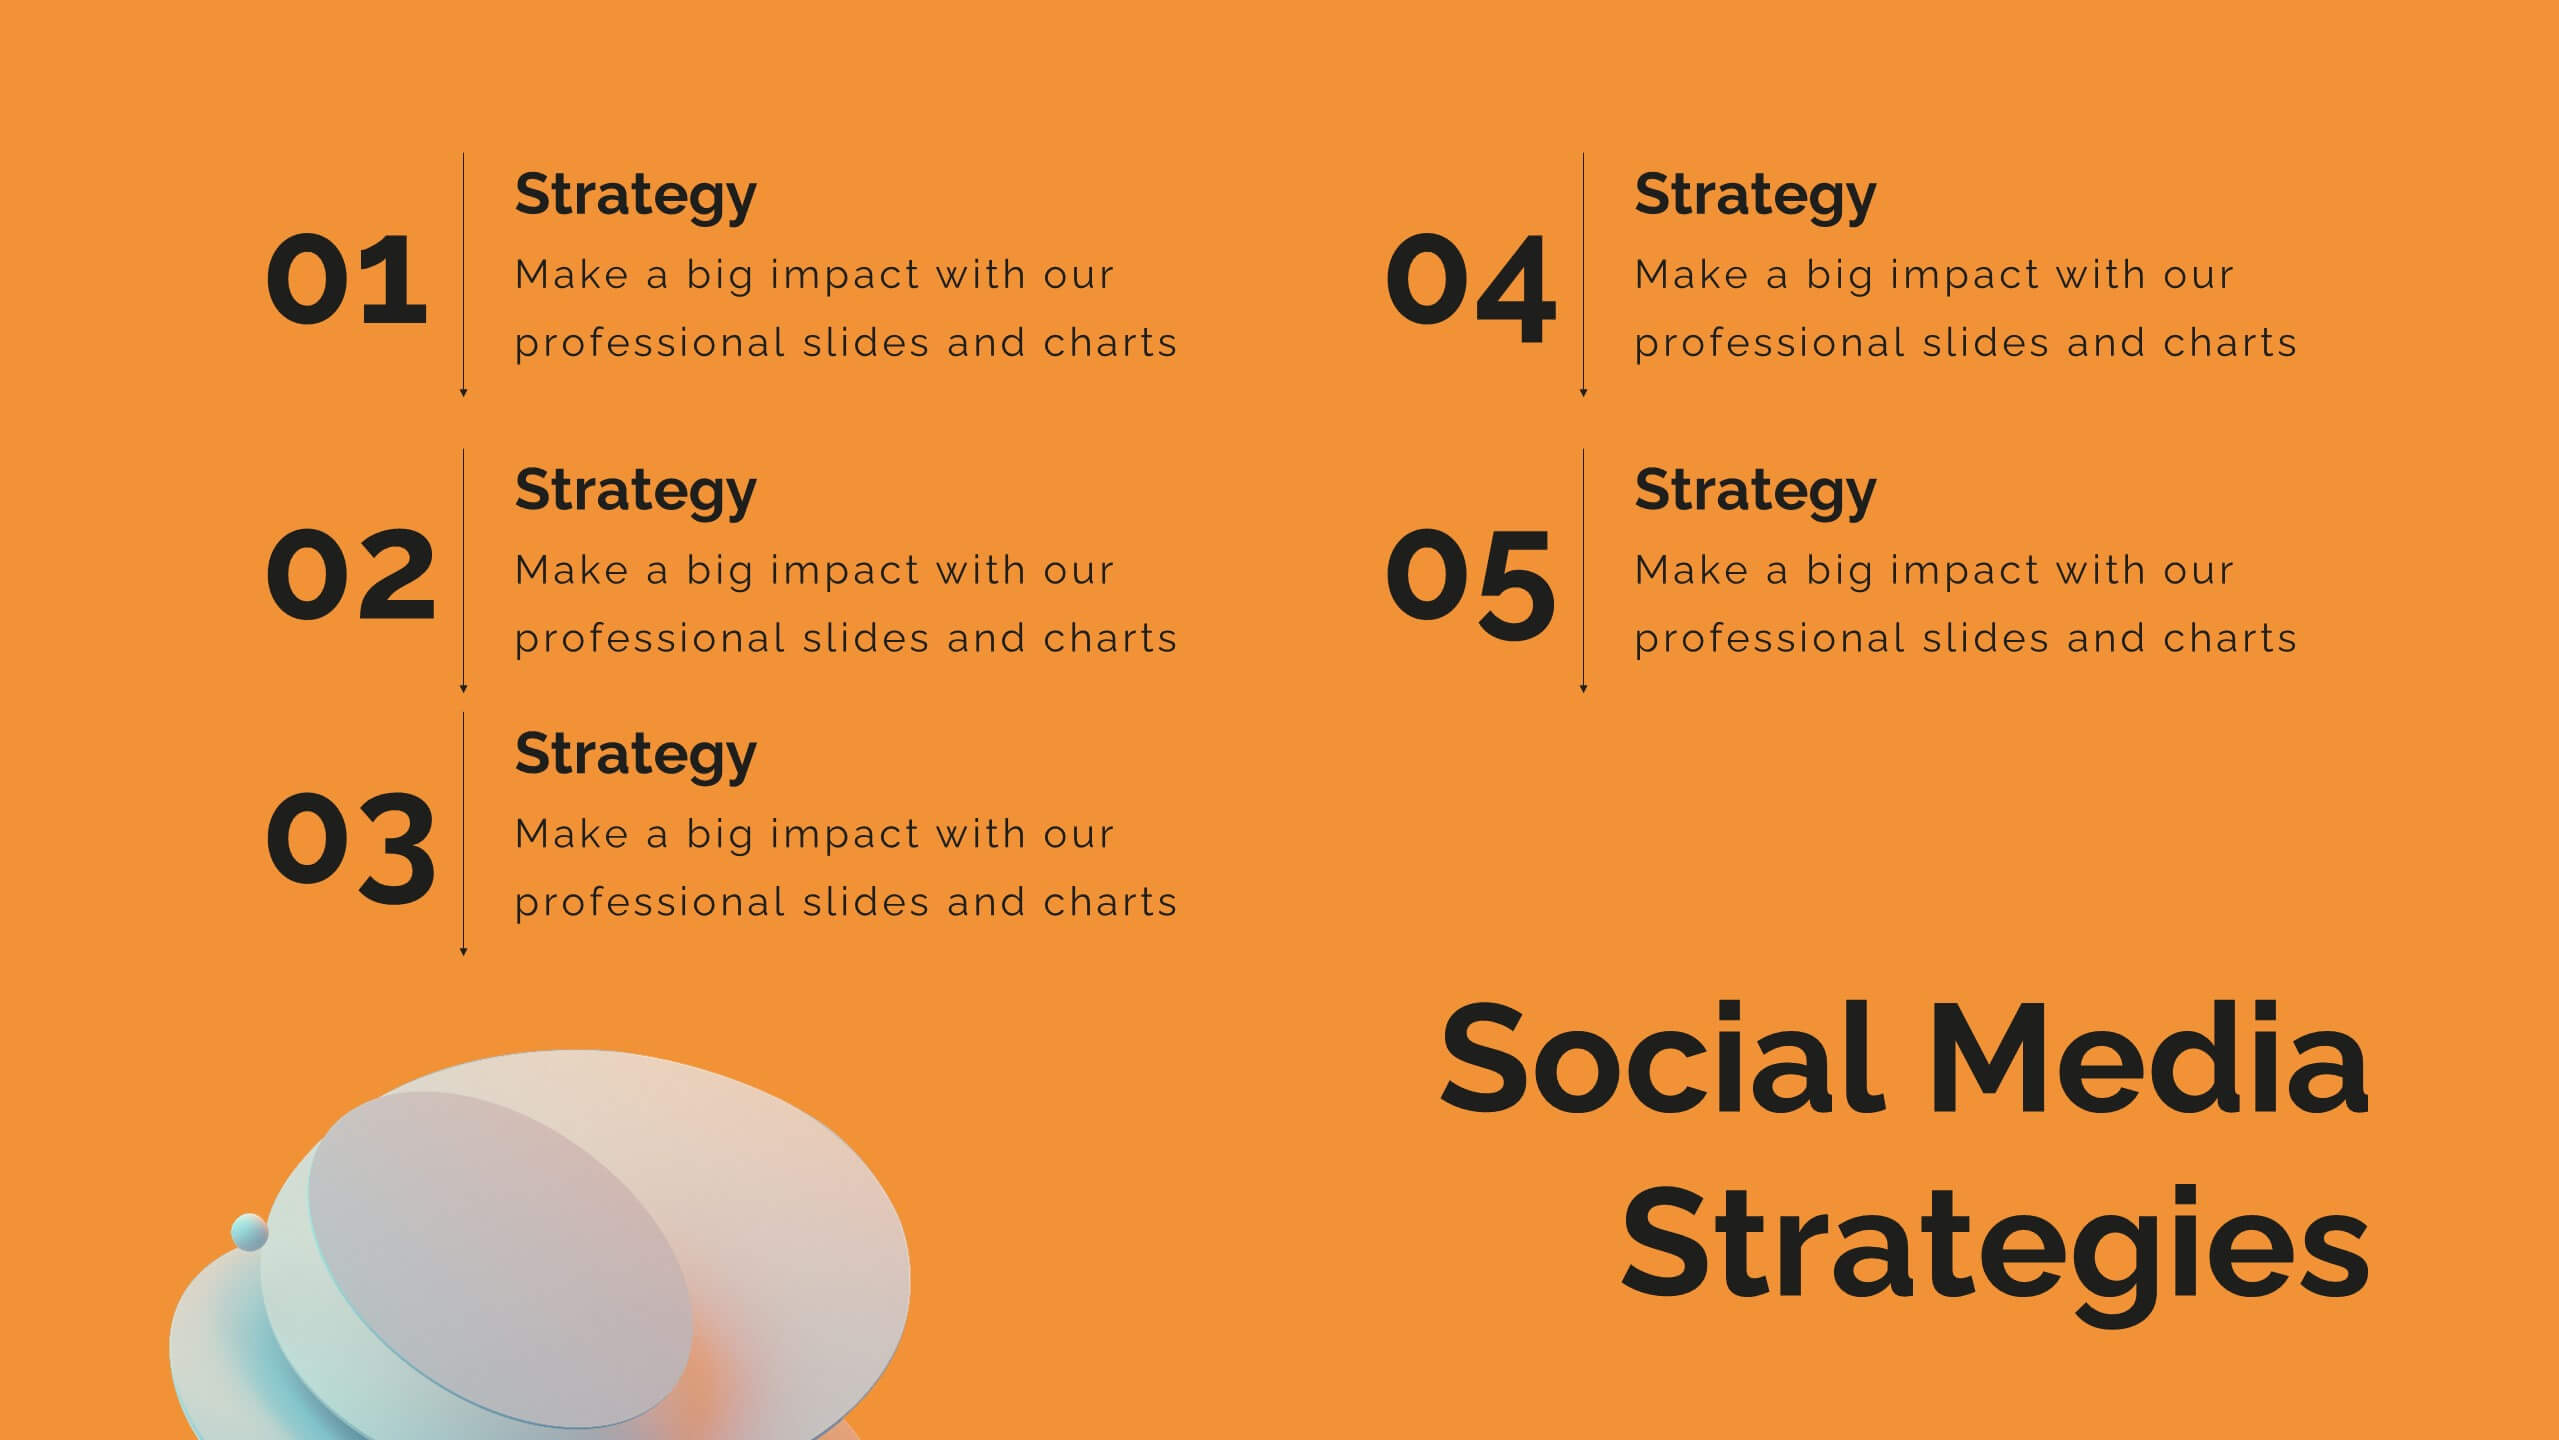
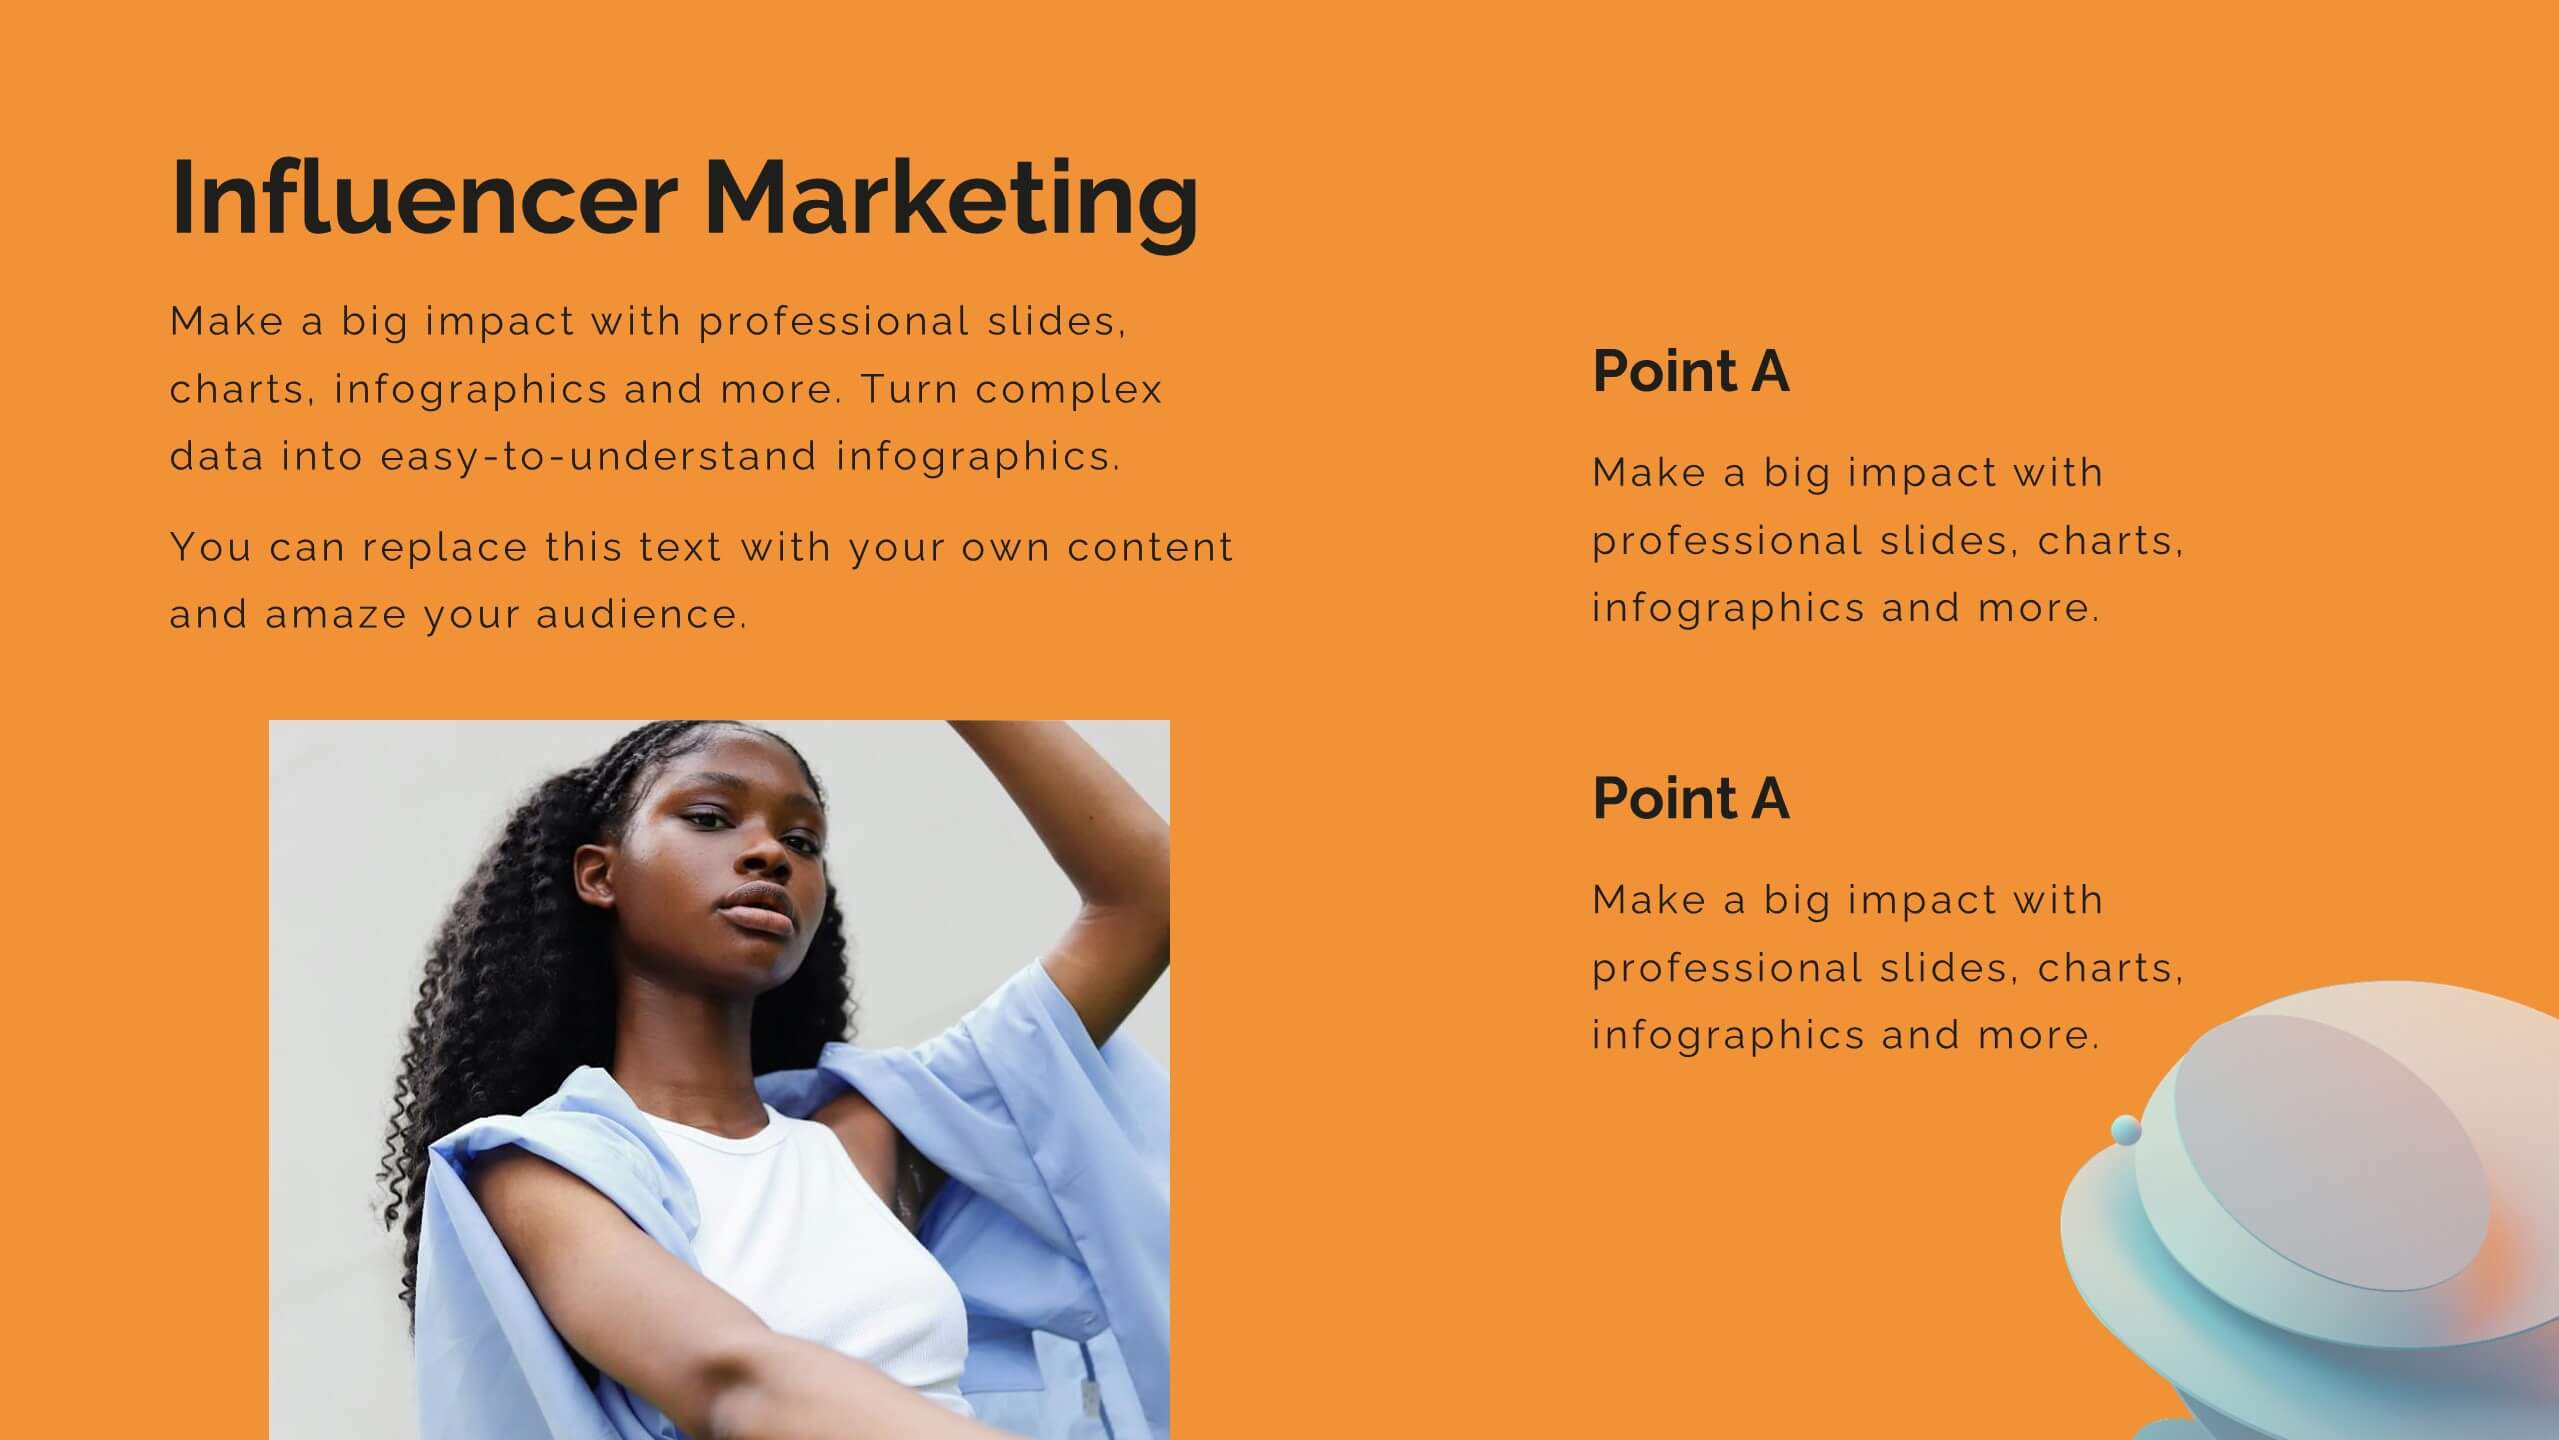
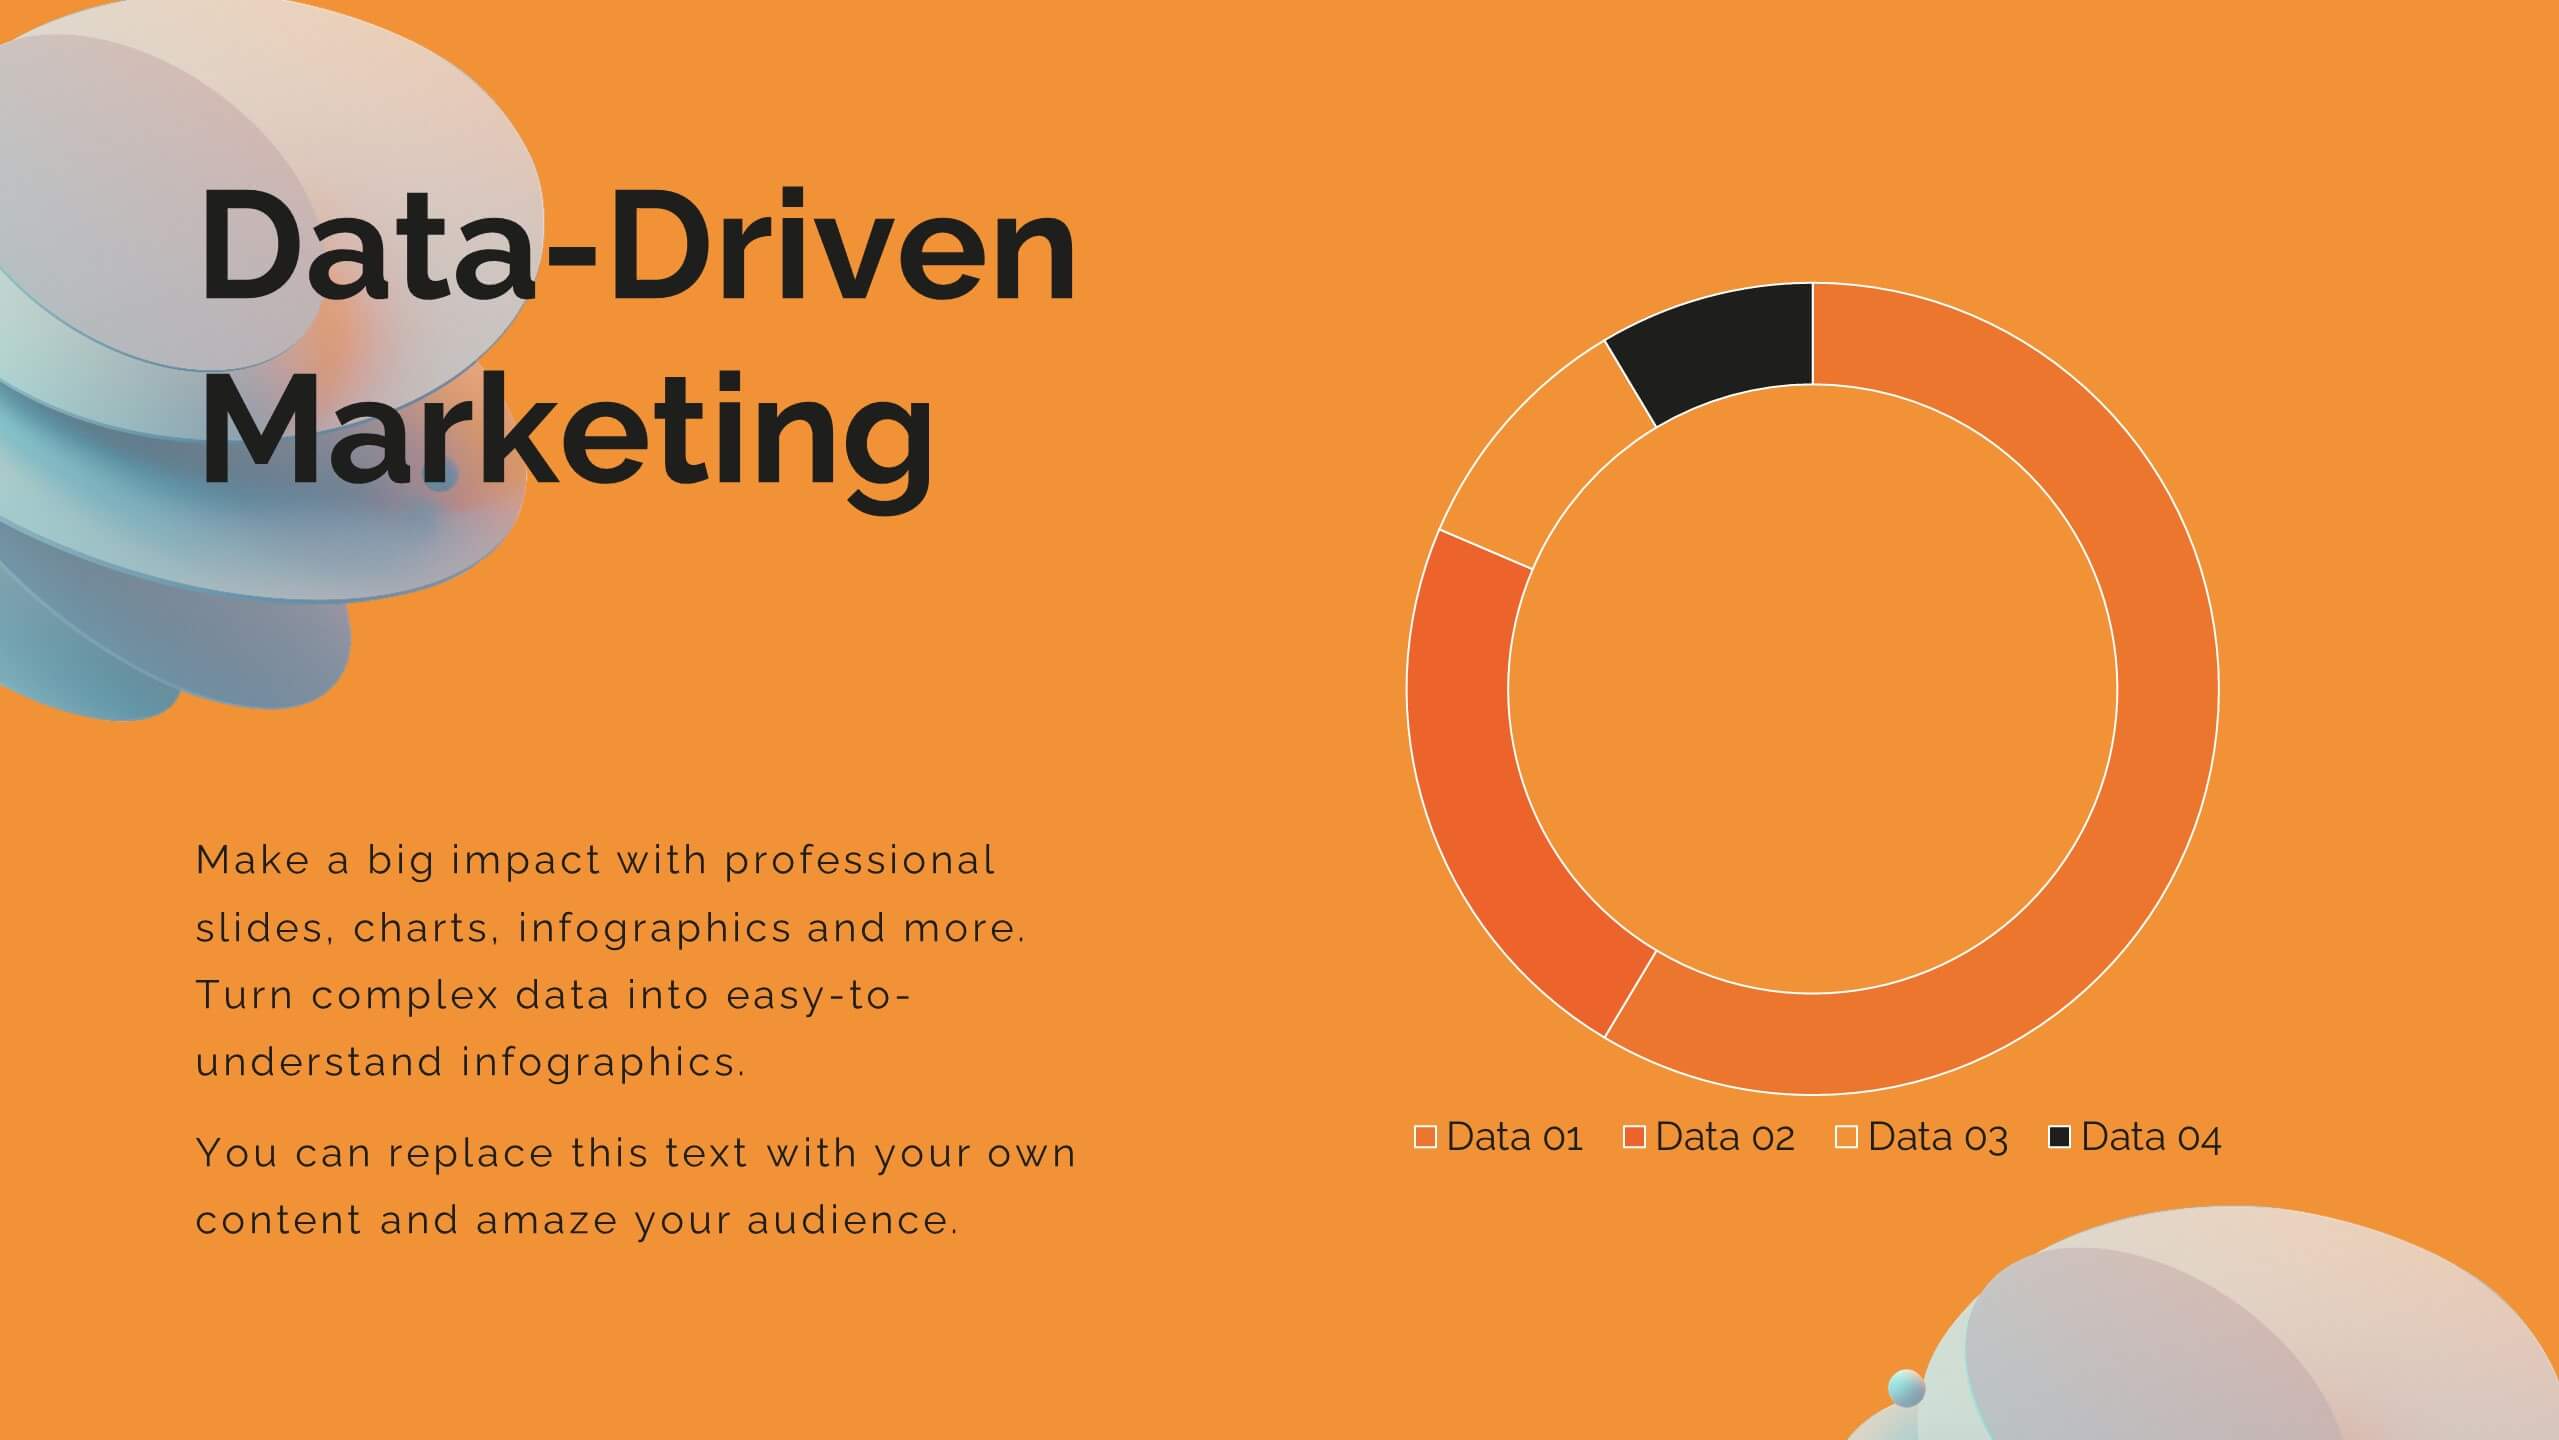
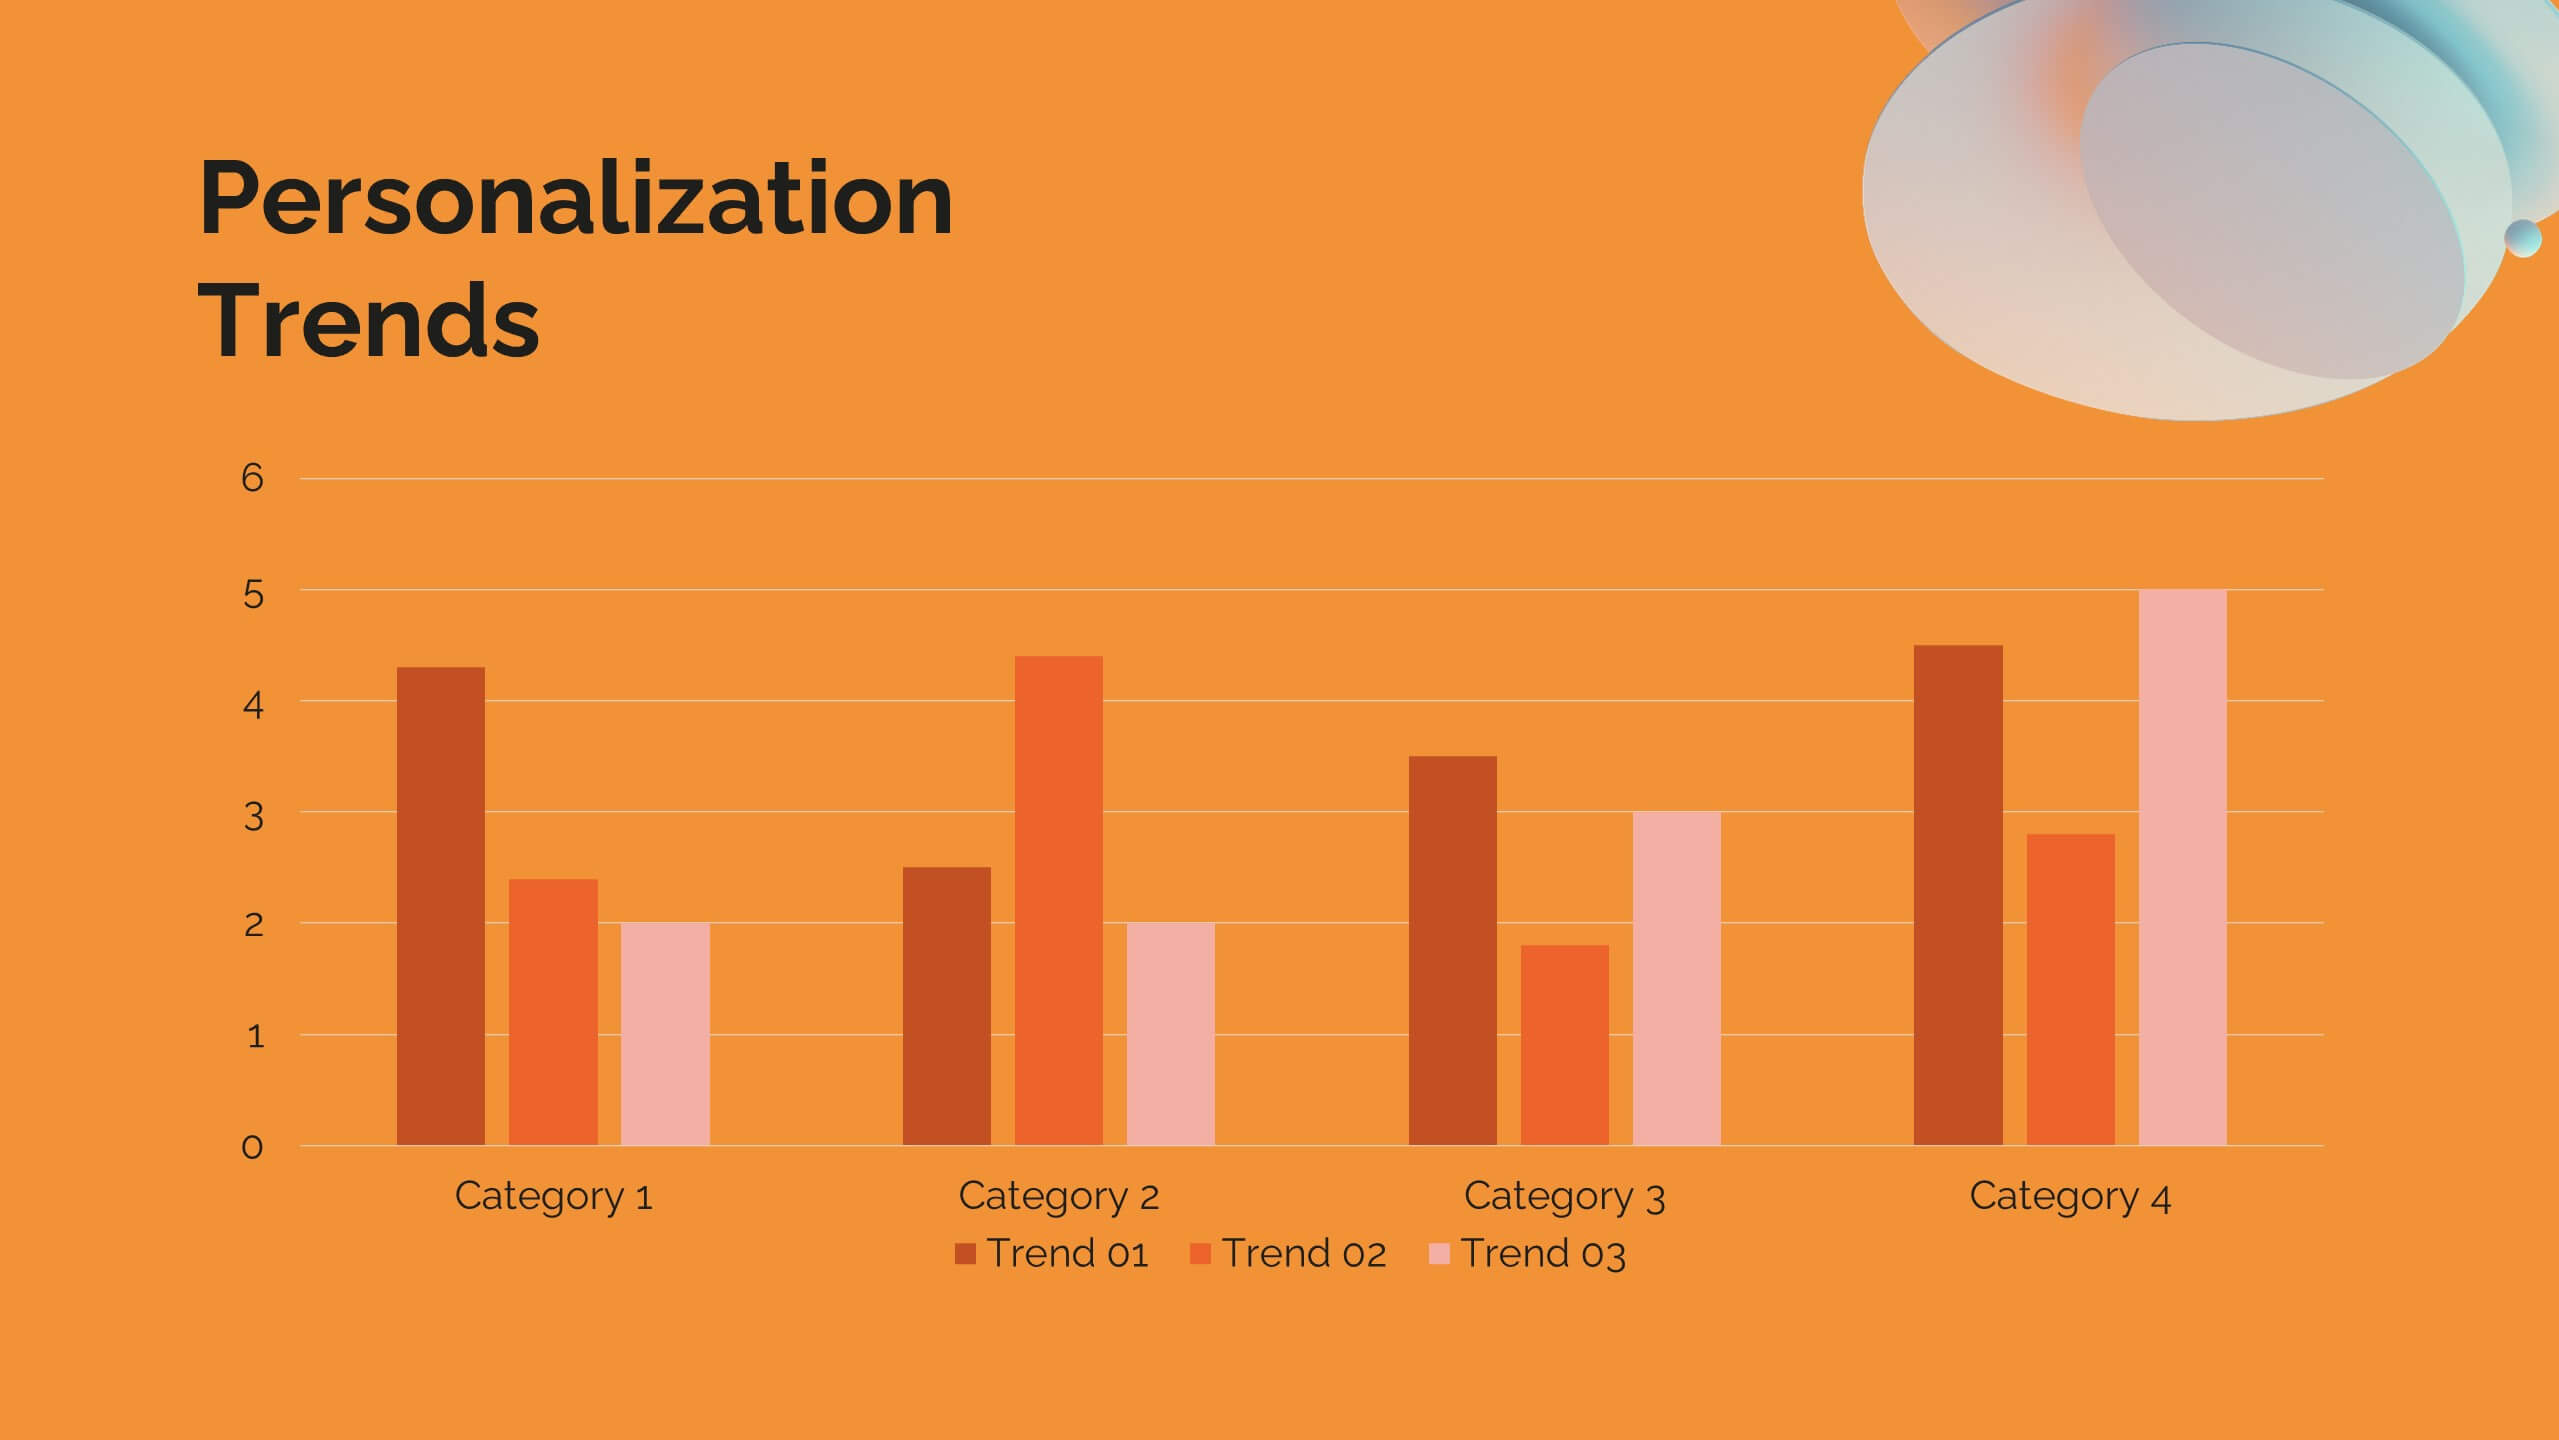
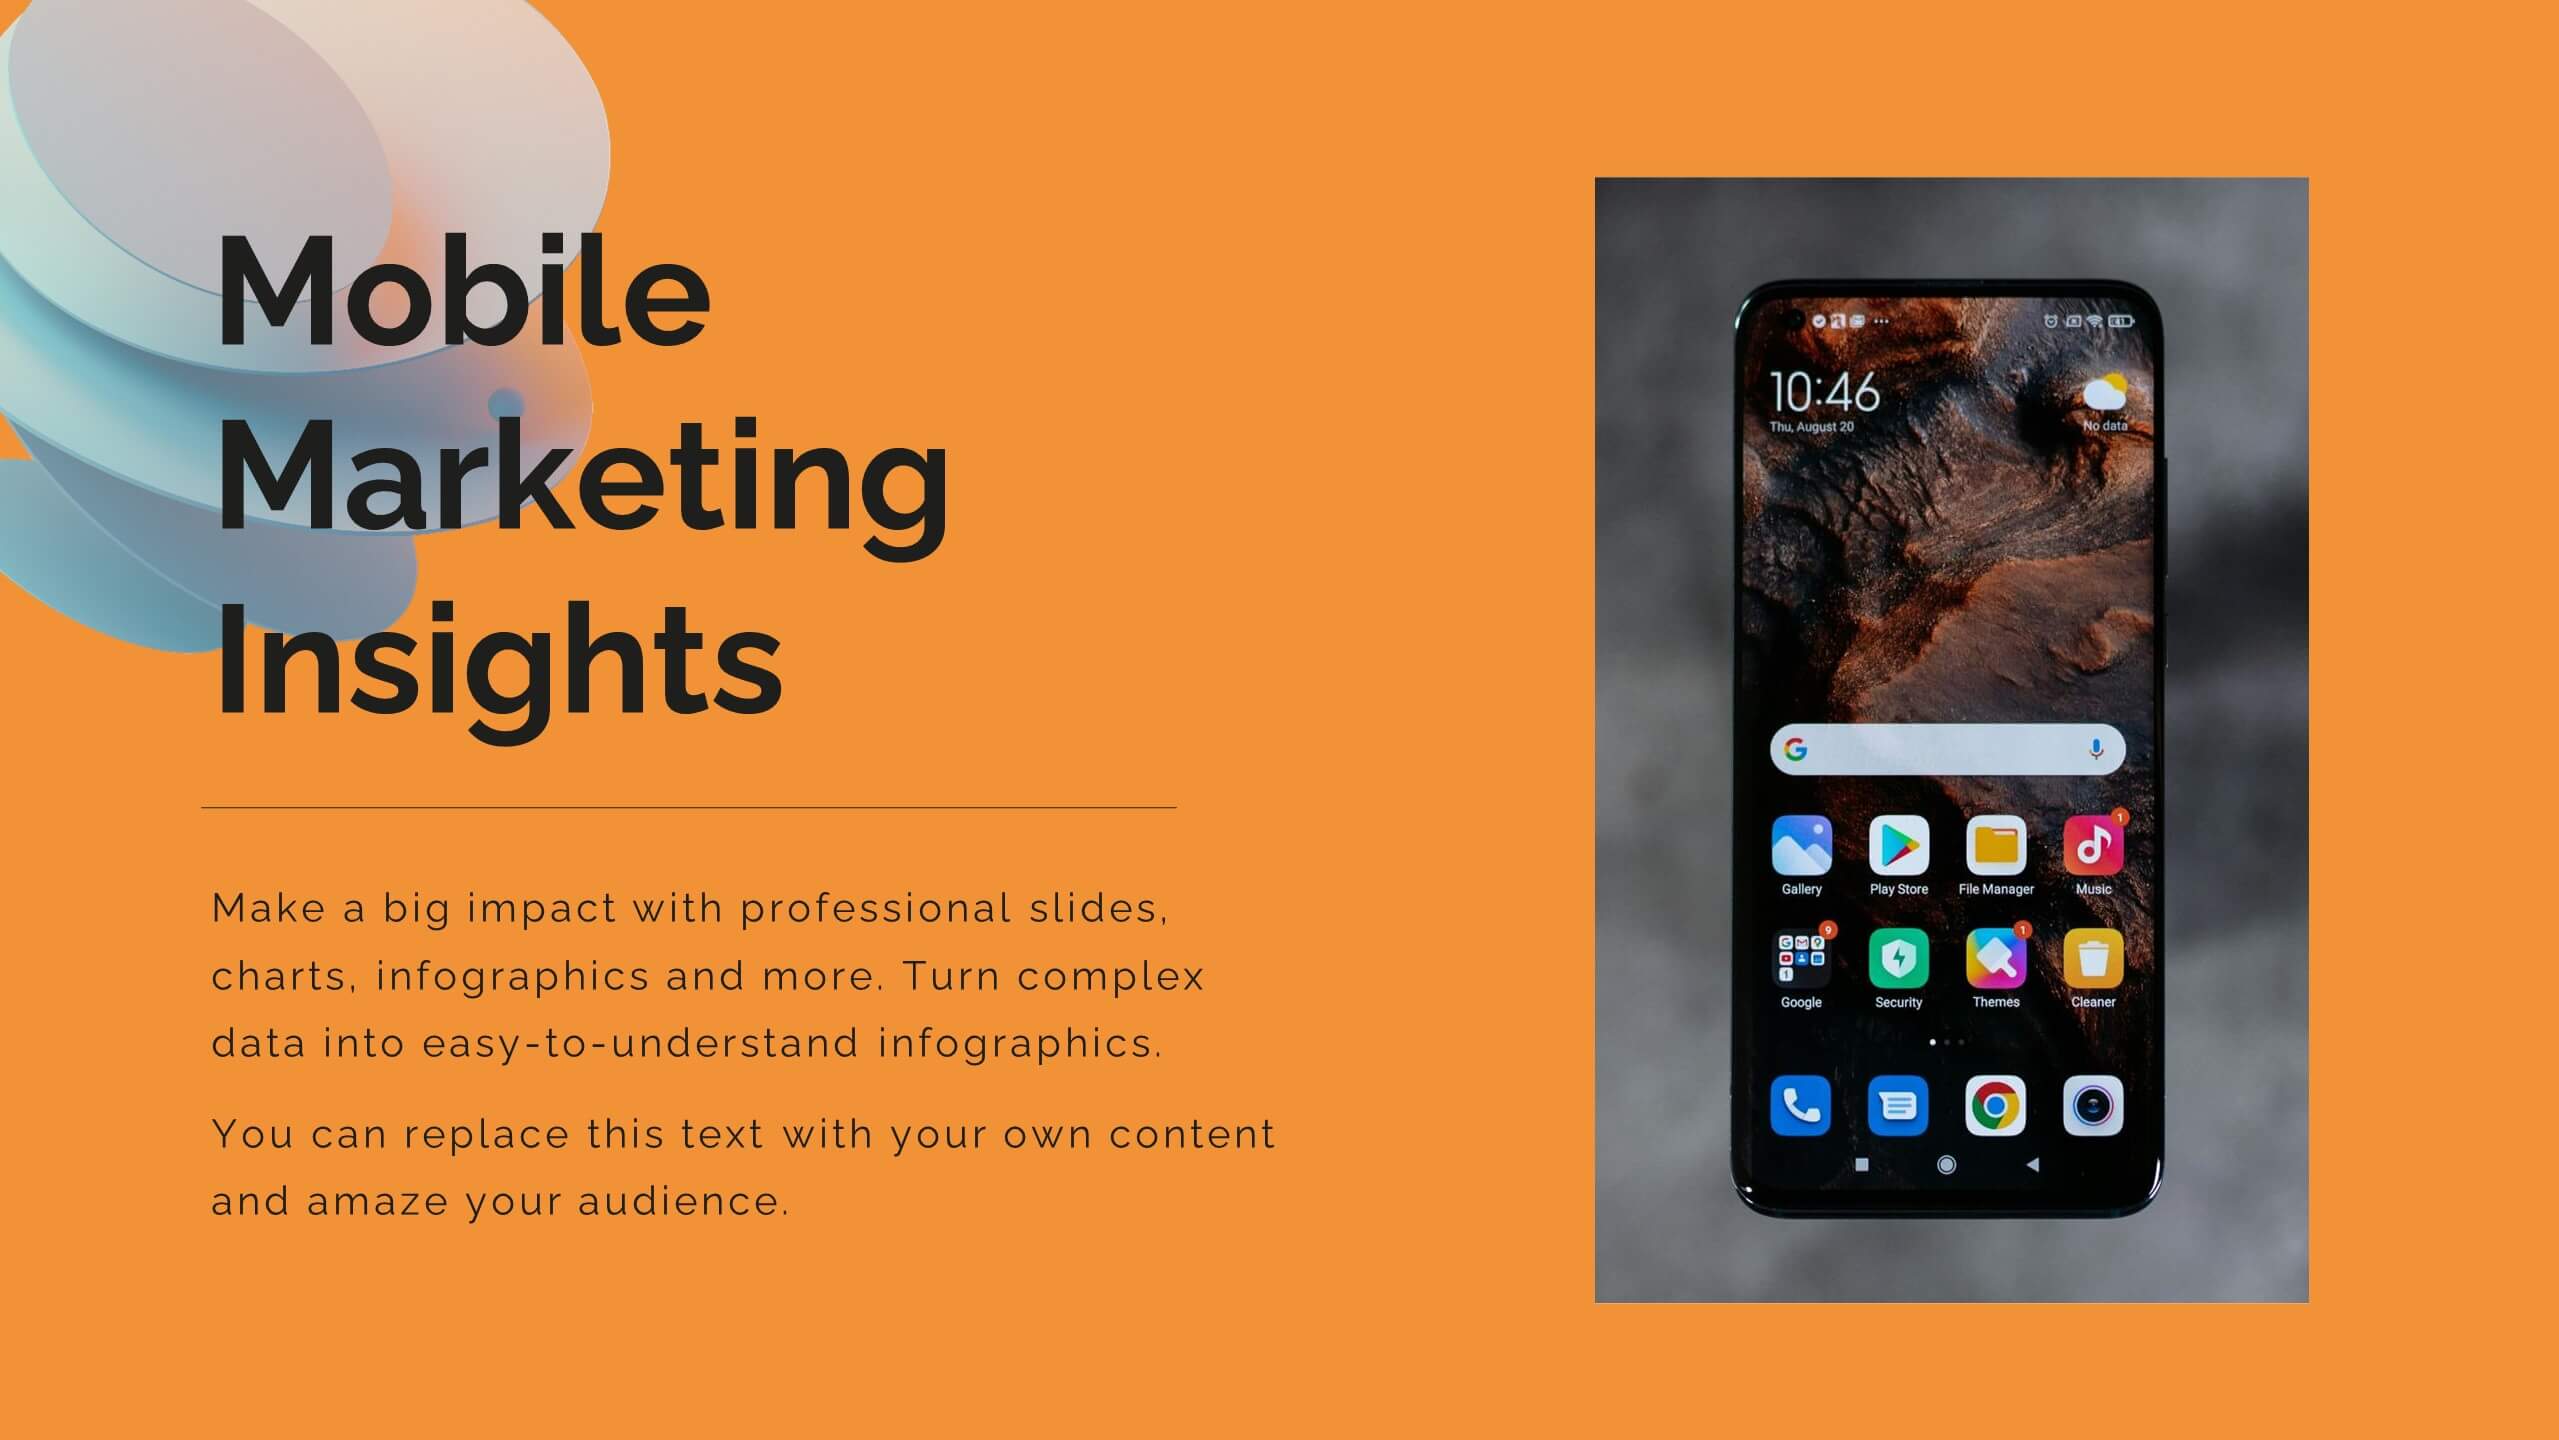
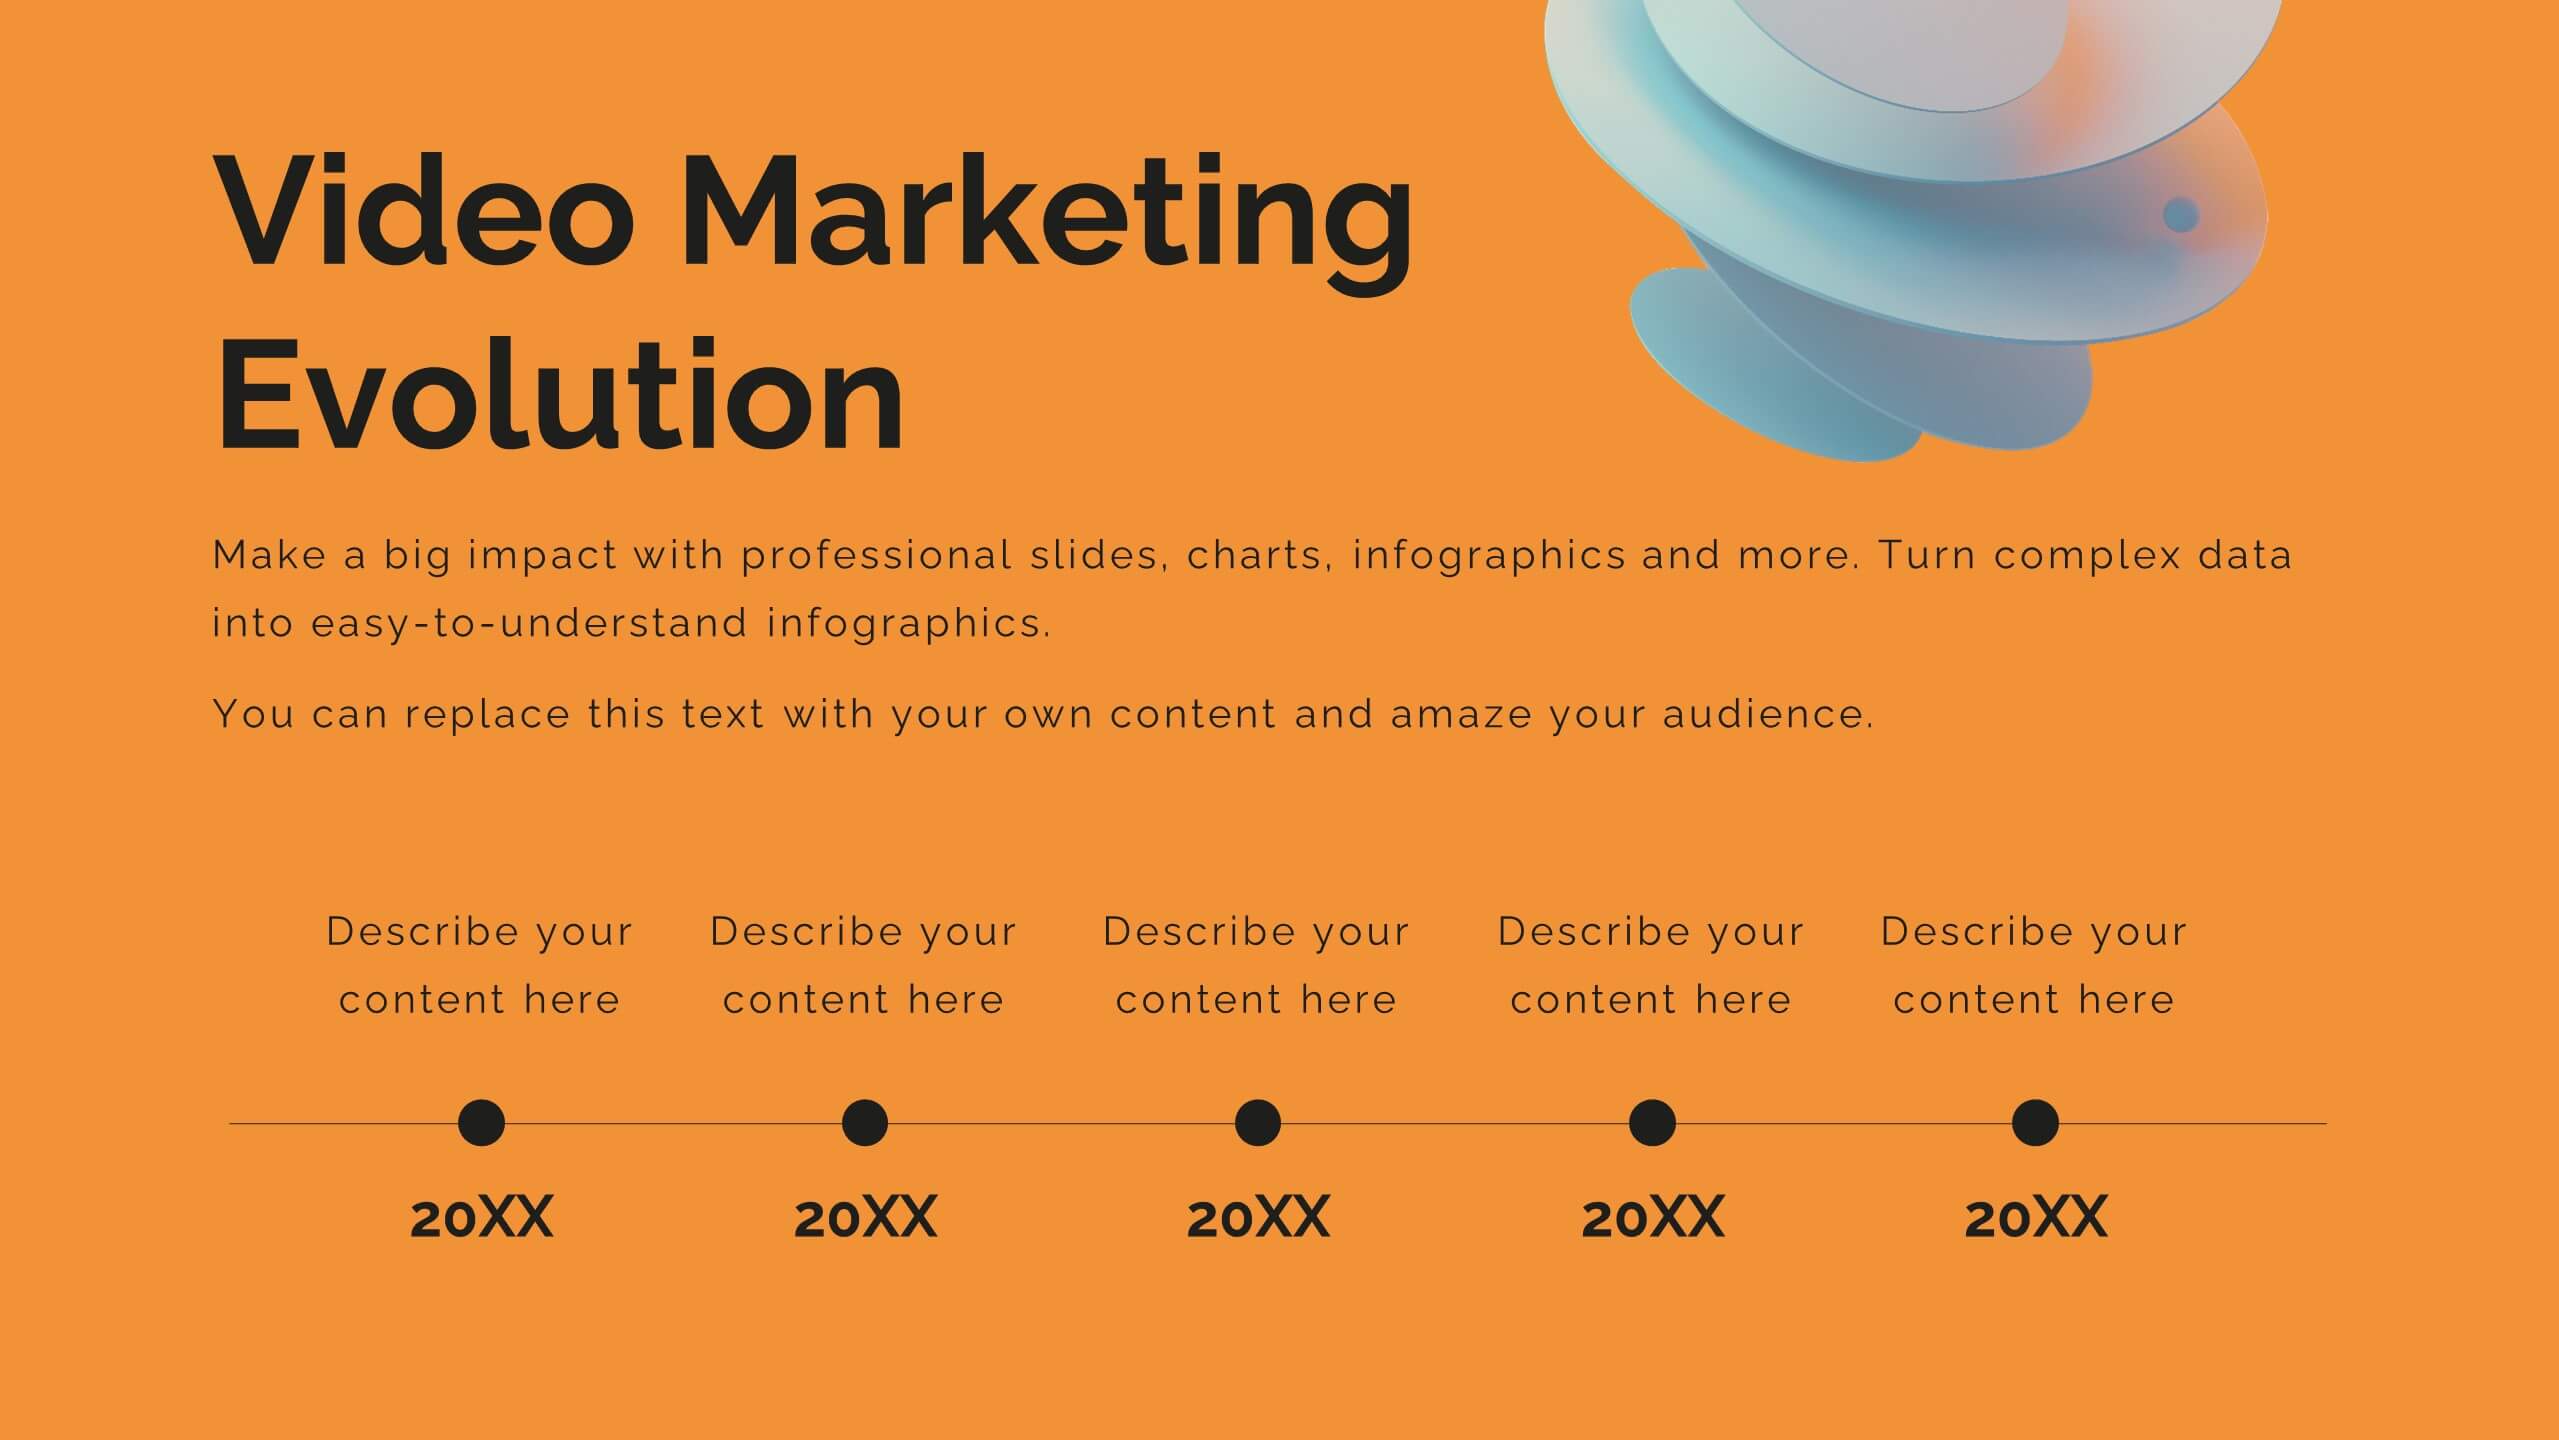
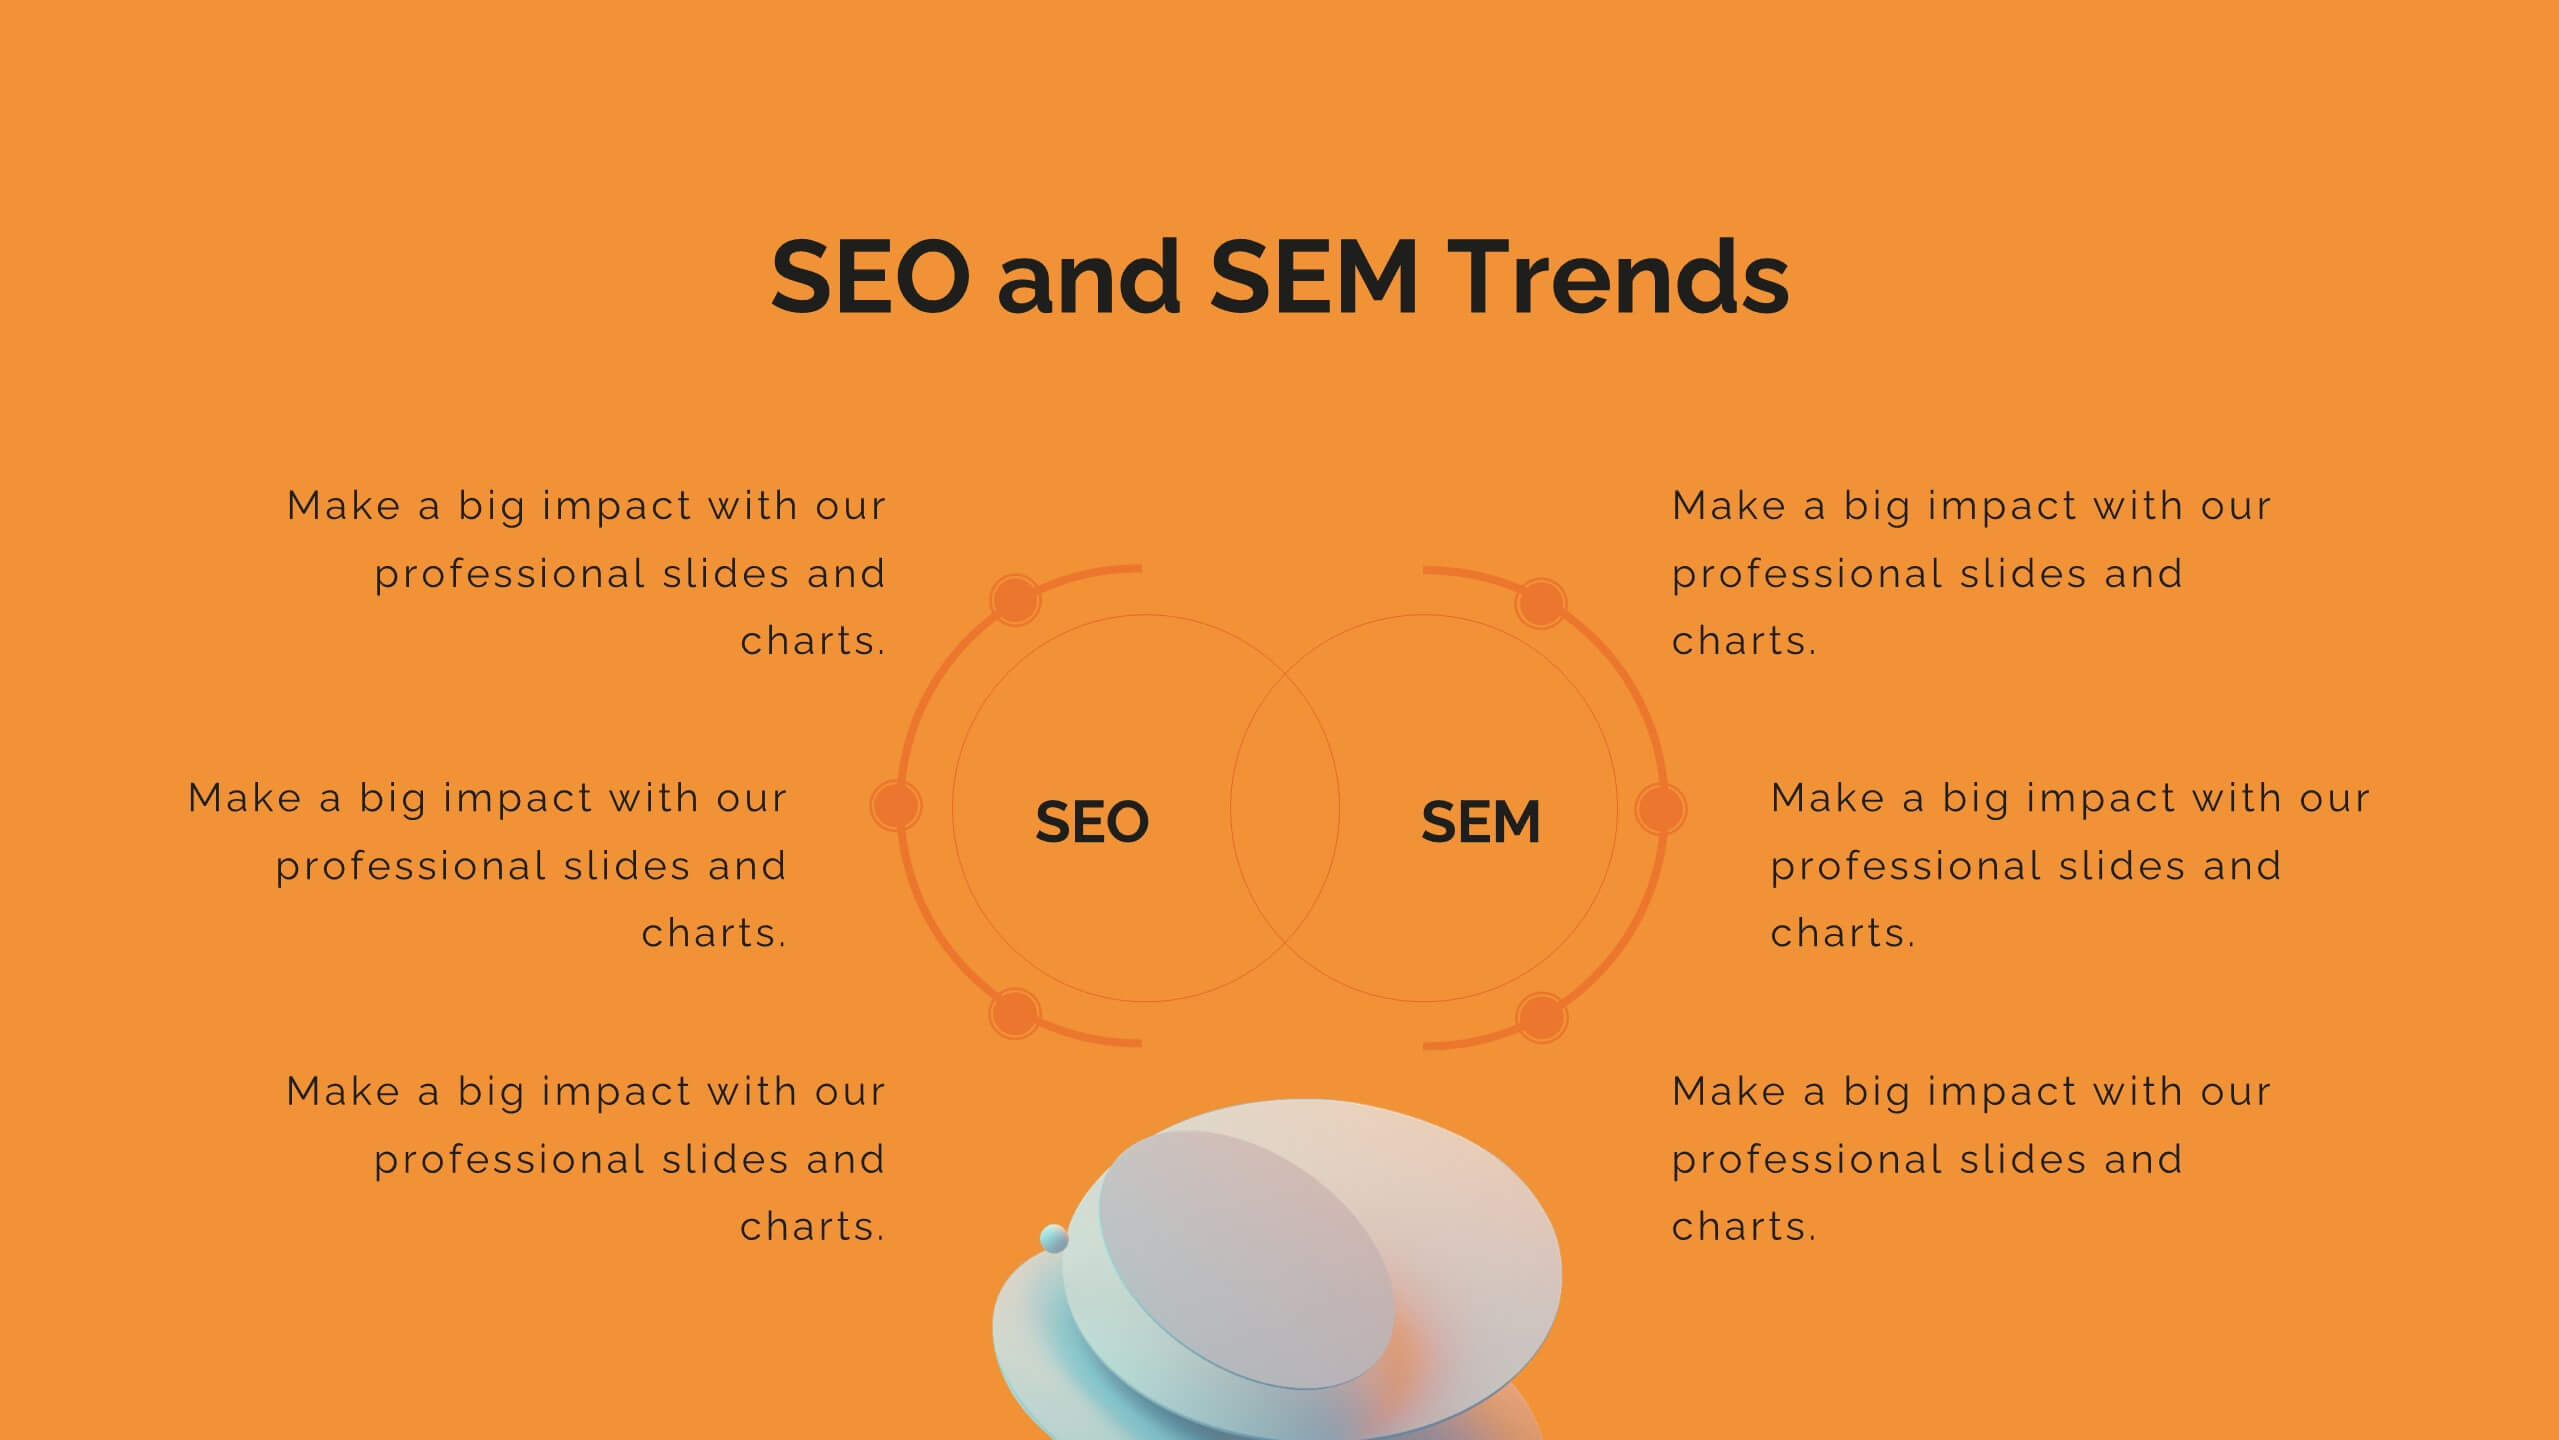
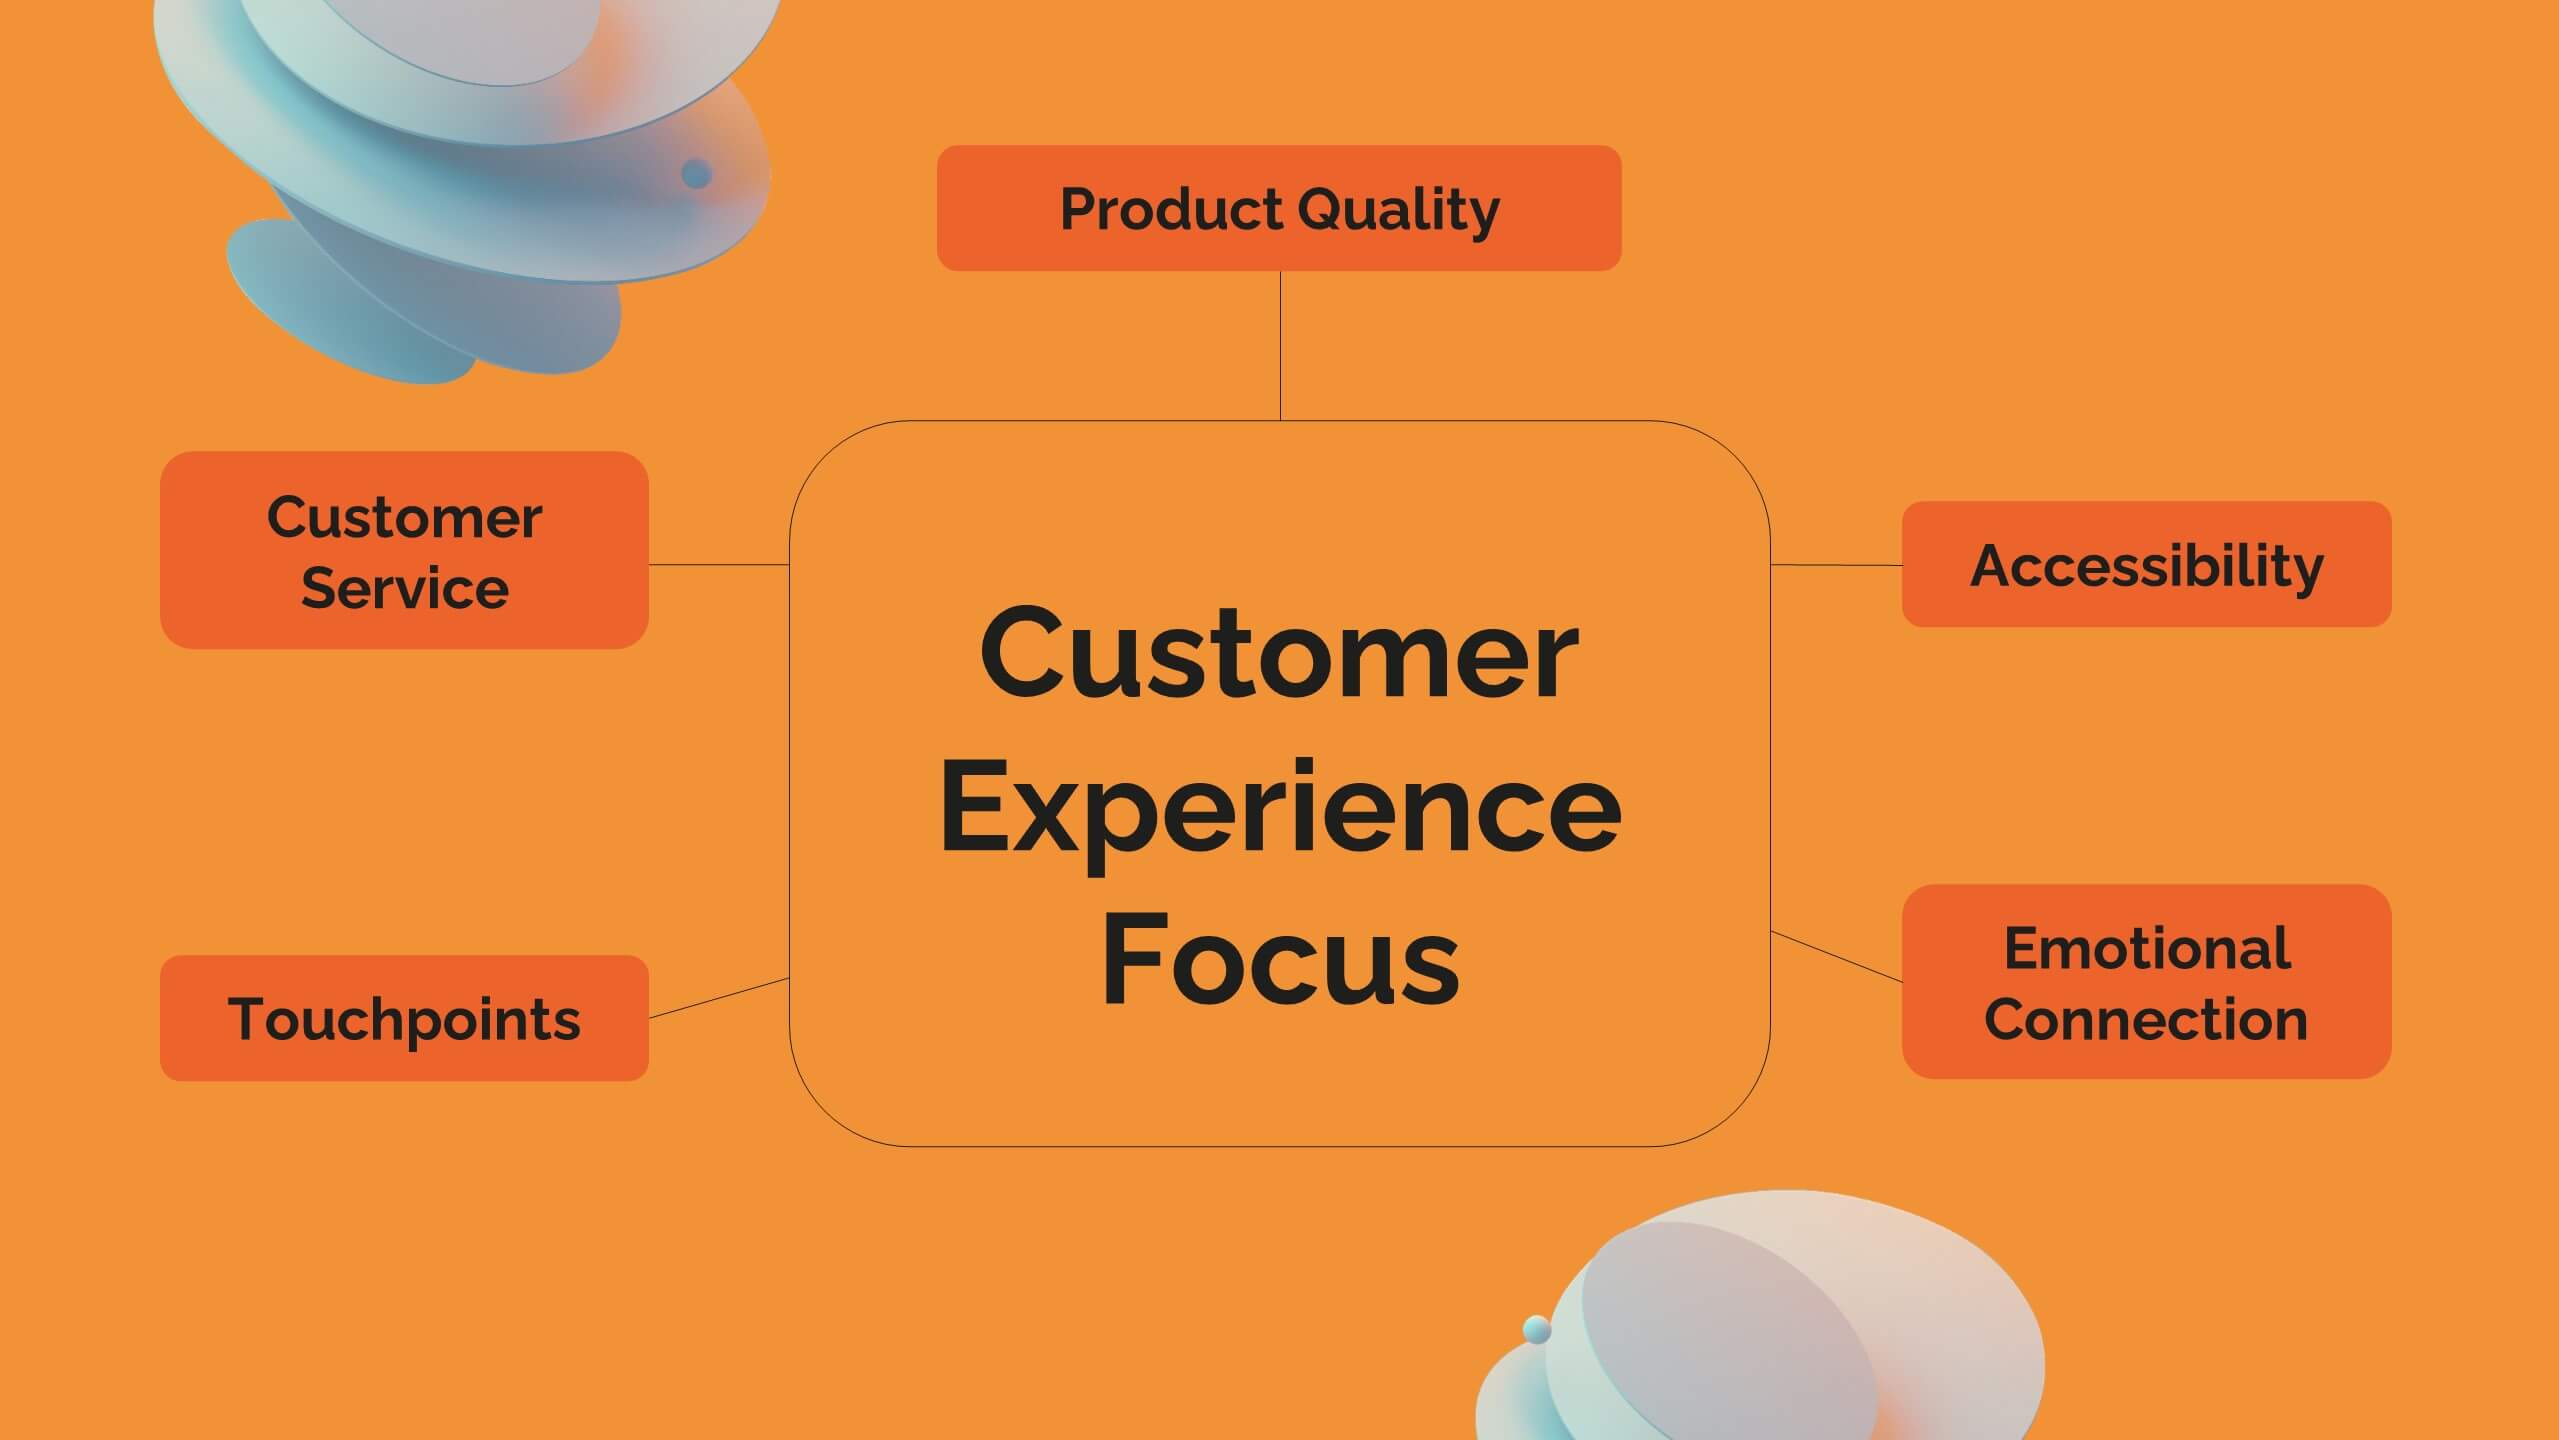
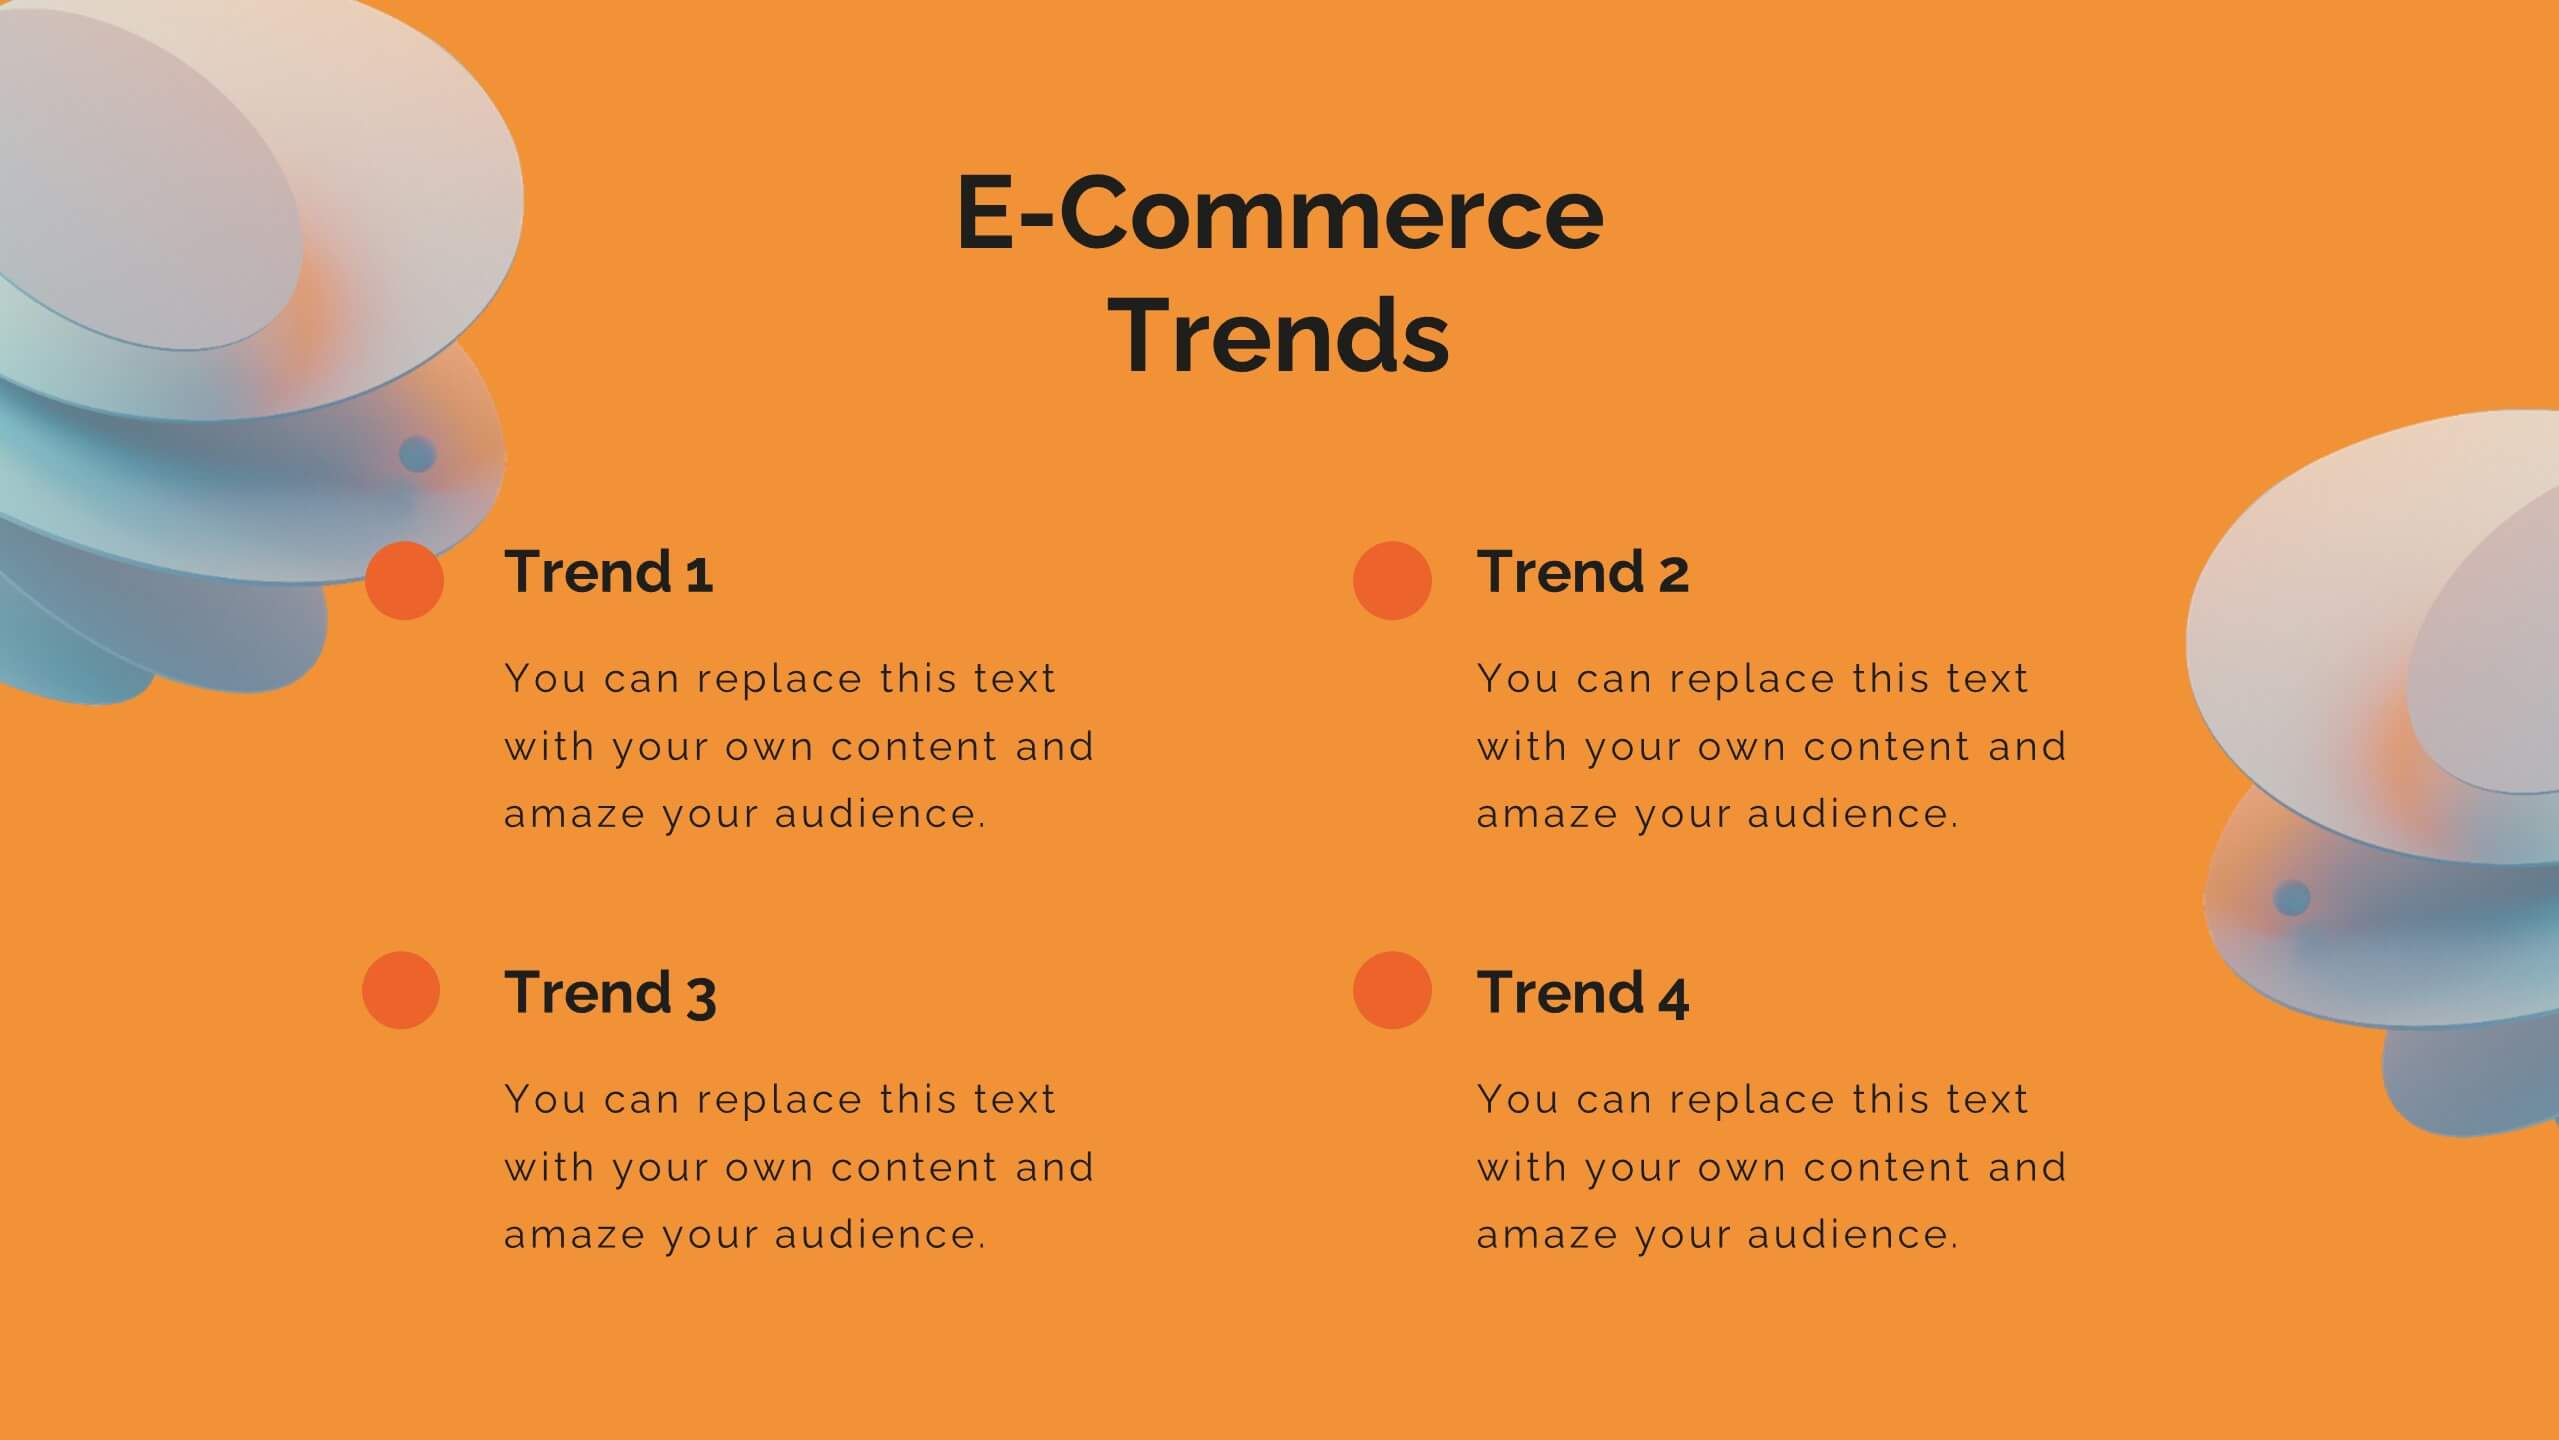
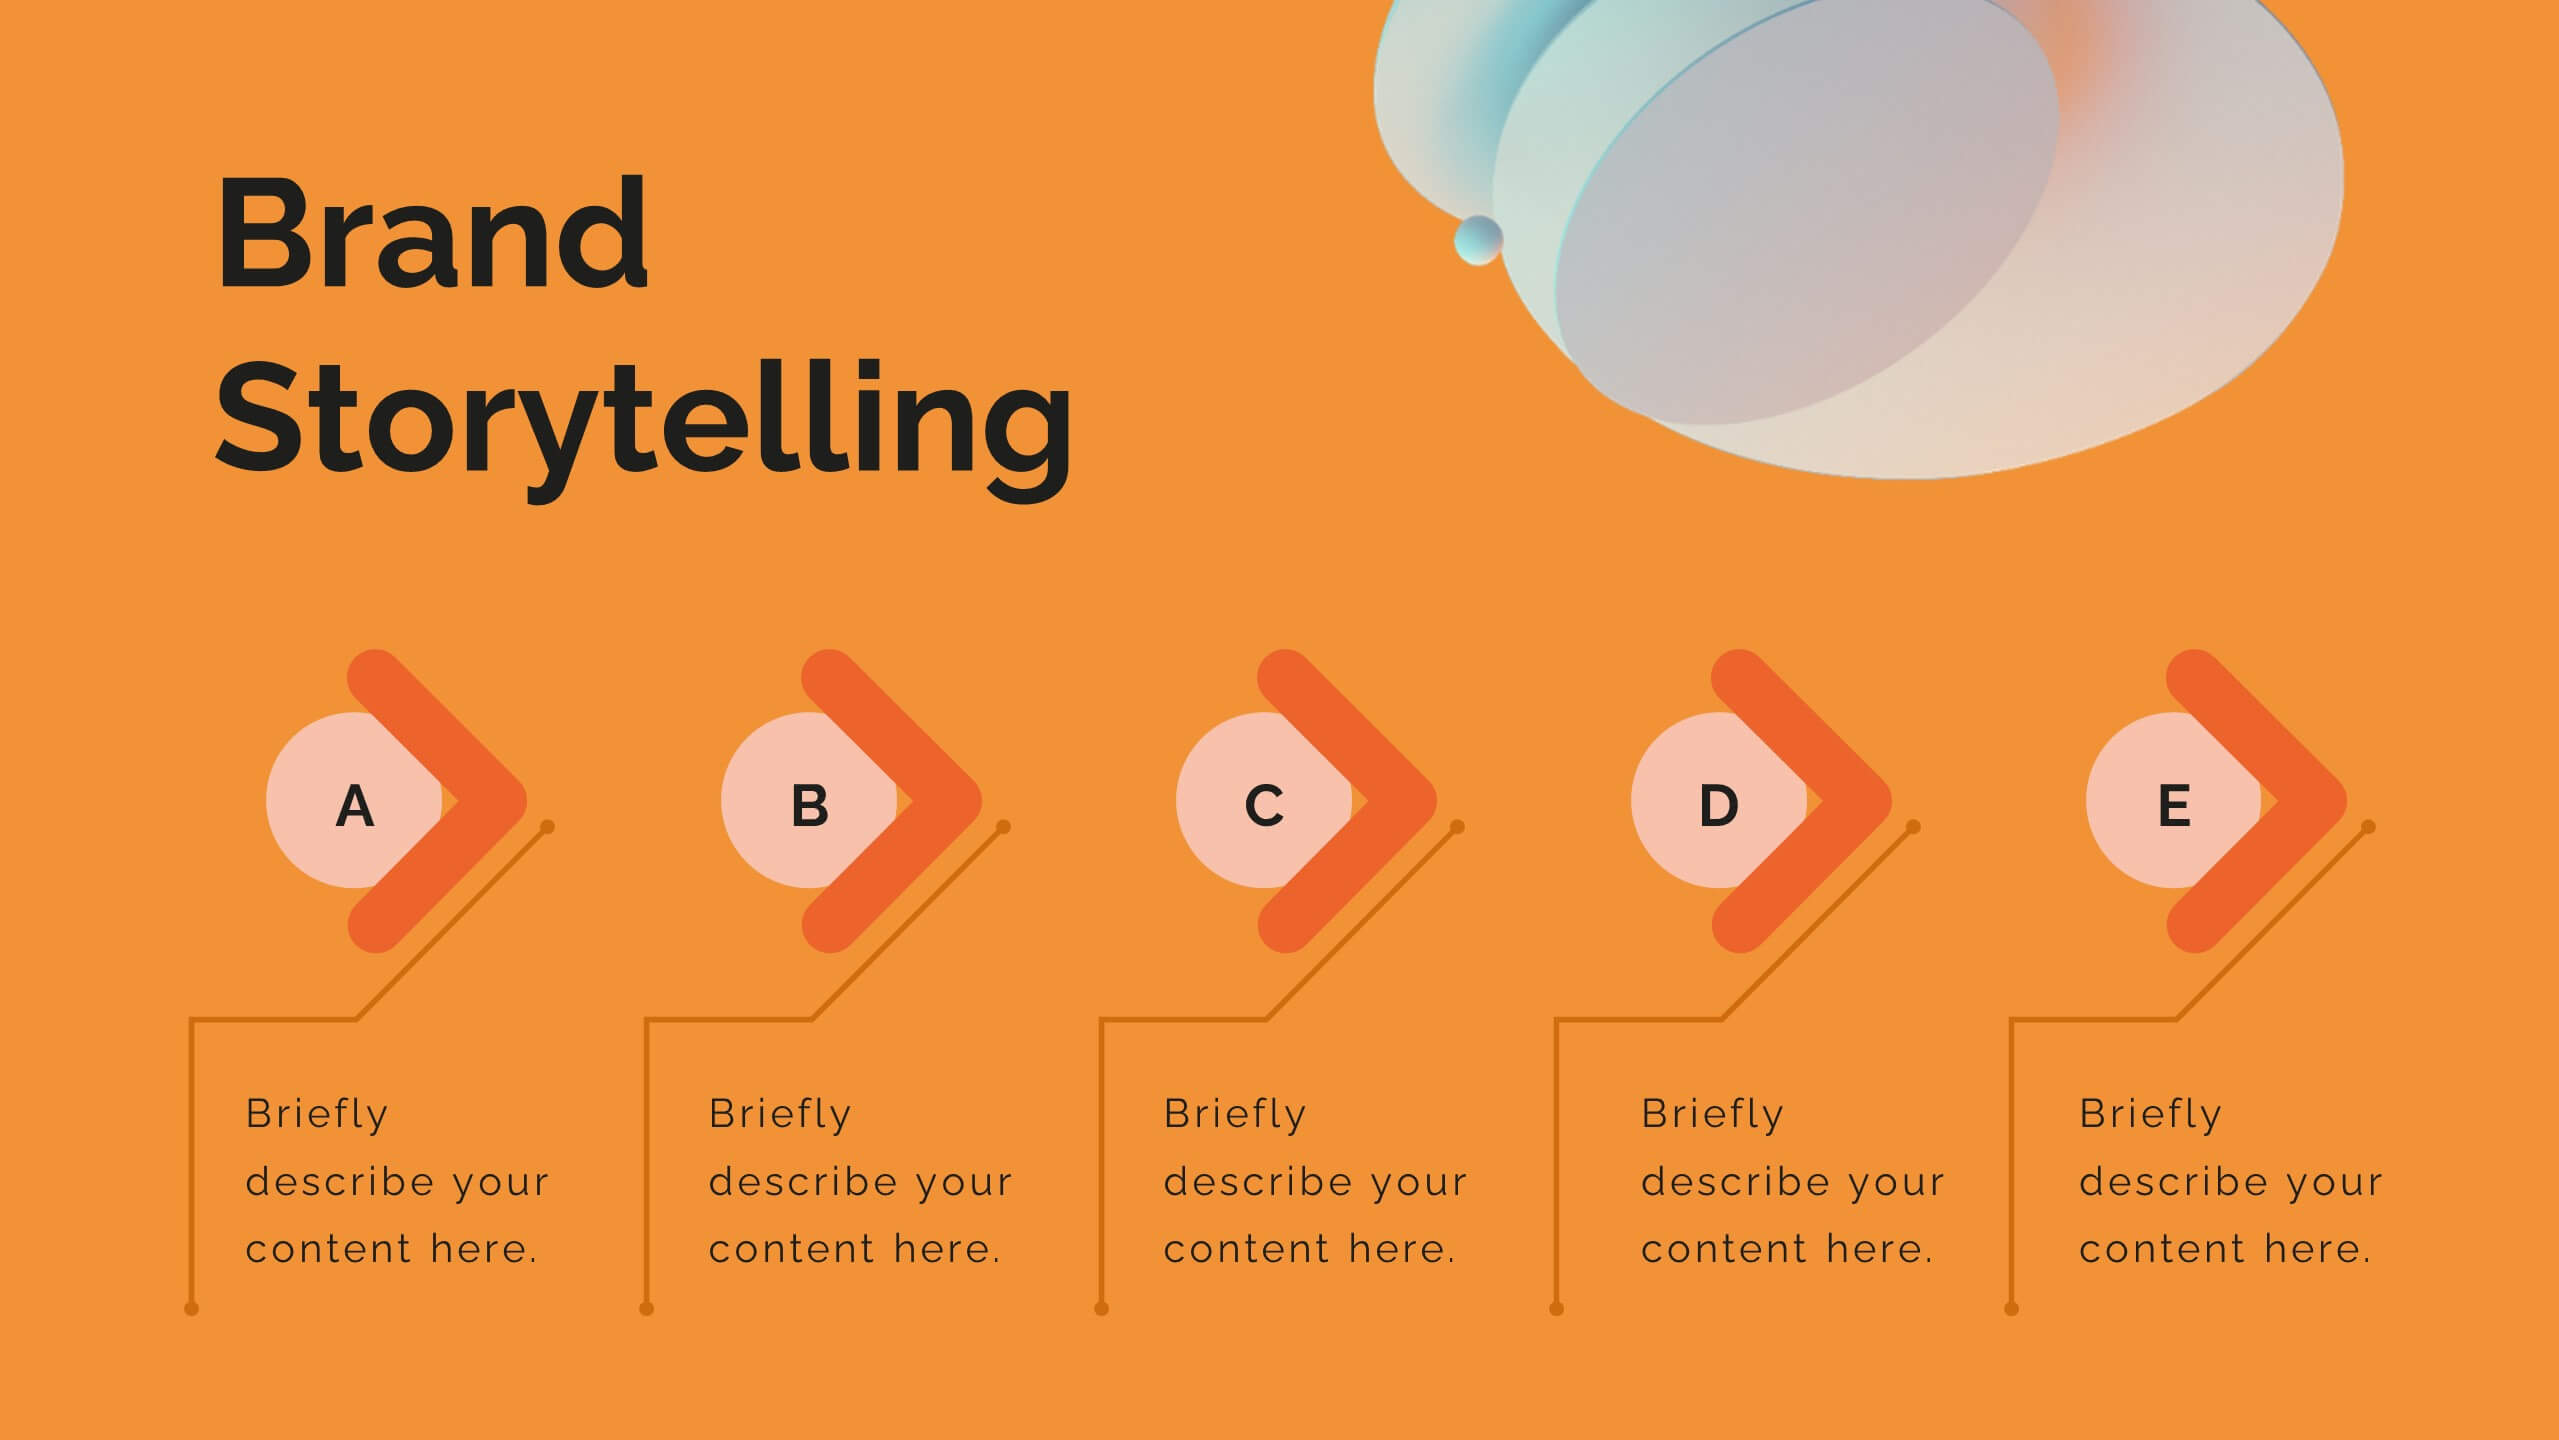
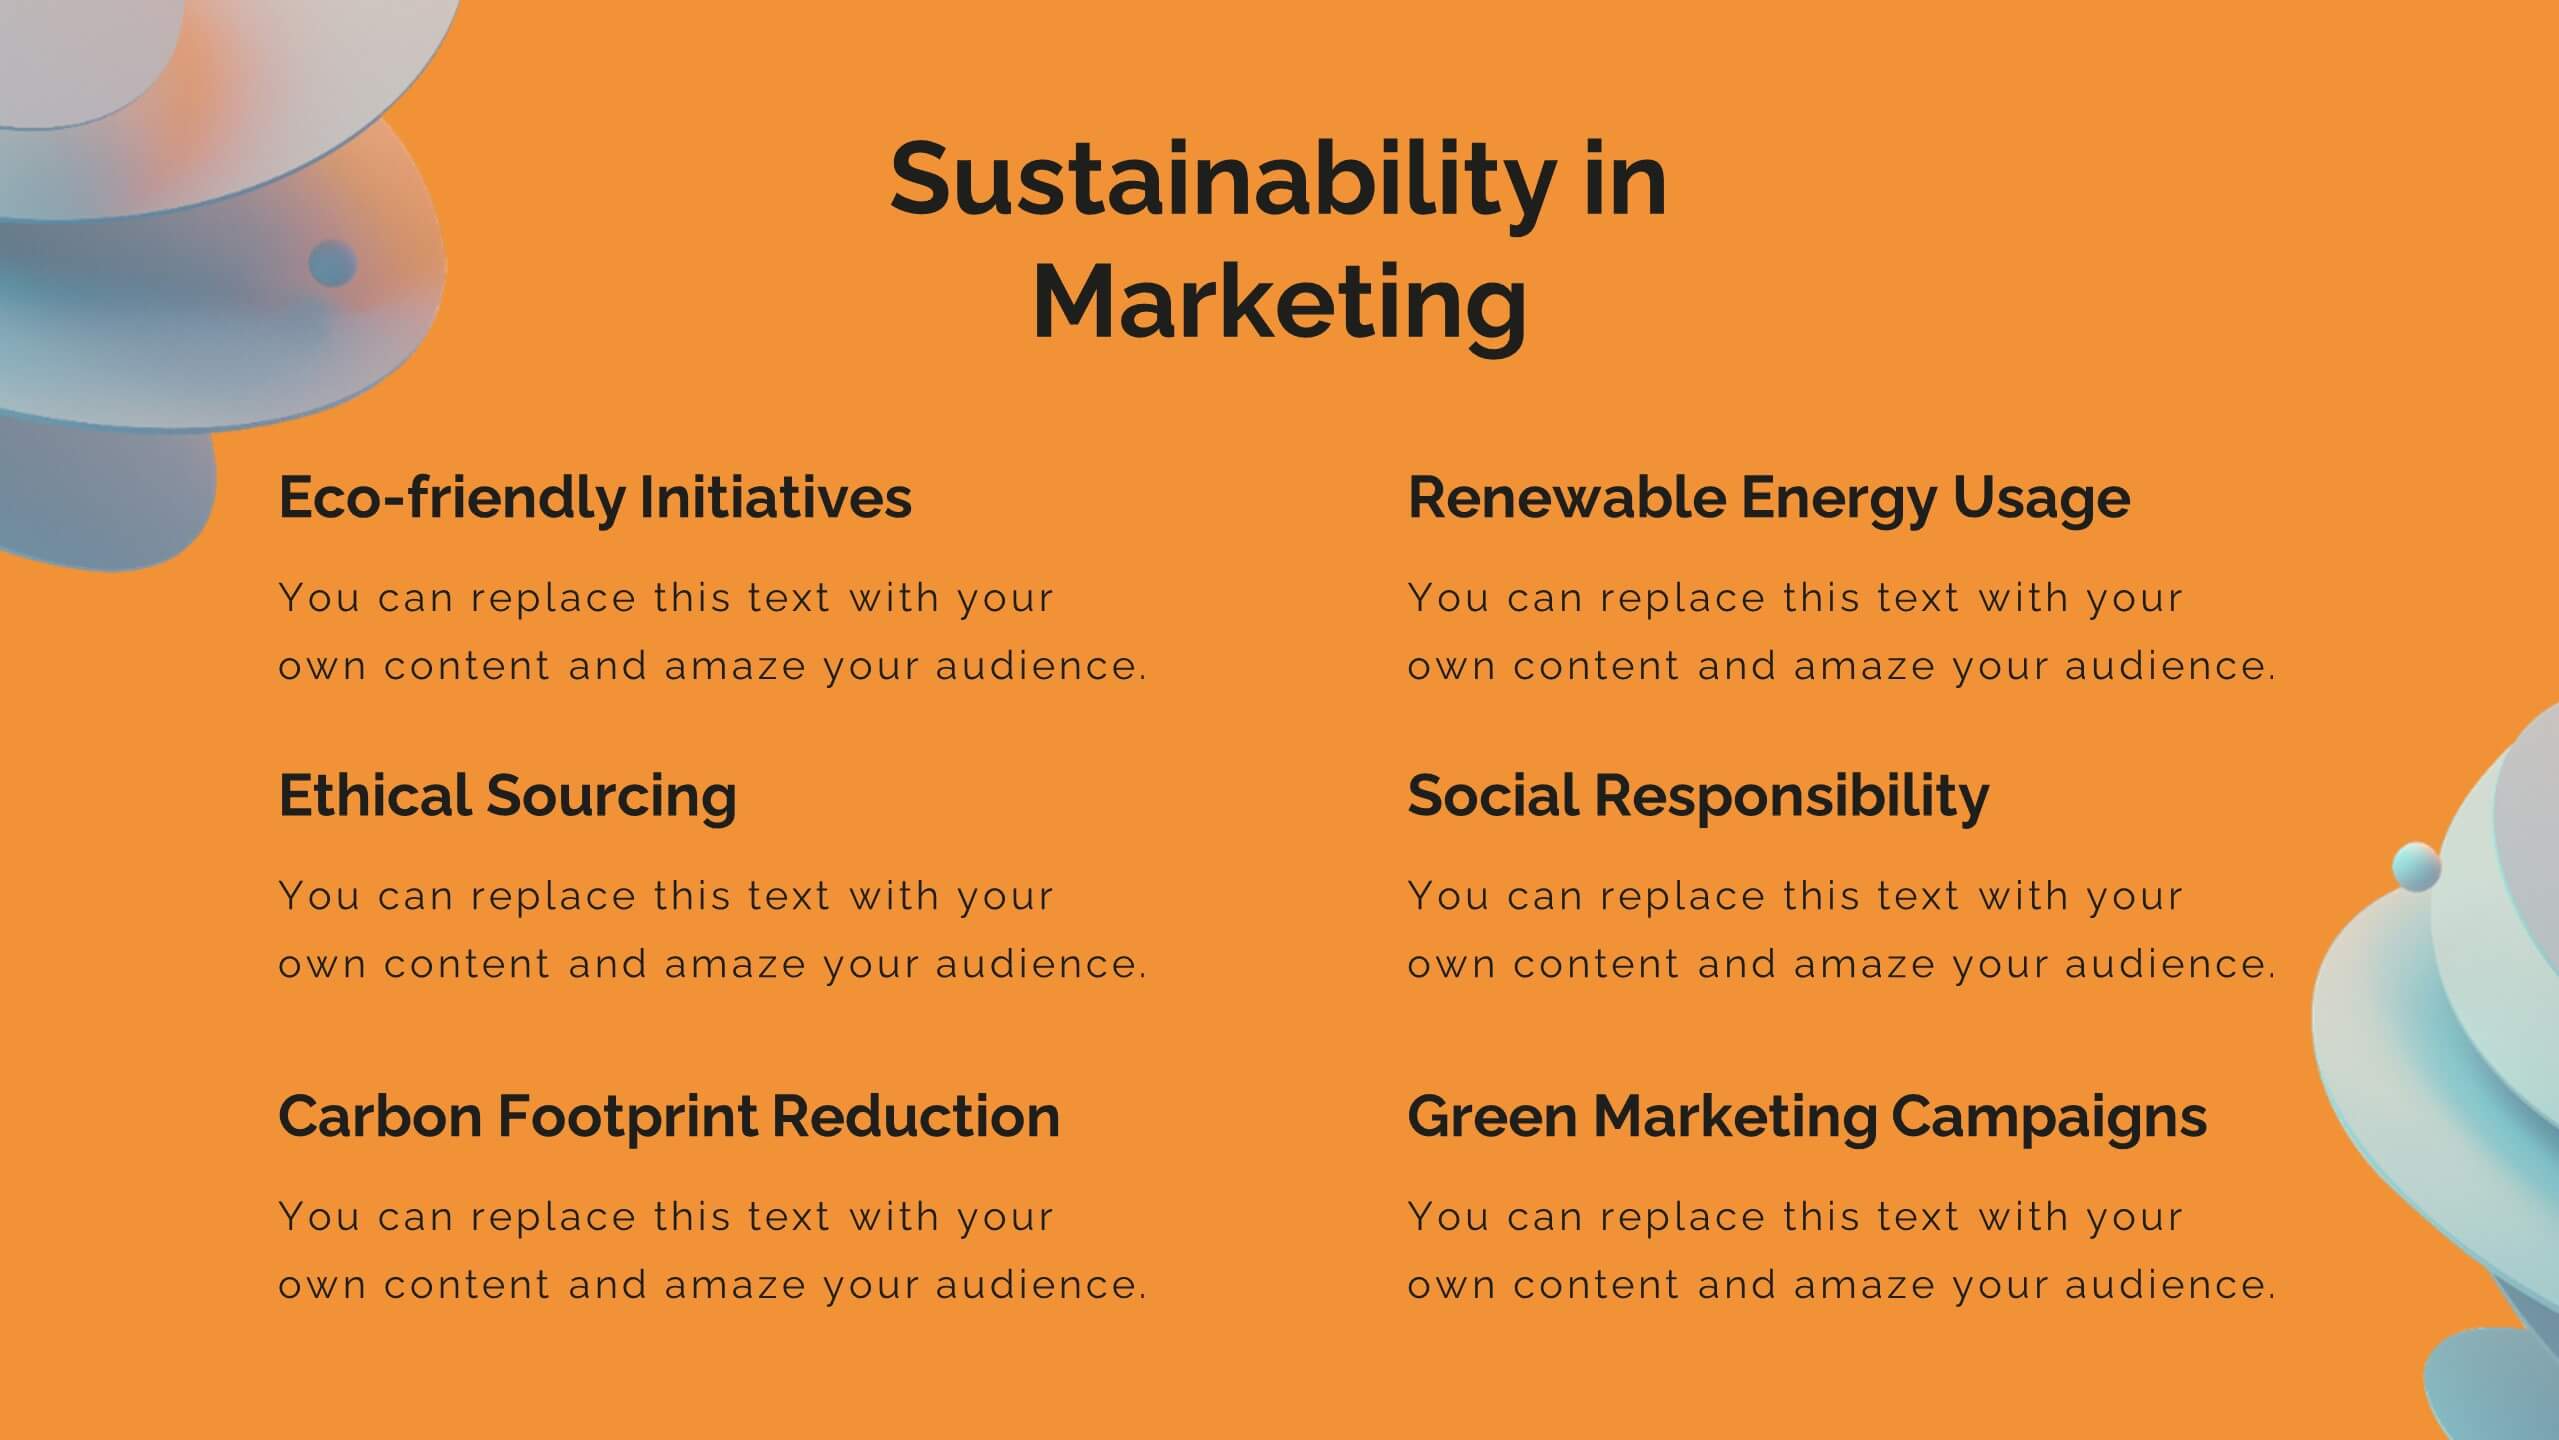
Breeze Content Marketing Pitch Deck Presentation
Elevate your content marketing strategy with this vibrant pitch deck! Perfect for outlining industry trends, consumer behavior, and innovative techniques. Ideal for marketers aiming to impress clients and stakeholders. Compatible with PowerPoint, Keynote, and Google Slides, this template ensures your pitch is engaging, persuasive, and professional. Achieve marketing success today!