


Características


¿Tienes alguna pregunta?
Recomendar


7 diapositivas
Company Profile Structure Infographic
This series of templates is meticulously crafted to represent a company’s structure in a detailed and organized manner. Each template varies in design and layout, ensuring that there is a style to suit different business needs and preferences. From straightforward, clean layouts to more dynamic, visually engaging designs, these templates provide an excellent basis for companies to present their organizational structure, core team members, departmental divisions, and key business areas effectively. Key information such as company values, mission statements, and strategic objectives can be clearly highlighted, allowing companies to communicate their business essence and operational ethos to stakeholders. Each template also accommodates data visualization through charts, graphs, and infographics, which are instrumental in depicting growth trajectories, performance metrics, or demographic breakdowns. With customization options, these templates can be tailored to reflect a company's unique brand identity, including color schemes, typography, and corporate logos, making each presentation not only informative but also reflective of the company's image. This collection is ideal for corporate introductions, stakeholder meetings, and internal presentations aimed at fostering a clear understanding of the company’s operational framework and strategic direction.


4 diapositivas
Side-by-Side Comparison Butterfly Chart Presentation
Compare data clearly and effectively with the Side-by-Side Comparison Butterfly Chart Presentation. This layout is perfect for showcasing performance metrics, survey results, or A/B comparisons in a symmetrical, easy-to-read format. Editable in Canva, PowerPoint, Google Slides, and Keynote to match your brand and presentation style effortlessly.


21 diapositivas
Sonicwave Market Analysis Report Presentation
A vibrant, modern template designed for market analysis presentations. Covers agenda, key highlights, metrics, financial summaries, competitor insights, and strategic initiatives. Ideal for professionals presenting data-driven insights on trends and performance. Fully customizable in PowerPoint, Keynote, and Google Slides for business, marketing, and analytical reporting needs.


4 diapositivas
Stock Market Insights and Trends Presentation
Visualize complex financial data with ease using the Stock Market Insights and Trends presentation template. This layout features a bold line chart with labeled milestones to highlight key shifts in performance, market patterns, or strategic indicators. Ideal for investment reports, financial briefings, and economic updates. Perfect for analysts, finance professionals, and business strategists. Fully editable and compatible with PowerPoint, Keynote, and Google Slides.


6 diapositivas
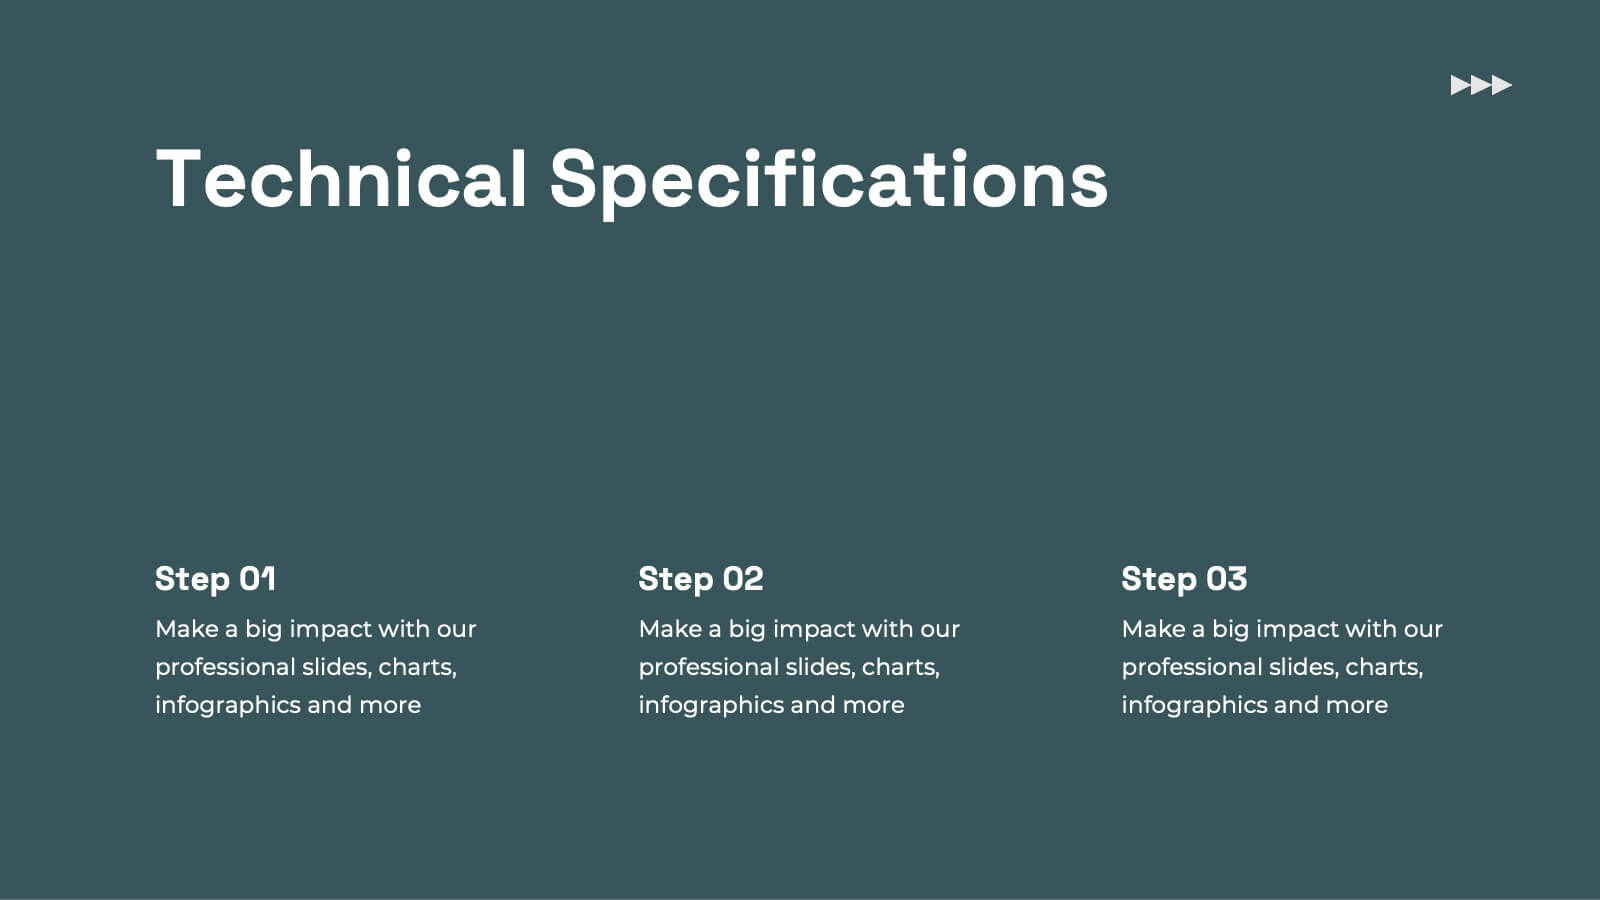
Project Overview and Key Takeaways Presentation
Summarize your project outcomes with clarity and impact using this Project Overview and Key Takeaways slide. Featuring a clean layout with a dedicated section for a brief overview and key metrics, plus four hexagonal milestones for your main insights. Perfect for wrap-up reports, client updates, or stakeholder reviews. Fully editable in PowerPoint, Keynote, and Google Slides.


7 diapositivas
Mortgage Comparison Infographic
Make the home buying decision easier with our mortgage comparison infographic template. This user-friendly and visually engaging infographic allows you to compare different mortgage options, helping your audience make informed financial choices. Use the charts to illustrate how the loan term impacts the total cost of the mortgage, making it easier to choose the right term. Fully customizable and compatible with Powerpoint, Keynote, and Google Slides. With this template, you can demystify mortgage options and empower individuals to choose the mortgage that best fits their needs and financial goals.


24 diapositivas
Brand Overview Presentation
Enhance your brand storytelling with our Brand Presentation template. Perfect for showcasing brand vision, values, and strategies, this template includes diverse slides for audience targeting and brand touchpoints. Suitable for all professional settings, it's compatible with PowerPoint, Keynote, and Google Slides.


4 diapositivas
Editable Table Chart Presentation
Simplify side-by-side evaluations with the Editable Table Chart Presentation. Designed for clear comparisons, this layout uses checkmarks, icons, and a clean structure to display features or data across multiple categories. It's perfect for showcasing product options, service tiers, or strategic alternatives. Fully customizable and compatible with PowerPoint, Keynote, and Google Slides.


7 diapositivas
Growth Challenges Infographic
Navigating the path to success often involves understanding both growth and challenges. The growth challenge infographic, adorned in refreshing shades of green, white, and blue, provides an intuitive representation of these dual trajectories. Whether you're a startup striving for market traction or an established entity mapping out expansion strategies, this template crystallizes your journey. Business analysts, strategy consultants, and team leads will find this tool invaluable for driving insights and fostering discussions. Enhanced for compatibility with PowerPoint, Keynote, and Google Slides, this infographic is your visual ally in narrating business tales.


5 diapositivas
Business Hierarchy Pyramid Presentation
Present your business structure or priorities with clarity using our "Business Hierarchy Pyramid Presentation" template. This infographic elegantly segments different layers or levels within your organization, project, or planning strategy, with a pyramid design that visually emphasizes the foundational to advanced stages. Each level of the pyramid is distinctly colored and labeled, allowing you to easily insert key points or data relevant to each segment. Ideal for corporate presentations, strategic meetings, and management training, this template ensures your key concepts are organized and clearly communicated. Compatible with PowerPoint, Keynote, and Google Slides, it integrates effortlessly into your professional toolkit.


6 diapositivas
Sales Funnel Performance Presentation
Visualize your customer journey with this Sales Funnel Performance Presentation. The clean funnel diagram allows you to clearly represent each stage—awareness, interest, decision, and action—using vibrant, stacked layers. Customize the six labeled steps and supporting icons to fit your brand strategy. Perfect for showcasing conversion metrics or campaign insights in PowerPoint, Keynote, or Google Slides.


6 diapositivas
RAPID Framework for Business Strategy Presentation
Unveil a dynamic approach to strategic decision-making with the RAPID Framework for Business Strategy template. This structured layout covers the Recommend, Agree, Perform, Input, and Decide stages, offering a comprehensive toolkit for business planning and execution. This versatile template is essential for teams aiming to enhance strategic planning and is compatible with PowerPoint, Keynote, and Google Slides, making it accessible for a wide range of business professionals.


6 diapositivas
Puzzle Project Infographic
A puzzle infographic is a visual representation that combines the elements of a puzzle with informational content. This infographic template uses puzzle pieces or puzzle-related design elements to convey different sections or components of information. Each puzzle piece represents a specific section or element of the information being presented. The puzzle pieces act as sequential elements, guiding your viewer through the information in a logical and engaging manner. This infographic is visually appealing and use colors, illustrations, icons, and other design elements to enhance the overall presentation.


30 diapositivas
Fusoria Brand Guidelines Proposal Presentation
Build a strong and cohesive brand identity with this sleek and professional brand guidelines proposal presentation. Covering essential topics like typography, color palettes, visual direction, and branding principles, this template helps you define and communicate your brand’s essence. Fully customizable and compatible with PowerPoint, Keynote, and Google Slides for a seamless presentation experience.


26 diapositivas
Kohen Presentation Template
Kohen is a minimal coffee shop template that features slide designs you can use together, making it perfect for sharing your business and services. It is easy to use, resulting in convenient high quality presentations. This template design can be used to create more elaborate presentations about food and restaurants. It is complete with charts, images, and text boxes for endless presentation possibilities. This template will help make your message more compelling and informative. The presentation includes a variety of tools and resources, to highlight key points and ideas with minimal text.


7 diapositivas
Business Networking Strategy Presentation
Build strong business connections with this Business Networking Strategy template. Featuring a circular segmented diagram, this slide helps illustrate key networking approaches, strategic partnerships, and relationship-building techniques in an easy-to-understand format. Ideal for entrepreneurs, business developers, and corporate leaders, this fully editable slide is compatible with PowerPoint, Keynote, and Google Slides.


19 diapositivas
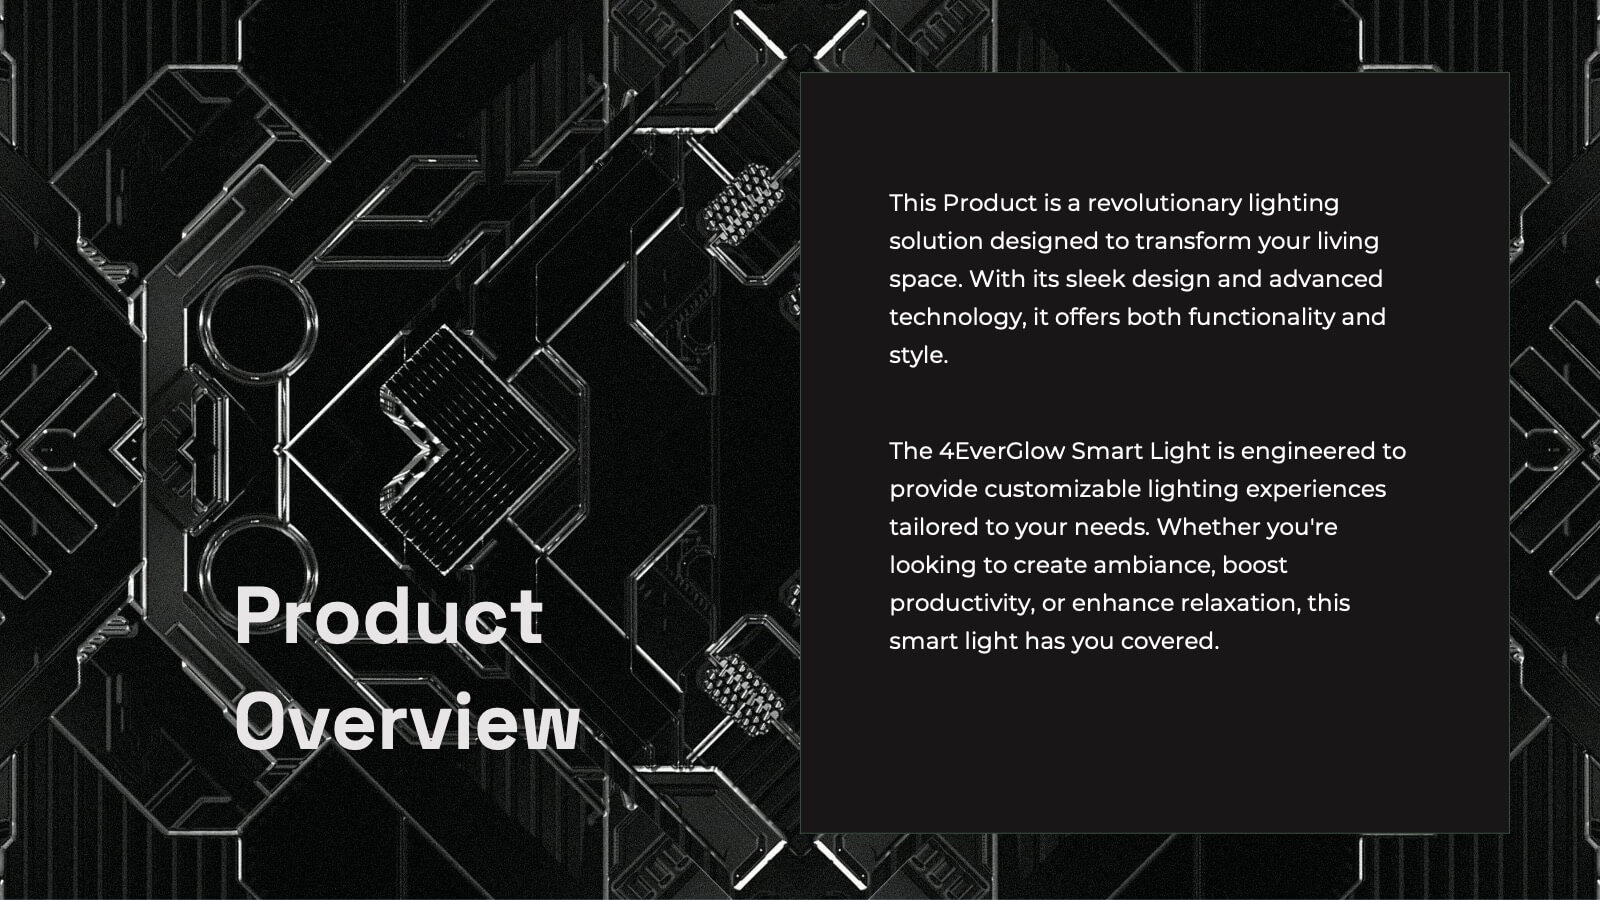
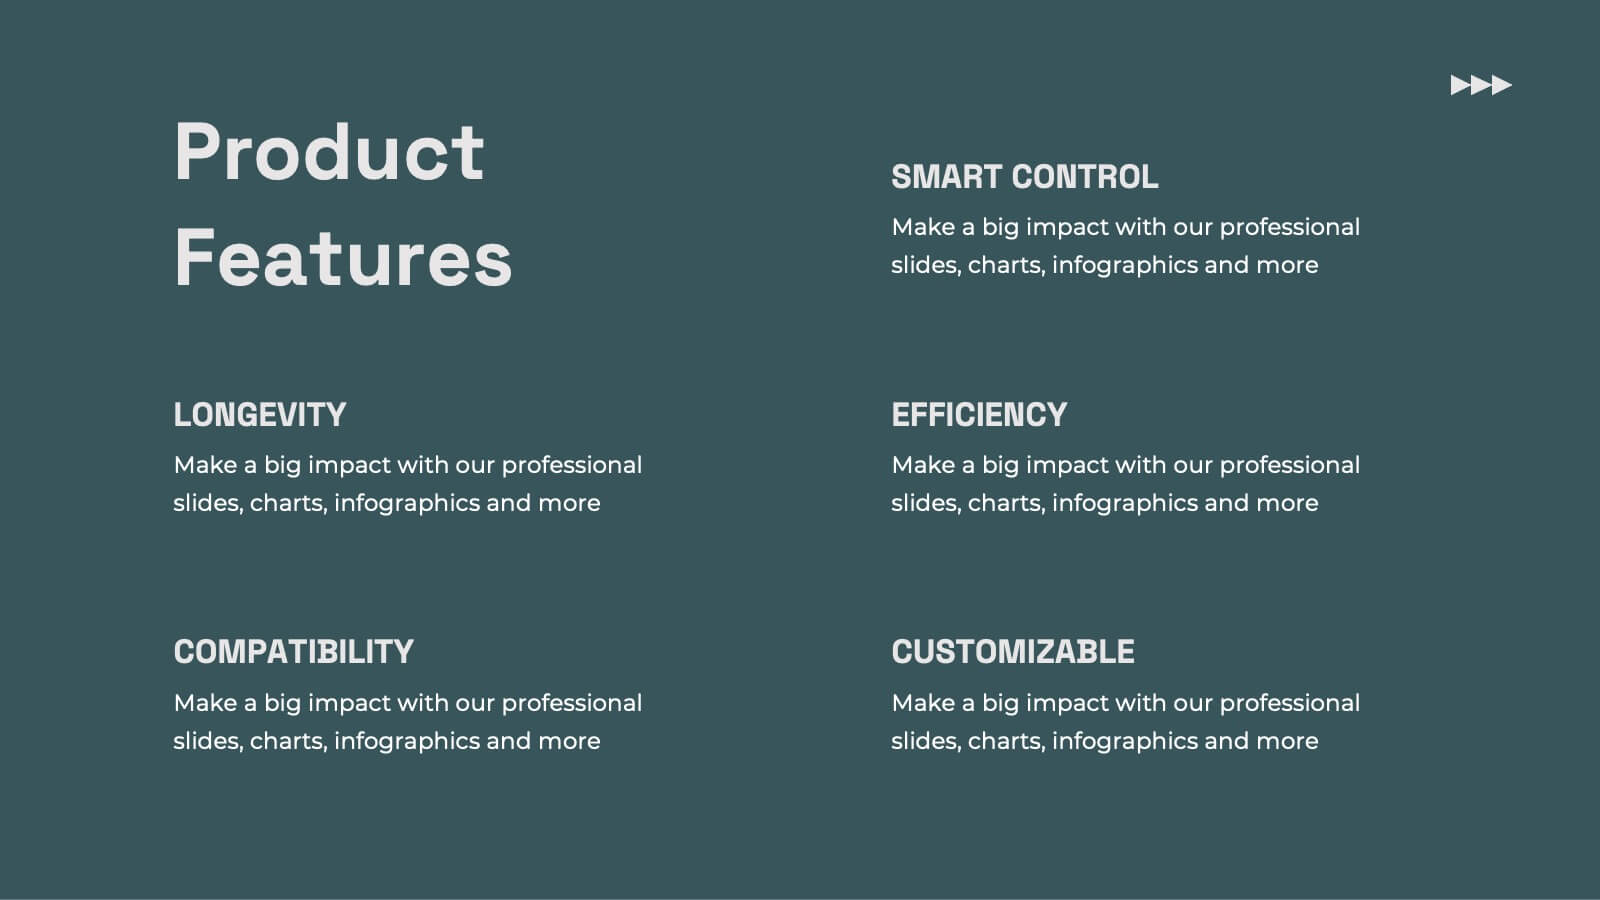
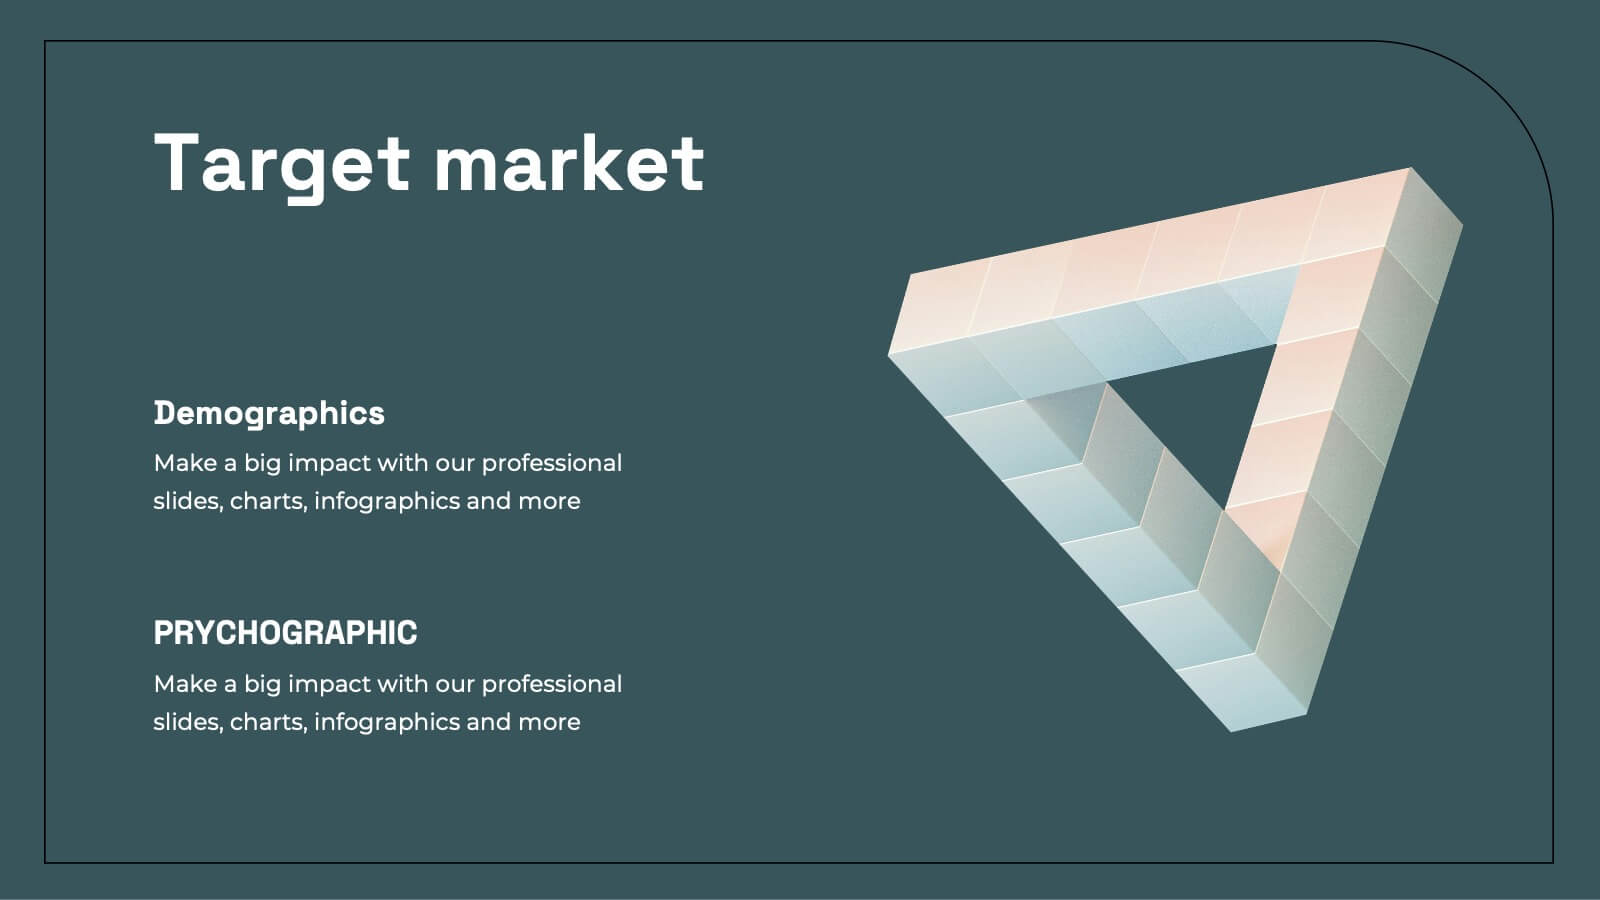
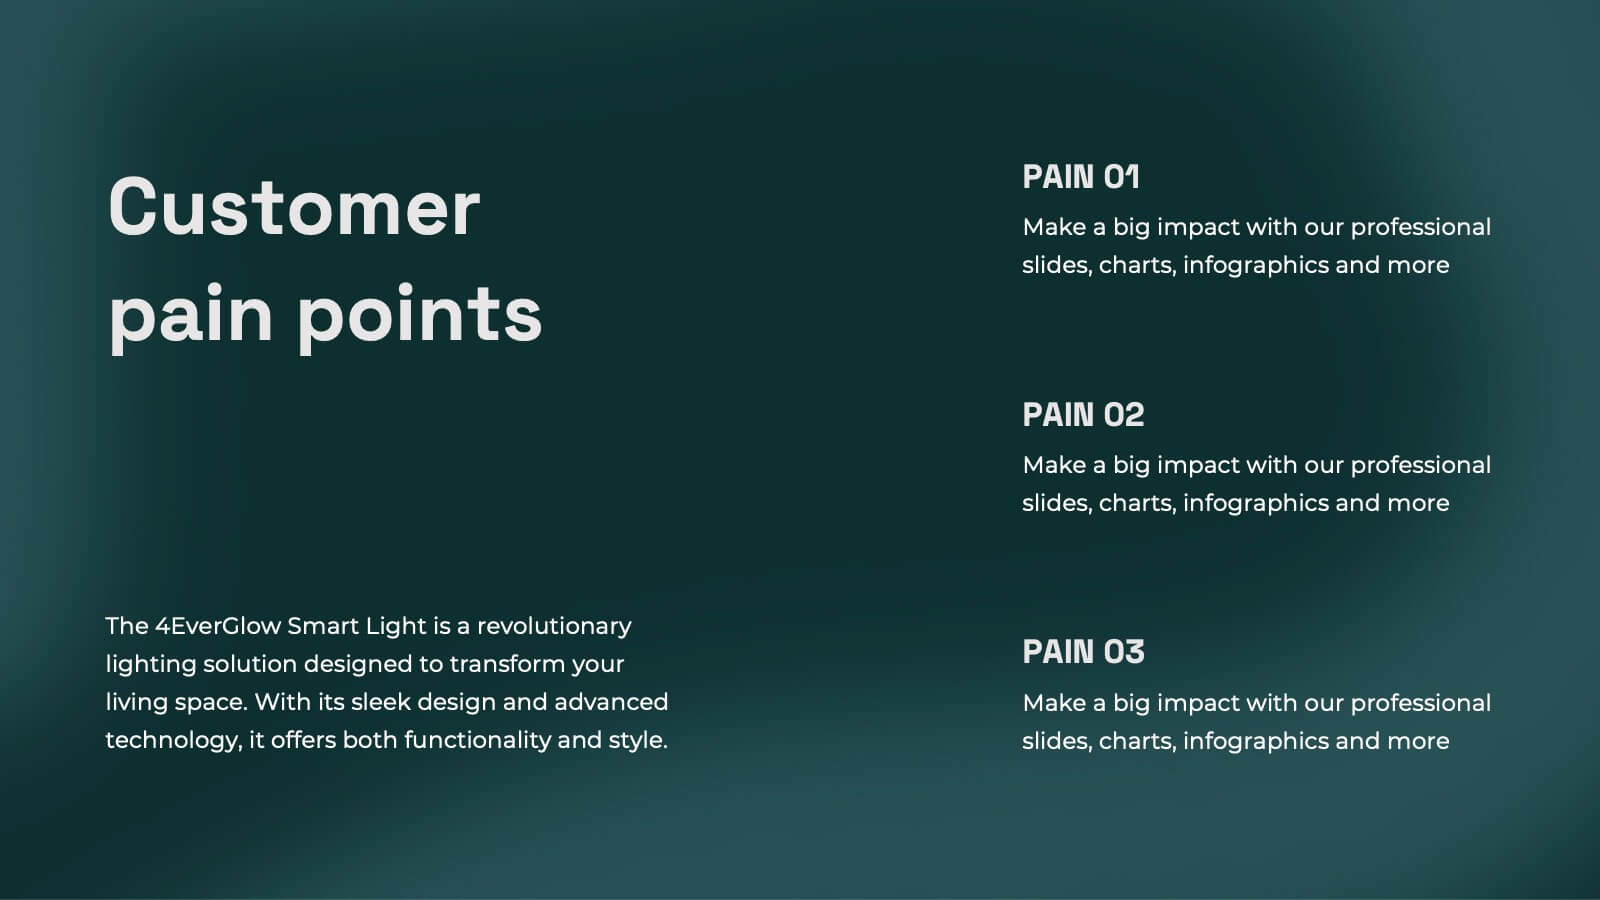
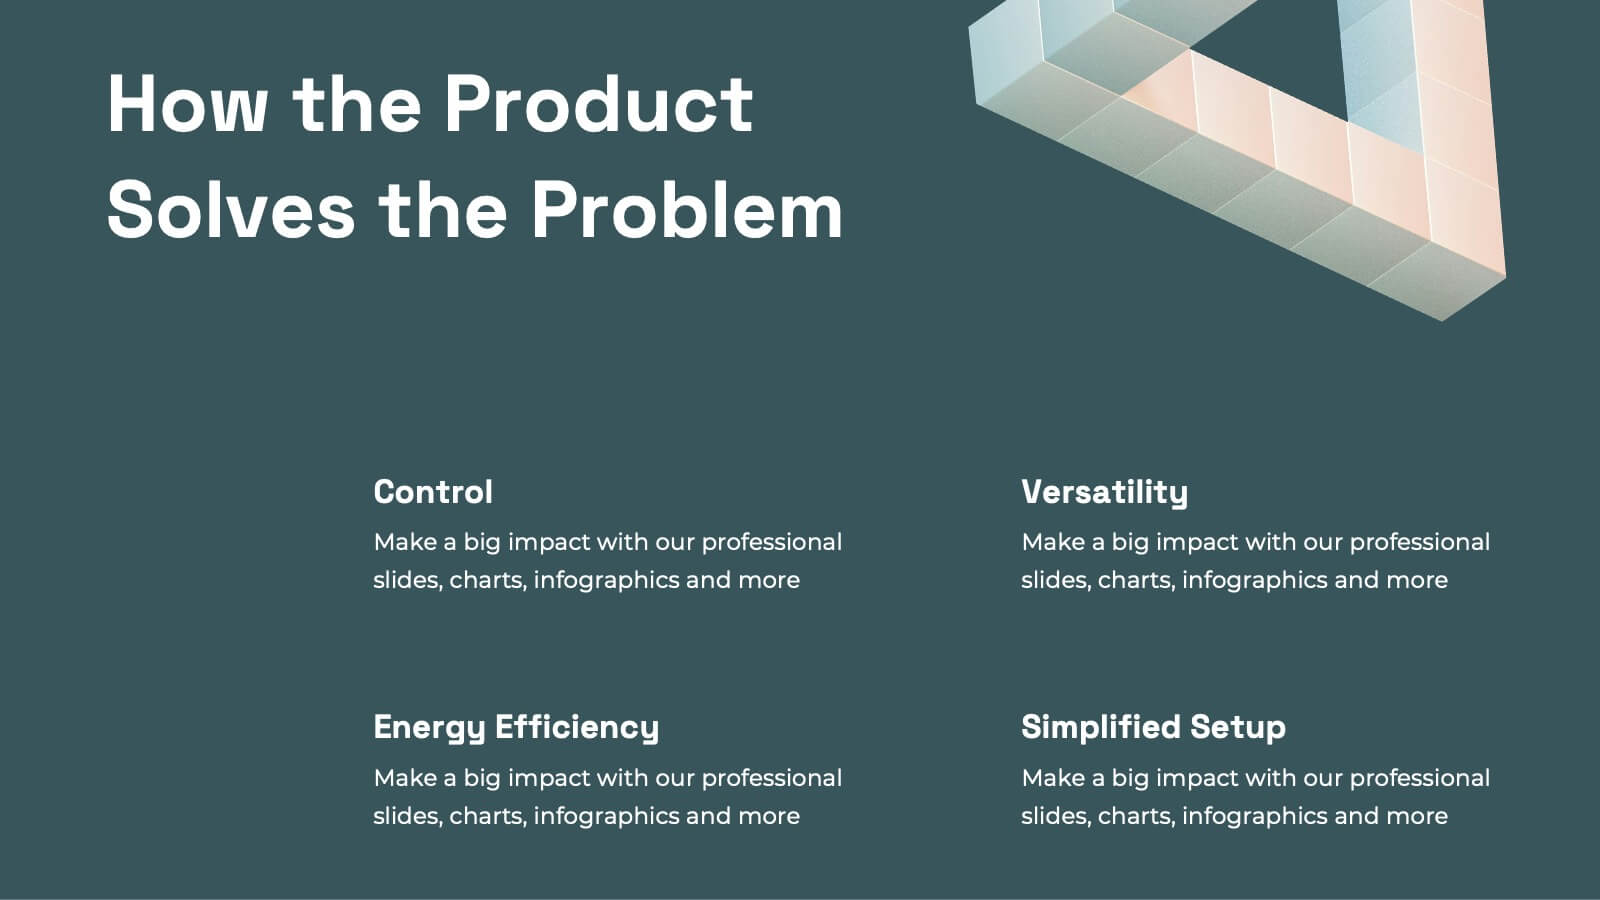
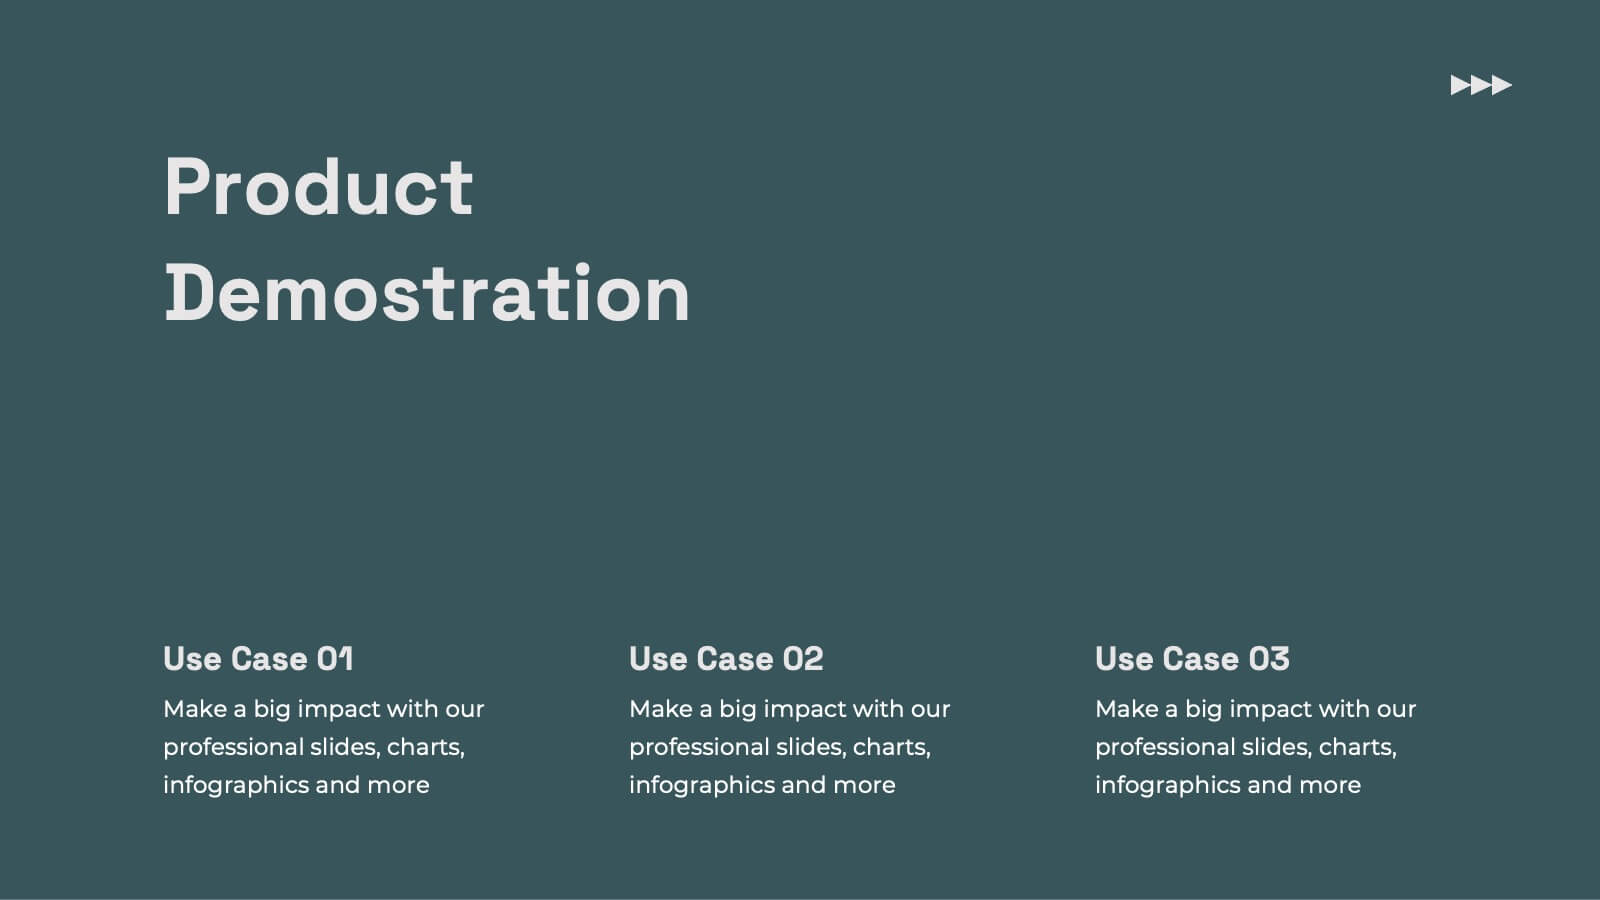
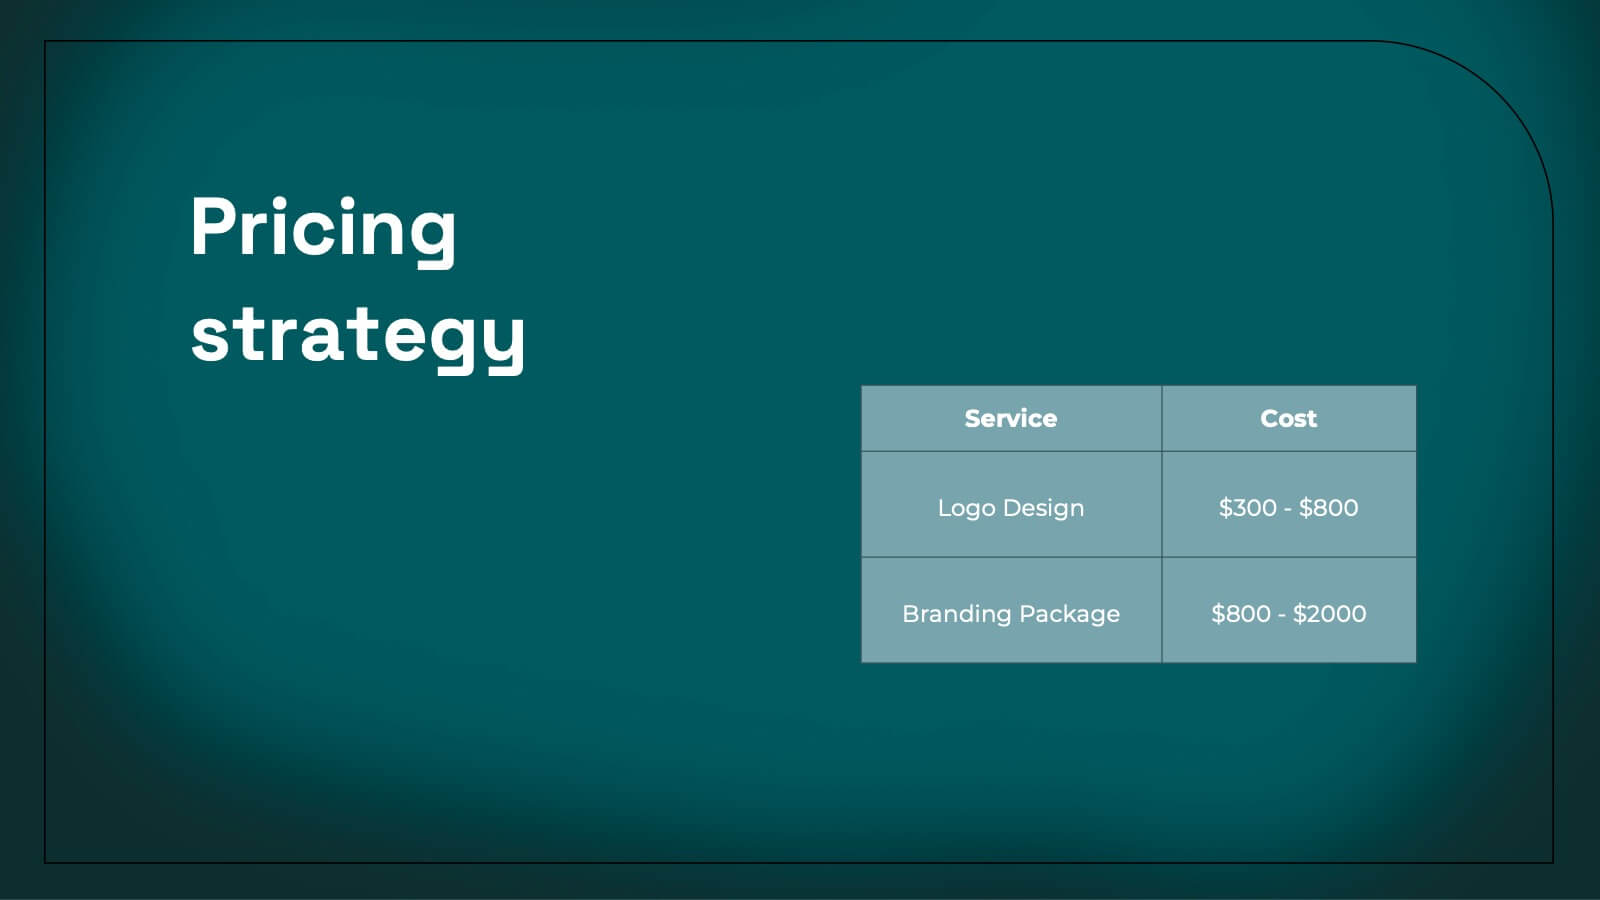
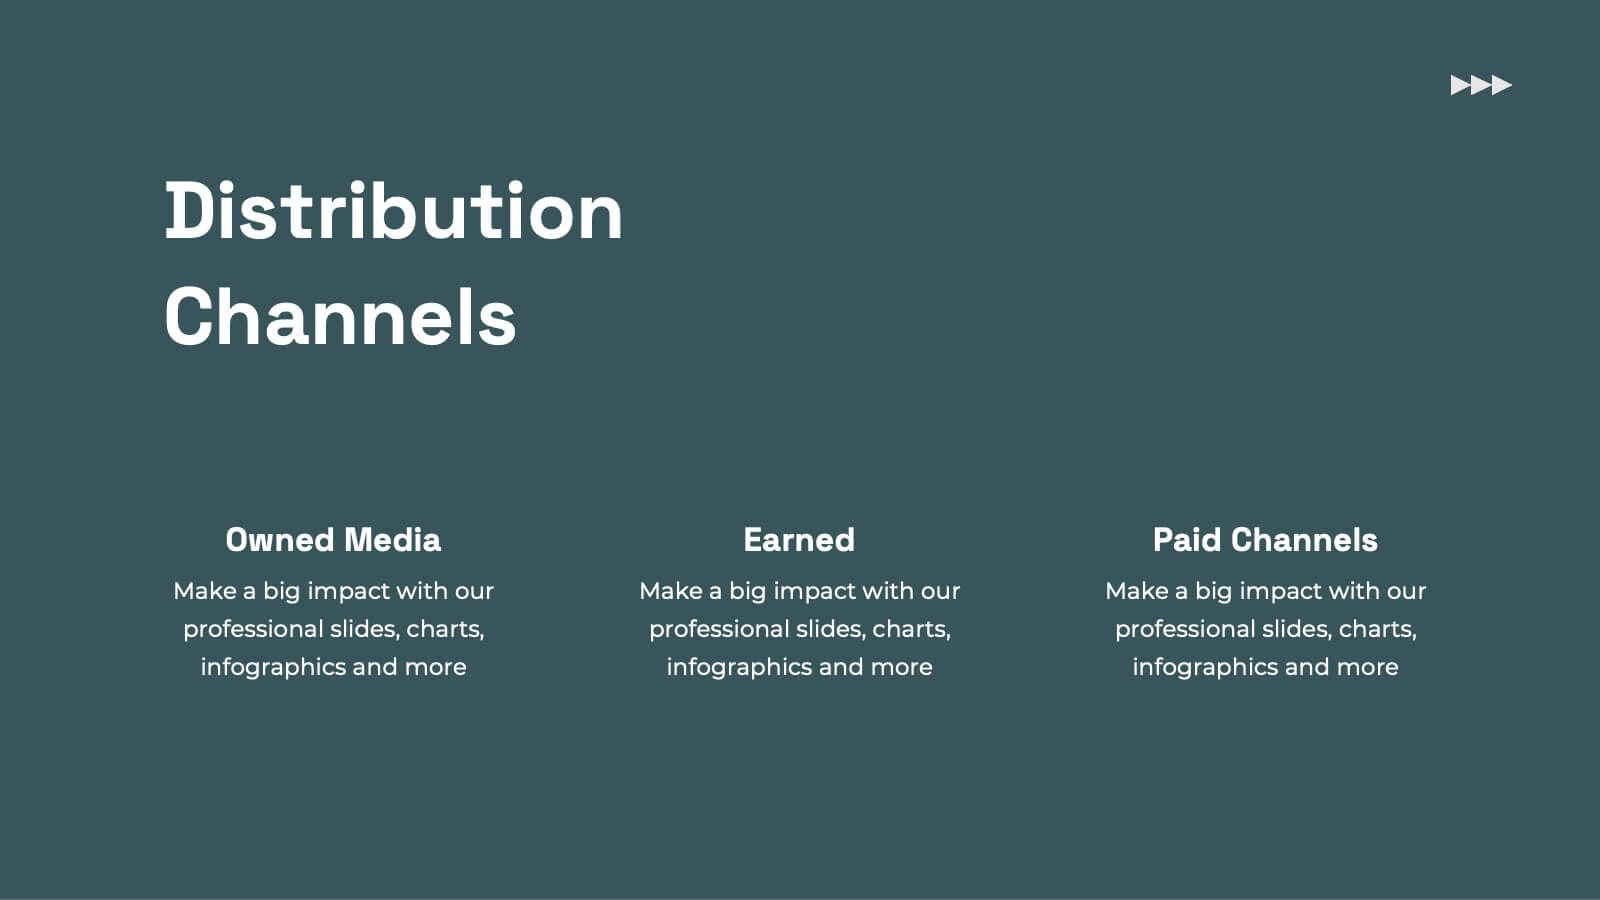
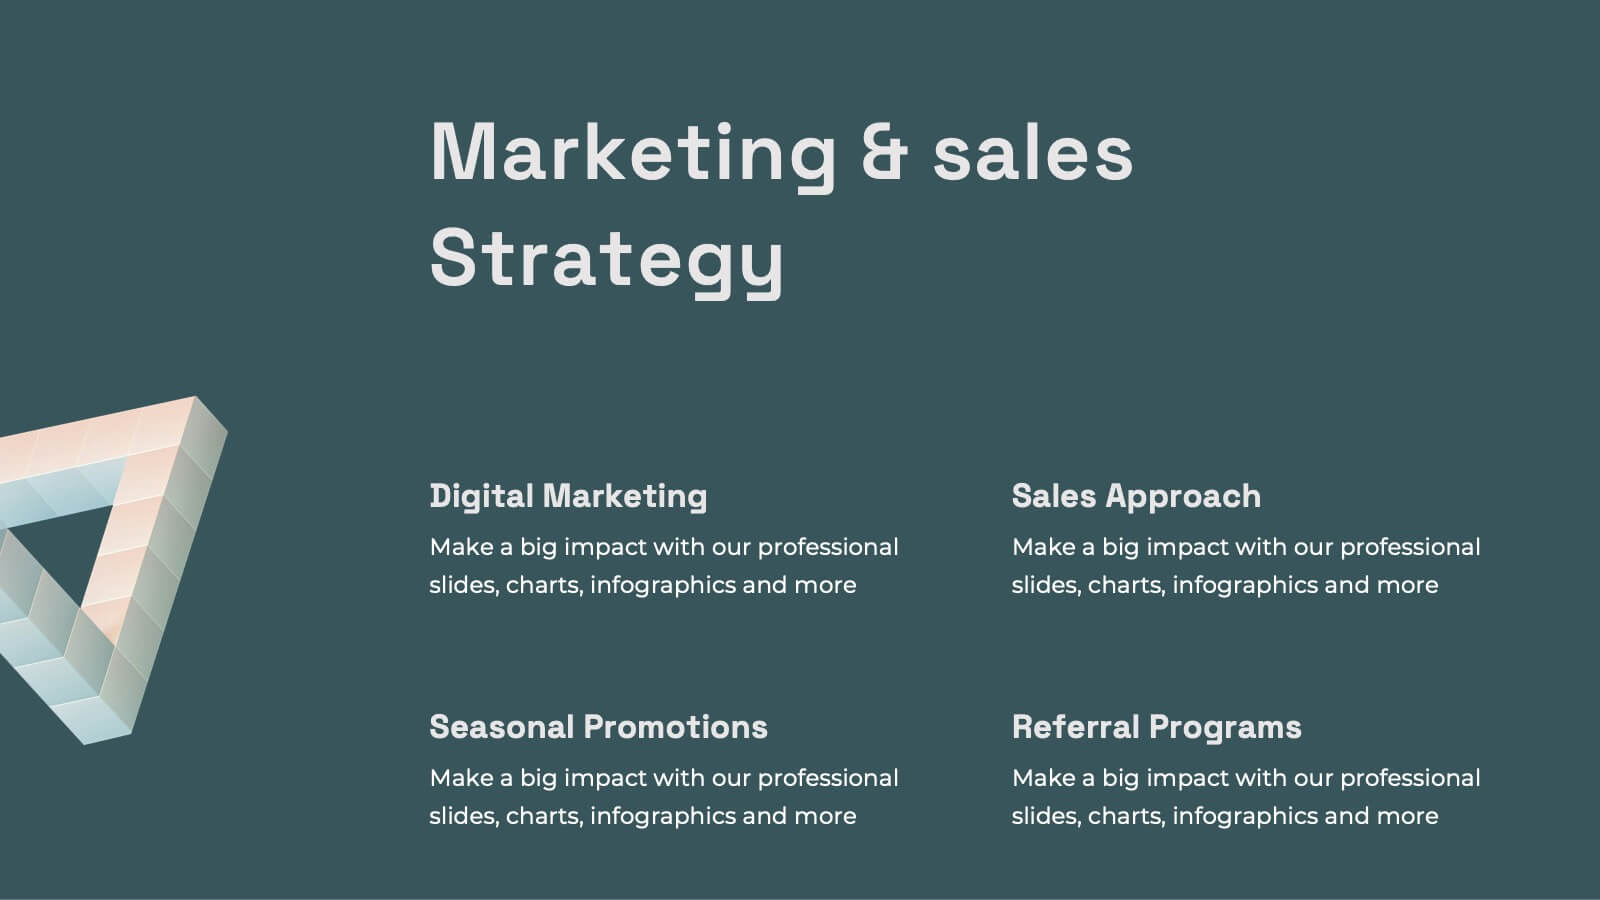
Kale Product Strategy Report Presentation
Unleash the power of your product with this bold and dynamic product strategy report template! Elevate your presentation with eye-catching designs that showcase product features, competitive analysis, and pricing strategies like never before. Captivate your audience from start to finish and leave a lasting impression. Fully compatible with PowerPoint, Keynote, and Google Slides!