Editable Table Chart Presentation
PowerPoint Template and Google Slides Theme


Características
Etiquetas
- Eliminar de favoritos
Plantilla de PowerPoint
1 MB
Plantilla de Google Slides
Enlace externo
Plantilla de Keynote
1 MB
Recomendar
- Eliminar de favoritos
Plantilla de PowerPoint
1 MB
Plantilla de Google Slides
Enlace externo
Plantilla de Keynote
2 MB
7 diapositivas
Cyber Security Analyst Infographic
Cybersecurity, involves practices, technologies, and processes designed to protect computer systems, networks, data, and programs from theft, damage, unauthorized access, or any form of cyber-attacks. This visually stunning template is tailored to guide and inform both novices and professionals in the realm of cybersecurity. It provides essential insights and strategies to safeguard digital landscapes against modern threats. Compatible with Powerpoint, Keynote, and Google Slides. This template is designed to equip individuals with the knowledge and strategies needed to protect the digital realm.
- Eliminar de favoritos
Plantilla de PowerPoint
1 MB
Plantilla de Google Slides
Enlace externo
Plantilla de Keynote
1 MB
5 diapositivas
Fashion Design Infographics
Fashion Design is the art of creating clothing and accessories, incorporating elements of style, aesthetics, and functionality. These infographic templates offer a visually captivating and informative way to present key concepts, trends, and insights in the world of fashion design. This template is ideal for fashion designers, students, industry professionals, or anyone interested in sharing knowledge about fashion design principles, fashion history, or emerging trends. Featuring a stylish design that reflects the creative and dynamic nature of the fashion industry. This allows for easy customization and seamless integration of your fashion-related content.
- Eliminar de favoritos
Plantilla de PowerPoint
1 MB
Plantilla de Google Slides
Enlace externo
Plantilla de Keynote
1 MB
5 diapositivas
User Insights Based on Demographics Presentation
Showcase key demographic segments with this visually engaging user insights slide. Featuring icon-based representations with circular percentage indicators, it’s ideal for displaying gender, age, behavior, or regional breakdowns. Perfect for marketing reports, audience research, or strategic planning presentations, it clearly highlights trends and helps guide data-driven decisions.
- Eliminar de favoritos
Plantilla de PowerPoint
1 MB
Plantilla de Google Slides
Enlace externo
Plantilla de Keynote
2 MB
6 diapositivas
USA Market Reach Heatmap Presentation
Showcase your geographic impact with this USA Market Reach Heatmap template. Ideal for visualizing regional data, customer density, or sales performance. Features pinpoint markers, editable callouts, and a clean U.S. map layout. Fully customizable in PowerPoint, Keynote, and Google Slides—perfect for marketing, sales, or expansion strategy presentations.
- Eliminar de favoritos
Plantilla de PowerPoint
1 MB
Plantilla de Google Slides
Enlace externo
Plantilla de Keynote
1 MB
6 diapositivas
Harvey Ball Analysis Infographic
The Harvey Ball Analysis, often referred to as the Harvey Ball Method or simply the Harvey Ball, is a visual representation technique used for comparative assessment. This infographic template visually represents data using Harvey Balls, which are simple circular icons that can be filled or unfilled to represent different levels of a specific attribute. The infographic involves using a series of circles, typically colored, to represent and compare different items or variables. This template is perfect for businesses and decision-making to visually communicate the relative performance or significance of various options, elements, or categories.
- Eliminar de favoritos
Plantilla de PowerPoint
1 MB
Plantilla de Google Slides
Enlace externo
Plantilla de Keynote
1 MB
6 diapositivas
Sustainability Goals and Metrics Presentation
Bring your eco-initiatives to life with a presentation that blends purpose and clarity. Ideal for showcasing environmental goals, progress metrics, and sustainability strategies, this clean design helps communicate impact with confidence. Fully editable and compatible with PowerPoint, Keynote, and Google Slides for seamless customization and professional results.
- Eliminar de favoritos
Plantilla de PowerPoint
4 MB
Plantilla de Google Slides
Enlace externo
Plantilla de Keynote
5 MB
7 diapositivas
Team Work Strategy Infographic
Harness the collective strength of your team with our team work strategy infographic. Set against a pristine white backdrop, this design is accentuated with vivid strokes of purple, blue, yellow, and orange, symbolizing the diverse skills and unity in a team. Crafted for seamless compatibility with Powerpoint, Keynote, and Google Slides, the template features versatile graphics, detailed icons, and adaptable image placeholders. Envisage the synergy, collaboration, and the strategic prowess of a unified team, all laid out in a visually appealing format.
- Eliminar de favoritos
Plantilla de PowerPoint
1 MB
Plantilla de Google Slides
Enlace externo
Plantilla de Keynote
1 MB
4 diapositivas
Key Stakeholder Identification Presentation
A great presentation starts with clarity, and this slide brings your message to life with bold, visual focus. Use it to break down key stakeholder groups, highlight their roles, and communicate insights with ease. Clean lines and intuitive icons keep everything clear and engaging. Fully compatible with PowerPoint, Keynote, and Google Slides.
- Eliminar de favoritos
Plantilla de PowerPoint
1 MB
Plantilla de Google Slides
Enlace externo
Plantilla de Keynote
2 MB
6 diapositivas
Sales Activity Tracking Presentation
Stay on top of performance metrics with the Sales Activity Tracking Presentation. This structured table layout helps you display key figures like sales numbers, targets, percentages, and totals with ease. Perfect for performance reviews, sales updates, and executive reports. Fully editable in Canva, PowerPoint, Google Slides, and Keynote.
- Eliminar de favoritos
Plantilla de PowerPoint
1 MB
Plantilla de Google Slides
Enlace externo
Plantilla de Keynote
1 MB
6 diapositivas
Organizational Goals and SMART Objectives Presentation
Align your business vision with clarity using this Organizational Goals and SMART Objectives slide. Designed to visually represent each SMART component—Specific, Measurable, Achievable, Relevant, and Time-bound—it helps communicate strategic goals in a simple and effective format. Fully editable in Canva, PowerPoint, and Google Slides for maximum flexibility.
- Eliminar de favoritos
Plantilla de PowerPoint
1 MB
Plantilla de Google Slides
Enlace externo
Plantilla de Keynote
1 MB
6 diapositivas
Leadership and Business Teamwork Presentation
Drive results through synergy with this dynamic Leadership and Business Teamwork presentation slide. Designed with a six-part segmented pie chart, this layout helps visualize collaborative frameworks, team roles, or leadership models in an engaging way. Ideal for team workshops, leadership development, or strategic planning meetings. Easy to personalize in PowerPoint, Keynote, or Google Slides.
- Eliminar de favoritos
Plantilla de PowerPoint
1 MB
Plantilla de Google Slides
Enlace externo
Plantilla de Keynote
2 MB
6 diapositivas
Credit Card Benefits Infographic
Credit cards offer various benefits to cardholders, making them a popular financial tool for everyday transactions and managing personal finances. This infographic template highlights the various benefits and advantages of using credit cards. Perfect for banks, financial institutions, and credit card companies, this template presents a comprehensive overview of the perks and rewards that credit cards offer to their users. Compatible with Powerpoint, Keynote, and Google Slide. This template offers the flexibility to customize colors, fonts, and icons to align with the brand identity of the credit card issuer.
- Eliminar de favoritos
Plantilla de PowerPoint
1 MB
Plantilla de Google Slides
Enlace externo
Plantilla de Keynote
1 MB
4 diapositivas
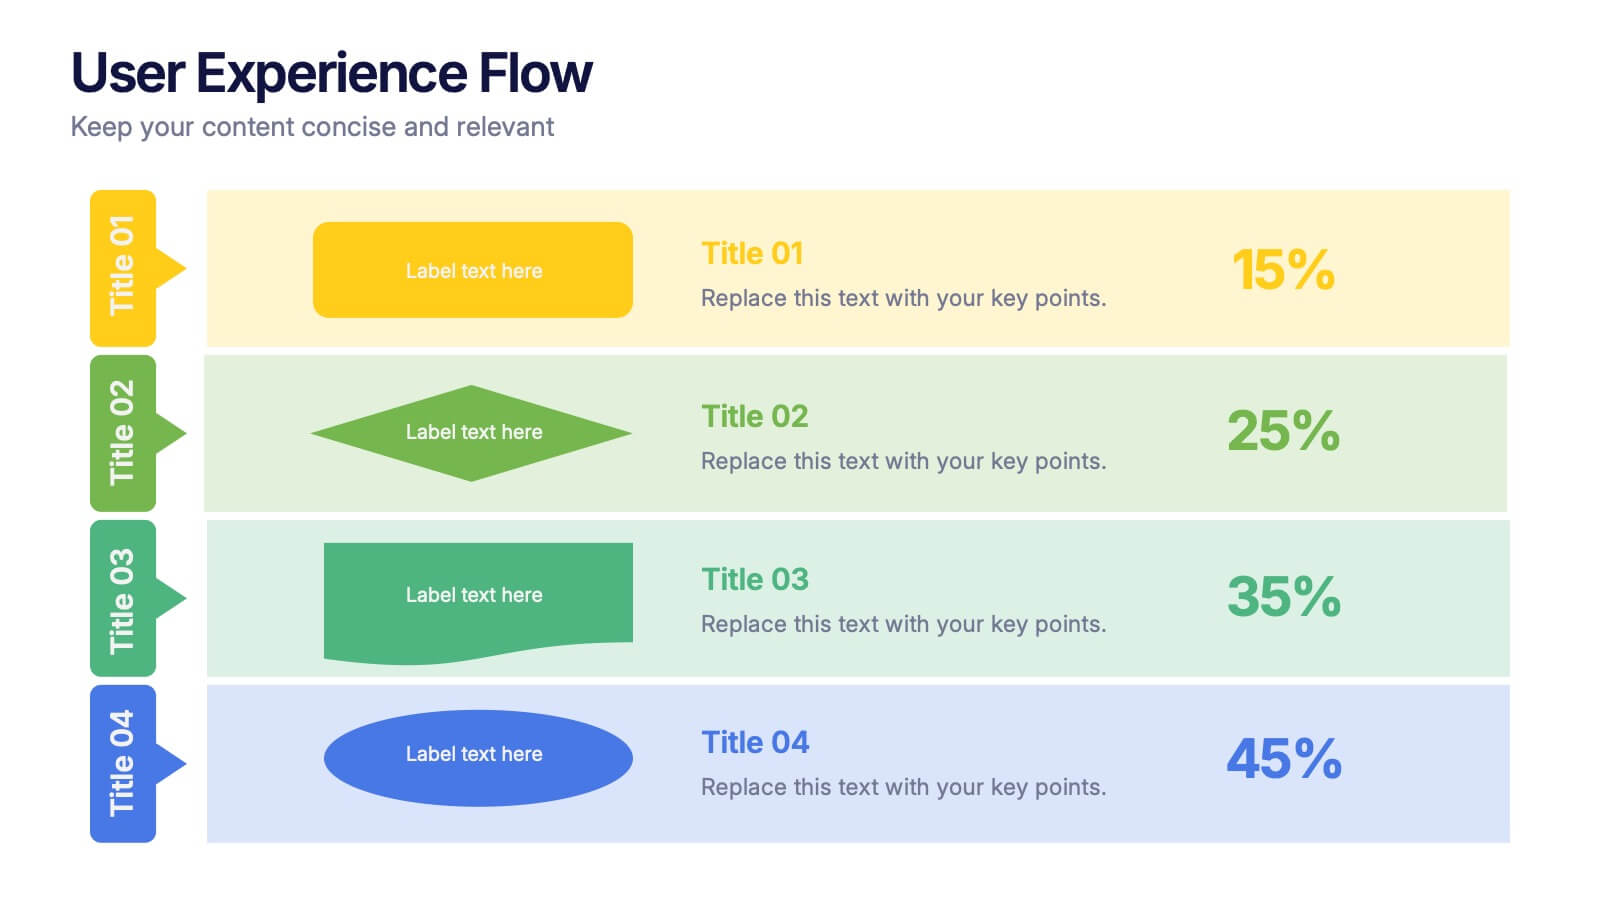
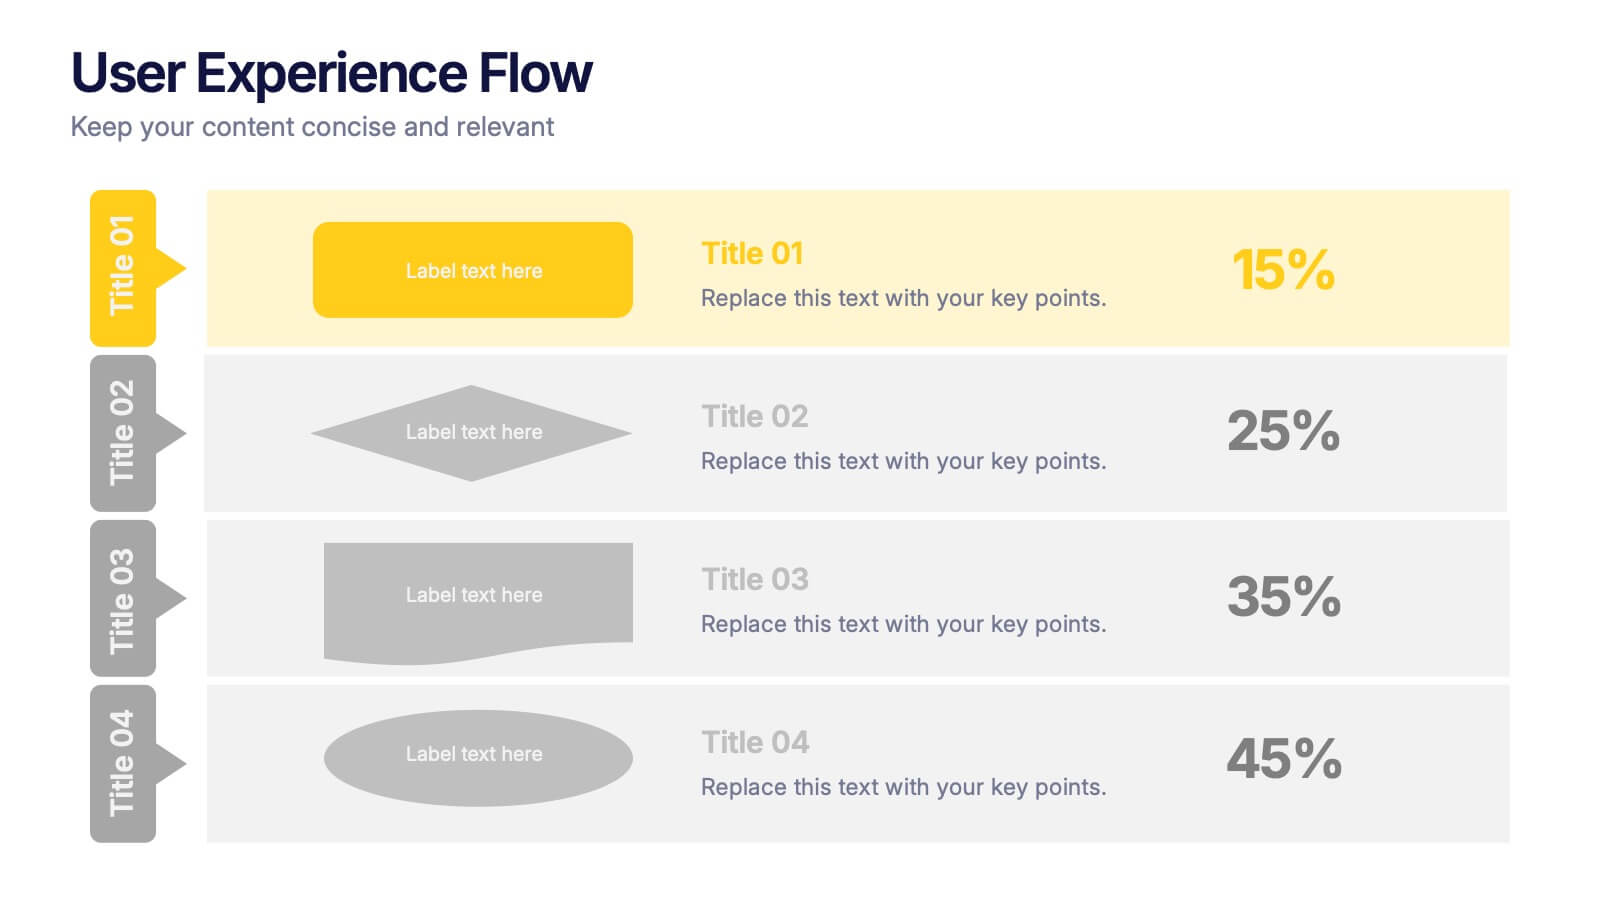
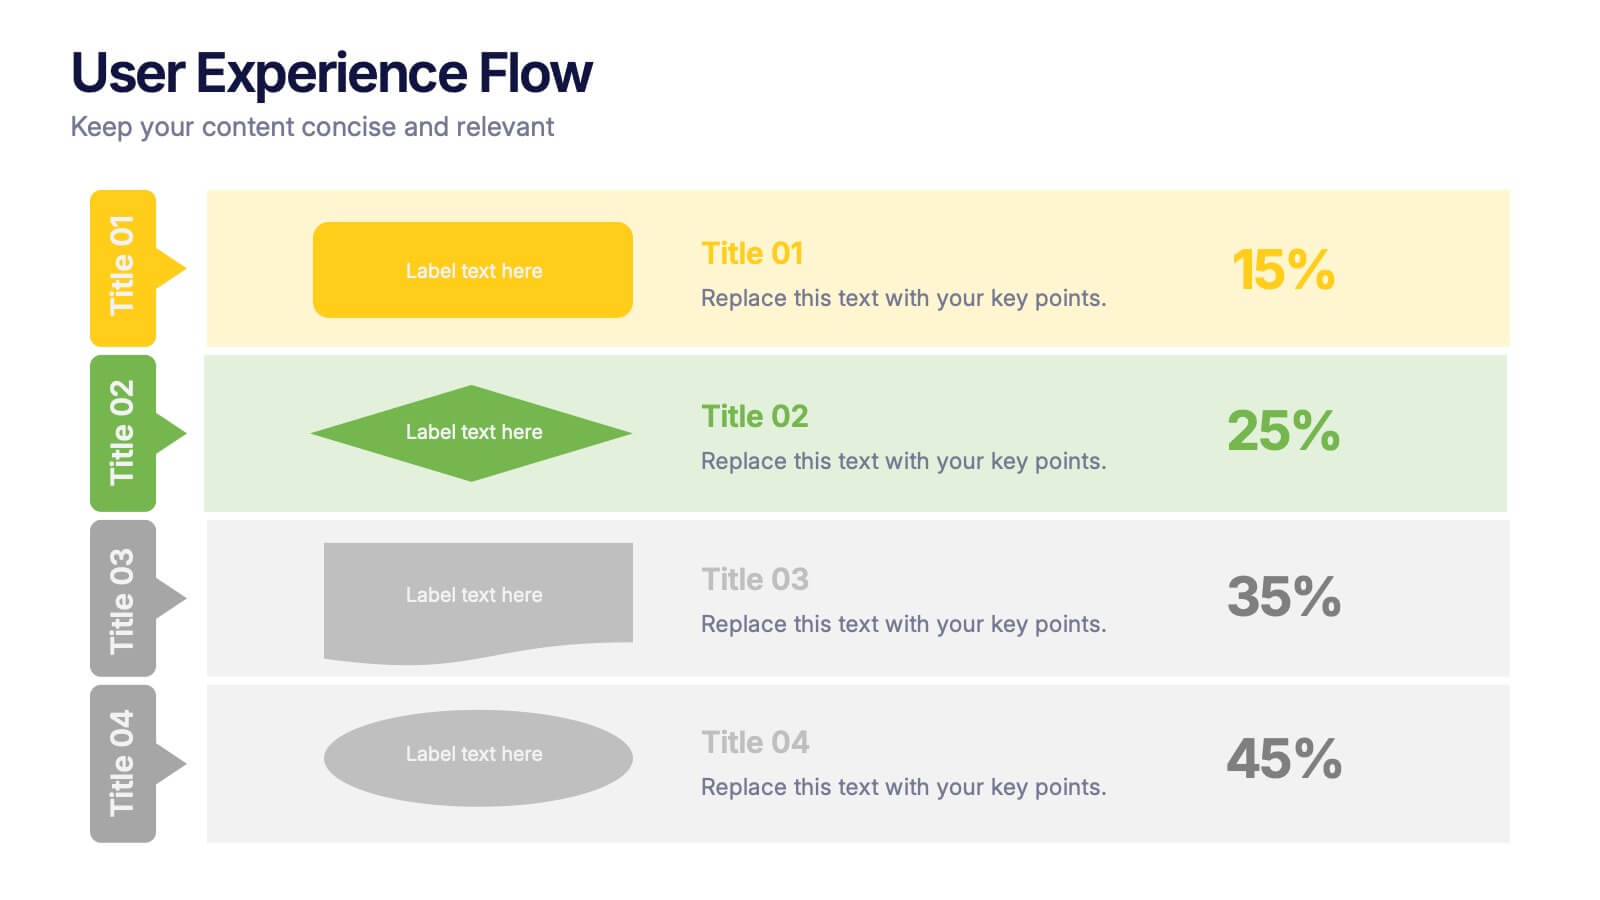
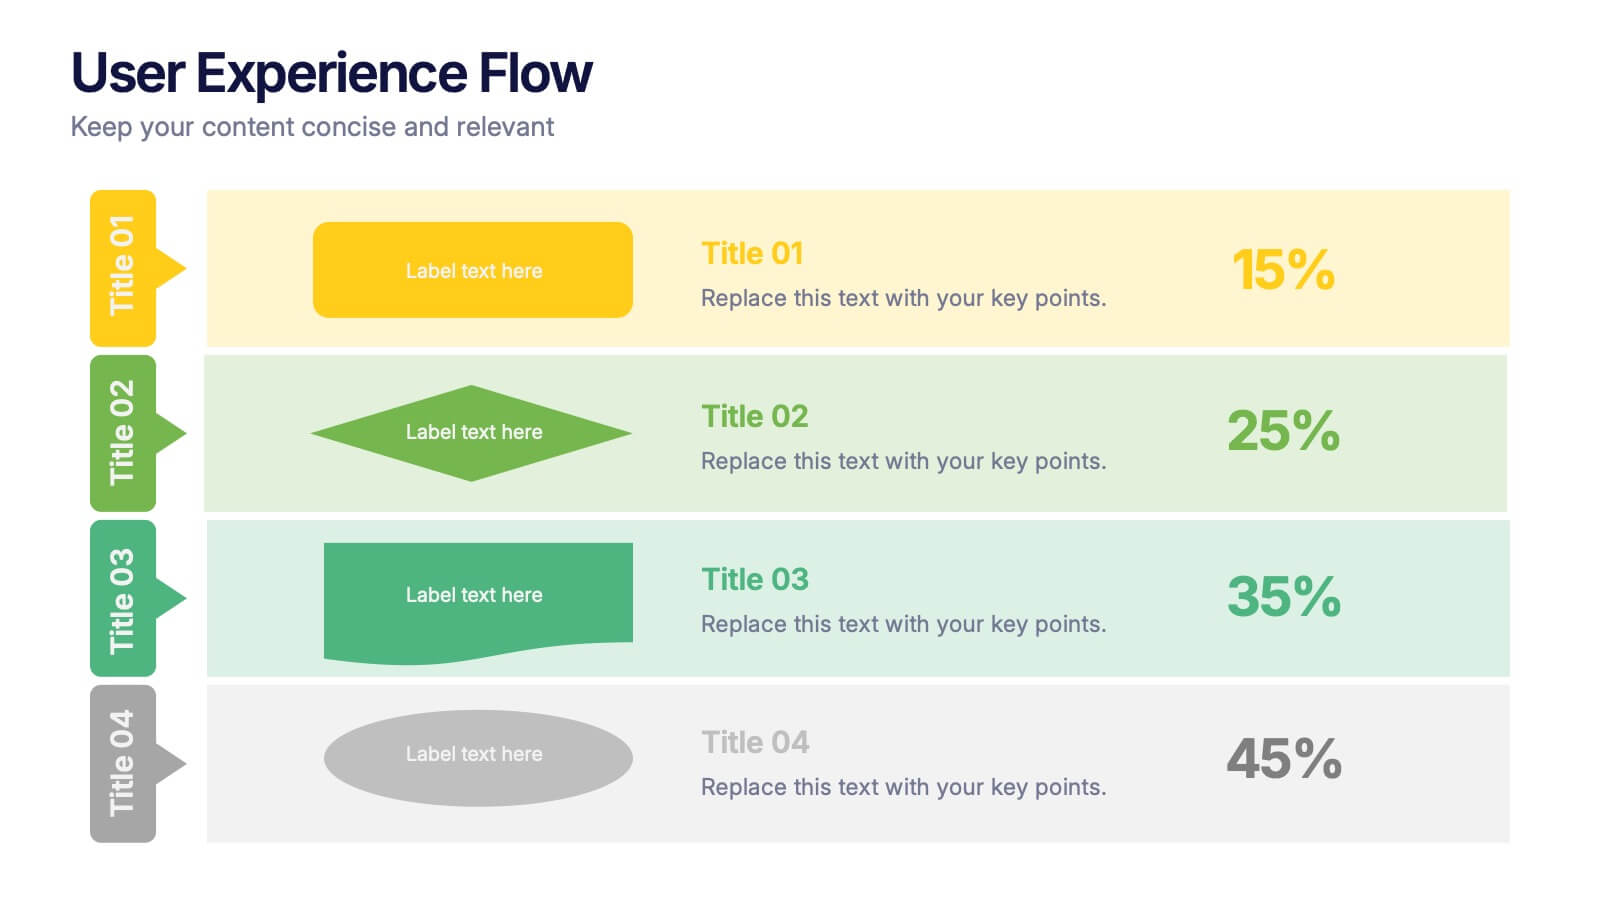
User Experience Flow Presentation
Bring clarity and color to every stage of your user experience process with this clean, structured presentation. It helps you outline steps, explain interactions, and highlight key insights in a visually intuitive flow. Easy to customize and fully compatible with PowerPoint, Keynote, and Google Slides.
- Eliminar de favoritos
Plantilla de PowerPoint
1 MB
Plantilla de Google Slides
Enlace externo
Plantilla de Keynote
1 MB
7 diapositivas
Feedback Management Infographic
Boost your presentation's impact with our Feedback Management infographic, optimized for Powerpoint, Keynote, and Google Slides. This infographic is an essential asset for professionals looking to present feedback data compellingly and concisely. Designed to convey customer satisfaction metrics and responses effectively, it's perfect for market researchers, customer service managers, and business analysts. The Feedback Management infographic is constructed to visually communicate the importance of customer insights and how they drive business improvements. It transforms complex data into an easy-to-understand format, which is crucial for making informed decisions based on customer feedback. The infographic's structured design assists audiences in comprehending the collected feedback at a glance, highlighting key figures and trends. Whether you're reporting on survey results or showcasing customer reviews, this infographic ensures your data is presented clearly. Compatible with leading presentation software, it allows for smooth integration into your slides, ensuring your feedback analysis stands out. Incorporate this infographic into your presentations to effectively display feedback management data and make a lasting impression.
- Eliminar de favoritos
Plantilla de PowerPoint
1 MB
Plantilla de Google Slides
Enlace externo
Plantilla de Keynote
2 MB
5 diapositivas
Professional Company Overview Slide Presentation
Showcase your business story with confidence using this sleek and structured layout designed for clarity and professionalism. Ideal for introducing teams, services, and company milestones, it helps you communicate key insights effectively. Fully customizable and compatible with PowerPoint, Keynote, and Google Slides for effortless presentation creation and editing.
- Eliminar de favoritos
Plantilla de PowerPoint
1 MB
Plantilla de Google Slides
Enlace externo
Plantilla de Keynote
1 MB
5 diapositivas
Task Automation Process Flow Presentation
Streamline operations with this visual task automation flowchart. Perfect for illustrating automated sequences, decision nodes, and multi-branch logic. Clearly labeled elements guide viewers through each step. Ideal for tech teams, process designers, and workflow planning. Fully editable in PowerPoint, Keynote, and Google Slides to match your branding and automation strategy.
- Eliminar de favoritos
Plantilla de PowerPoint
2 MB
Plantilla de Google Slides
Enlace externo
Plantilla de Keynote
2 MB
7 diapositivas
Travel Agency Infographic
A travel agency is a business that assists individuals or groups in planning, booking, and organizing travel and vacation experiences. This infographic template is designed to showcase the magic of travel and the essential services provided by travel agencies. This template is perfect for inspiring wanderlust and aiding travelers in planning their dream adventures. The primary goal is to make your travel planning process easier and more convenient for your audience. Compatible with Powerpoint, Keynote, and Google Slides. This template is your gateway to a world of exciting adventures and seamless travel planning.


