


Características


¿Tienes alguna pregunta?
Recomendar


7 diapositivas
Strategy Investment Wheel Infographic
The Strategy Wheel is a visual tool and framework used in strategic management to help organizations align their strategies, goals, and initiatives. This infographic template is designed to act as your compass, guiding you through the intricate pathways of investment strategies. This template brings forth the core concepts and strategic directions, ensuring you're well-equipped to steer your investment journey effectively. Compatible with Powerpoint, Keynote, and Google Slides. This infographic is depicted as a circular diagram divided into segments, each representing a key aspect of the organization's strategy.


22 diapositivas
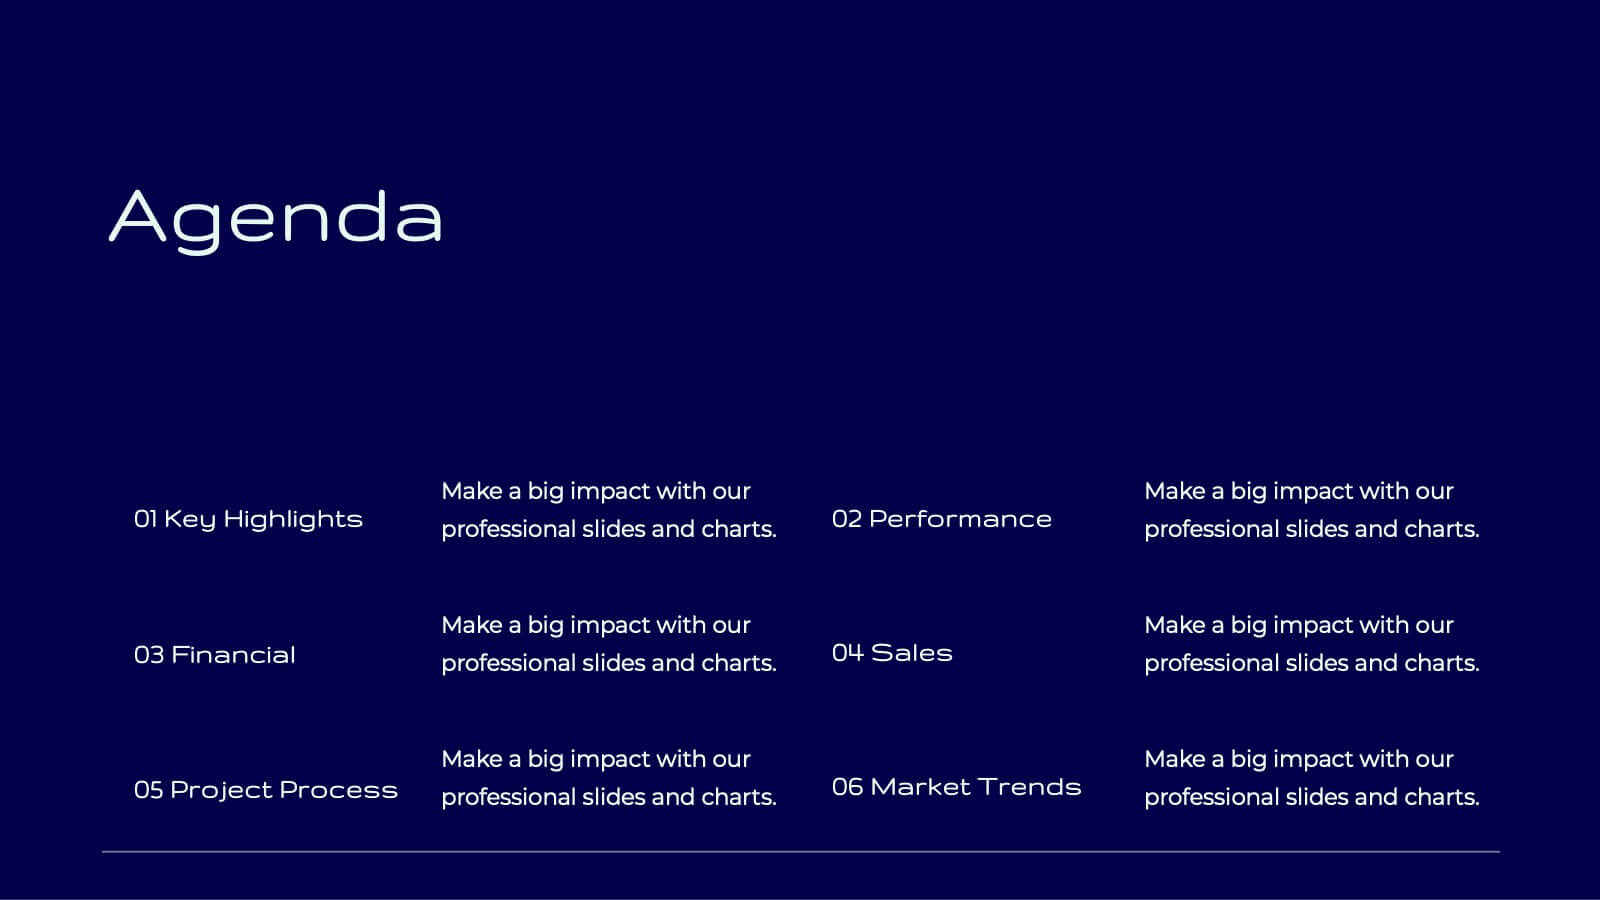
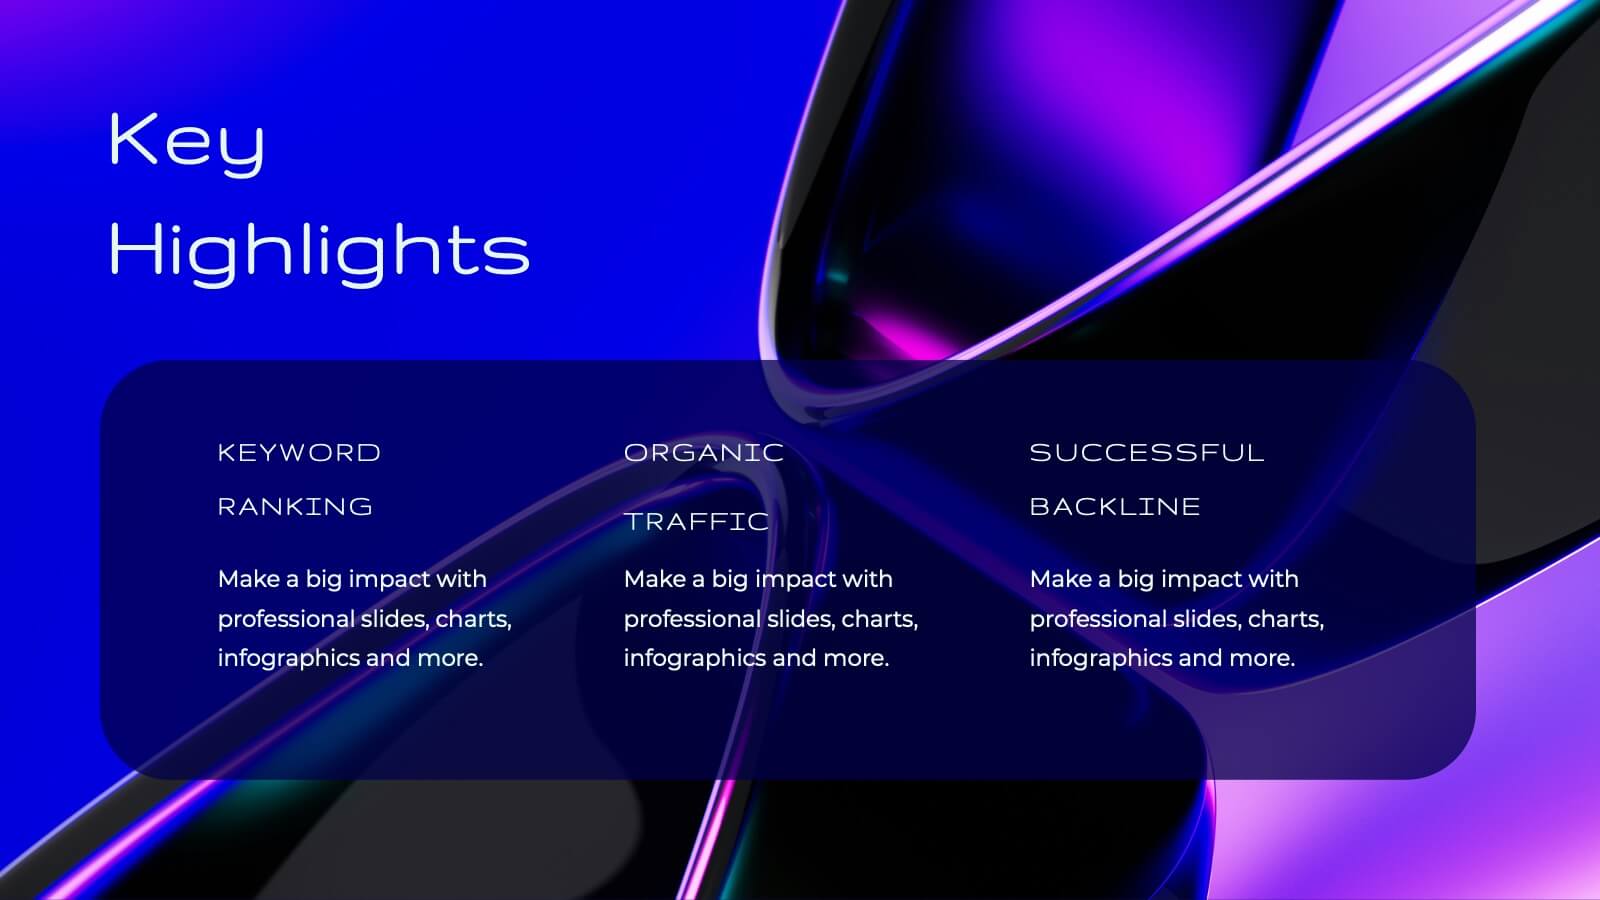
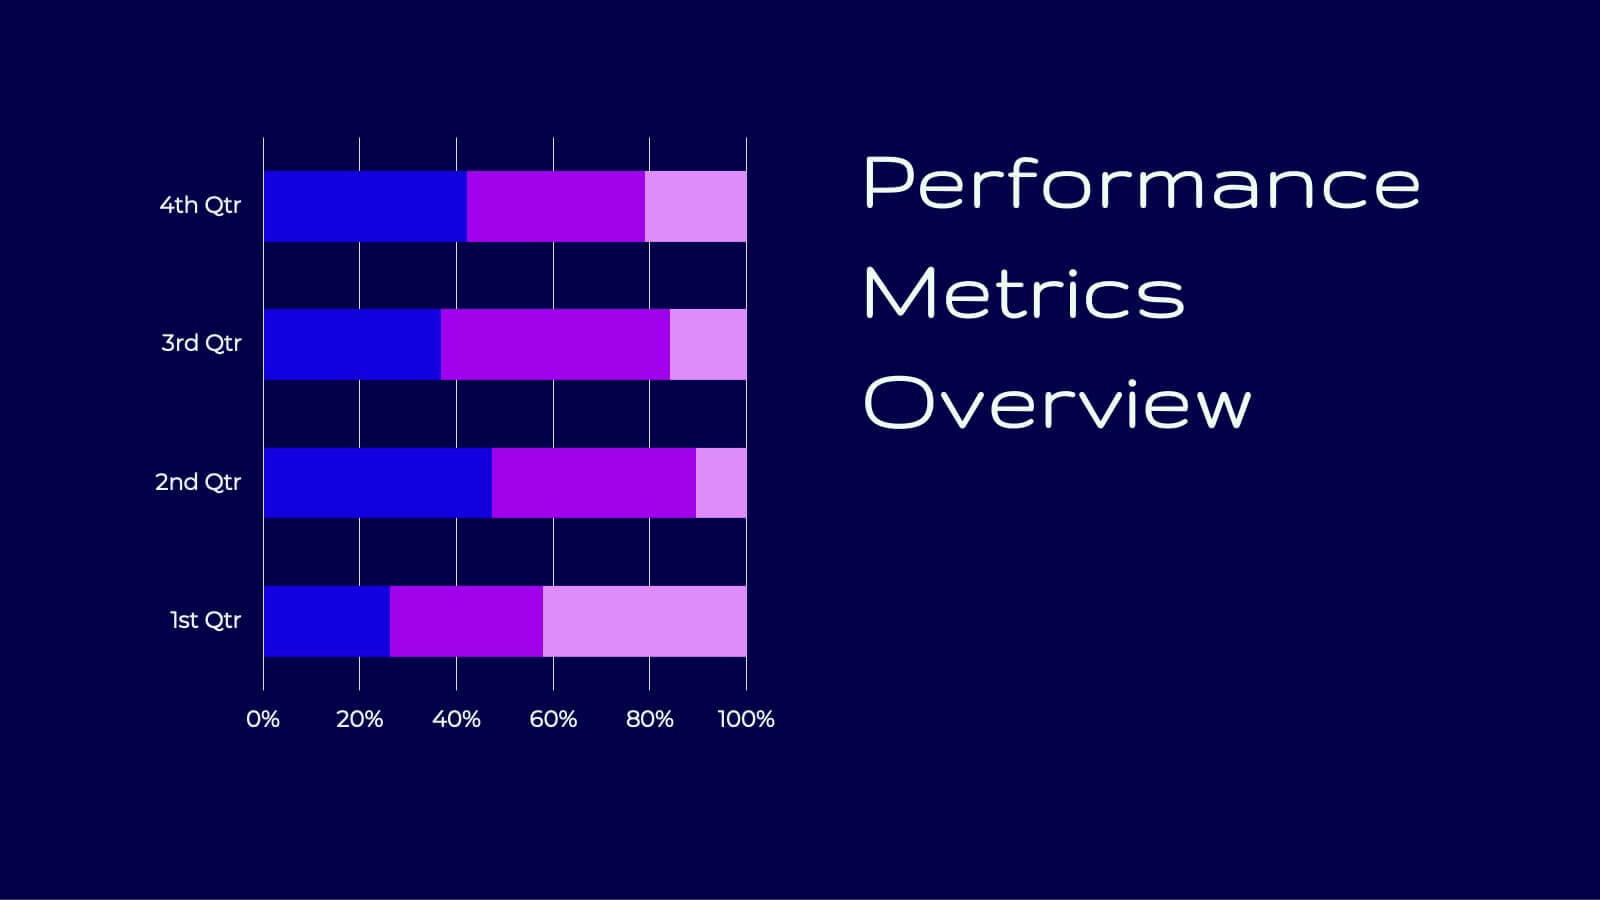
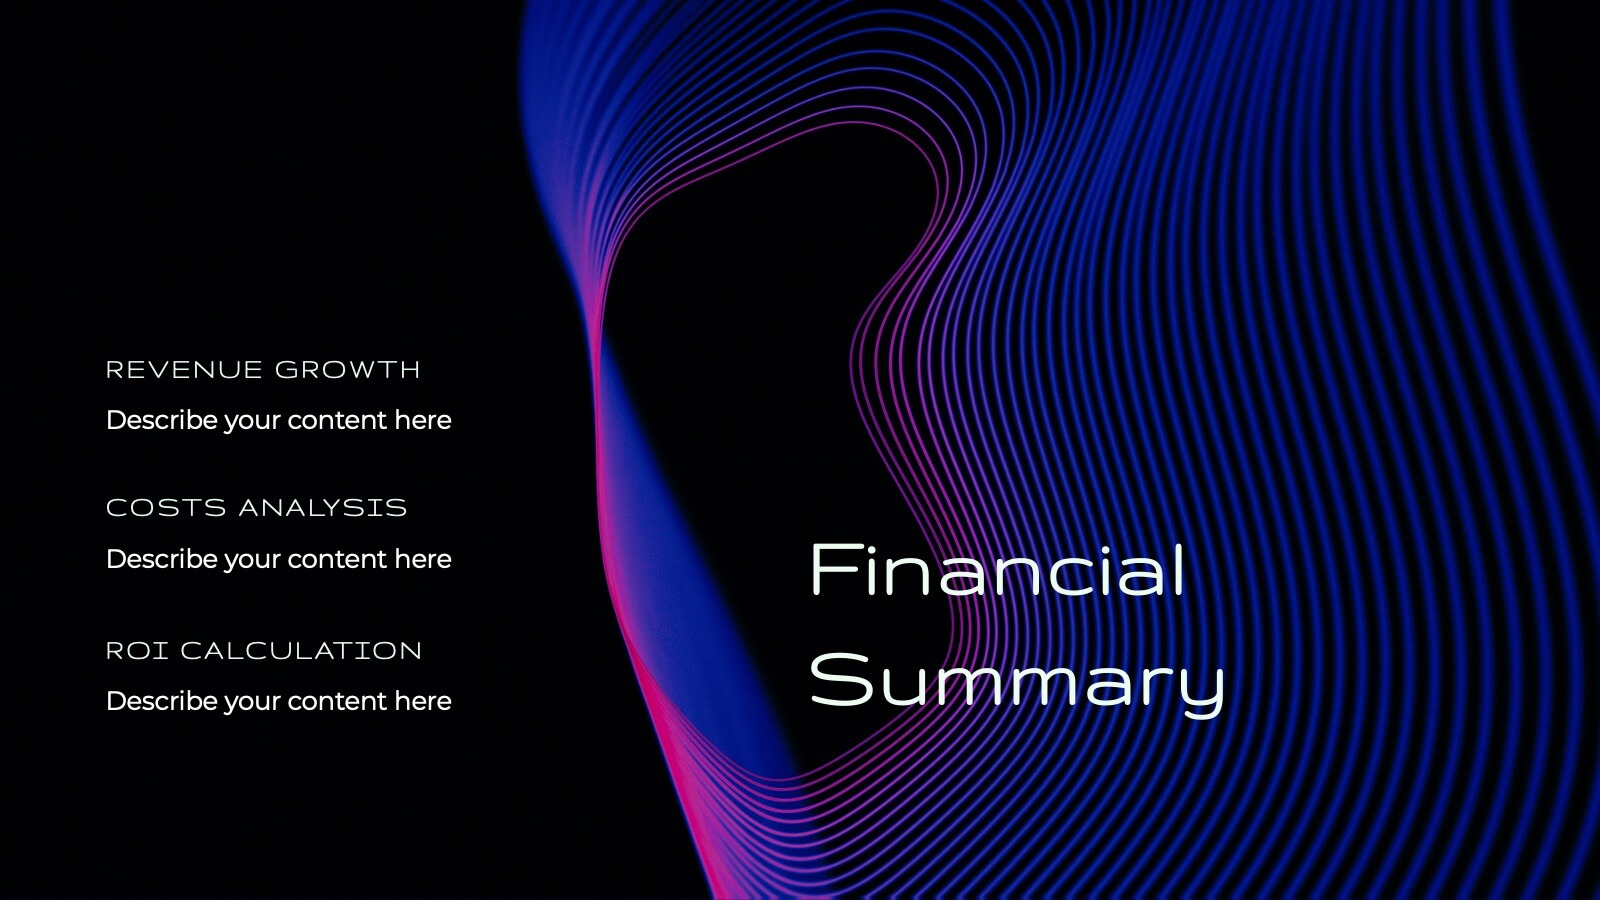
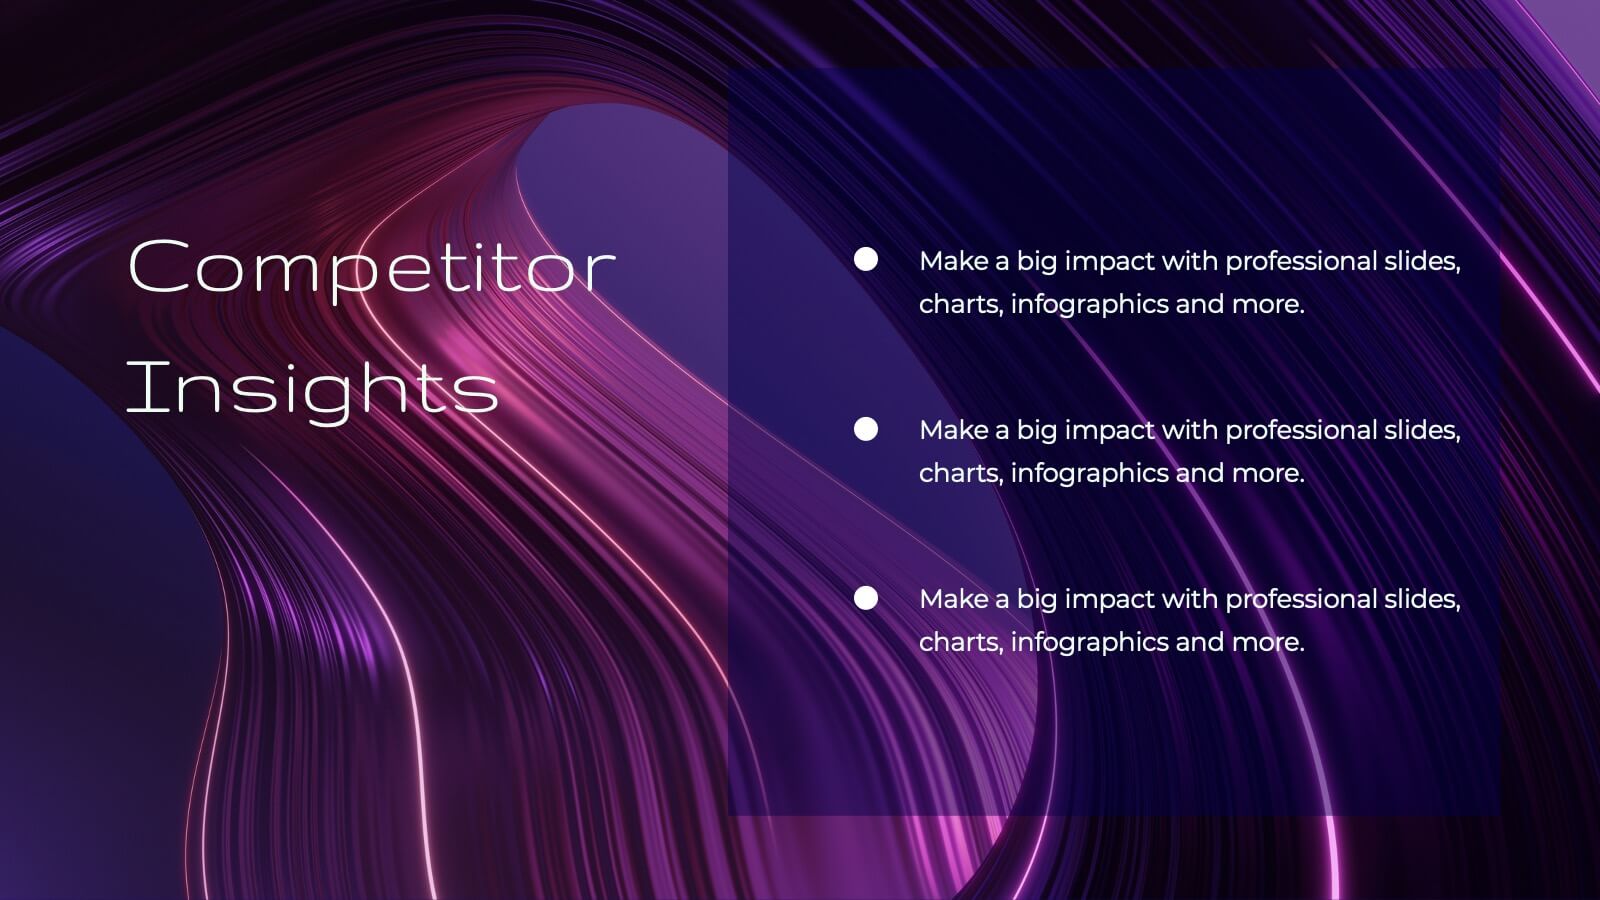
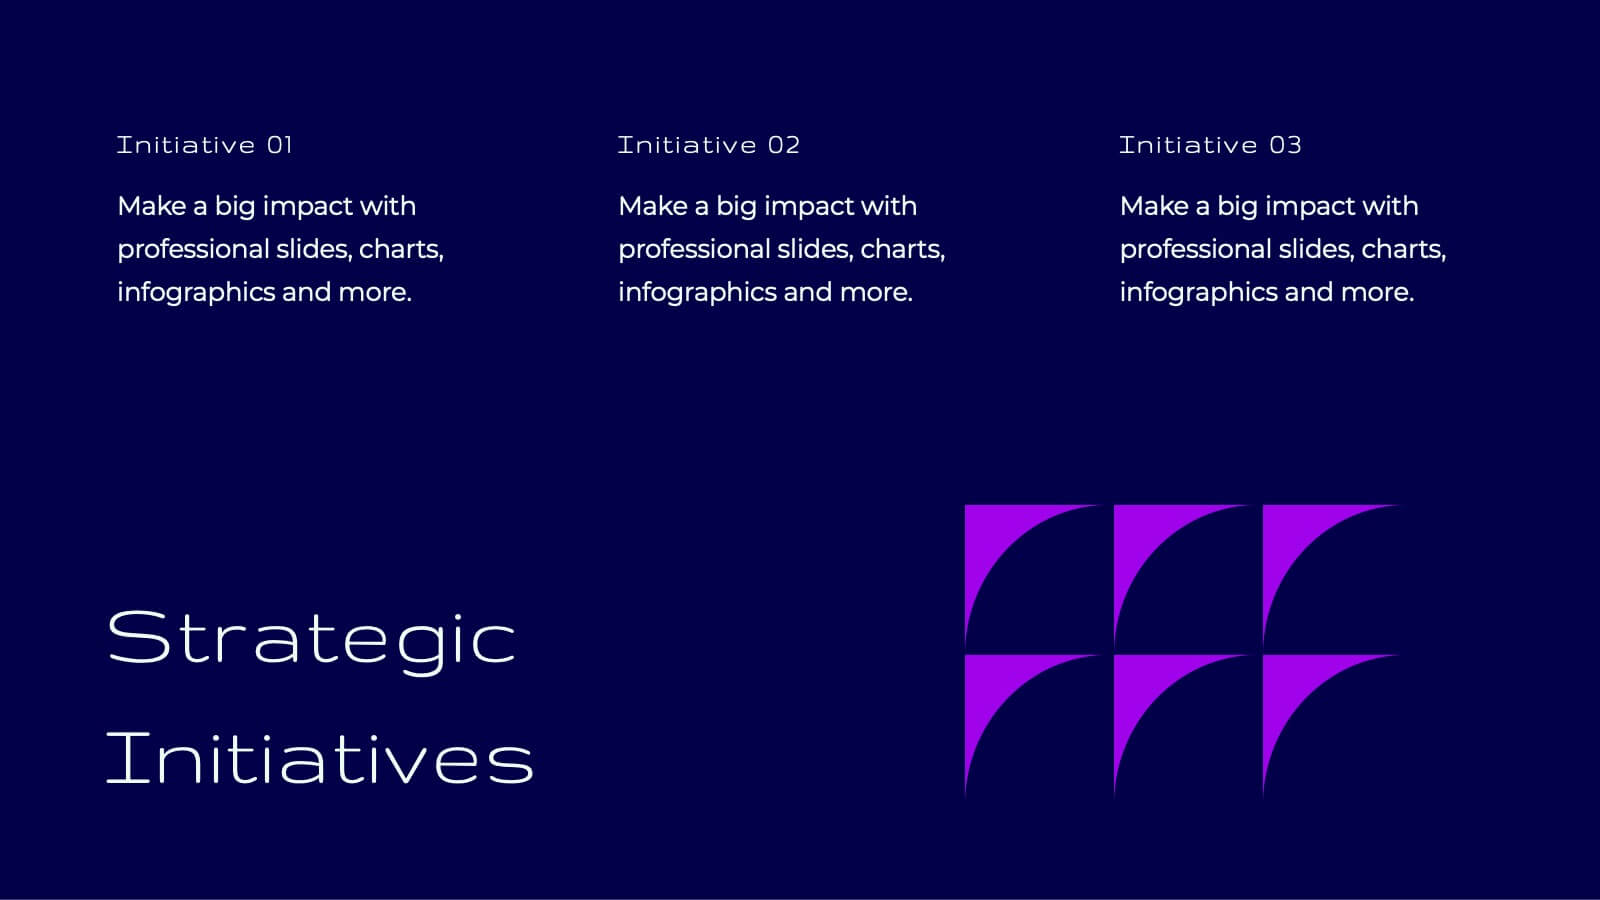
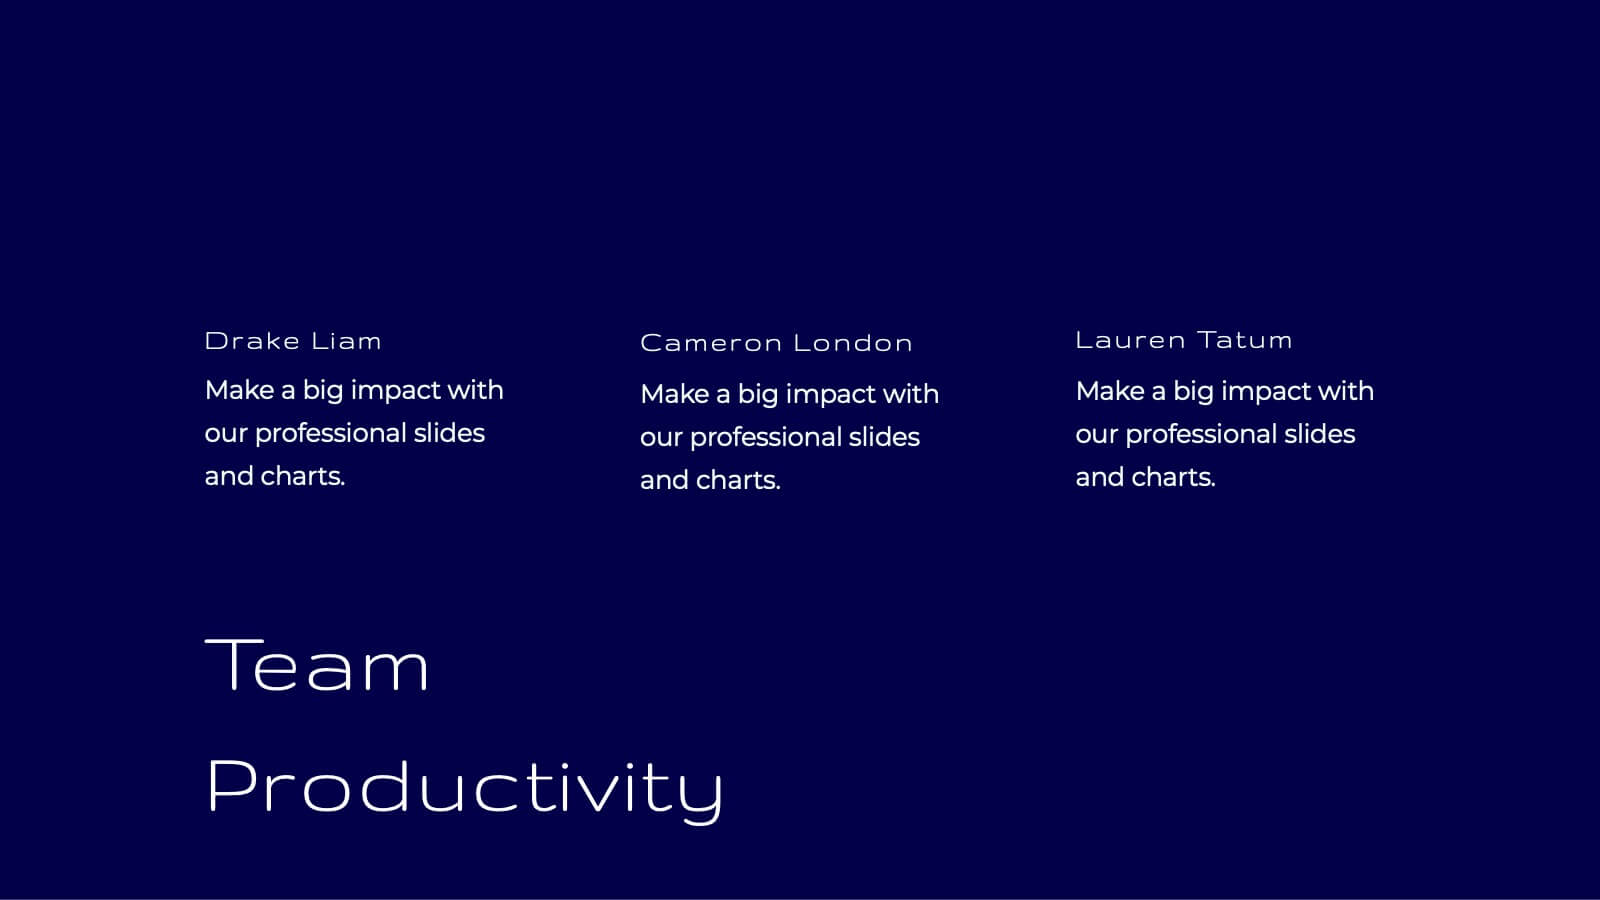
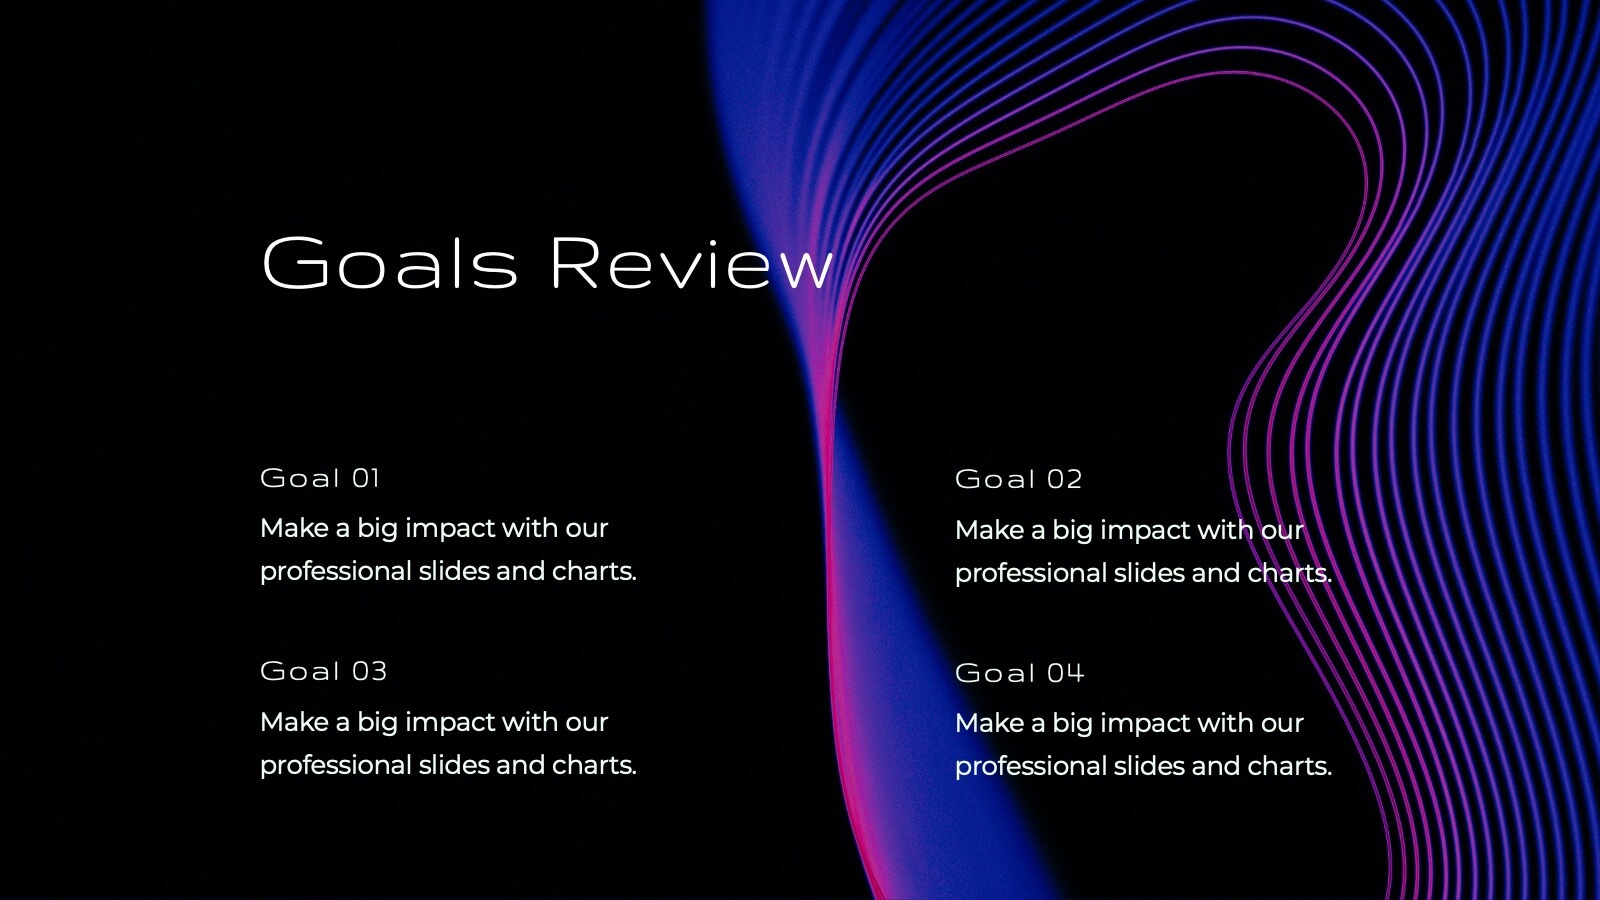
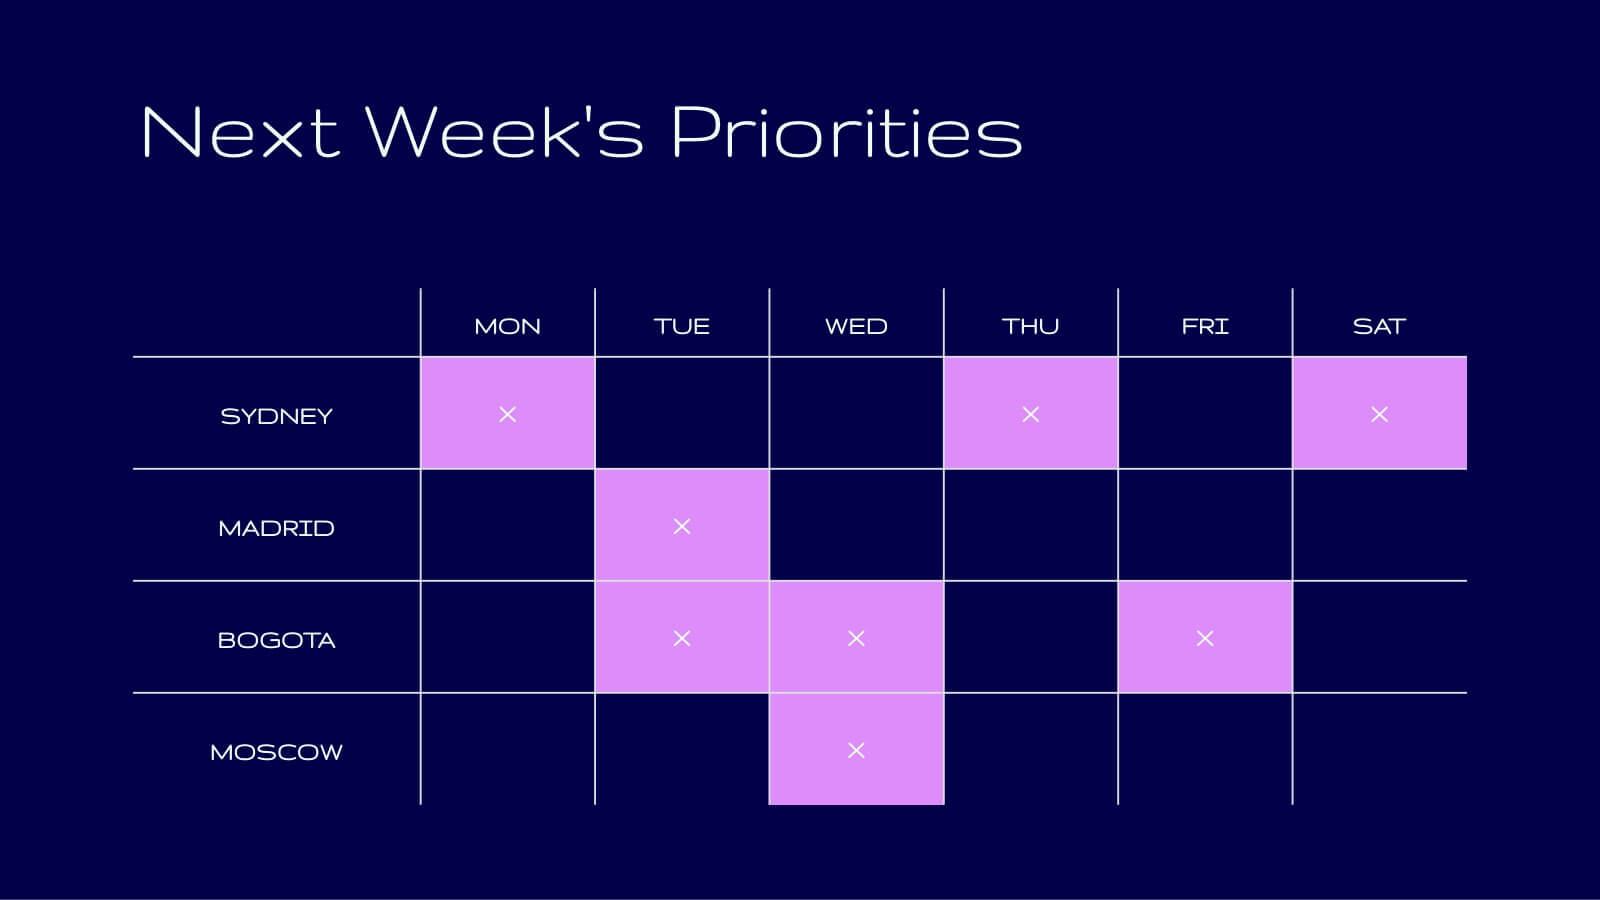
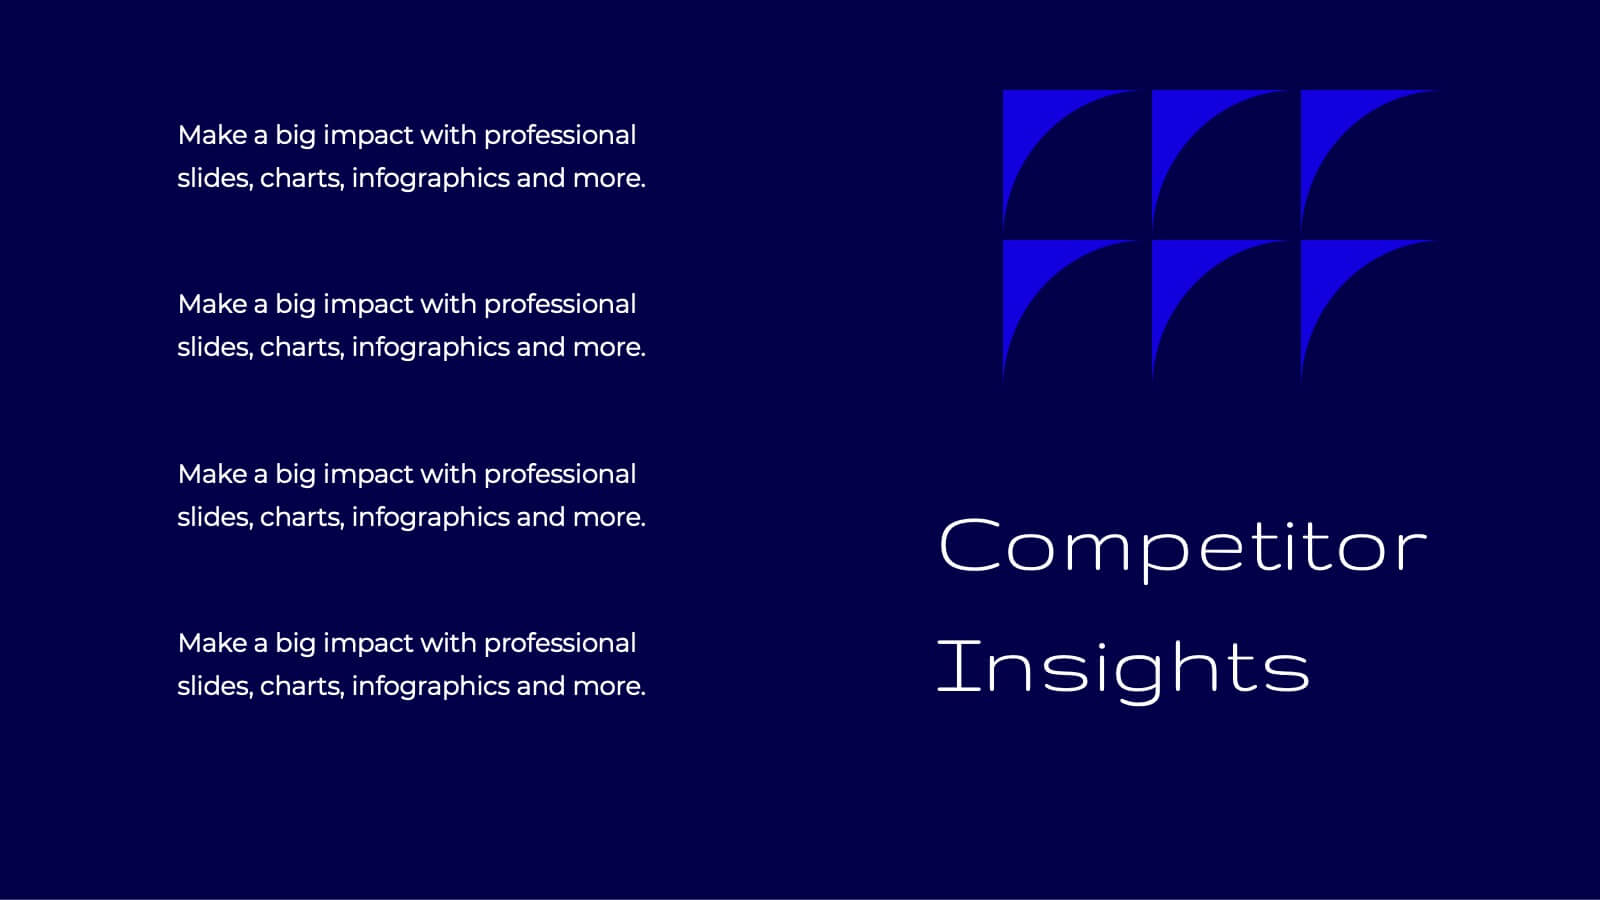
Tidal Research Findings Report Presentation
Deliver your research findings with impact using this sleek and modern report template! It covers key highlights, performance metrics, project progress, and competitor insights, making it ideal for clear, professional presentations. Perfect for summarizing challenges, solutions, and strategic initiatives. Compatible with PowerPoint, Keynote, and Google Slides for seamless reporting.


4 diapositivas
Risk Impact Matrix Grid Presentation
Visualize project risk with this customizable impact matrix grid. Designed for quick risk assessment, it helps you map likelihood versus impact using color-coded indicators and clean grid layouts. Ideal for strategic planning, audits, or compliance meetings. Compatible with PowerPoint, Google Slides, and Keynote for seamless editing and professional presentations.


4 diapositivas
Stakeholder Analysis Template for Projects Presentation
Turn complex stakeholder relationships into clear, actionable insights with this dynamic and modern quadrant design. Ideal for visualizing influence, communication strategies, and engagement priorities, it helps teams build stronger collaboration frameworks. Fully editable and compatible with PowerPoint, Keynote, and Google Slides for effortless professional use.


4 diapositivas
Colorful Workflow Process Chart Presentation
Bring your workflow to life with a vibrant, easy-to-follow layout that makes every stage feel connected and purposeful. This presentation helps you map processes, explain team roles, and simplify complex steps using a clean, visual flow. Fully compatible with PowerPoint, Keynote, and Google Slides.


6 diapositivas
Creative Alphabetic Infographic
Bring your message to life with a bright, alphabet-inspired layout that turns simple letters into eye-catching storytelling elements. This presentation is perfect for organizing steps, categories, or key ideas in a memorable way while keeping everything clear and structured. Fully editable and compatible with PowerPoint, Keynote, and Google Slides.


6 diapositivas
Business Growth Metrics Butterfly Chart
Highlight performance patterns and opportunities with the Business Growth Metrics Butterfly Chart Presentation. This engaging layout uses mirrored radial segments to present six growth indicators—ideal for tracking progress across two categories, departments, or timeframes. The butterfly-shaped curves draw the viewer’s attention to the center, making comparisons intuitive and visually balanced. Fully customizable in PowerPoint, Keynote, and Google Slides, this template is perfect for showcasing KPI trends, sales metrics, or marketing performance.


23 diapositivas
Blade Corporate Strategy Proposal Presentation
Prepare to captivate your audience with the Blade Corporate Strategy Proposal template! This sleek and modern design is perfect for professionals looking to present their strategic objectives with clarity and impact. The template features a balanced color palette of blue and white, exuding professionalism while ensuring your content stands out. From analyzing the current landscape to outlining key challenges and growth opportunities, each slide is meticulously crafted to convey your strategic vision effectively. The clean layout ensures that complex data, such as SWOT analysis, performance metrics, and competitive analysis, is easily digestible. With dedicated sections for team roles, resource allocation, and timelines, this template helps you guide your audience through every step of your strategic plan. Fully compatible with PowerPoint, Keynote, and Google Slides, the Blade template is your go-to choice for delivering presentations that resonate with decision-makers and stakeholders alike.


10 diapositivas
Profitability and Cost Analysis
Streamline your financial storytelling with this interlinked diagram template. Designed for business consultants, CFOs, and analysts, it helps visualize cost components and profit drivers across five stages. Each segment is clearly labeled and color-coded for easy comprehension. Fully customizable in PowerPoint, Keynote, and Google Slides.


25 diapositivas
The Power of HIIT Presentation
Supercharge your fitness routine with this high-energy presentation on the power of HIIT. Covering key benefits like fat burning, muscle endurance, metabolism boost, and time-efficient workouts, this template helps break down the science behind high-intensity interval training. Fully customizable and compatible with PowerPoint, Keynote, and Google Slides for a seamless presentation experience.


7 diapositivas
Finance in Business Infographic Presentation
Finance is an essential component of any economy, and it plays a crucial role in enabling businesses, individuals, and governments to manage their resources effectively. Use this template to help others understand the basics of finance in a simple manner. Finance is very broad, this template contains everything you need to keep track of your spending and earning. This has been designed to help you deliver informative Infographics that convey the main points of your topic. It is compatible with PowerPoint, Keynote and Google Slides, so you can easily change the text, add images, and change colors.


6 diapositivas
RACI Responsibilities Assignment Matrix Presentation
Bring clarity and structure to your workflow with a clean layout that instantly shows who’s doing what and when. This presentation helps you assign ownership, improve communication, and eliminate confusion across projects using a simple visual matrix. Fully editable and compatible with PowerPoint, Keynote, and Google Slides.


2 diapositivas
Stylish Title Cover Presentation for Reports Presentation
Set the tone with a title slide that means business—without being boring. This stylish cover layout gives your report presentations a polished, modern look while keeping the focus clear and professional. Ideal for executive updates or client-facing decks, it’s fully editable and works perfectly in PowerPoint, Keynote, and Google Slides.


6 diapositivas
KPI Metric Infographic
KPI stands for Key Performance Indicator, and it is a measurable value that helps organizations track their progress and performance towards achieving specific business goals and objectives. This infographic template is designed to display key performance indicators and metrics in a concise and easy-to-understand manner. KPIs are quantifiable measurements used to evaluate the success of an organization, project, or specific business activities. The infographic provides a visual representation of these KPIs, making it easier for stakeholders and decision-makers to interpret the data and track progress.


7 diapositivas
Organizational Change with 7S Framework Presentation
Visualize organizational transformation with the Organizational Change with 7S Framework Presentation. This slide highlights each element of the McKinsey 7S model—Structure, Strategy, Systems, Shared Values, Skills, Style, and Staff—along an S-shaped flow. Ideal for consulting, internal alignment, and strategic planning discussions. Fully editable in Canva, PowerPoint, Keynote, and Google Slides.


26 diapositivas
AIl for Social Good Presentation
Harness the power of technology for positive change with this inspiring presentation on AI for social good. Covering topics like ethical AI, humanitarian applications, sustainability, and global impact, this template helps showcase how artificial intelligence can drive meaningful progress. Fully customizable and compatible with PowerPoint, Keynote, and Google Slides for a seamless experience.


6 diapositivas
Product Life Cycle Stages and Management Presentation
Visualize the journey from product development to market maturity with this modern, conveyor-style layout. Designed to represent five sequential phases, this presentation is perfect for product managers, marketing teams, or business strategists explaining launch strategies, performance tracking, or growth planning. Fully editable in PowerPoint, Keynote, and Google Slides.