Logistic Growth Infographics
PowerPoint Template and Google Slides Theme


Características
Etiquetas
- Eliminar de favoritos
Plantilla de PowerPoint
1 MB
Plantilla de Google Slides
Enlace externo
Plantilla de Keynote
1 MB
Recomendar
- Eliminar de favoritos
Plantilla de PowerPoint
1 MB
Plantilla de Google Slides
Enlace externo
Plantilla de Keynote
2 MB
5 diapositivas
Poaching Effects Infographics
Navigate the critical issue of wildlife endangerment with our poaching effects infographics. Crafted in earthy tones of brown and tan, this informative and creatively styled vertical template sheds light on the harsh realities of illegal wildlife hunting. Whether you're an environmental activist, an educator, or part of an ecological research team, this infographic is structured to resonate with your audience, offering compelling visuals and thematic icons that starkly represent the consequences of poaching. It's more than a presentation; it's a call to global action, crucial for anyone advocating for wildlife preservation and aiming to inspire change through storytelling.
- Eliminar de favoritos
Plantilla de PowerPoint
1 MB
Plantilla de Google Slides
Enlace externo
Plantilla de Keynote
1 MB
5 diapositivas
Technology Trends Infographics
Navigate the forefront of innovation with our technology trends infographics. This template, designed in a spectrum of futuristic blue, vibrant pink, and a cascade of colors, embodies the essence of cutting-edge developments. Its creative vertical style is a nod to the rapid, trajectory of tech advancements, ideal for entrepreneurs, and analysts. It comes equipped with sleek graphics, icons, and image placeholders, all structured to distill complex trends. Whether you're illustrating tech landscapes or forecasting the digital future, this template is a quintessential asset for artistically communicating the pulse of technology's ever-evolving realm.
- Eliminar de favoritos
Plantilla de PowerPoint
1 MB
Plantilla de Google Slides
Enlace externo
Plantilla de Keynote
2 MB
8 diapositivas
Governance and Compliance Framework
Streamline your compliance reporting with this triangle-based governance framework slide. Featuring three core pillars—Risk, Strategy, and Leadership—this layout visually connects your organizational roles, responsibilities, and regulatory measures. Each corner is paired with numbered titles and editable icons, perfect for illustrating audits, policies, or internal controls. Fully editable in PowerPoint, Keynote, and Google Slides.
- Eliminar de favoritos
Plantilla de PowerPoint
1 MB
Plantilla de Google Slides
Enlace externo
Plantilla de Keynote
3 MB
7 diapositivas
Company Vision Infographic
Discover a suite of Slide Templates designed to articulate strategic goals and company ethos. These templates vary in design, from minimalistic and professional layouts to vibrant and dynamic presentations. Each template integrates elements that allow for a clear depiction of objectives, facilitating effective communication across your organization. These templates are perfect for executives and team leaders looking to present long-term strategies and unify their team's vision. They come equipped with customizable features to align with your company’s branding, ensuring a coherent and impactful presentation. Ideal for corporate presentations, stakeholder meetings, and internal communications, these templates provide a sophisticated tool to express and reinforce your strategic direction.
- Eliminar de favoritos
Plantilla de PowerPoint
1 MB
Plantilla de Google Slides
Enlace externo
Plantilla de Keynote
1 MB
7 diapositivas
Sustainability Risk Management Infographic
Elevate your presentations with our Sustainability Risk Management infographic, compatible with Powerpoint, Keynote, and Google Slides. This infographic is a vital tool for professionals dedicated to showcasing the importance of sustainable practices and risk mitigation in their organizations. It's crafted to display the interconnectivity between environmental, social, and governance (ESG) factors and business operations. Our Sustainability Risk Management infographic effectively breaks down complex sustainability challenges into digestible parts. It's an invaluable resource for corporate strategists, environmental consultants, and policy makers. By simplifying the communication of sustainability data, it encourages stakeholder engagement and facilitates strategic planning sessions. The design of the infographic ensures that sustainability goals and risk assessments are presented in an engaging and memorable manner. It supports your narrative by visually guiding your audience through the elements of sustainability that are pivotal for risk management. By integrating this infographic into your slide decks, you can confidently convey the message that responsible management is key to long-term success.
- Eliminar de favoritos
Plantilla de PowerPoint
1 MB
Plantilla de Google Slides
Enlace externo
Plantilla de Keynote
1 MB
6 diapositivas
Financial Forecasting and Numerical Analysis Presentation
Visualize your financial insights with clarity using this clean and modern bar chart template. Designed for presenting financial projections, budget analysis, and performance metrics, this slide breaks down six key categories for easy comparison. Ideal for financial reviews, business updates, or investment pitches. Fully editable in PowerPoint, Keynote, and Google Slides.
- Eliminar de favoritos
Plantilla de PowerPoint
1 MB
Plantilla de Google Slides
Enlace externo
Plantilla de Keynote
1 MB
5 diapositivas
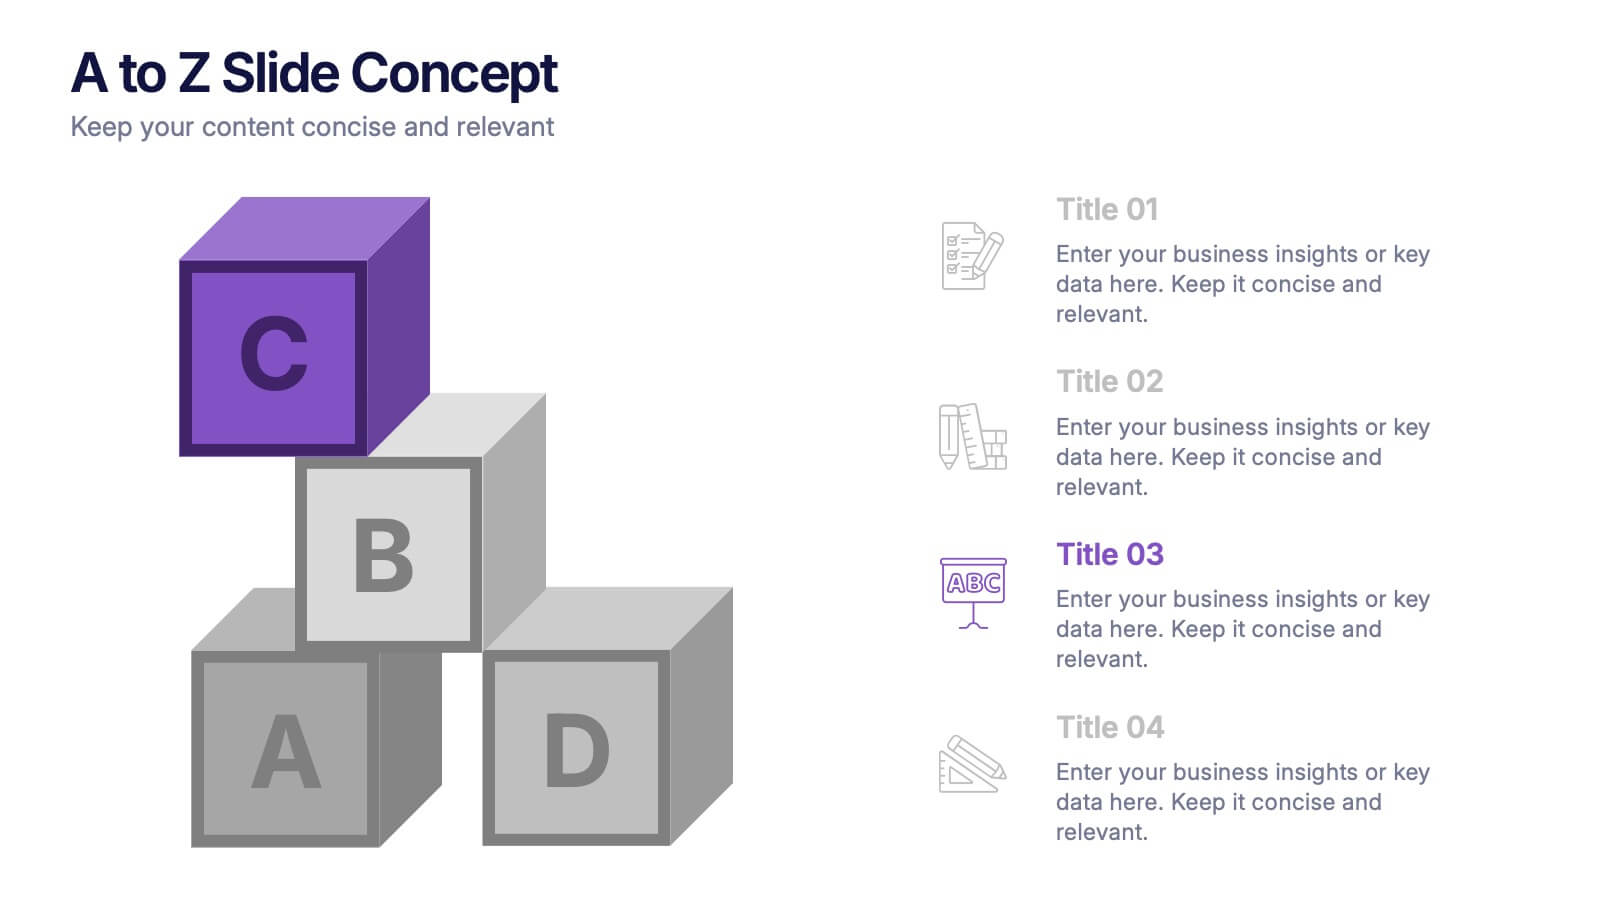
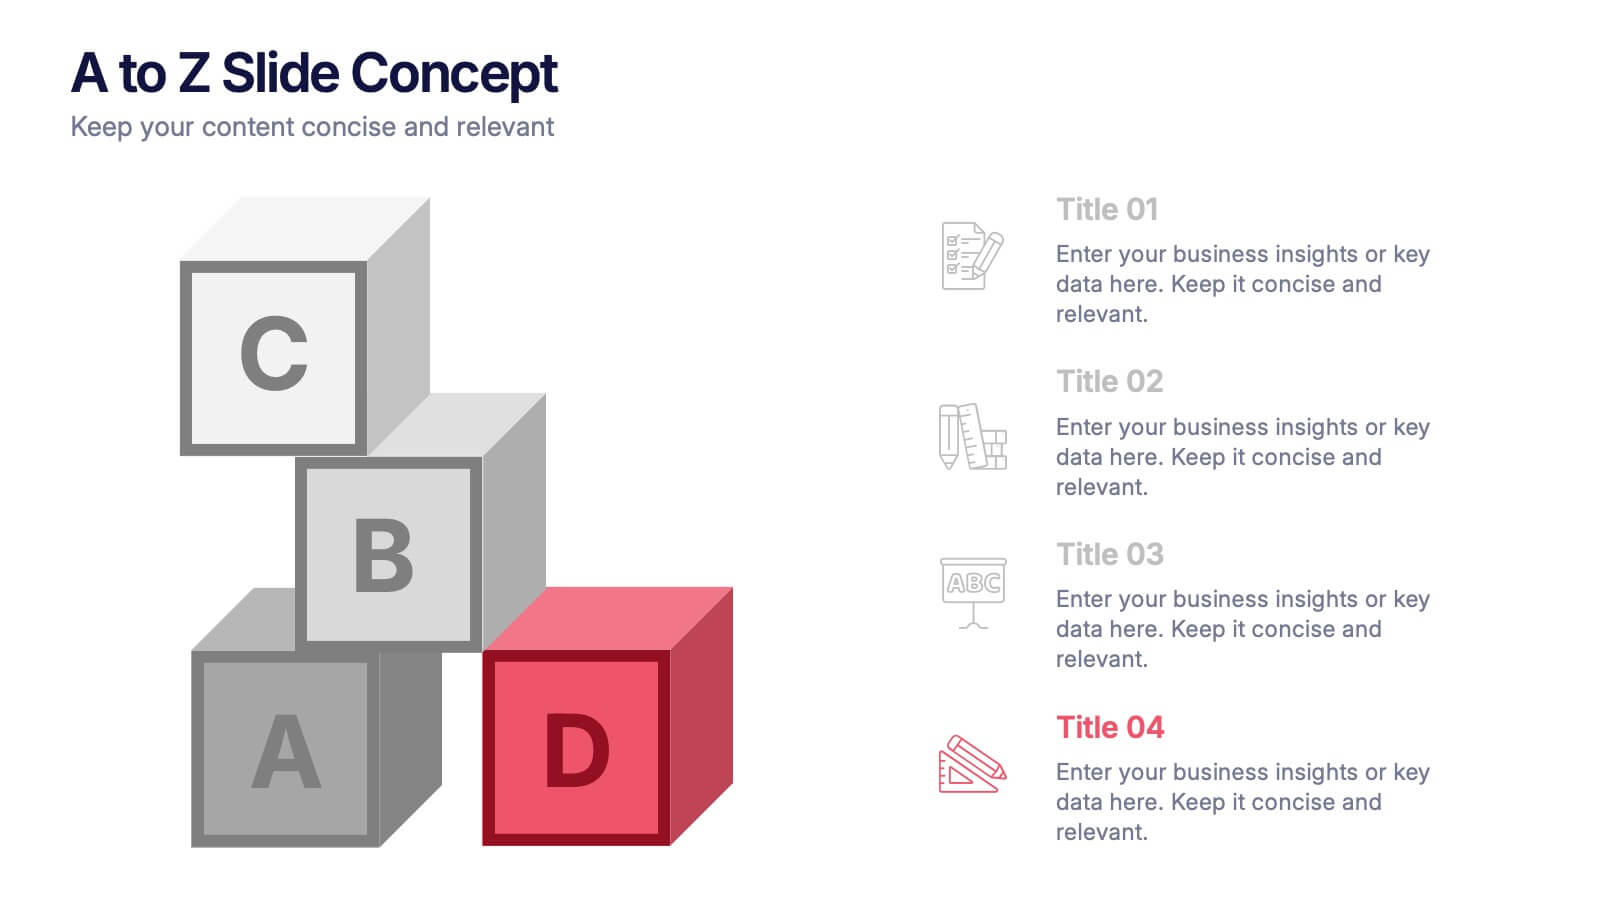
A to Z Slide Concept Presentation
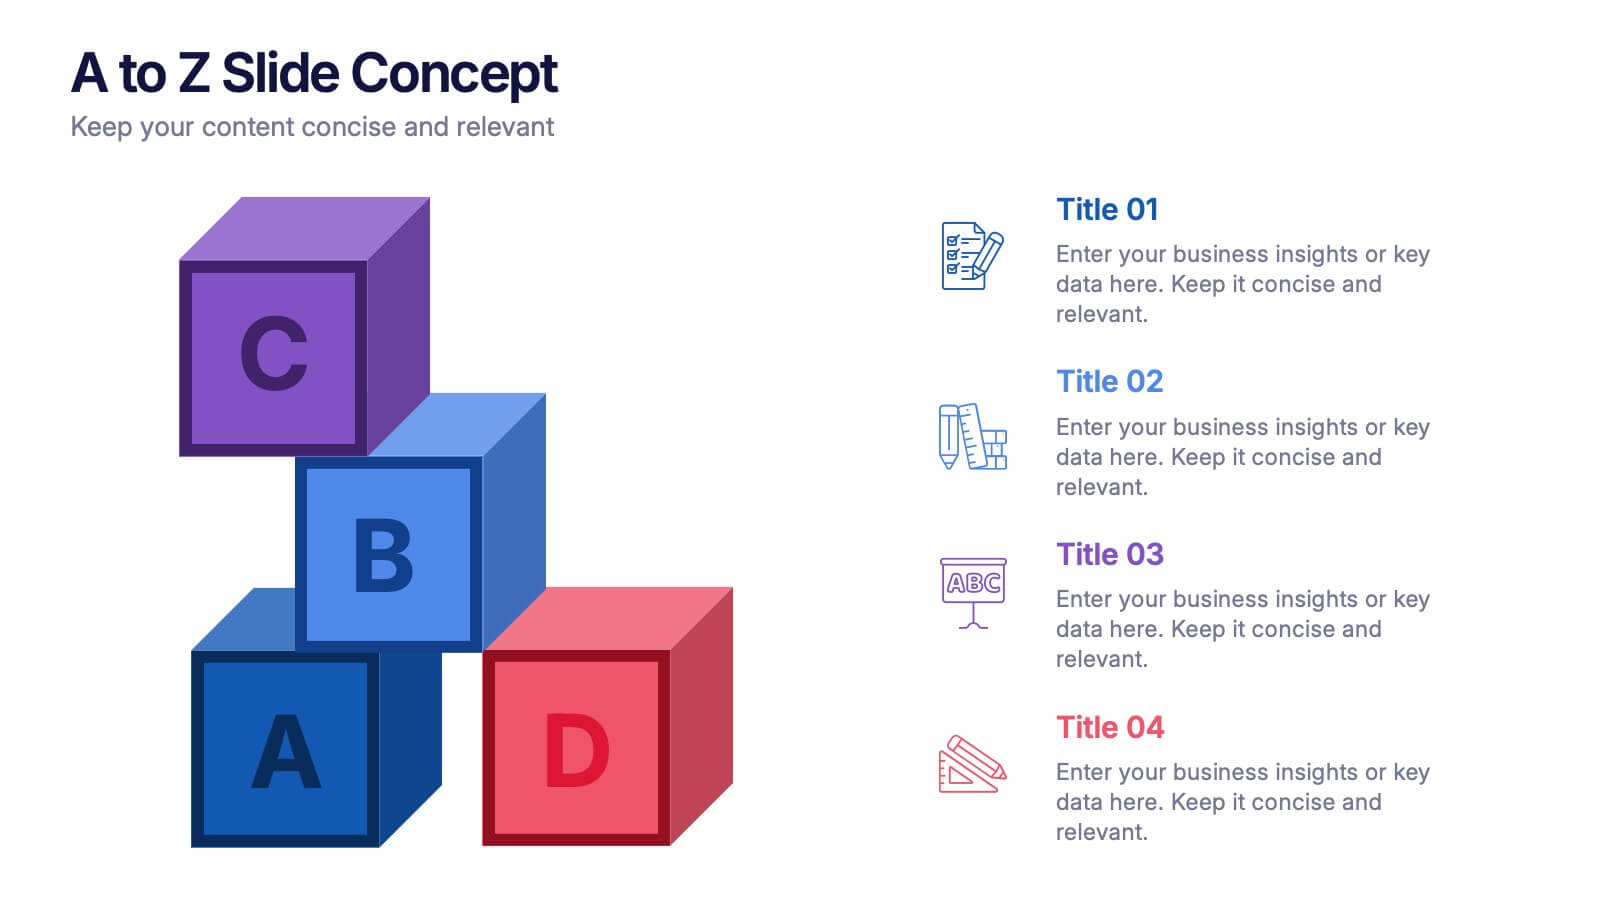
Bring your ideas to life with a bold, block-style visual that makes complex concepts feel simple and structured. This slide is perfect for breaking down processes, frameworks, or step-by-step explanations in a clear, memorable way. Fully editable and compatible with PowerPoint, Keynote, and Google Slides.
- Eliminar de favoritos
Plantilla de PowerPoint
1 MB
Plantilla de Google Slides
Enlace externo
Plantilla de Keynote
1 MB
5 diapositivas
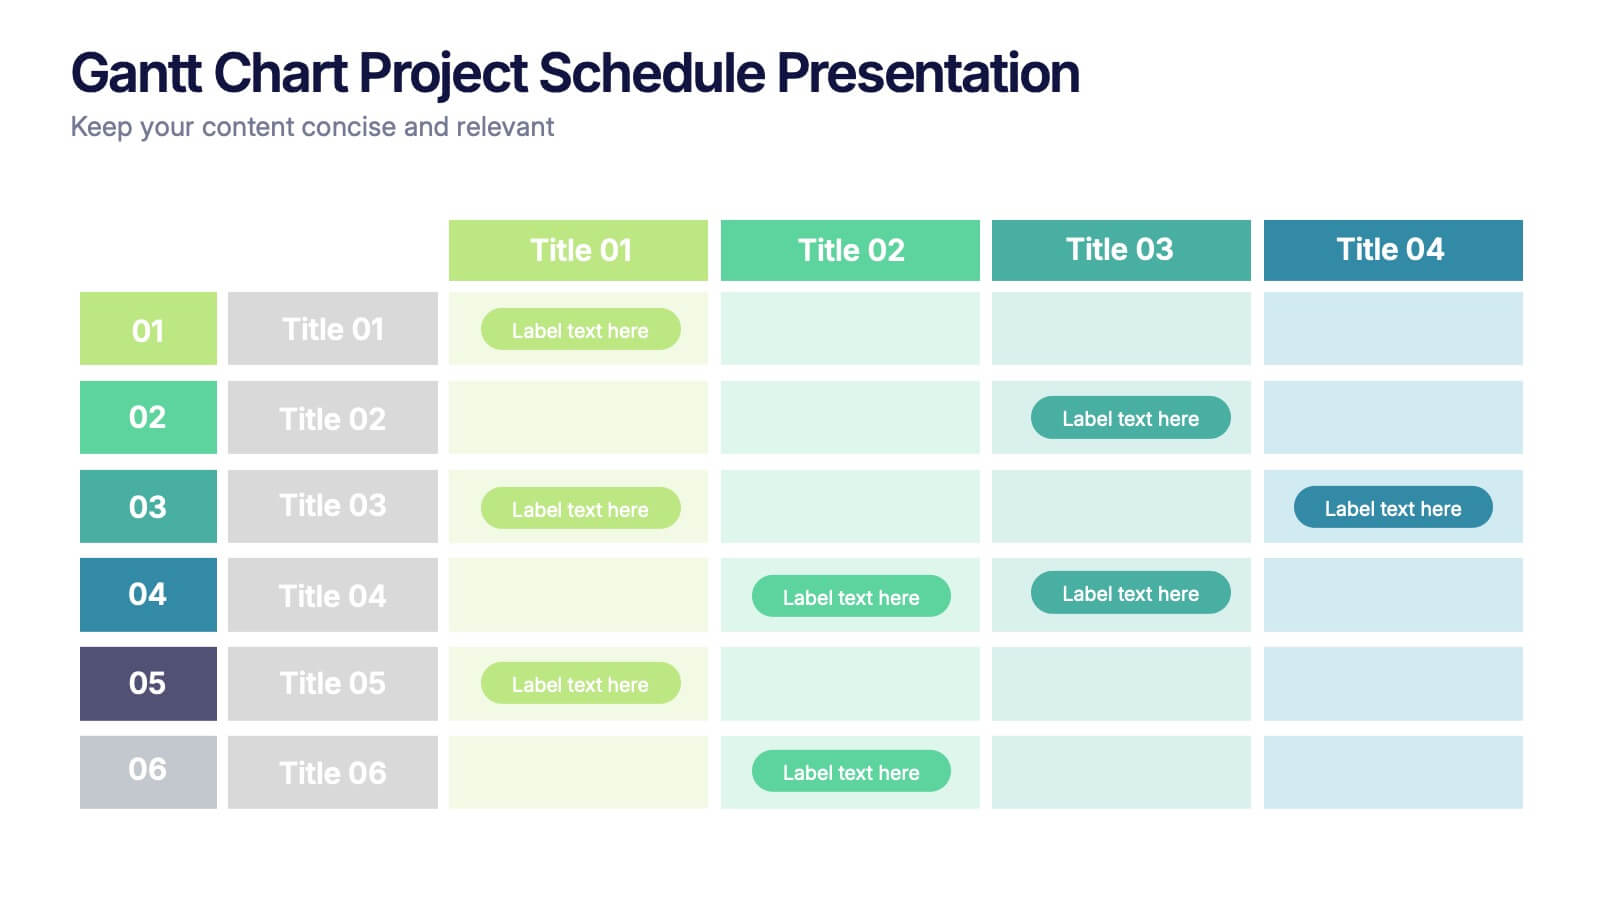
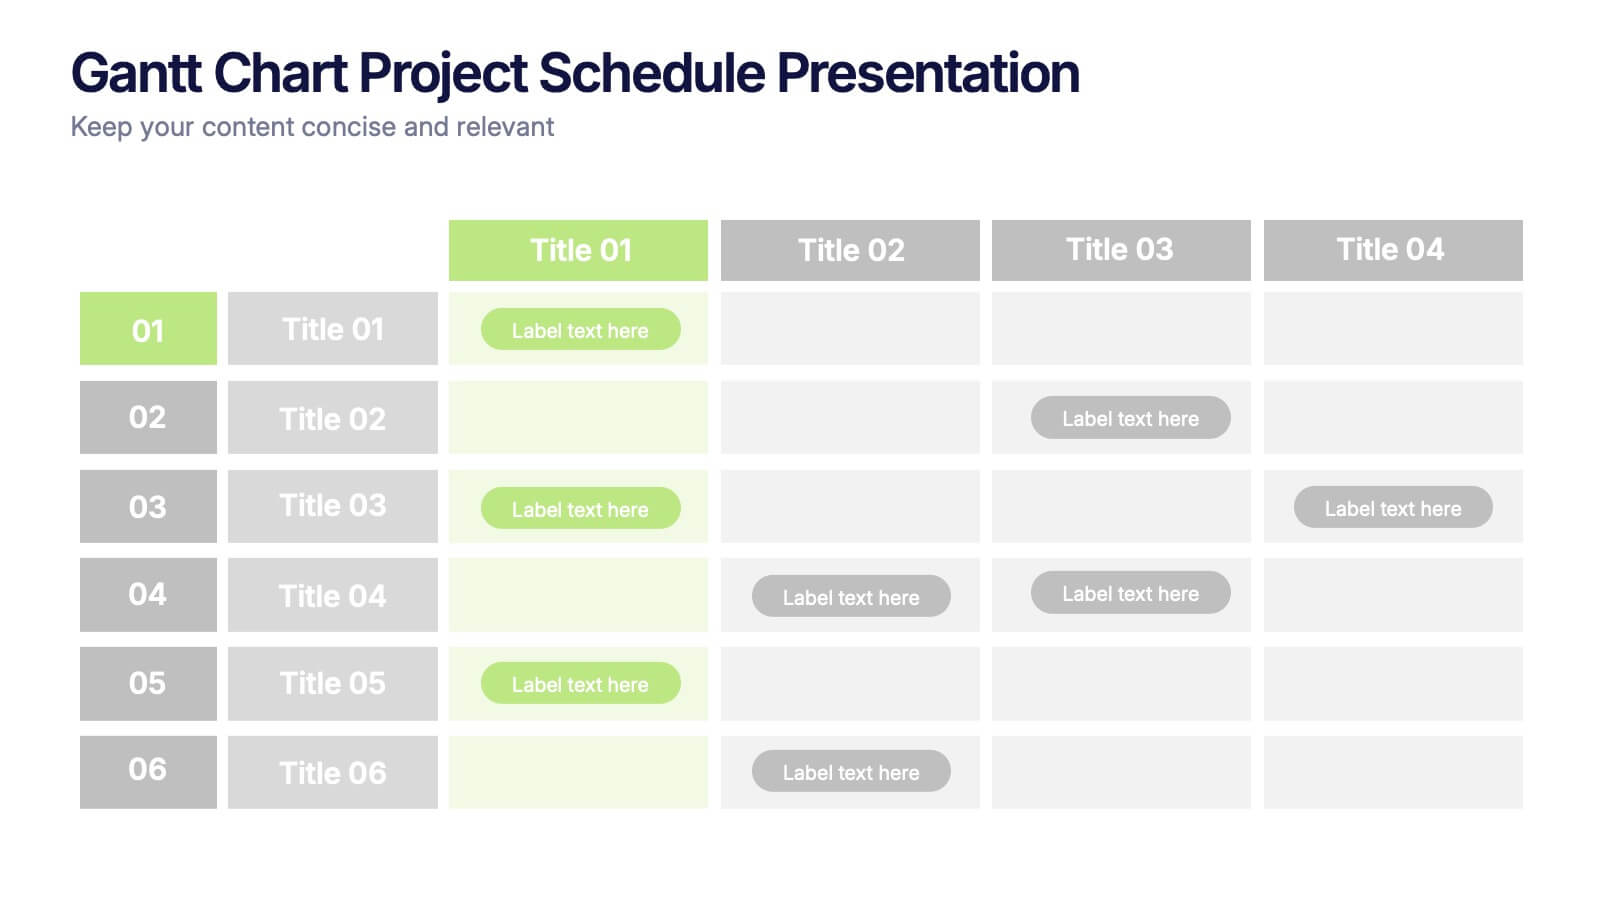
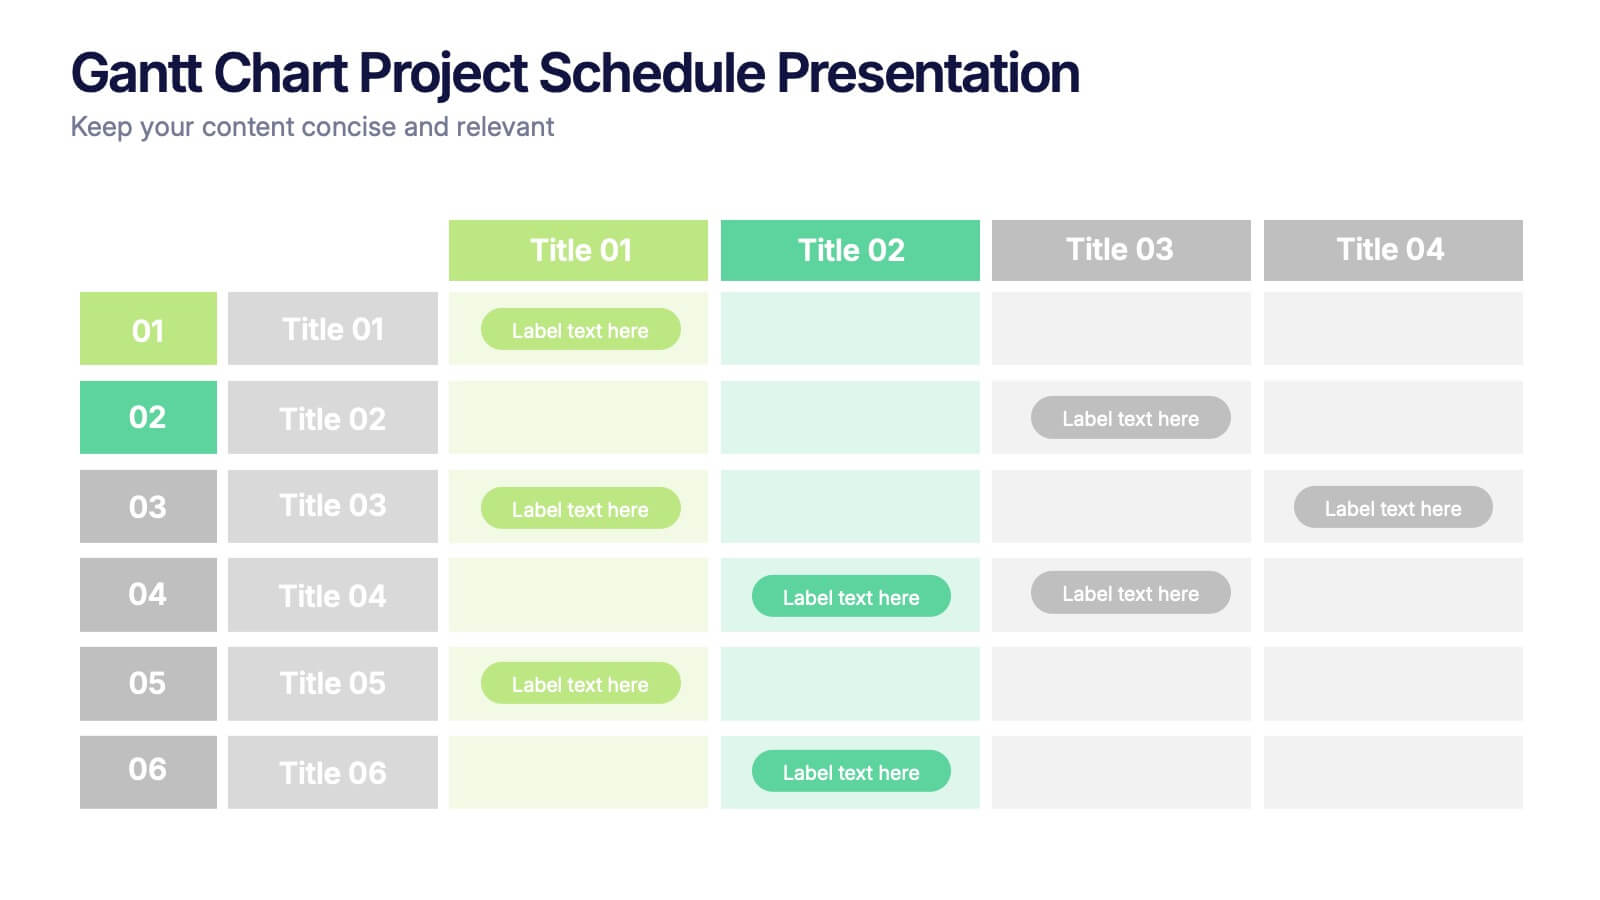
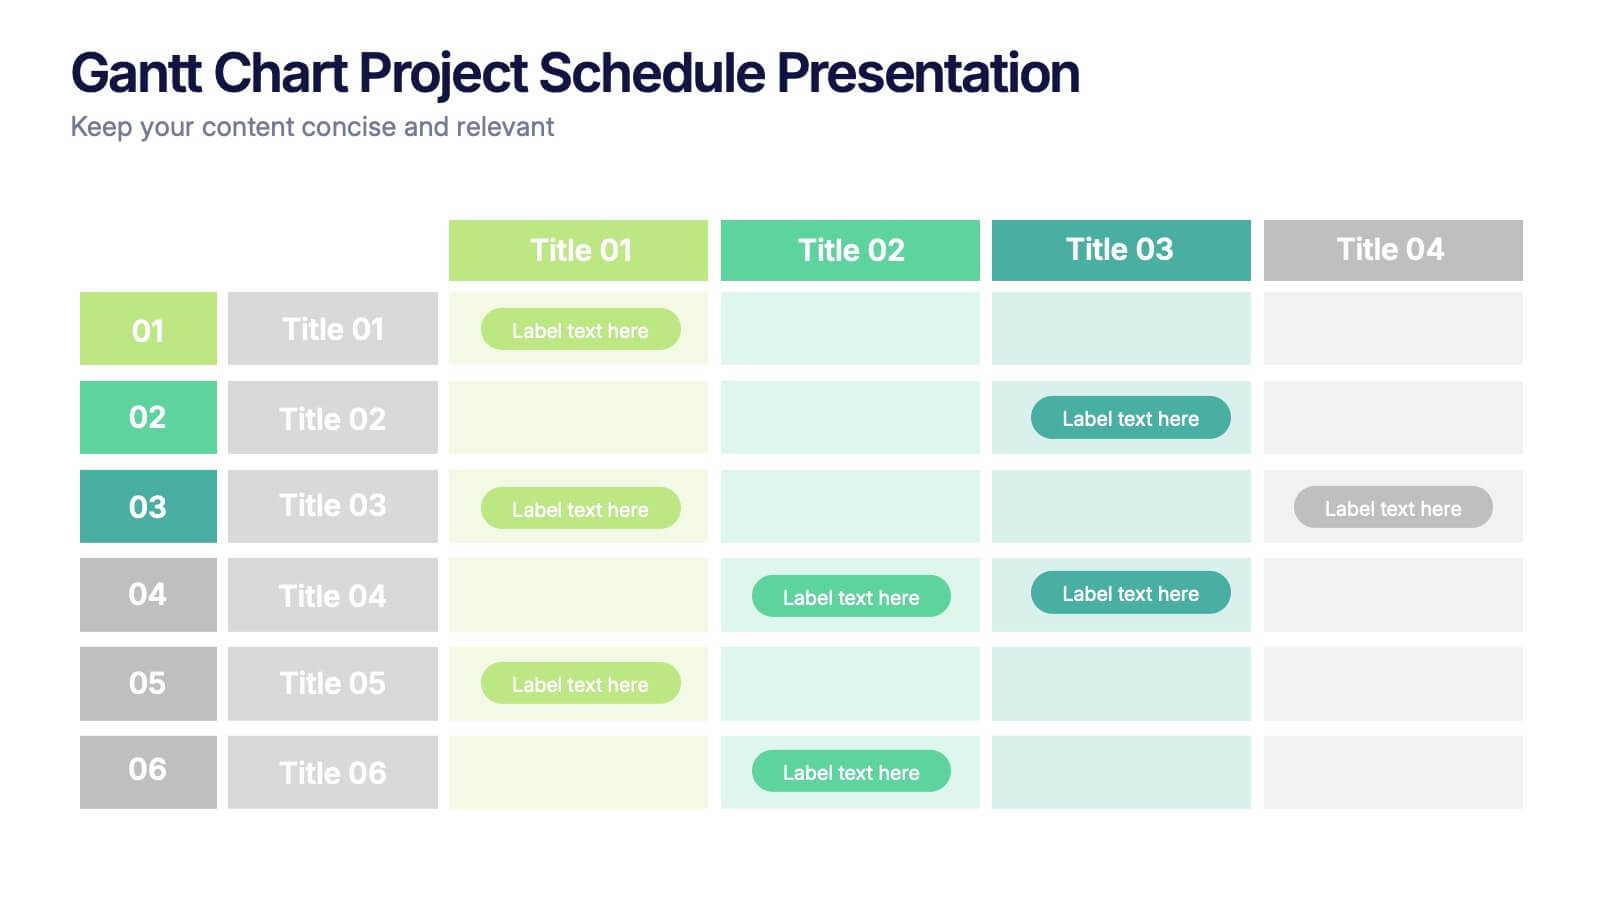
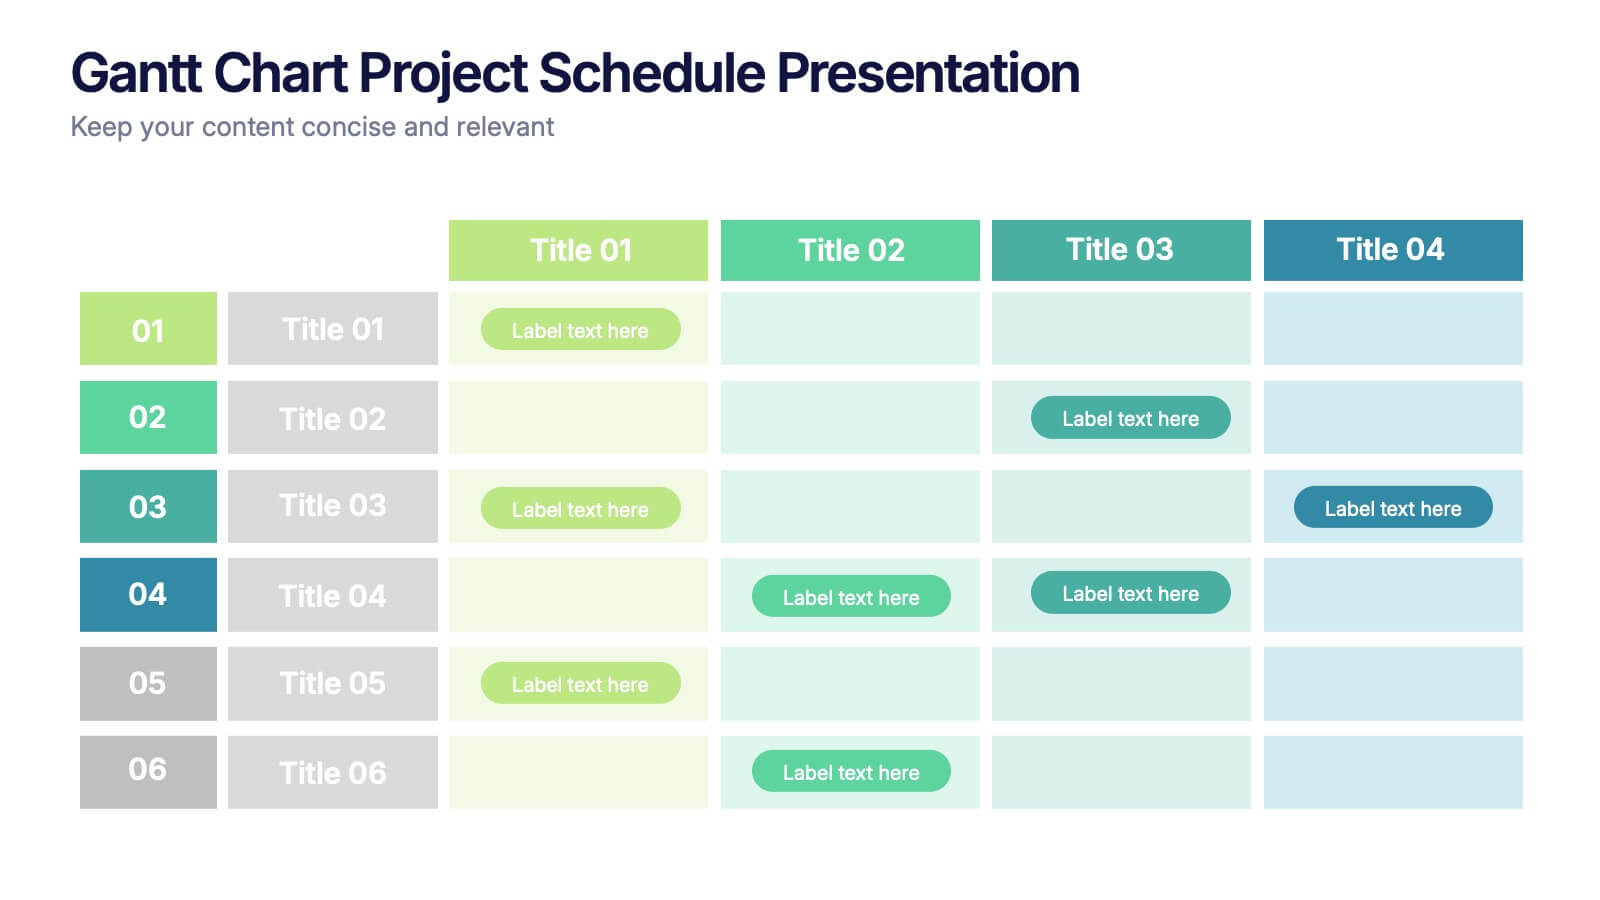
Gantt Chart Project Schedule Presentation
Bring structure to your project timeline with a clean, easy-to-read layout that maps tasks, durations, and progress at a glance. This presentation helps teams stay aligned, visualize schedules, and track milestones with clarity and precision. Fully compatible with PowerPoint, Keynote, and Google Slides.
- Eliminar de favoritos
Plantilla de PowerPoint
1 MB
Plantilla de Google Slides
Enlace externo
Plantilla de Keynote
1 MB
4 diapositivas
Crypto Investment and Trading Strategies Presentation
Visualize your crypto strategy with clarity using this modern, step-by-step slide. Featuring a rising arrow graph, coin icon, and shopping cart illustration, this layout is ideal for explaining investment phases, trading tactics, or market entry strategies. Editable in PowerPoint, Keynote, and Google Slides for maximum flexibility.
- Eliminar de favoritos
Plantilla de PowerPoint
1 MB
Plantilla de Google Slides
Enlace externo
Plantilla de Keynote
1 MB
6 diapositivas
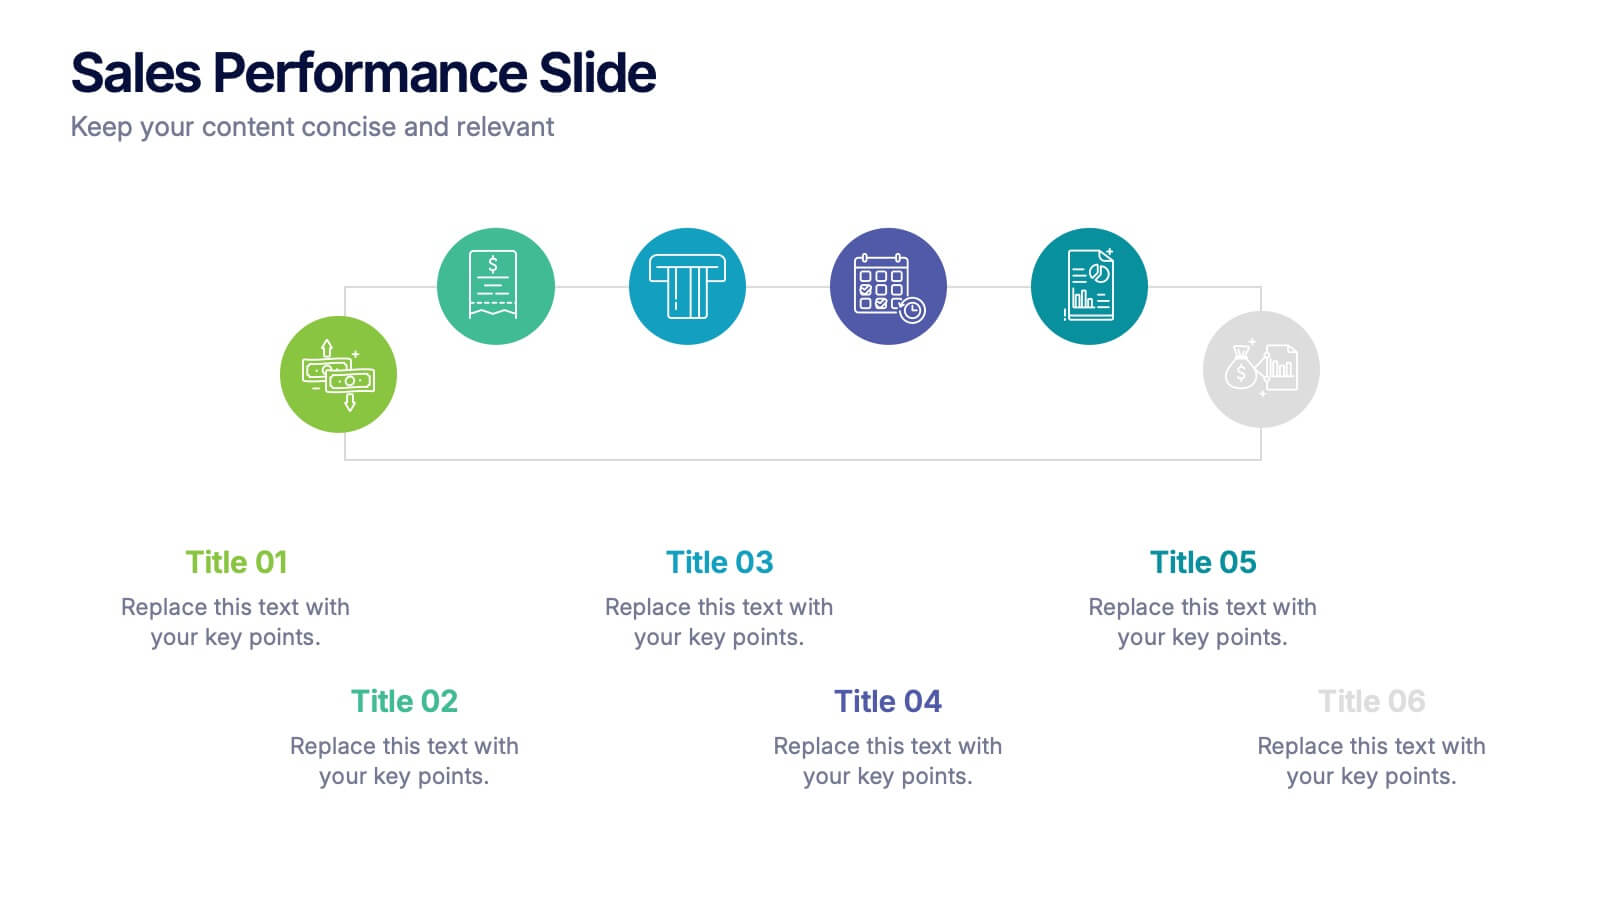
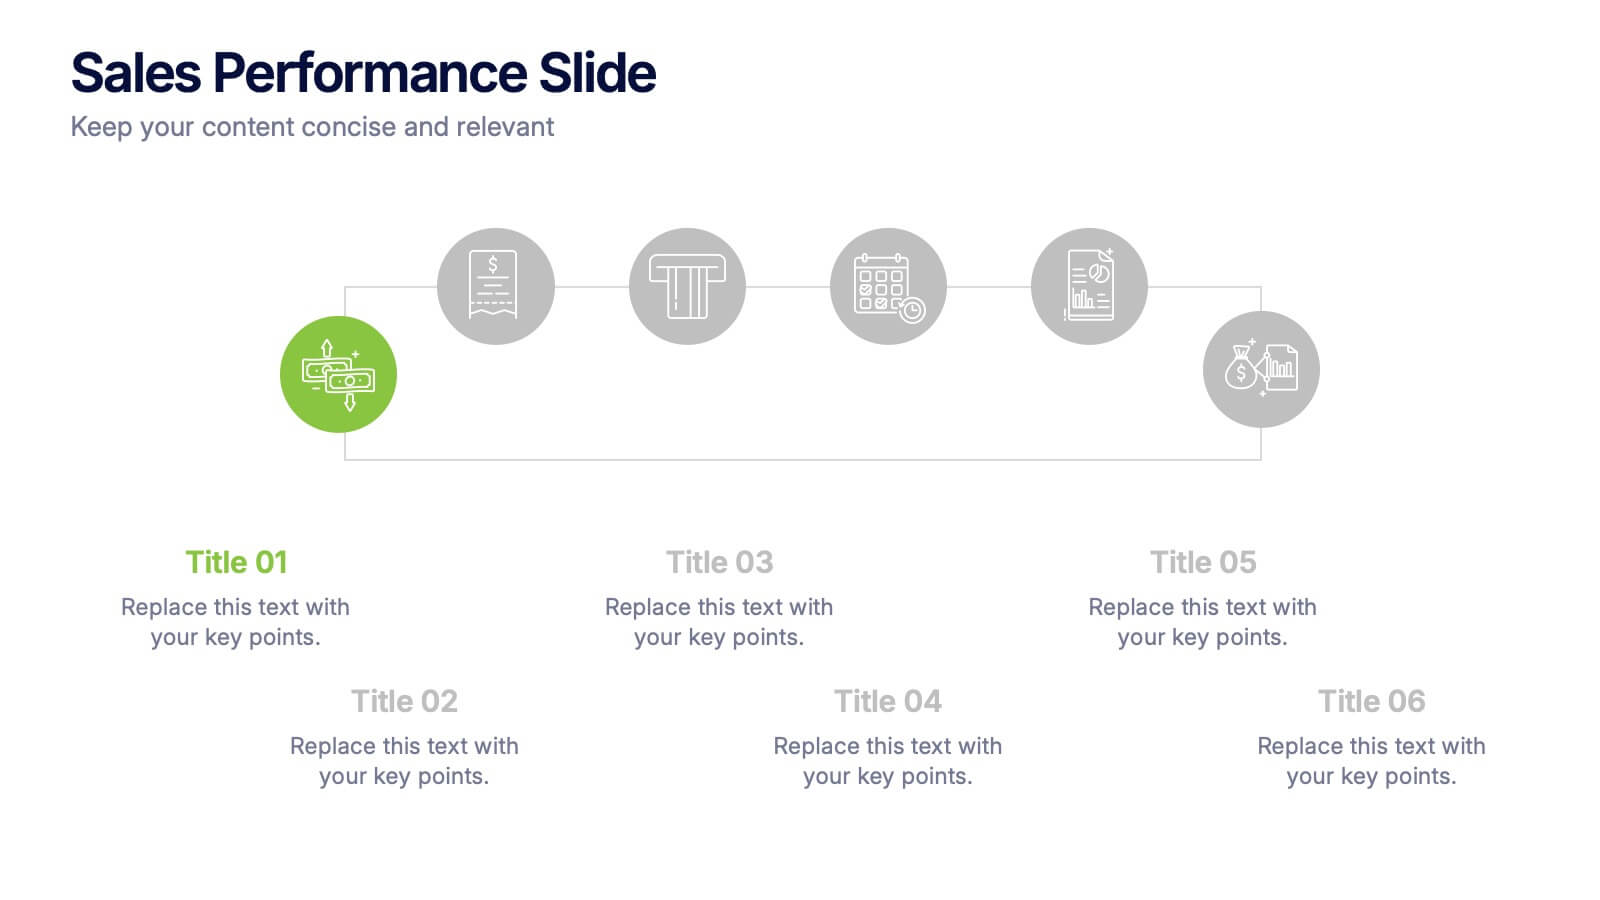
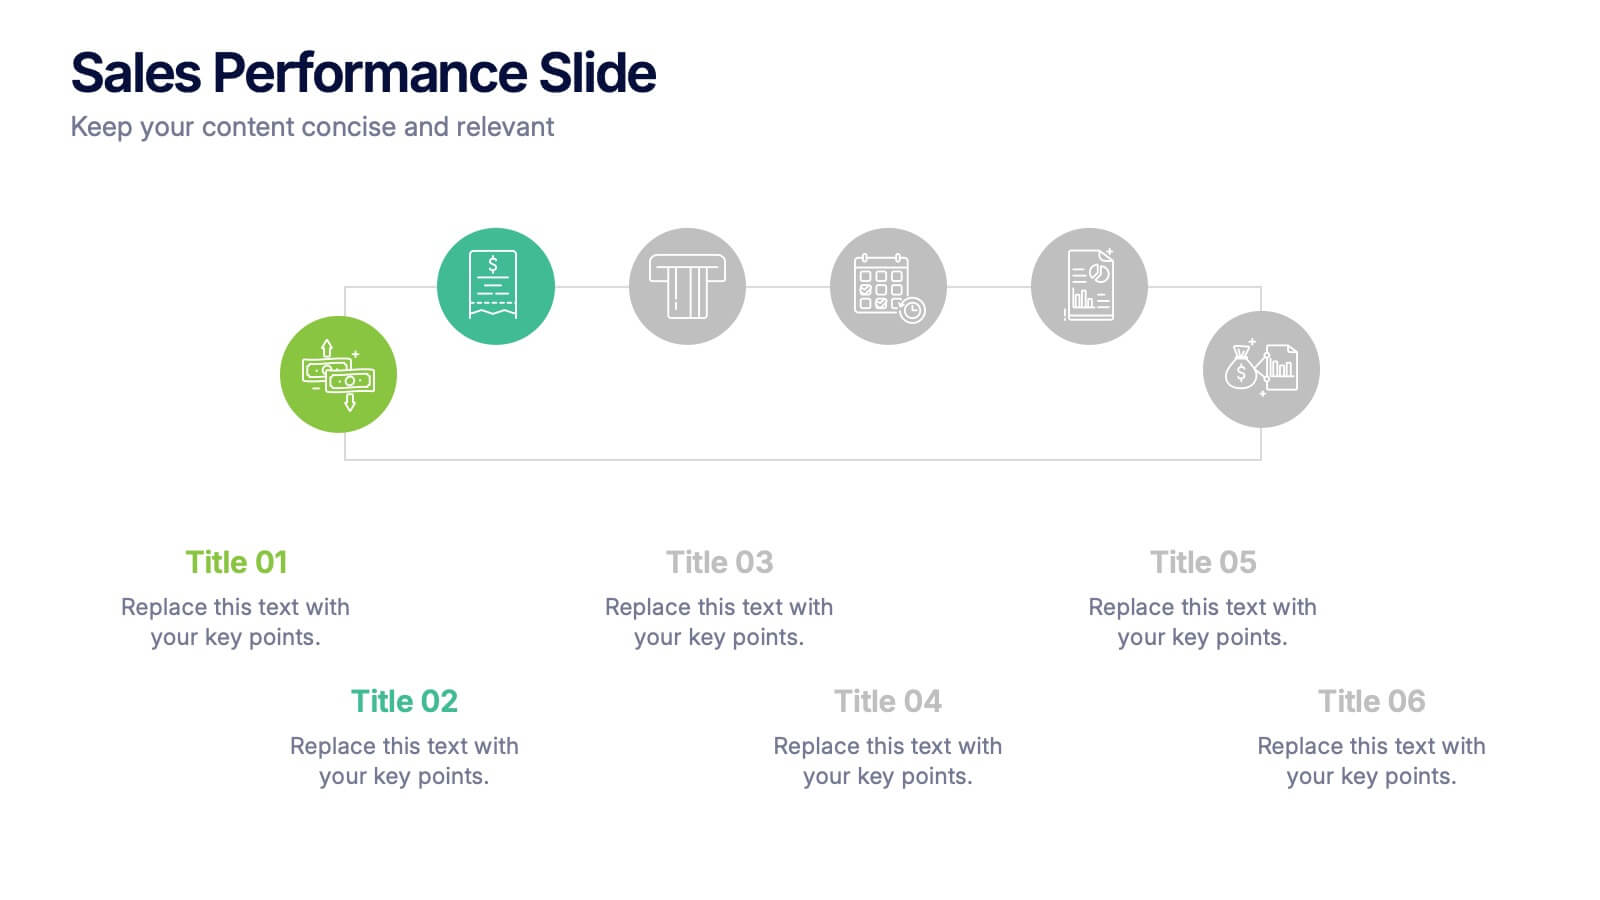
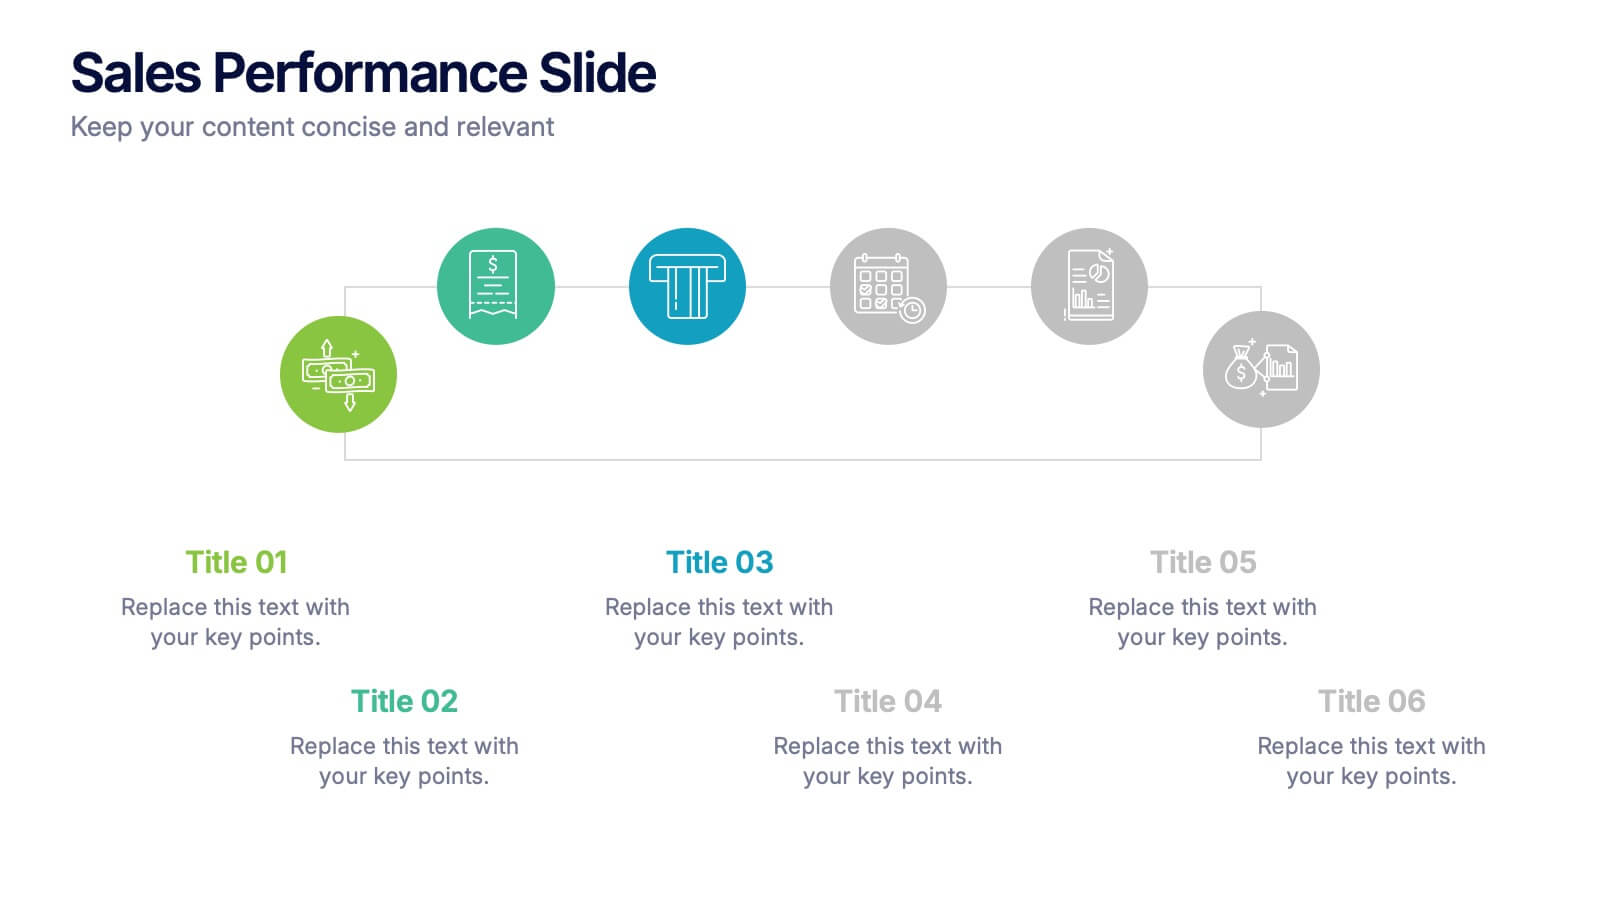
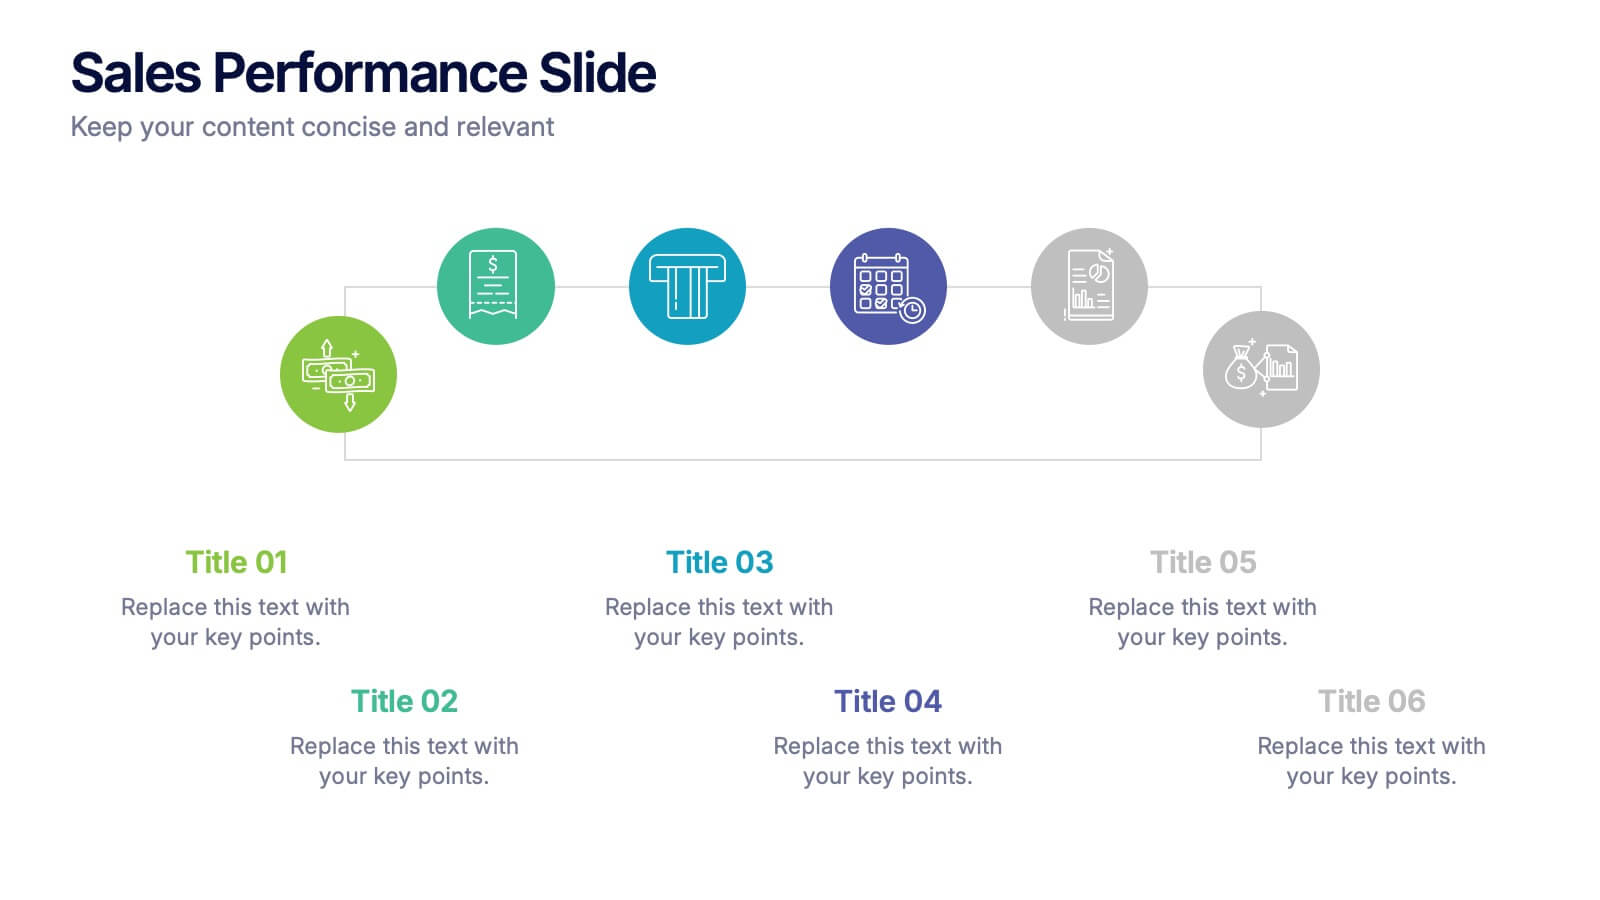
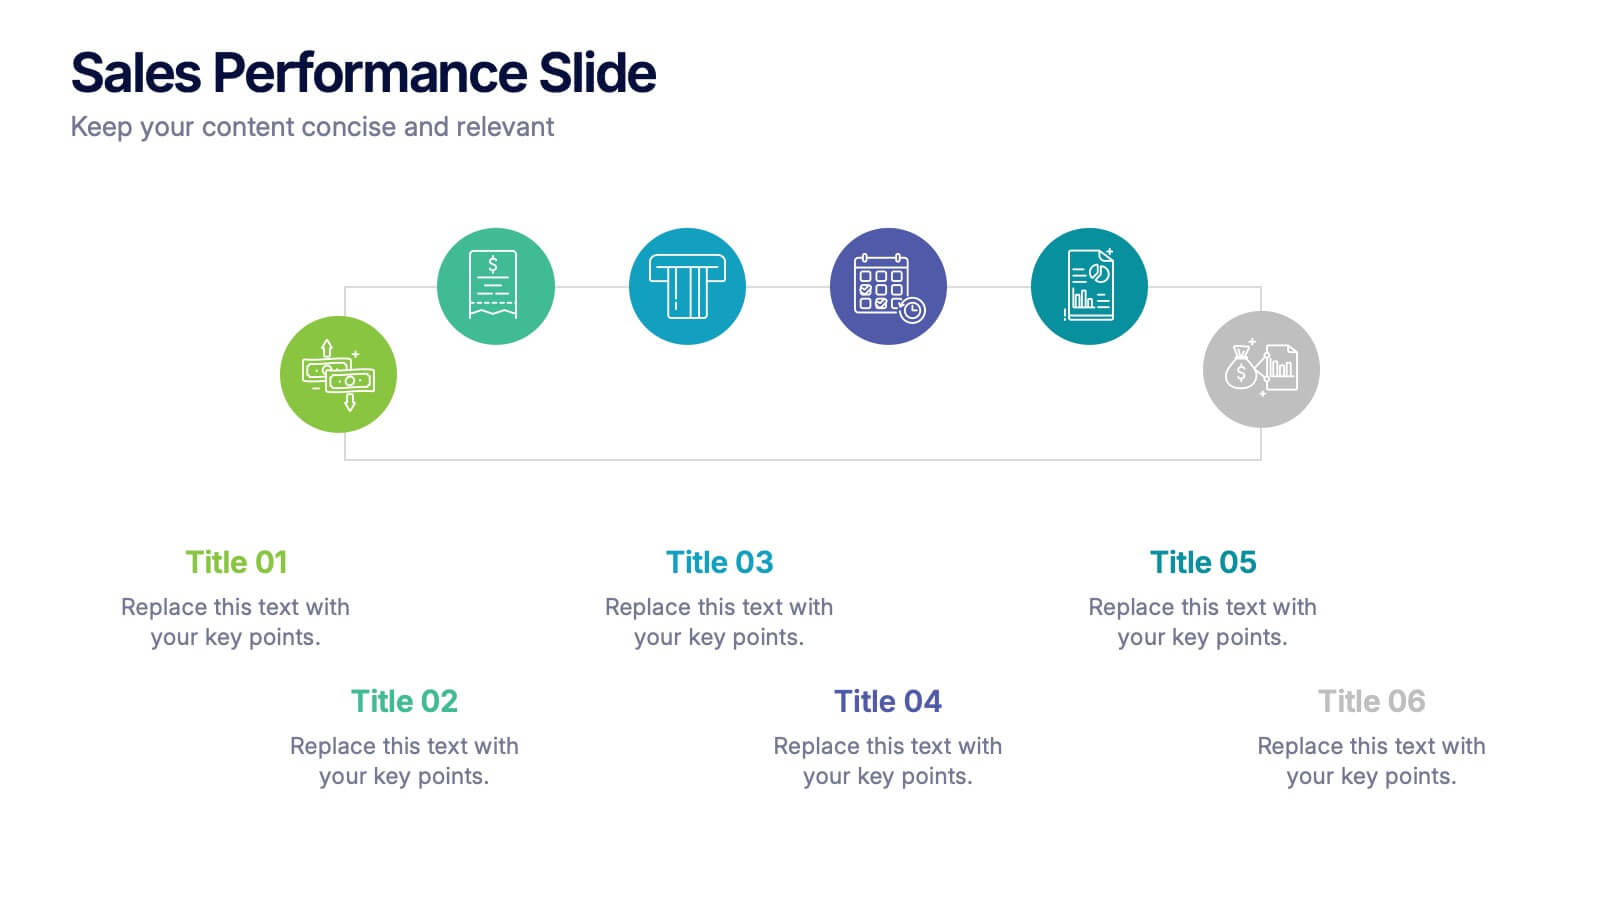
Sales Performance Slide Presentation
Get ready to showcase your results with a slide that makes progress feel genuinely exciting. This presentation highlights key sales metrics, performance stages, and growth insights in a clean, visual format that’s easy to follow and great for reports or team updates. Fully compatible with PowerPoint, Keynote, and Google Slides.
- Eliminar de favoritos
Plantilla de PowerPoint
1 MB
Plantilla de Google Slides
Enlace externo
Plantilla de Keynote
1 MB
4 diapositivas
Corporate Strategy Business Case Presentation
Develop a winning corporate strategy with this structured business case template! Perfect for analyzing finances, operations, market trends, and client insights, this clean and organized layout helps businesses communicate key strategies effectively. Fully customizable and compatible with PowerPoint, Keynote, and Google Slides for seamless, professional presentations.
- Eliminar de favoritos
Plantilla de PowerPoint
1 MB
Plantilla de Google Slides
Enlace externo
Plantilla de Keynote
1 MB
5 diapositivas
4-Level Hierarchy Tree Presentation
Bring your ideas to life with a smooth, layered flow that feels modern and engaging from the very first glance. This presentation helps you break down complex structures into four clear levels, making information easy to follow and visually compelling. Perfect for explaining processes, roles, or systems with clarity. Fully compatible with PowerPoint, Keynote, and Google Slides.
- Eliminar de favoritos
Plantilla de PowerPoint
1 MB
Plantilla de Google Slides
Enlace externo
Plantilla de Keynote
1 MB
6 diapositivas
Annual Report Company Infographic
An annual report is a comprehensive document that provides an overview of a company's performance and financial activities over the course of a year. This Infographic template is a great way to present key highlights, accomplishments, and data from a year in a visually engaging and concise format. Designing an Annual Report Infographic can effectively convey the year's achievements and progress to stakeholders, investors, clients, and employees in a visually compelling and concise manner. This is designed to gather feedback from colleagues, team members, or stakeholders and make any necessary revisions to enhance the clarity and impact of the infographic.
- Eliminar de favoritos
Plantilla de PowerPoint
1 MB
Plantilla de Google Slides
Enlace externo
Plantilla de Keynote
1 MB
4 diapositivas
Startup Investor Pitch Deck
Command investor attention with this dynamic Startup Pitch Deck slide. Featuring bold metrics, sleek data visualizations, and clean typography, it's designed to highlight growth and business potential. Fully editable in PowerPoint, Keynote, and Google Slides—ideal for tech, finance, and innovation-driven startups.
- Eliminar de favoritos
Plantilla de PowerPoint
1 MB
Plantilla de Google Slides
Enlace externo
Plantilla de Keynote
2 MB
12 diapositivas
Timeline Path to Market Strategy Presentation
Outline your market strategy with this step-by-step timeline slide. Ideal for product launches, go-to-market plans, or business rollouts. Includes 6 editable phases with directional arrows, year markers, and text boxes for customization. Fully compatible with PowerPoint, Keynote, and Google Slides—perfect for marketers, strategists, and business development teams.
- Eliminar de favoritos
Plantilla de PowerPoint
1 MB
Plantilla de Google Slides
Enlace externo
Plantilla de Keynote
2 MB
8 diapositivas
RACI Matrix Role Assignment Presentation
The "RACI Matrix Role Assignment" presentation template is designed to clarify role responsibilities in project management contexts. Each slide presents a clear visual breakdown of who is responsible, accountable, consulted, and informed (RACI) for each task within a project. This approach helps in preventing overlap and ensuring all team members are clear about their roles and responsibilities, promoting more effective communication and project management.
- Eliminar de favoritos
Plantilla de PowerPoint
1 MB
Plantilla de Google Slides
Enlace externo
Plantilla de Keynote
1 MB
6 diapositivas
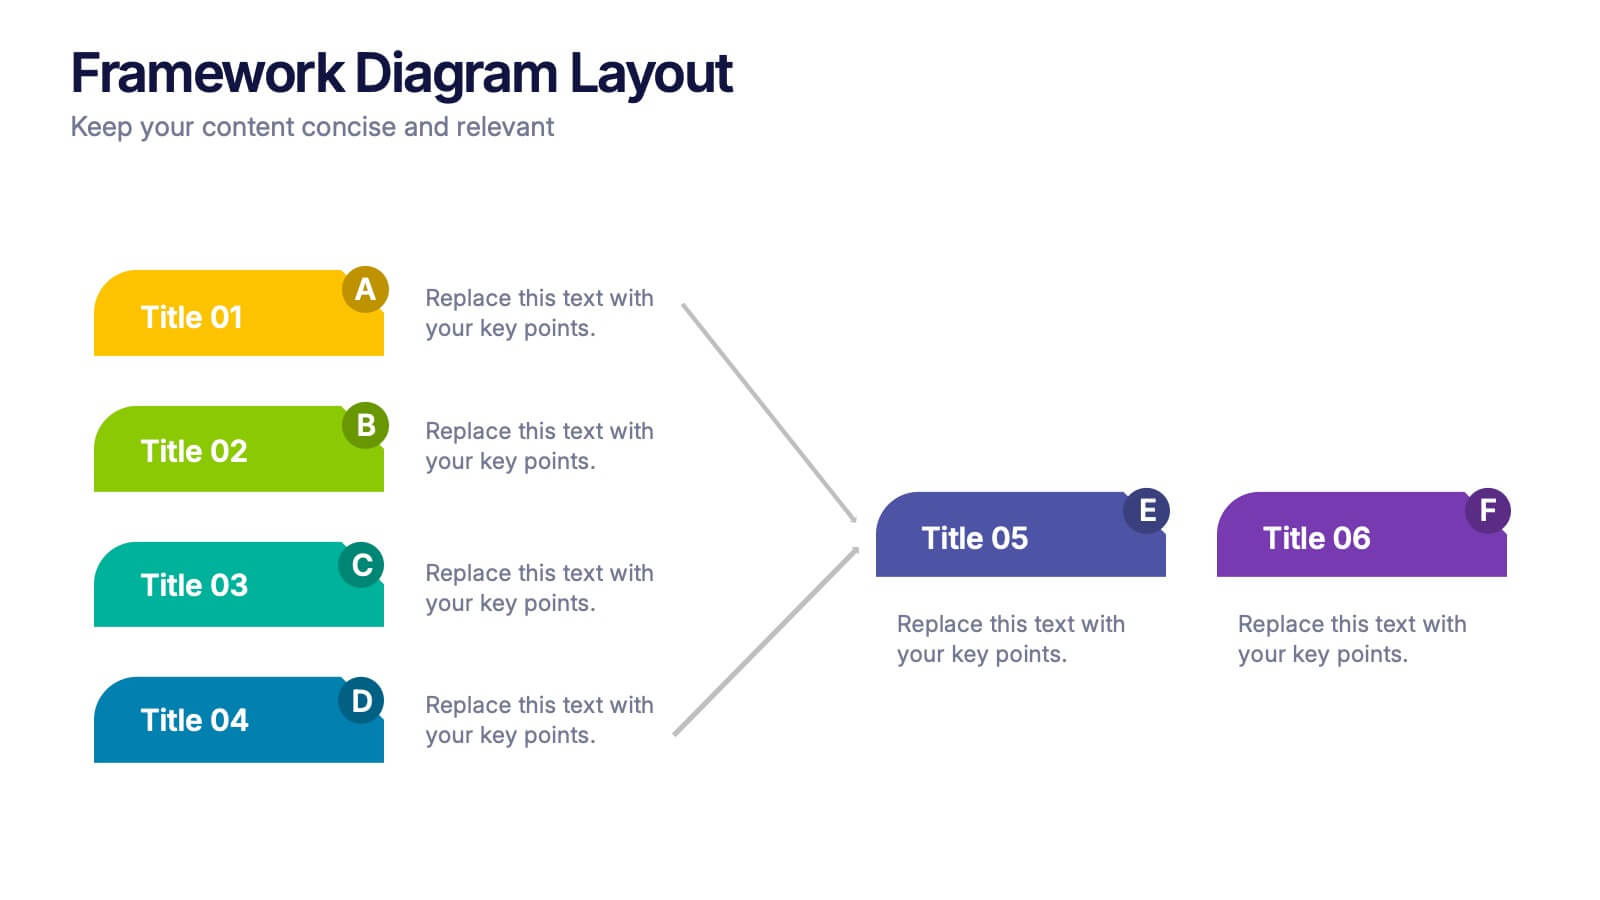
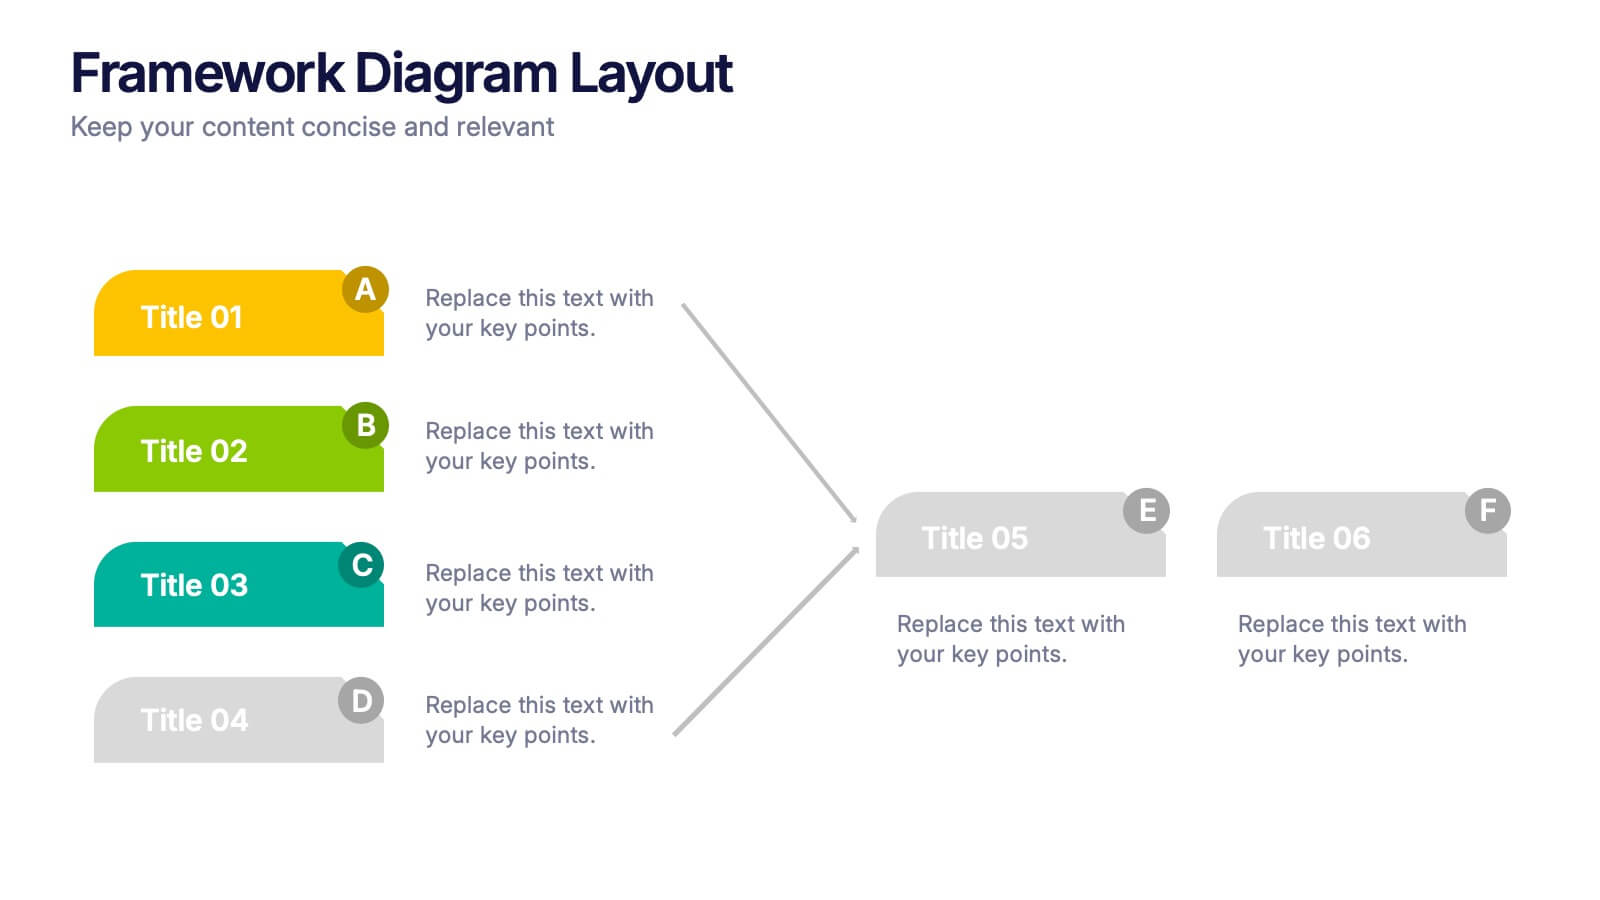
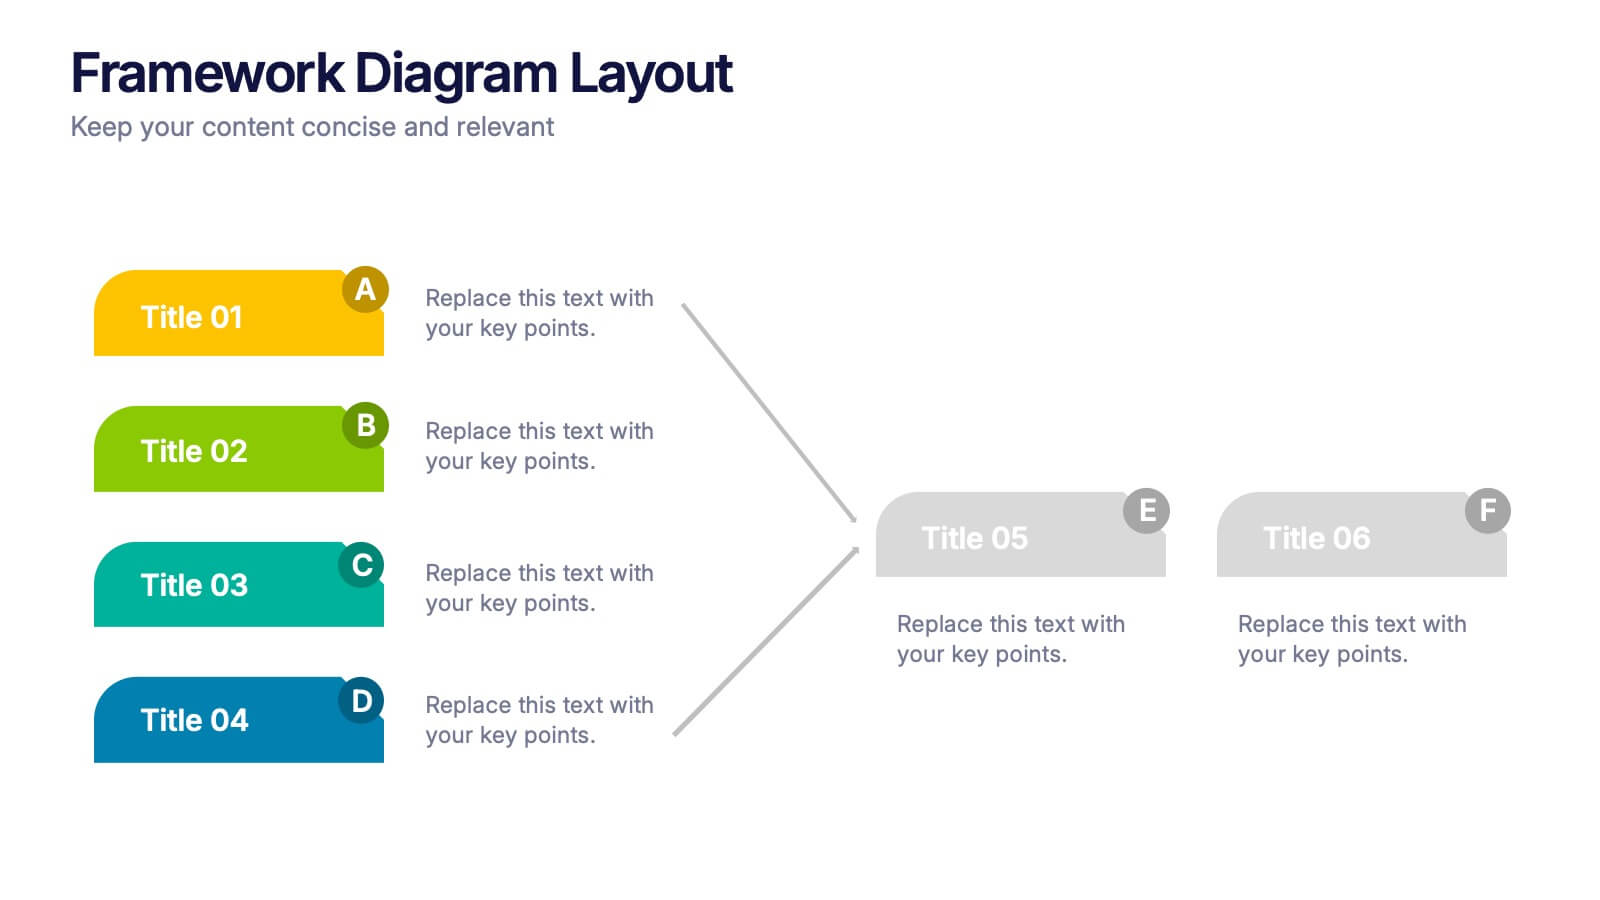
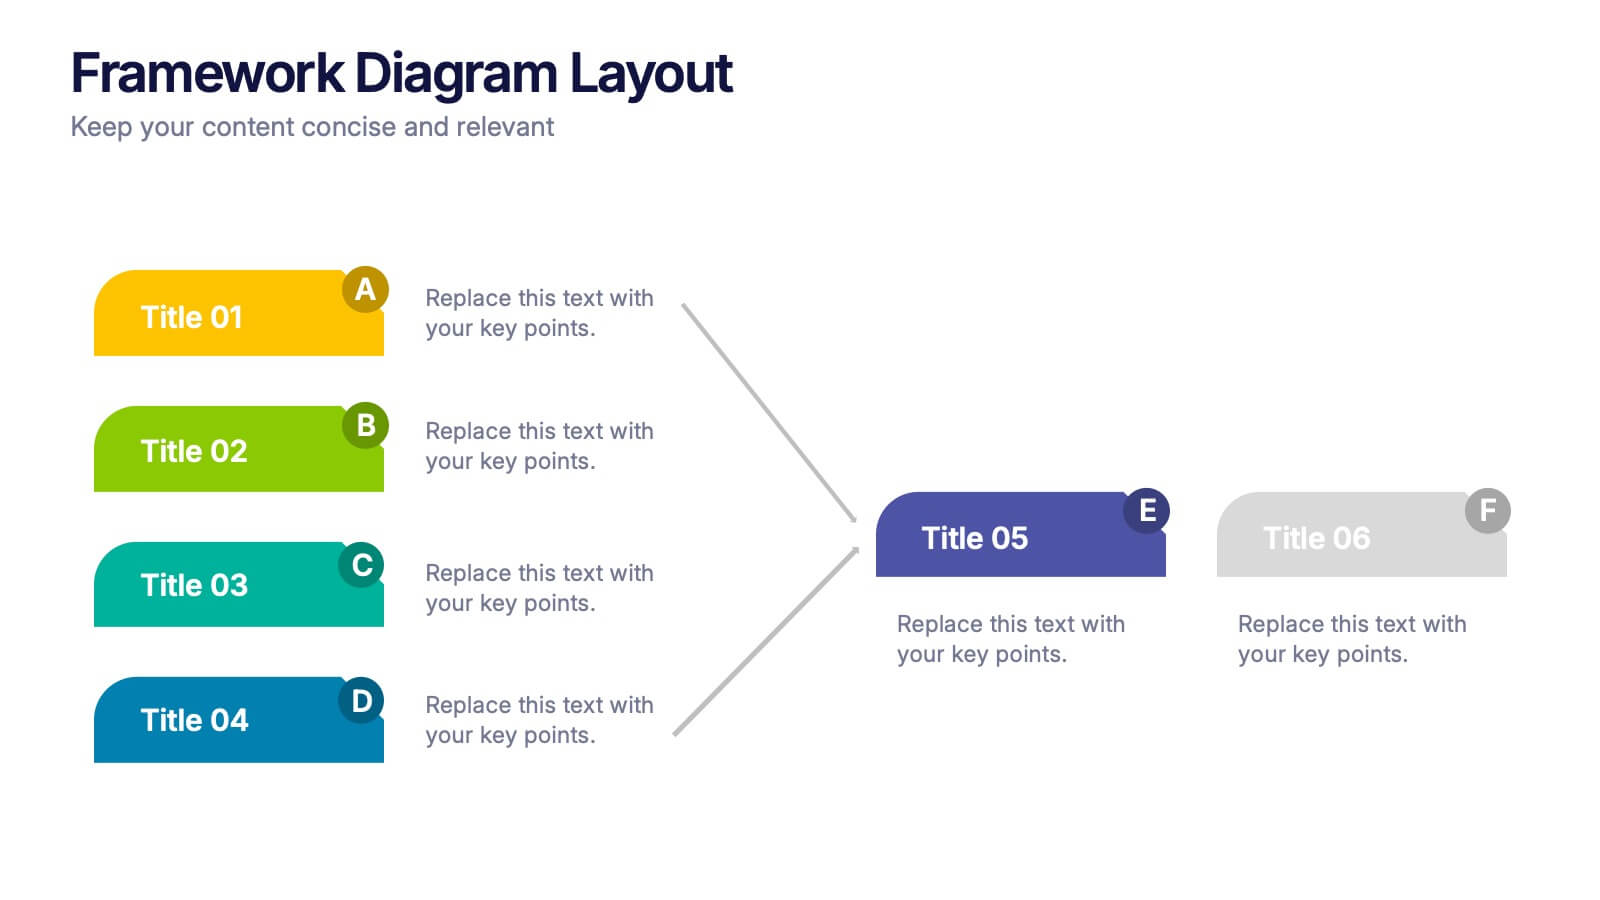
Framework Diagram Layout Presentation
Bring structure to your ideas with this sleek and modern presentation layout designed for clarity and flow. Perfect for visualizing systems, workflows, and strategic processes, it helps audiences grasp relationships between concepts effortlessly. Fully editable and compatible with PowerPoint, Keynote, and Google Slides for smooth customization and professional results.


