


Características


¿Tienes alguna pregunta?
Recomendar


5 diapositivas
Business Insights Through Dashboard Visualization Presentation
Visualize key metrics with this Business Insights Through Dashboard Visualization presentation. The funnel chart layout is ideal for showcasing conversion rates, customer journeys, or sales processes. Each section includes clear labels and percentage indicators. Fully editable in Canva, PowerPoint, and Google Slides to suit your business reporting needs.


28 diapositivas
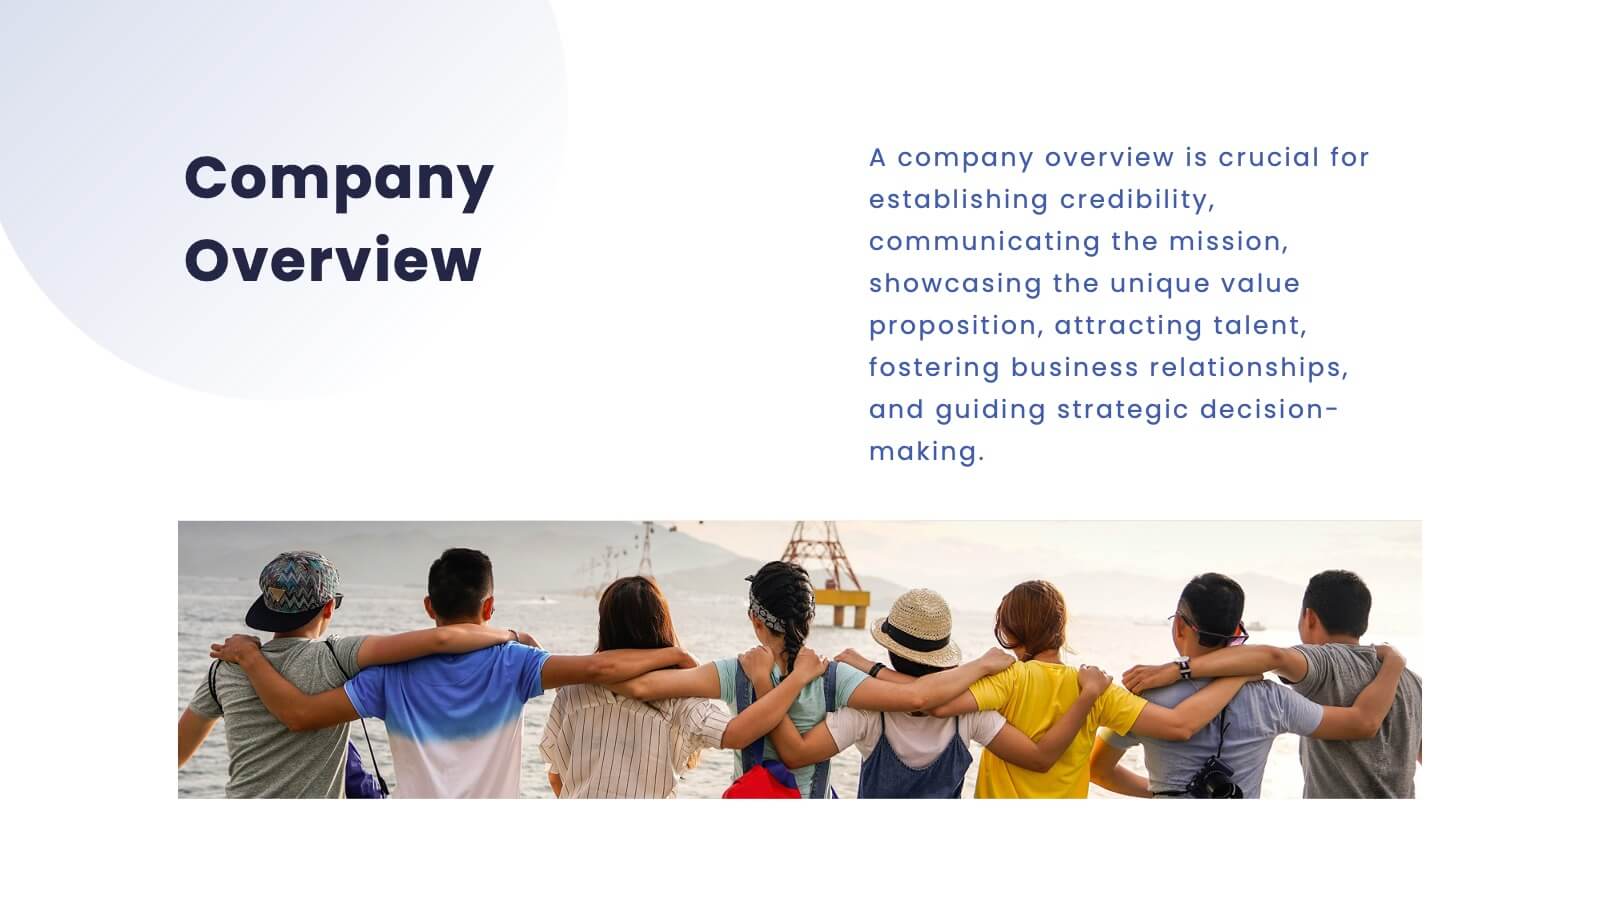
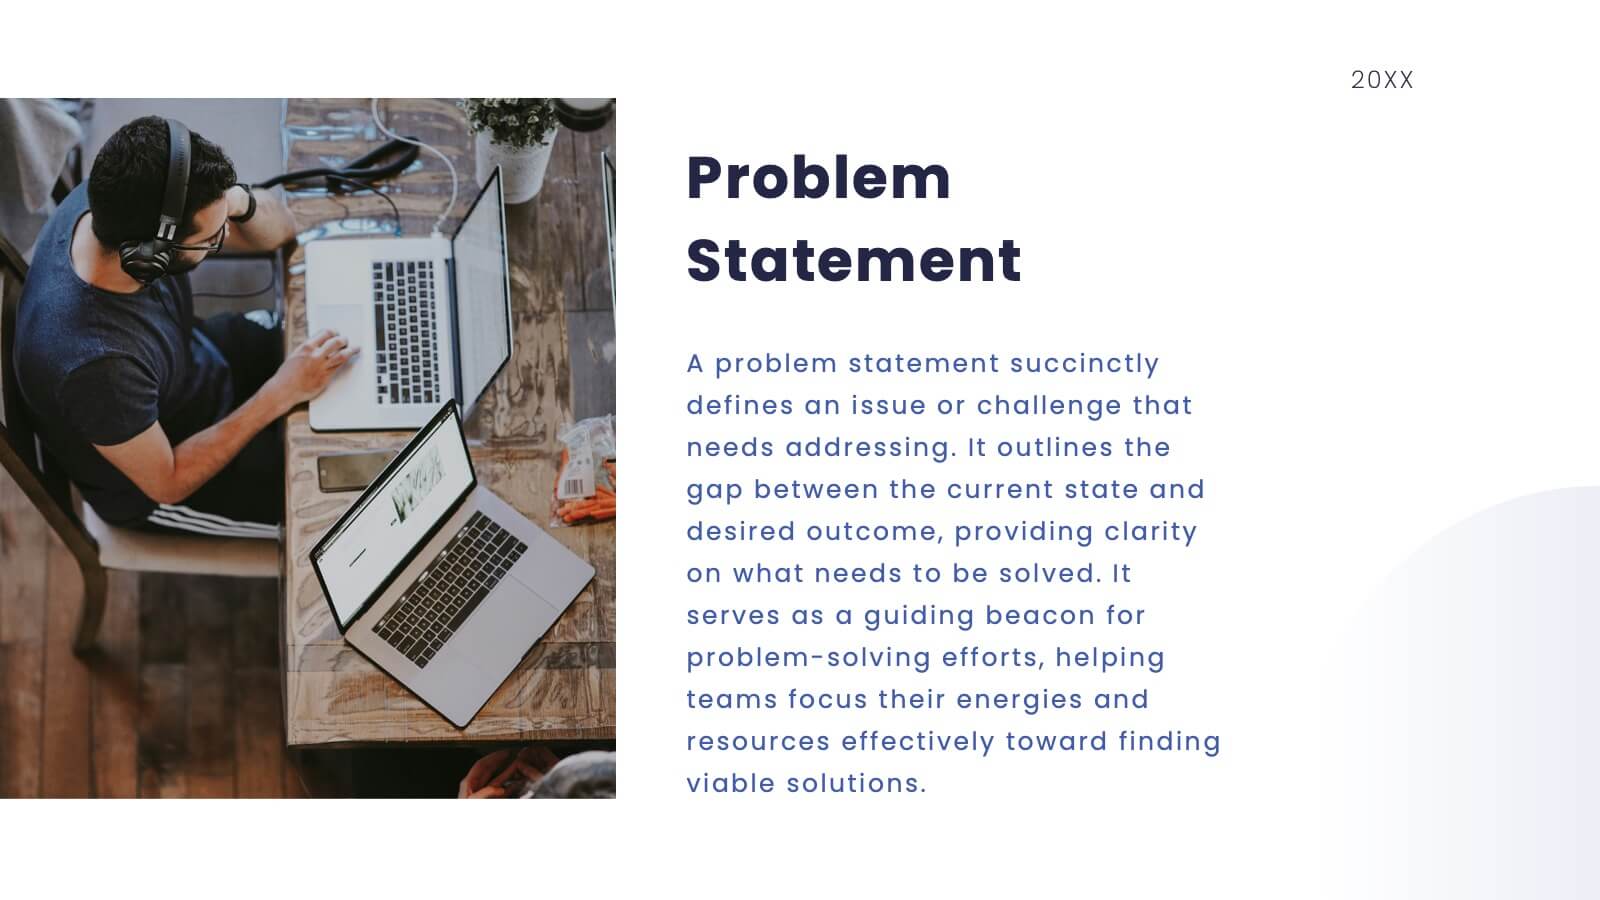
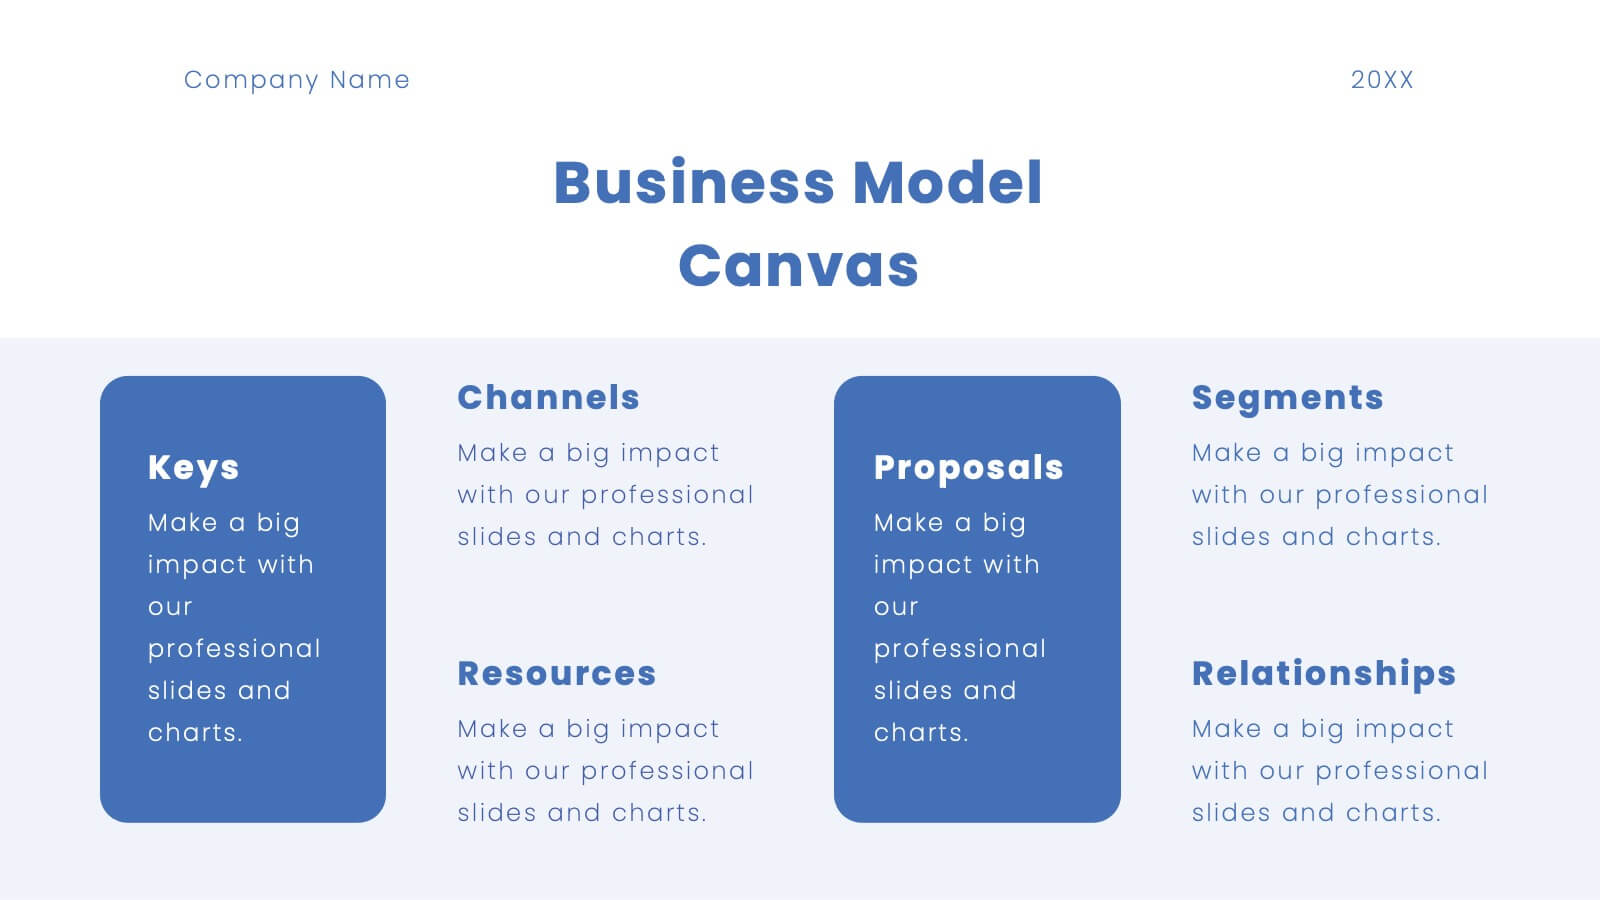
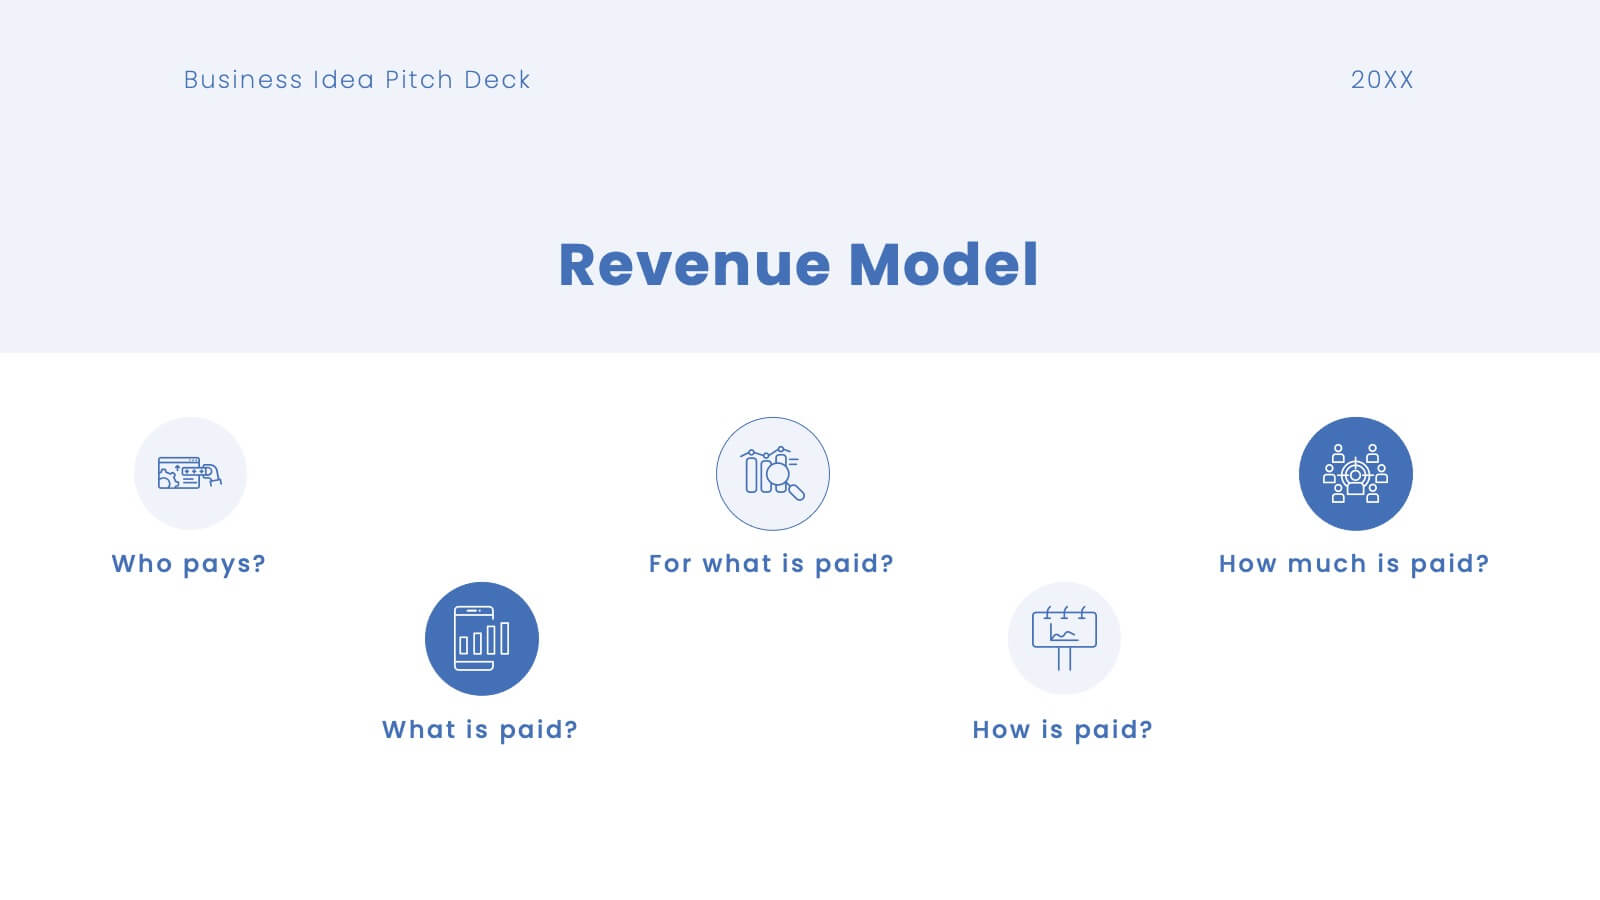
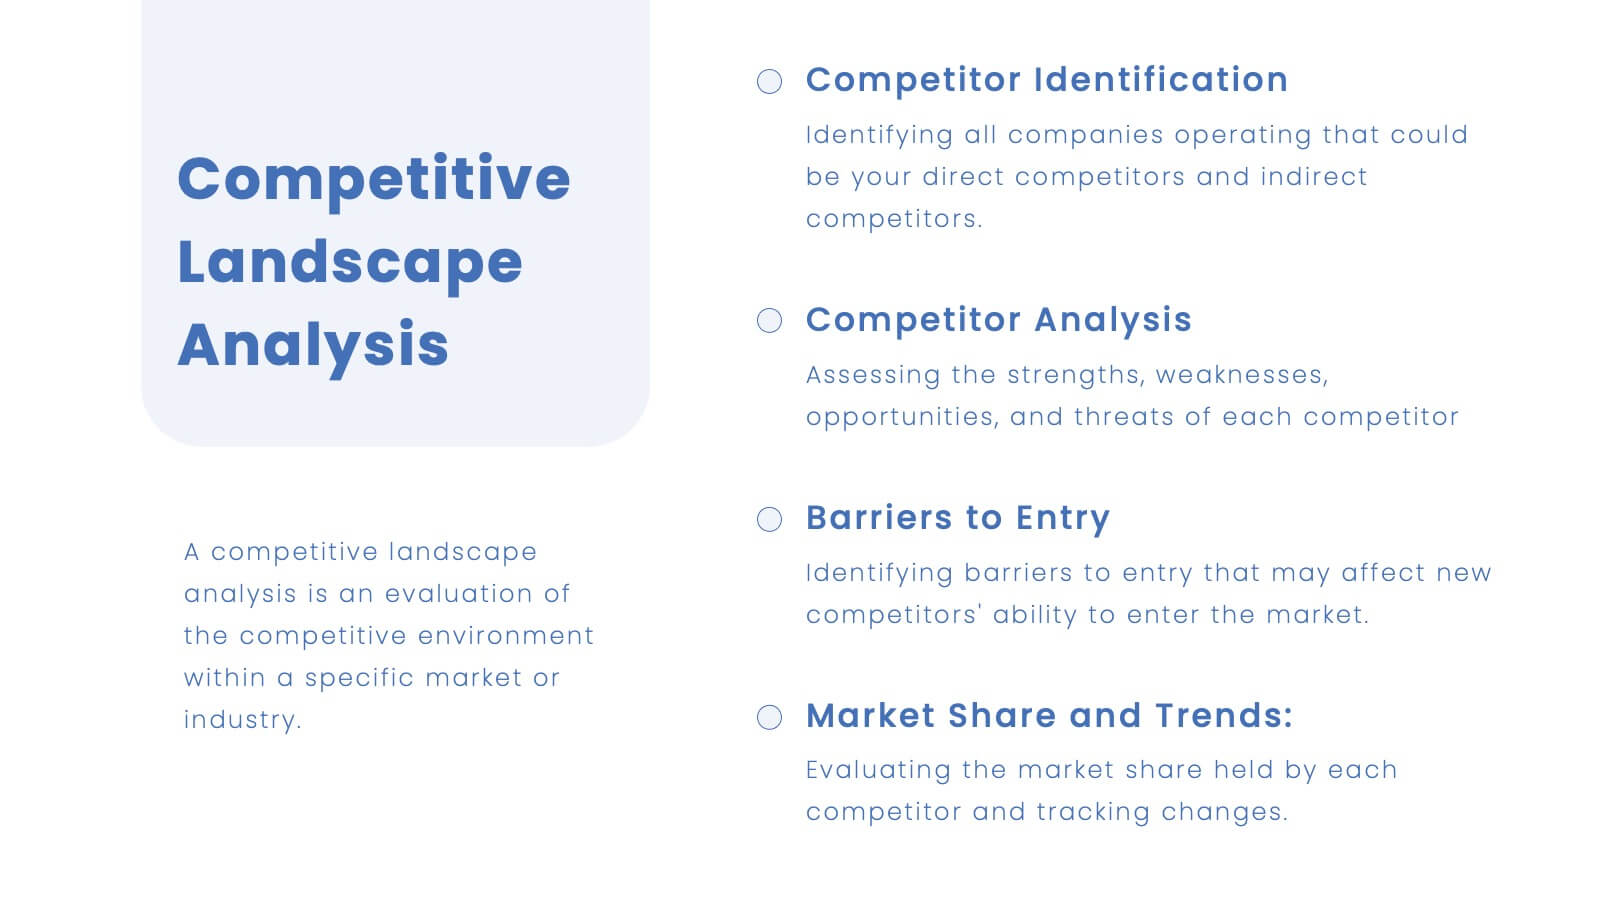
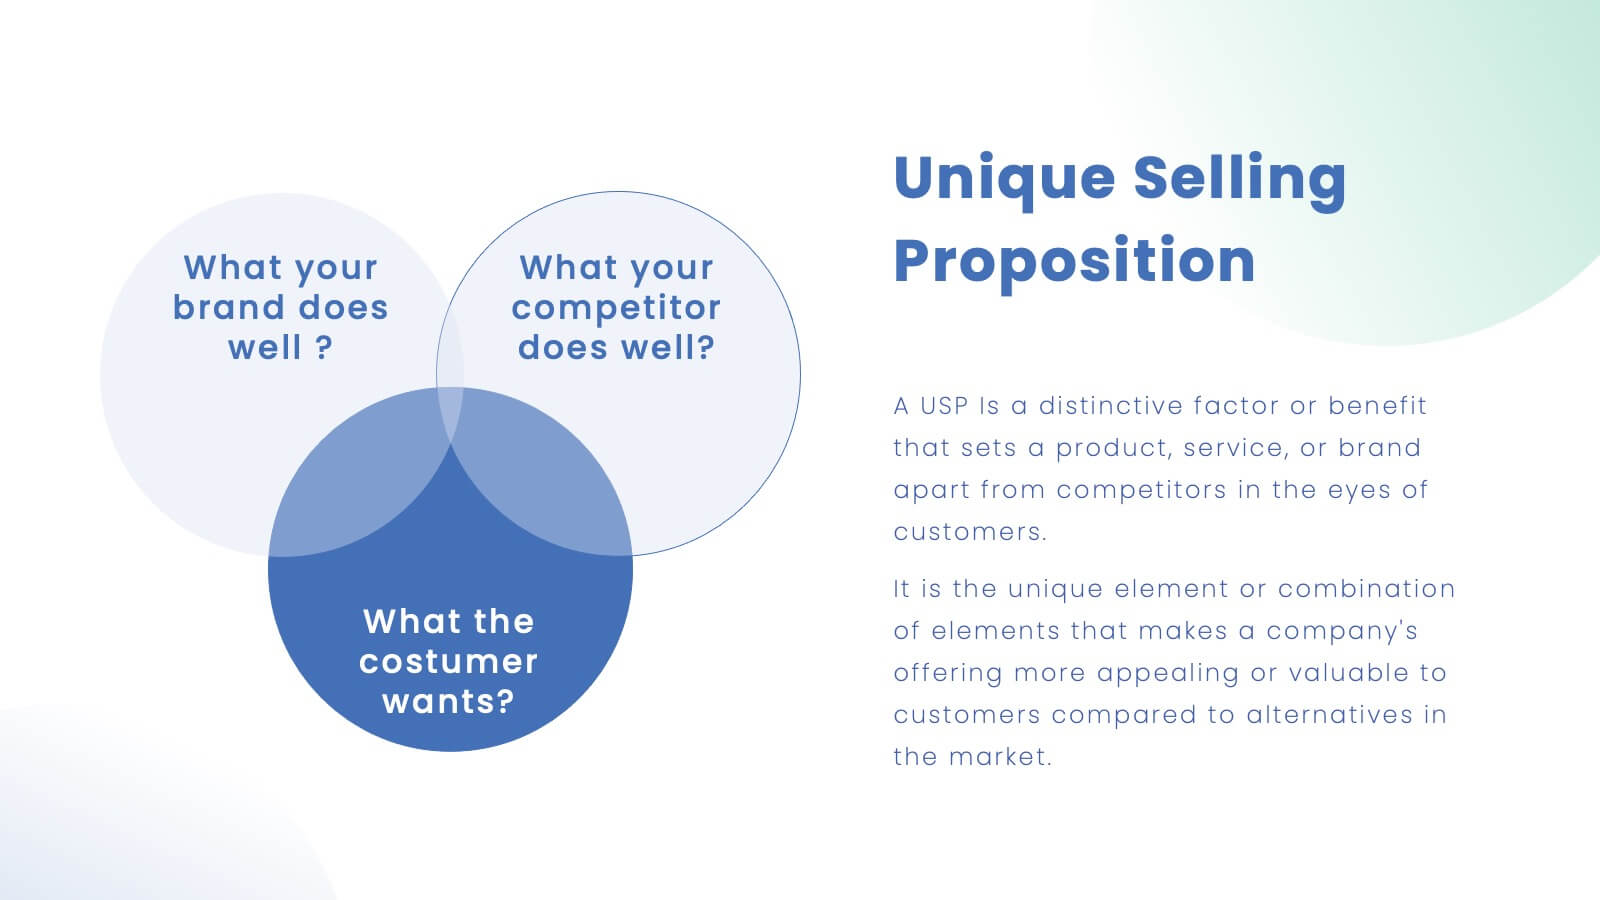
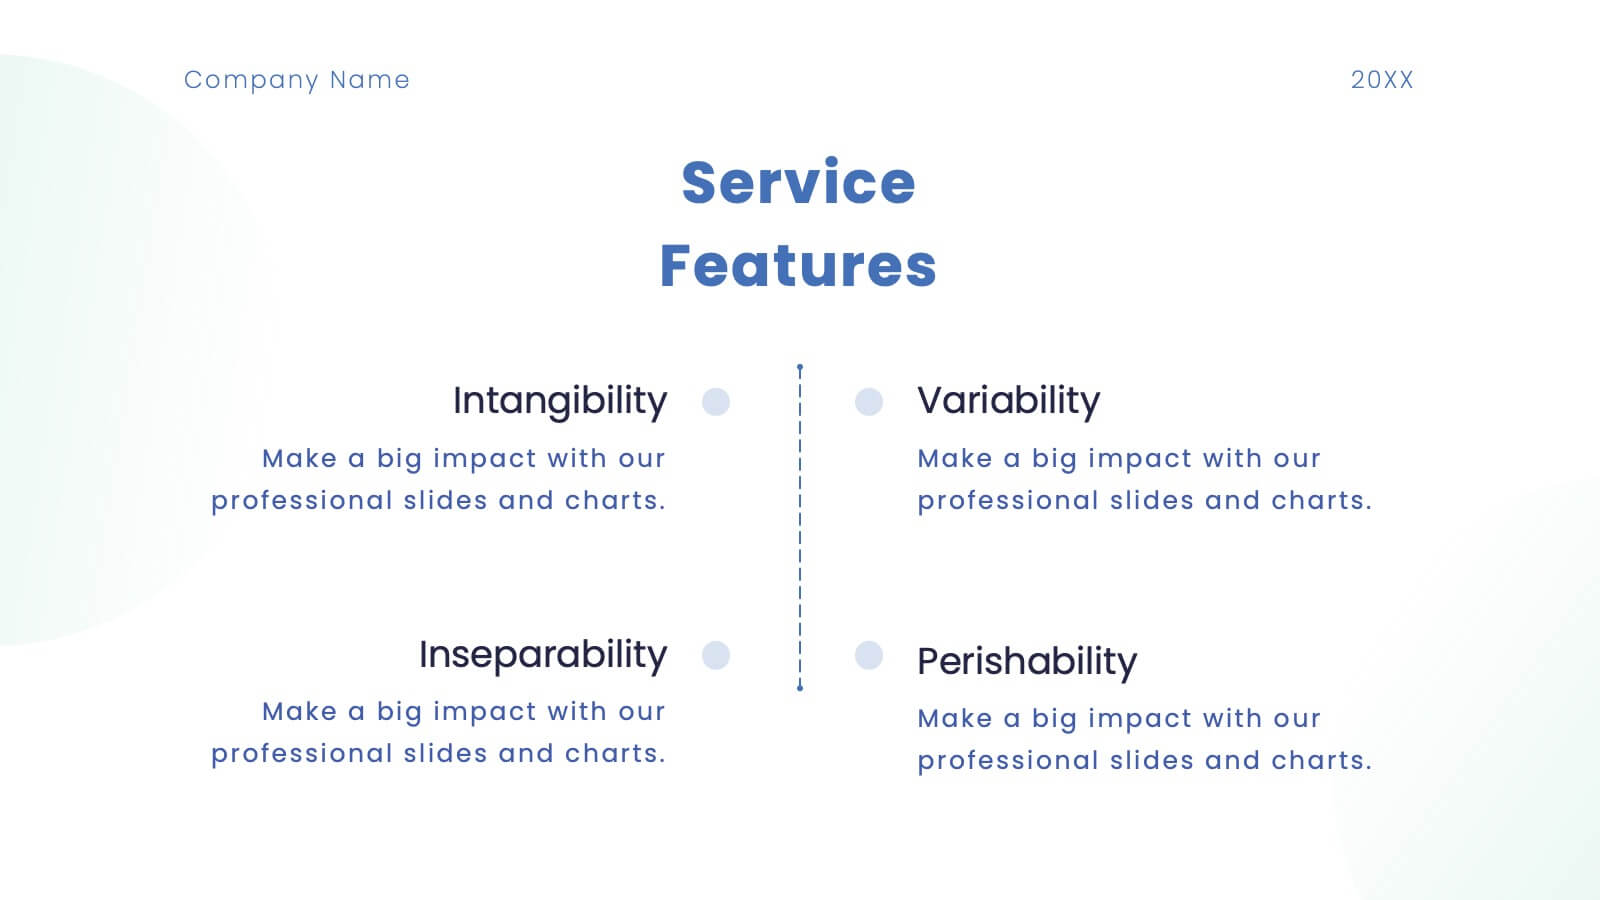
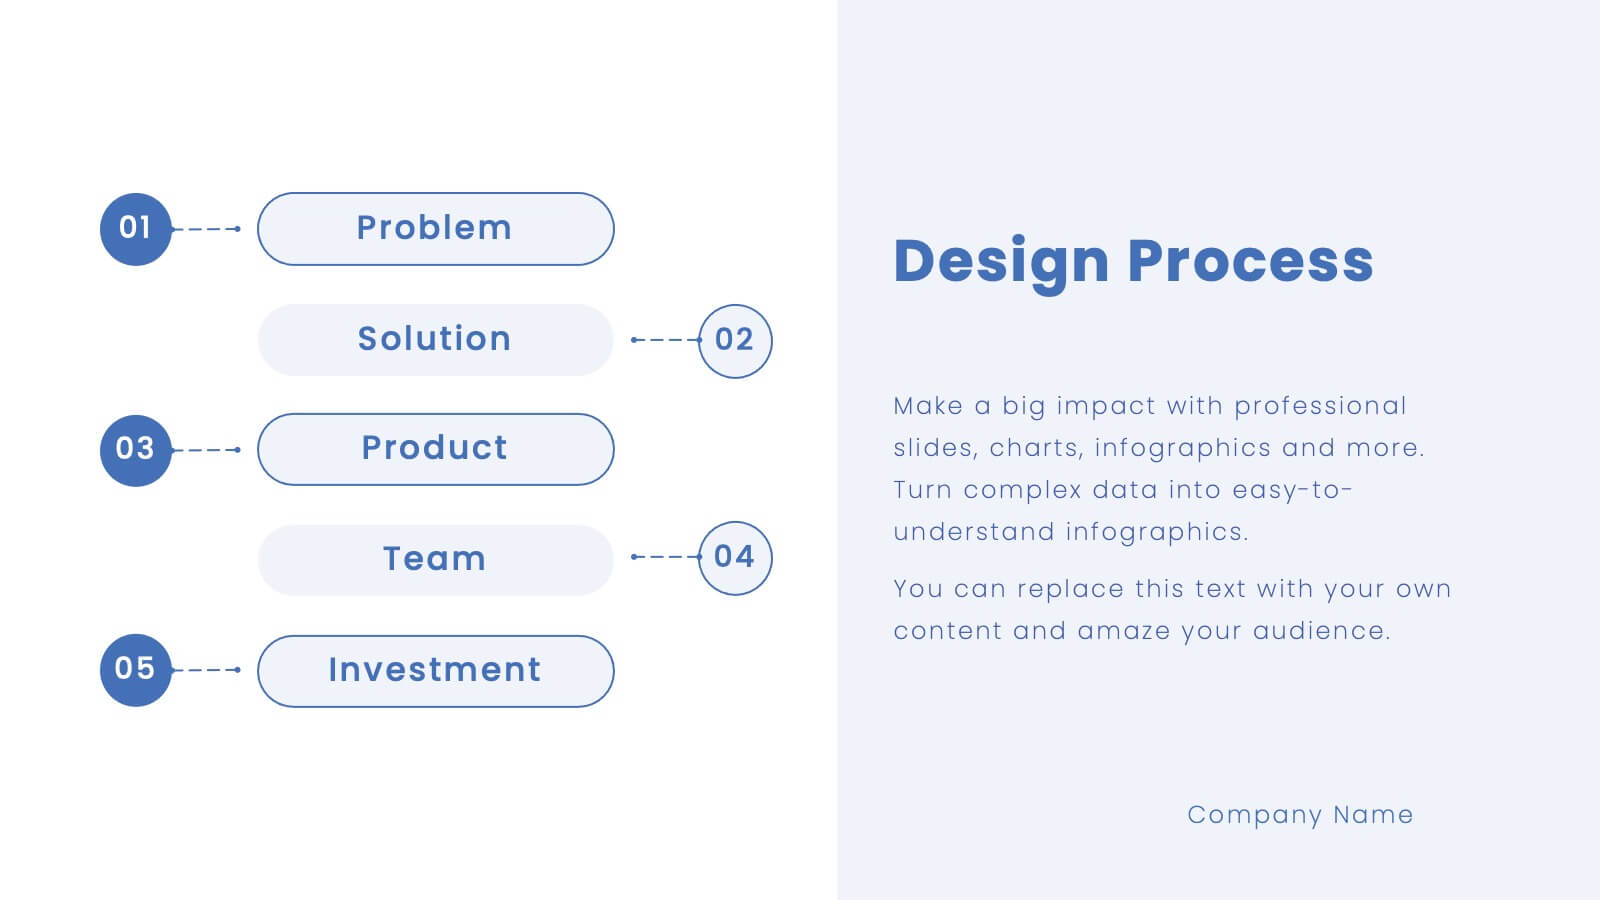
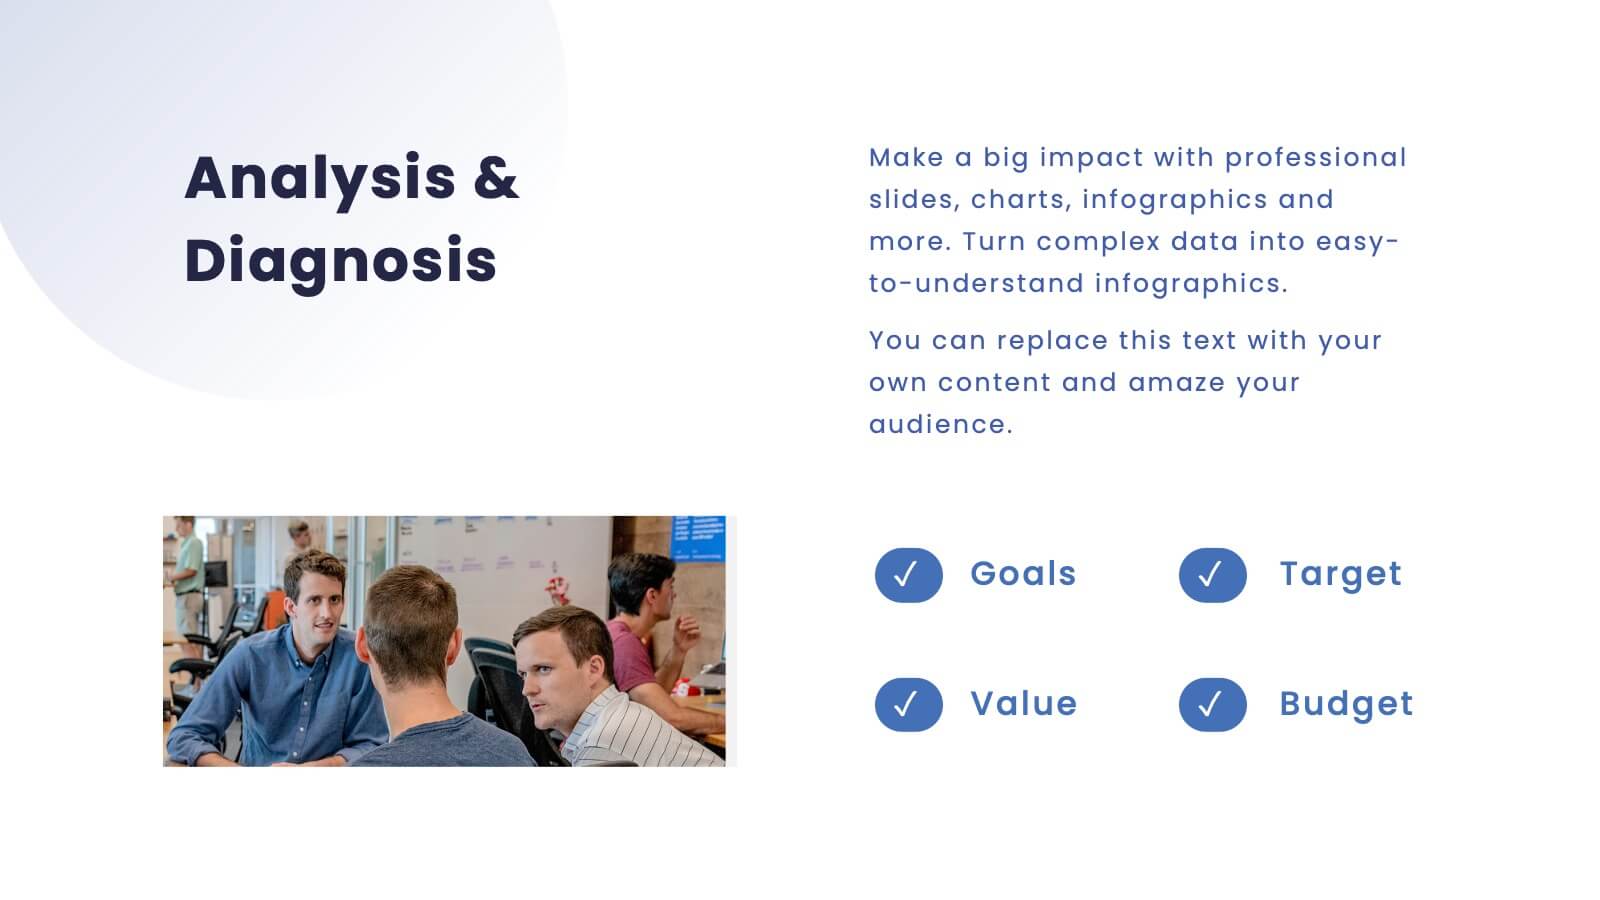
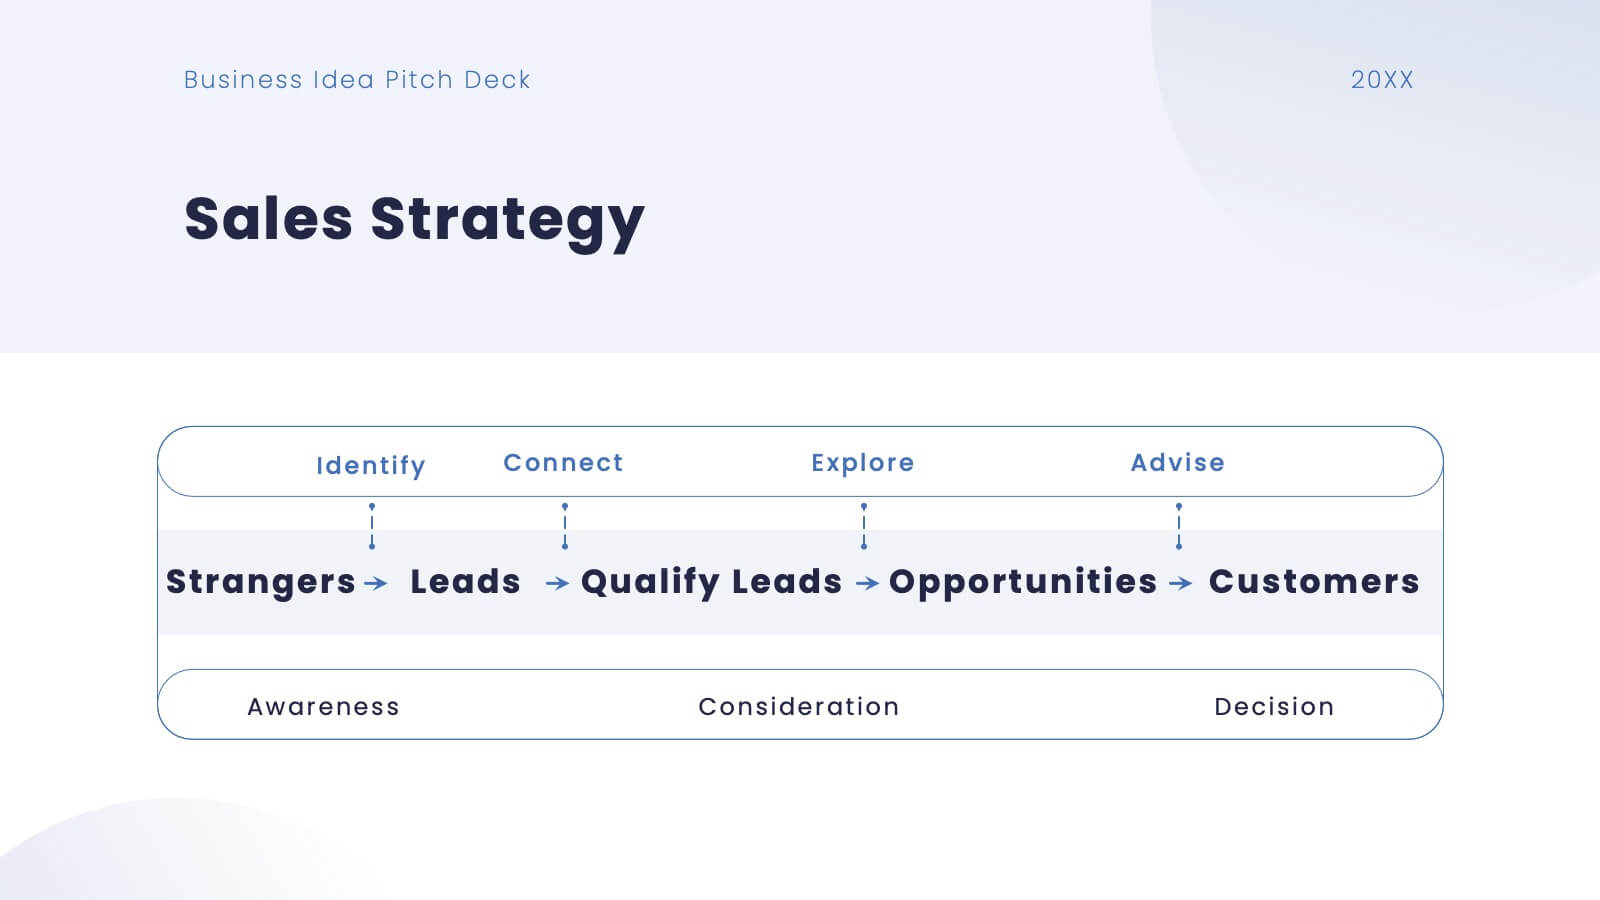
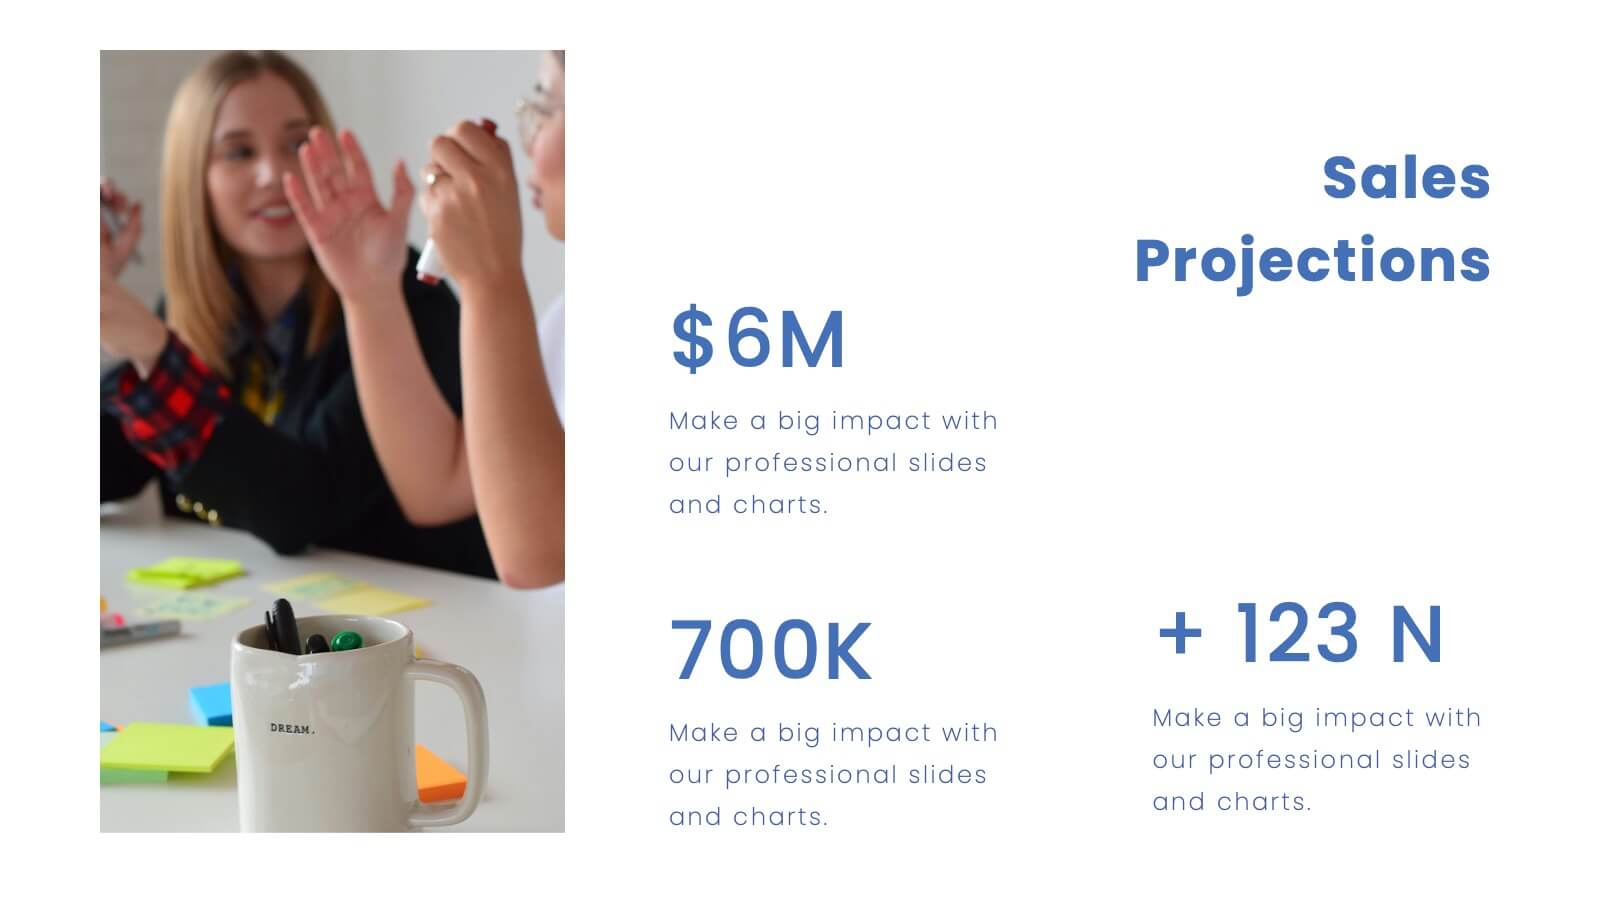
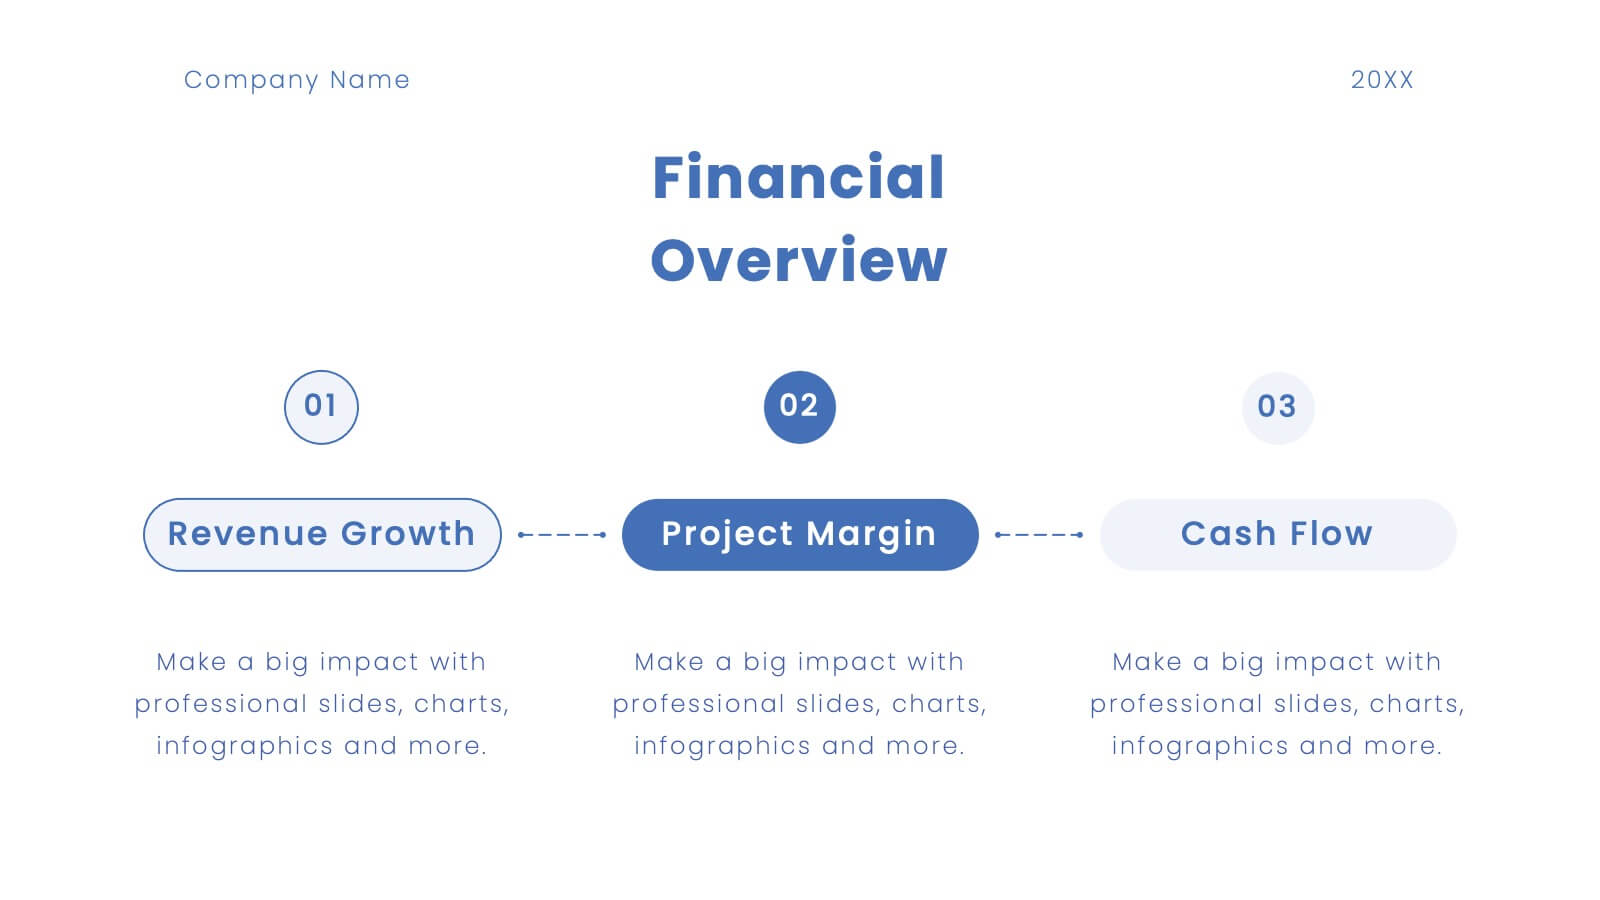
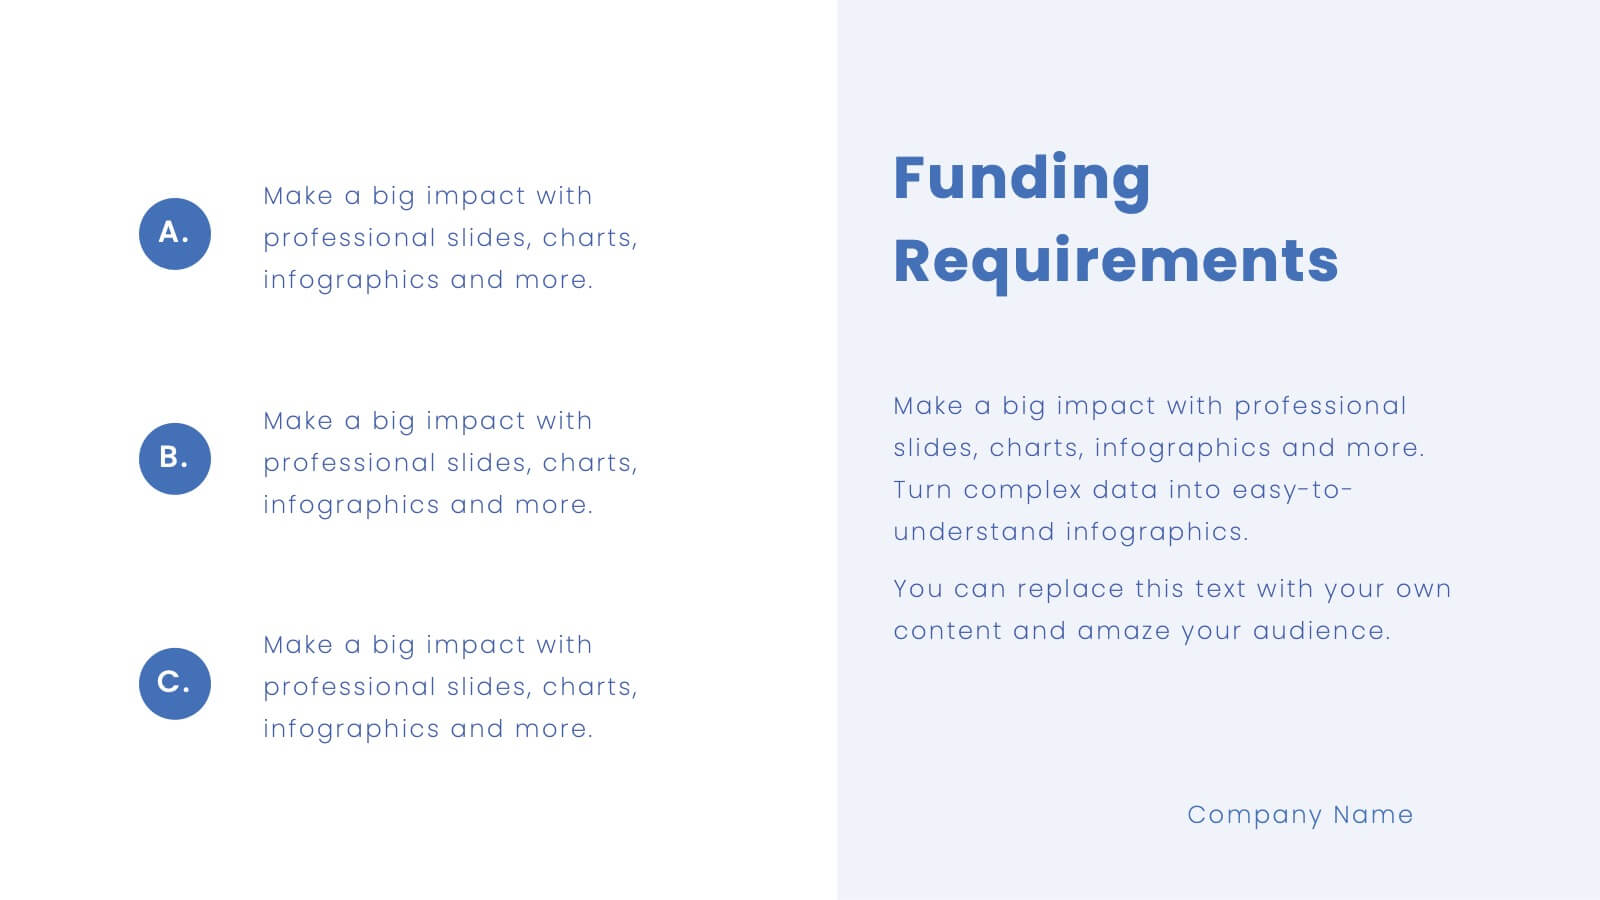
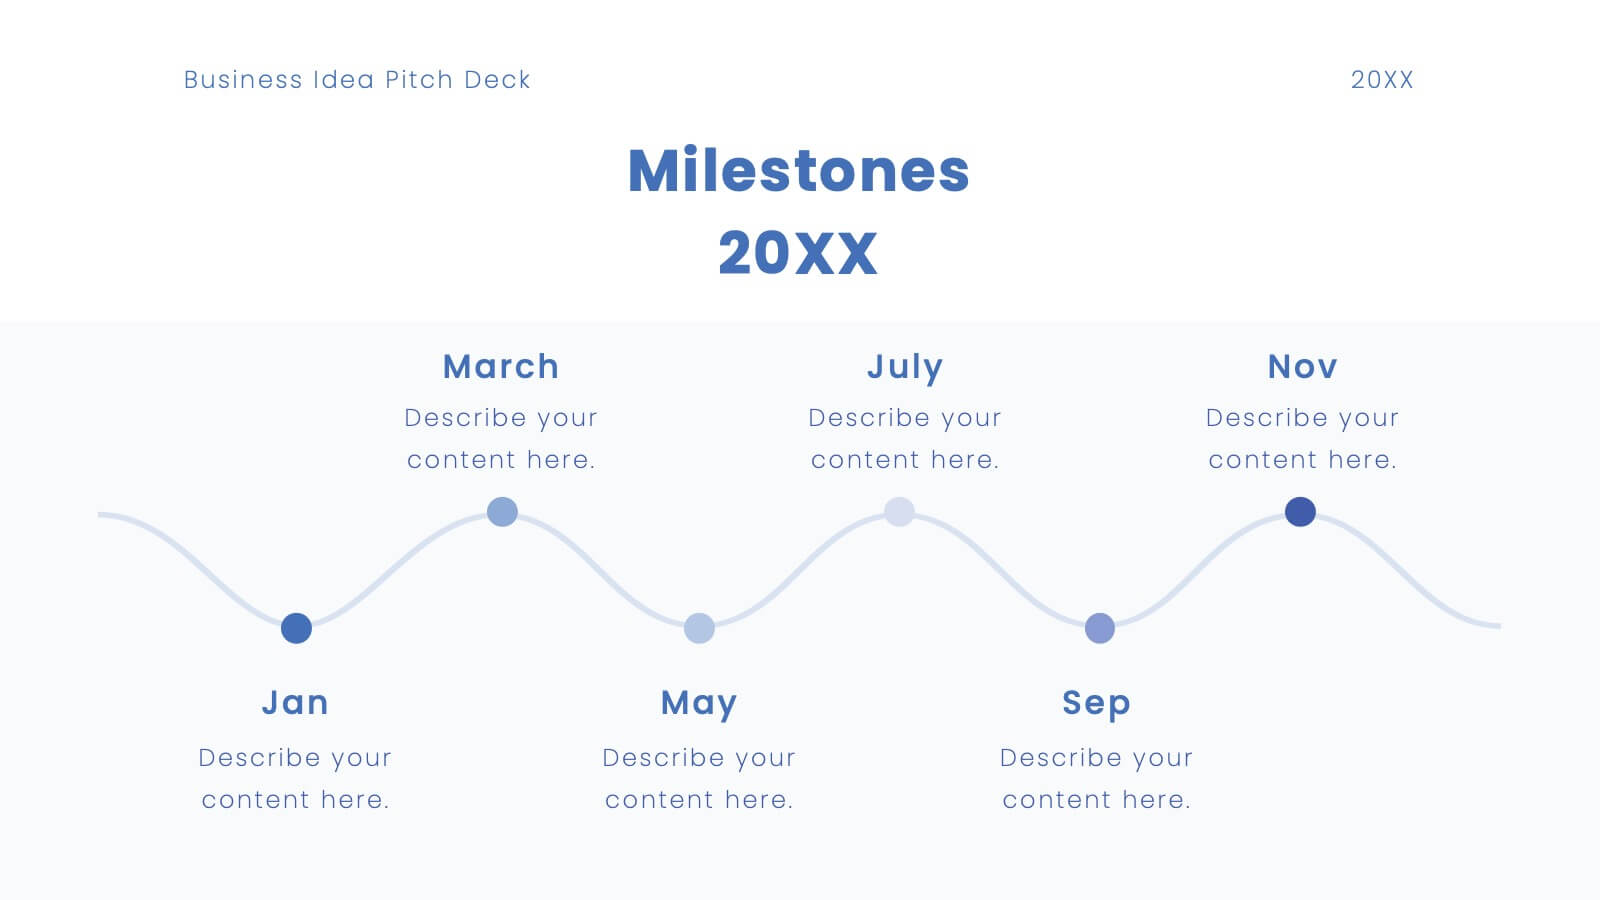
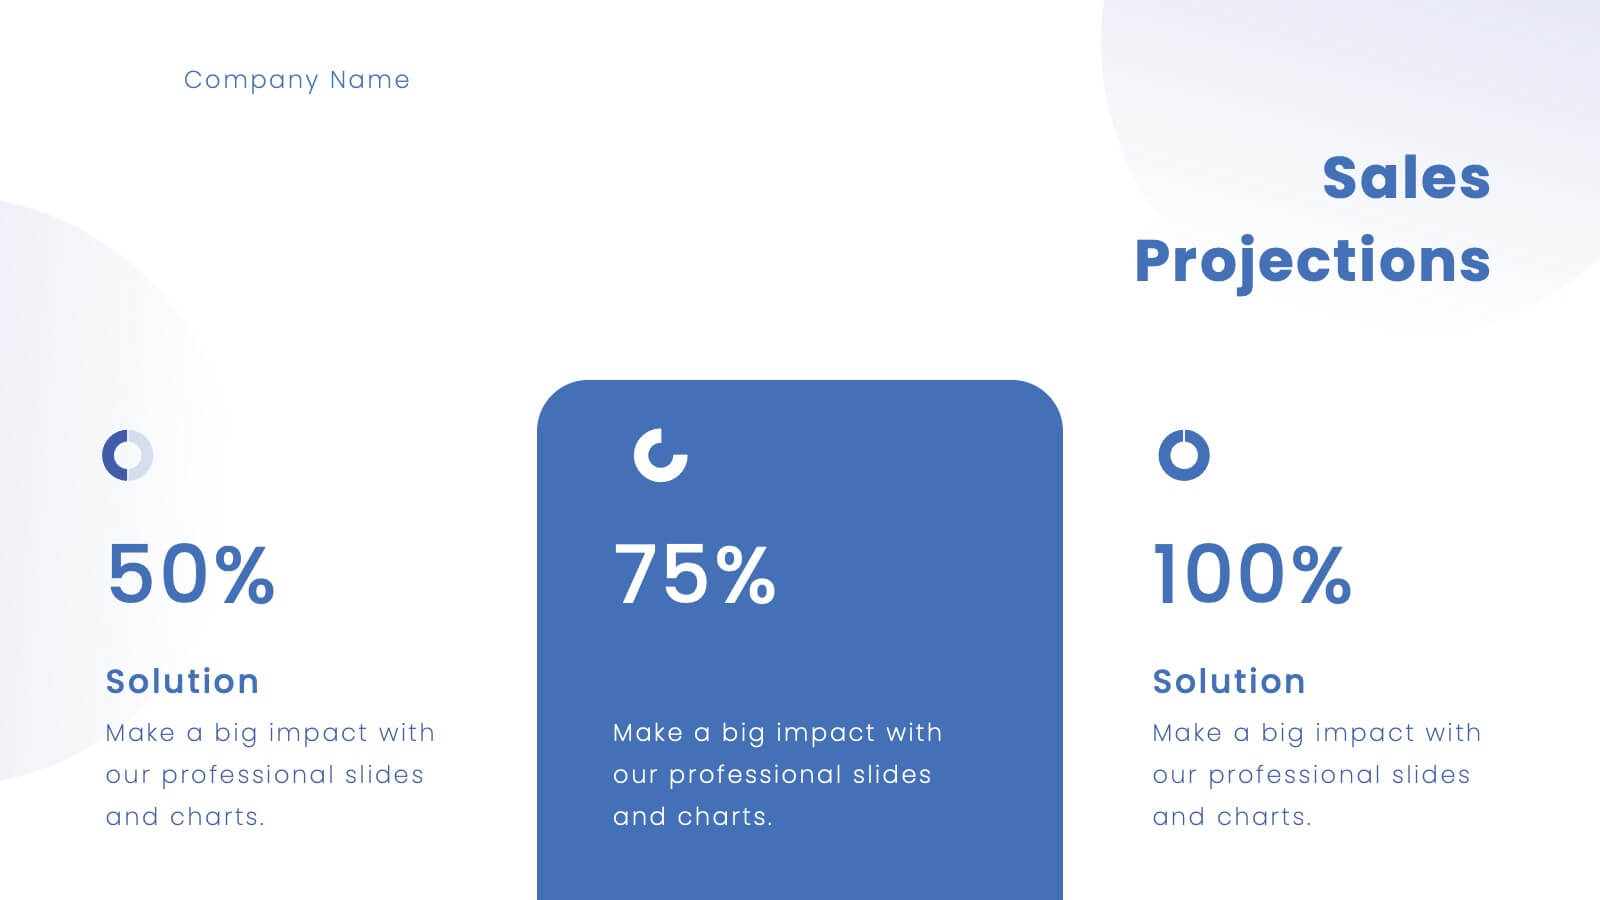
Platinum Business Idea Pitch Deck Presentation
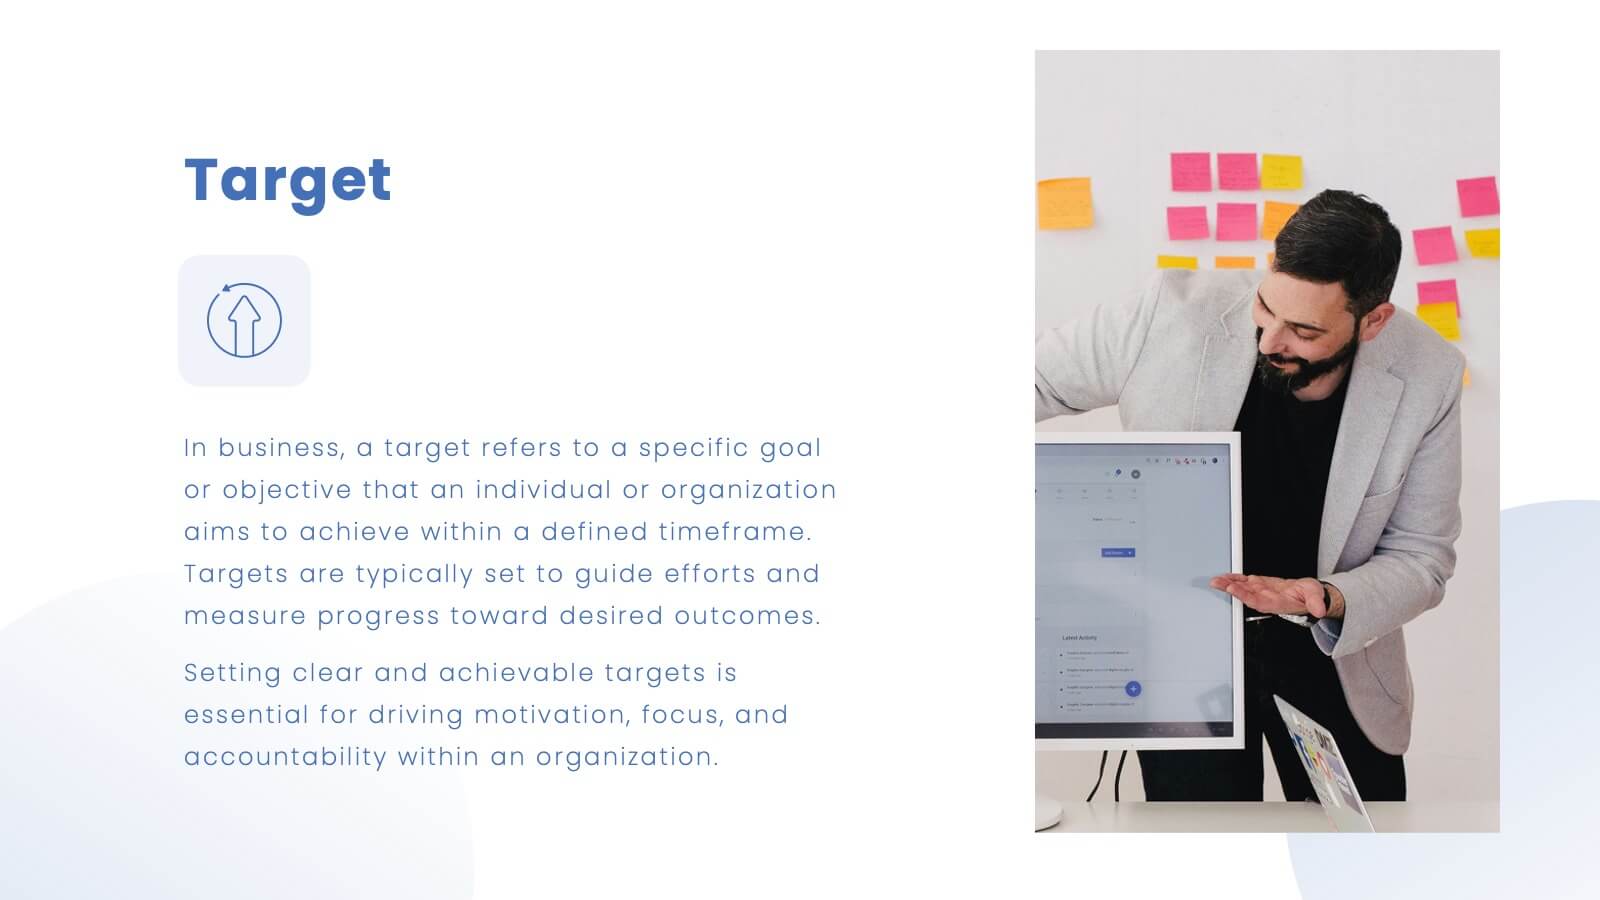
Present your business idea with this sleek and professional pitch deck template! It includes everything from market opportunities to financial projections and sales strategies, providing a comprehensive structure for your pitch. Fully customizable and compatible with PowerPoint, Keynote, and Google Slides, this template is ideal for impressing investors and stakeholders.


18 diapositivas
Riftbound Creative Design Report Presentation
Unleash your creative vision with this beautifully structured design presentation! It covers essential aspects like concept development, typography, moodboards, wireframes, and final design, ensuring a comprehensive journey from idea to execution. Perfect for creative teams or client presentations, this template is fully compatible with PowerPoint, Keynote, and Google Slides.


5 diapositivas
Task Automation Process Flow Presentation
Streamline operations with this visual task automation flowchart. Perfect for illustrating automated sequences, decision nodes, and multi-branch logic. Clearly labeled elements guide viewers through each step. Ideal for tech teams, process designers, and workflow planning. Fully editable in PowerPoint, Keynote, and Google Slides to match your branding and automation strategy.


5 diapositivas
Organizational and IT Network Mapping Presentation
Visualize internal roles and technical relationships with this Organizational and IT Network Mapping template. Ideal for IT teams, operations, or management, it helps illustrate user access, collaboration patterns, and system connections. Fully customizable and compatible with PowerPoint, Keynote, and Google Slides for a seamless integration into your presentations.


7 diapositivas
Healthy Food Infographic
Healthy food is of paramount importance for overall well-being and a good quality of life. This infographic template aims to promote understanding and adoption of a healthy diet through a visually appealing and informative layout. This template is designed to showcase a balanced and nutritious diet by educating individuals on healthy food choices, portion control, and incorporating superfoods into their meals. This infographic is fully customizable and compatible with Powerpoint, Keynote, and Google Slides. This allows you to easily customize, add visuals, and design as per your needs and preferences.
8 diapositivas
Key Project Milestone Tracker
Stay on top of progress with this streamlined Key Project Milestone Tracker. Designed to showcase up to eight critical milestones with corresponding years, this timeline helps visualize project phases and deadlines clearly. Fully editable in PowerPoint, Keynote, and Google Slides for easy customization.


5 diapositivas
Strategic HR Planning with Skills Gap Analysis
Lead with insight. The Strategic HR Planning with Skills Gap Analysis slide is your go-to tool for aligning talent strategy with organizational needs. Ideal for showcasing workforce priorities, skill readiness, and actionable development plans—fully editable in PowerPoint, Keynote, and Google Slides.


21 diapositivas
Karma Design Portfolio Presentation
Step into the spotlight with this bold and contemporary design portfolio! It presents your creative work in a sleek, visually striking format. From featured projects to your creative process and collaborations, this portfolio will leave a lasting impression. Perfect for showcasing your design style on PowerPoint, Keynote, or Google Slides!


10 diapositivas
Business Strategy Puzzle Presentation
Build a strong foundation with the Business Strategy Puzzle. This visually compelling design helps you break down key strategic components, business planning, and operational workflows into digestible segments. Perfect for corporate strategies, project management, and executive decision-making. Fully editable and compatible with PowerPoint, Keynote, and Google Slides.


10 diapositivas
Hospital Services Overview Presentation
Bring your healthcare message to life with a clean, modern layout that makes complex hospital services easy to understand. This presentation helps you outline key departments, care processes, and essential service details with clarity and confidence. Designed for smooth communication in medical settings, it works seamlessly in PowerPoint, Keynote, and Google Slides.


5 diapositivas
New Hire Orientation Program
Welcome new employees with confidence using the New Hire Orientation Program Presentation. This step-by-step slide is designed to outline your company’s onboarding journey in five clear, structured stages. With labeled “Step 01” through “Step 05” banners, icon placeholders, and editable text boxes, this template is ideal for HR teams, managers, or team leads introducing company values, processes, or benefits. Available in both full-color and progressive highlight variations, it's fully customizable in PowerPoint, Keynote, and Google Slides.


6 diapositivas
Tables of Content Analysis Infographic
Table of Contents analysis refers to the examination and evaluation of the structure and content of a document's table of contents. It is commonly used as a preliminary step to understand the flow of information within a longer document, such as a book, report, thesis, or research paper. This infographic template provides insights into the document's structure and can help readers determine whether the document is relevant to their needs. This infographic is designed to provide a quick overview of the topics covered in the document and their distribution, helping readers understand the organization of the content at a glance.


6 diapositivas
5-Step Implementation for Business Growth Presentation
Present your strategic plan with clarity using the 5-Step Implementation for Business Growth Presentation. This horizontal arrow layout guides your audience through five key phases of execution—from planning to final results. Each step is clearly numbered and color-highlighted for visual flow. Fully editable in PowerPoint, Keynote, Google Slides, and Canva.


6 diapositivas
Project Rollout Milestone Timeline Presentation
Visually map out your project phases with the Project Rollout Milestone Timeline Presentation. Featuring a modern cylinder path layout, this slide is perfect for showcasing five key milestones in sequential or strategic order. Ideal for project managers and teams, and fully editable in Canva, PowerPoint, Keynote, and Google Slides.


26 diapositivas
Sustainable Business Practices Presentation
Present your eco-friendly business approach with this straightforward template that reflects your commitment to sustainability. It's decked with leafy designs and organic textures that naturally convey your green message. From showcasing your leadership to illustrating growth with intuitive graphs, the template makes it simple to share your vision. Perfect for any platform, like PowerPoint or Google Slides, it’s designed to help you communicate big ideas, like reducing carbon footprints or embracing renewable resources, in a way that’s easy for everyone to grasp. Let this template be the backdrop as you chart a course for a sustainable future, making complex concepts like ‘green initiatives’ and ‘sustainable practices’ clear and actionable.


4 diapositivas
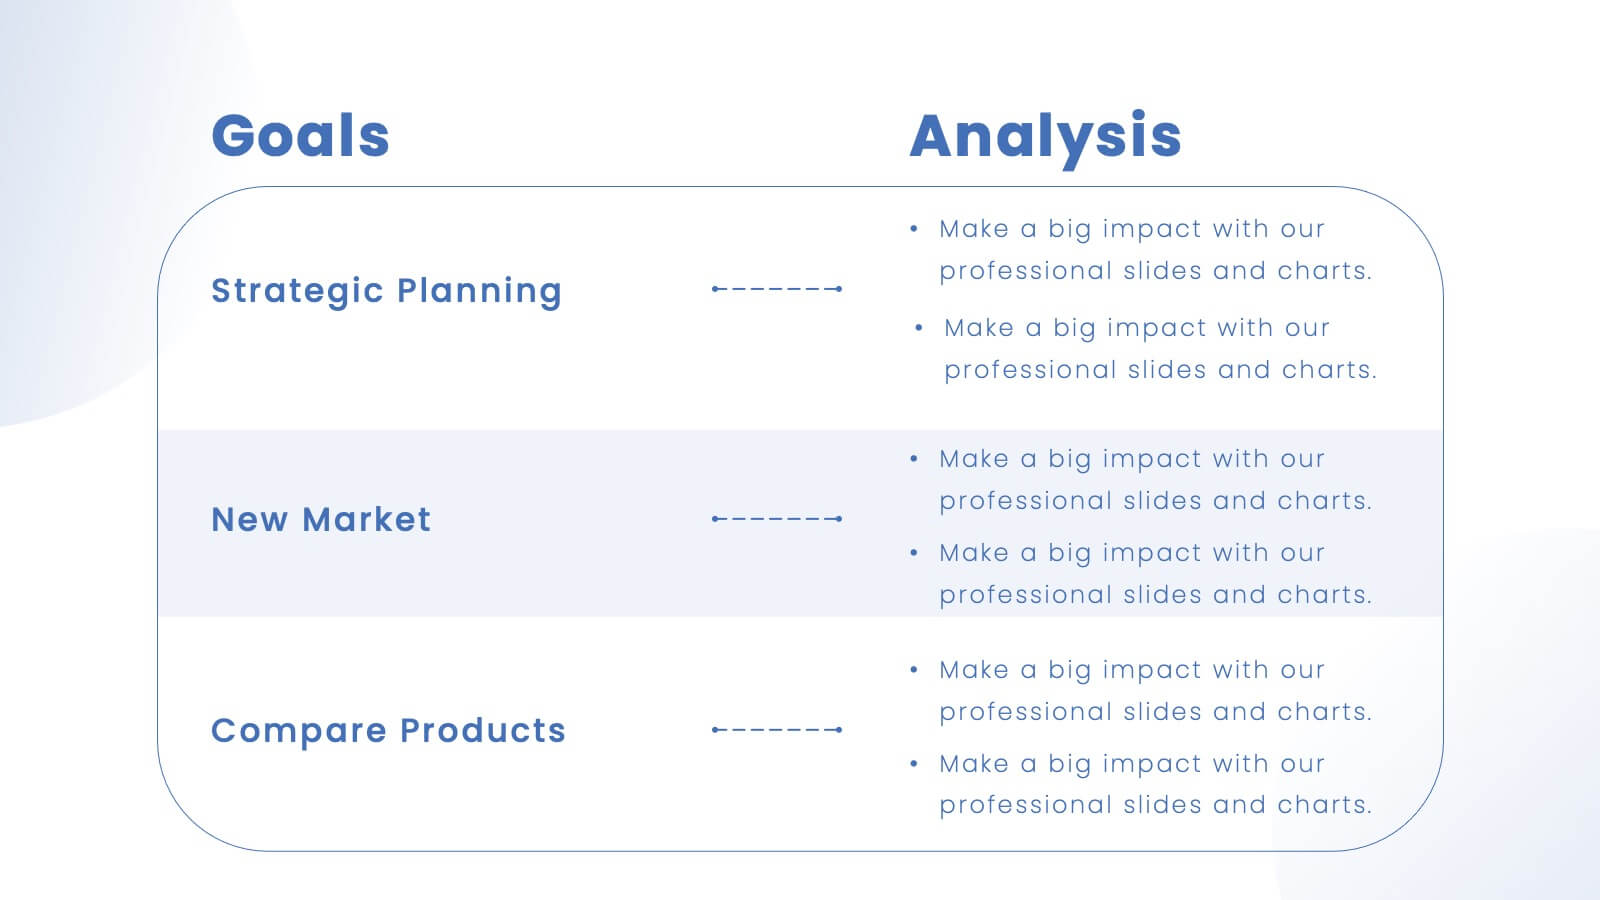
Products Comparison Table Presentation
Make your decision-making story instantly clear with a bold visual that balances options in a clean, modern way. This presentation helps you compare features, weigh benefits, and highlight key differences using simple graphics and intuitive labeling. Fully compatible with PowerPoint, Keynote, and Google Slides.