


Características


¿Tienes alguna pregunta?
Recomendar


8 diapositivas
Virtual Team Collaboration Presentation
The "Virtual Team Collaboration" presentation template is designed to highlight different facets of teamwork in a remote setting. Each slide features a central visual metaphor illustrated by connected circles, symbolizing the interconnected nature of virtual team activities and communication. The layout provides placeholders for titles and descriptive text, making it suitable for detailing various aspects of virtual collaboration such as project management, communication protocols, and role assignments. The design encourages a clear and organized presentation of information, facilitating discussions on best practices and strategies for effective remote teamwork.


4 diapositivas
Communication Model and Channels Presentation
Illustrate how your messages move through various channels using this clean, visual communication model slide. Ideal for team briefings, marketing workflows, or internal training, it simplifies how information is shared across platforms. Fully editable in Canva, PowerPoint, and Google Slides for seamless customization to match your branding and messaging goals.


2 diapositivas
Stylish Title Cover Presentation for Reports Presentation
Set the tone with a title slide that means business—without being boring. This stylish cover layout gives your report presentations a polished, modern look while keeping the focus clear and professional. Ideal for executive updates or client-facing decks, it’s fully editable and works perfectly in PowerPoint, Keynote, and Google Slides.


5 diapositivas
Multiple Lists Infographics
Unleash the power of organized information with our multiple lists infographics template, your companion for presenting diverse data. This versatile resource, steeped in a vibrant mix of orange, blue, and purple hues, caters to professionals from all sectors, aiding in the seamless conveyance of varied content, from business agendas to educational material. The template, characterized by its informative and creatively random style, integrates compelling graphics and intuitive icons. Whether you're a business leader, educator, or content creator striving for clarity and engagement, this infographic tool is tailored for an unforgettable visual impact.


7 diapositivas
Consecutive Numbers Infographic
Dive into the world of mathematics with our Consecutive Numbers Infographic! Employing an array of serene blues and greens, this visually appealing tool breaks down the concept of consecutive numbers in a fun and comprehensible manner. It's an educator's dream, designed to captivate and engage, making the topic accessible for students of various age groups. Beyond the classroom, it's a handy reference for professionals and enthusiasts alike. With compatibility spanning PowerPoint, Keynote, and Google Slides, this infographic is poised to elevate any presentation, workshop, or lecture it graces.


5 diapositivas
Fashion History Infographics
Fashion History is a rich and fascinating study that allows us to appreciate the artistry, craftsmanship, and cultural significance of clothing and style. These infographic templates explore the evolution of fashion over time. These templates are designed to present key milestones, trends, and influential figures in fashion history in a concise and engaging manner. The color scheme, icons, and illustrations included help these serve as visually captivating resources for anyone interested in the evolution of fashion. Perfect for fashion history presentations, museum exhibitions, or any occasion where you want to share the rich and diverse history of fashion.


7 diapositivas
Geometric Steps Infographic
Unveil complex processes or hierarchies in a visually striking manner with the geometric steps infographic. Utilizing a blend of white, purple, yellow, red, and blue, this infographic captures attention through its distinct geometric shapes. This template design is an asset for educators, project managers, or business professionals aiming to detail a step-by-step guide or a layered approach in their presentations. Its compatibility across PowerPoint, Keynote, and Google Slides ensures a smooth integration into your deck, amplifying the comprehensibility and appeal of your content.


6 diapositivas
Supply & Freight Route Management Deck Presentation
Take your logistics reporting to the next level with this circular supply route diagram. Ideal for visualizing freight movement, delivery checkpoints, and warehouse coordination, this slide offers a clean and organized way to map your operational flow. Fully compatible with PowerPoint, Keynote, and Google Slides.


8 diapositivas
Market Segmentation Customer Profile Presentation
Define Your Ideal Customer with Market Segmentation! The Market Segmentation Customer Profile template is designed to visually categorize customer demographics, behaviors, and needs. Featuring a clean, professional layout with a circular segmentation design, this template helps businesses analyze target audiences, refine marketing strategies, and improve customer engagement. Ideal for marketers, sales teams, and business analysts, this PowerPoint, Keynote, and Google Slides-compatible template is fully editable, allowing you to tailor insights and key data points effortlessly.


5 diapositivas
3-Level Concentric Diagram Presentation
Bring clarity and structure to your ideas with a clean, layered diagram design that simplifies complex concepts. Perfect for showcasing stages, hierarchies, or interconnected systems, it keeps your audience engaged with visual balance and flow. Fully compatible with PowerPoint, Keynote, and Google Slides for effortless customization and presentation flexibility.


15 diapositivas
Business Infographic Presentation Template
A business is an organization engaged in commercial, industrial, or professional activities. A Business Infographic is a visual representation of information related to business topics like marketing, sales, finance, project management, customer service, and more. Using the graphics, charts, icons, and other design elements provided, create the best presentation. These infographics are usually used to help explain business concepts, show trends and results, and communicate information to employees, stakeholders, customers, and for students. Use this for presentations, reports and websites!


6 diapositivas
Target Market Stock Infographic
The target market refers to the specific group of individuals or businesses that a company aims to reach and serve with its products or services. The goal of this infographic template is to provide a overview of your target market, allowing marketers and businesses to craft more personalized and effective marketing strategies. This template is designed to identify and understand that the market is a crucial aspect of marketing and business strategy. This template will help you tailor offerings and marketing efforts to meet the needs of your intended audience. Create marketing campaigns that resonate with your viewers.


6 diapositivas
School Goals and Administration Presentation
Visualize key academic priorities with this notebook-style layout, perfect for school administrators and teachers. Featuring colorful pushpin markers and a two-page spread, this template is great for outlining goals, responsibilities, or class guidelines. Fully editable in PowerPoint, Keynote, and Google Slides for customized, classroom-ready presentations.


22 diapositivas
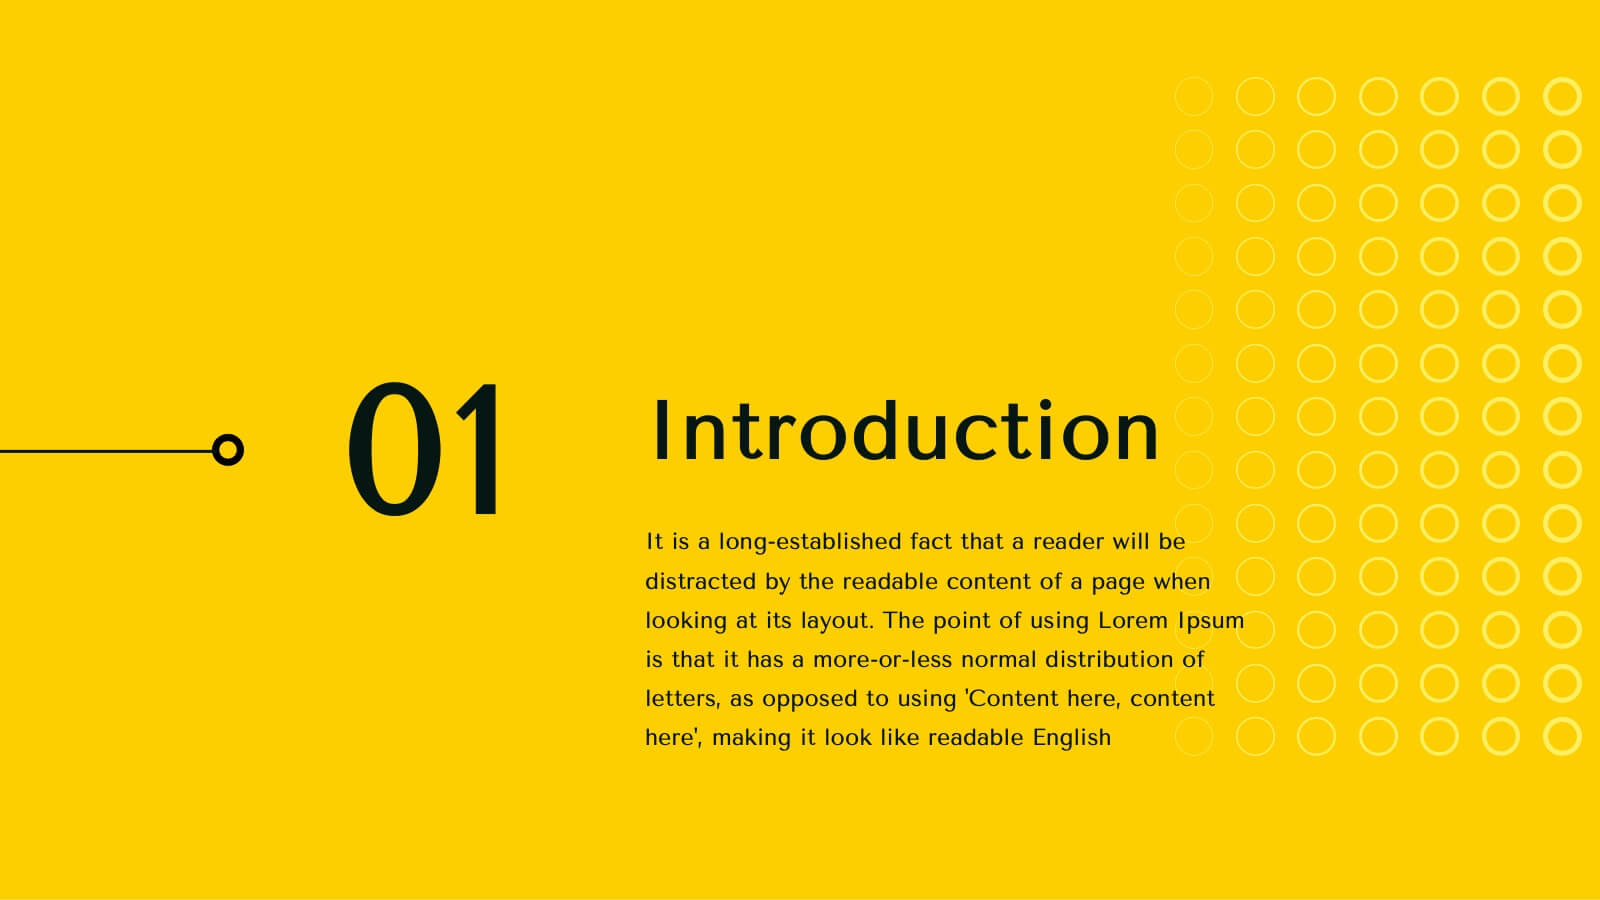
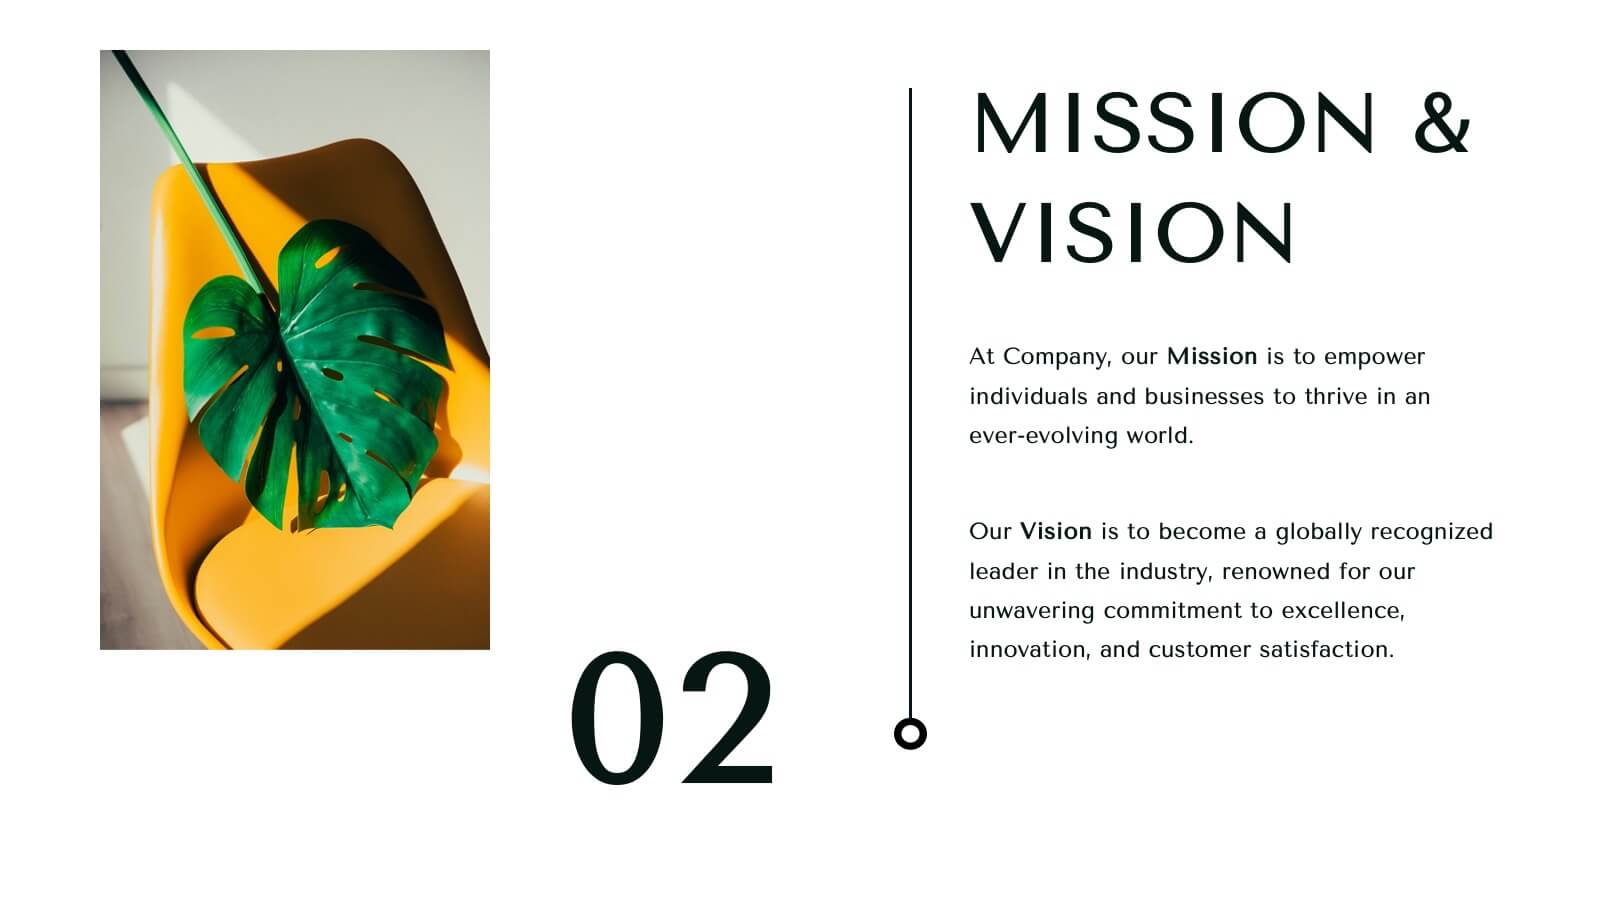
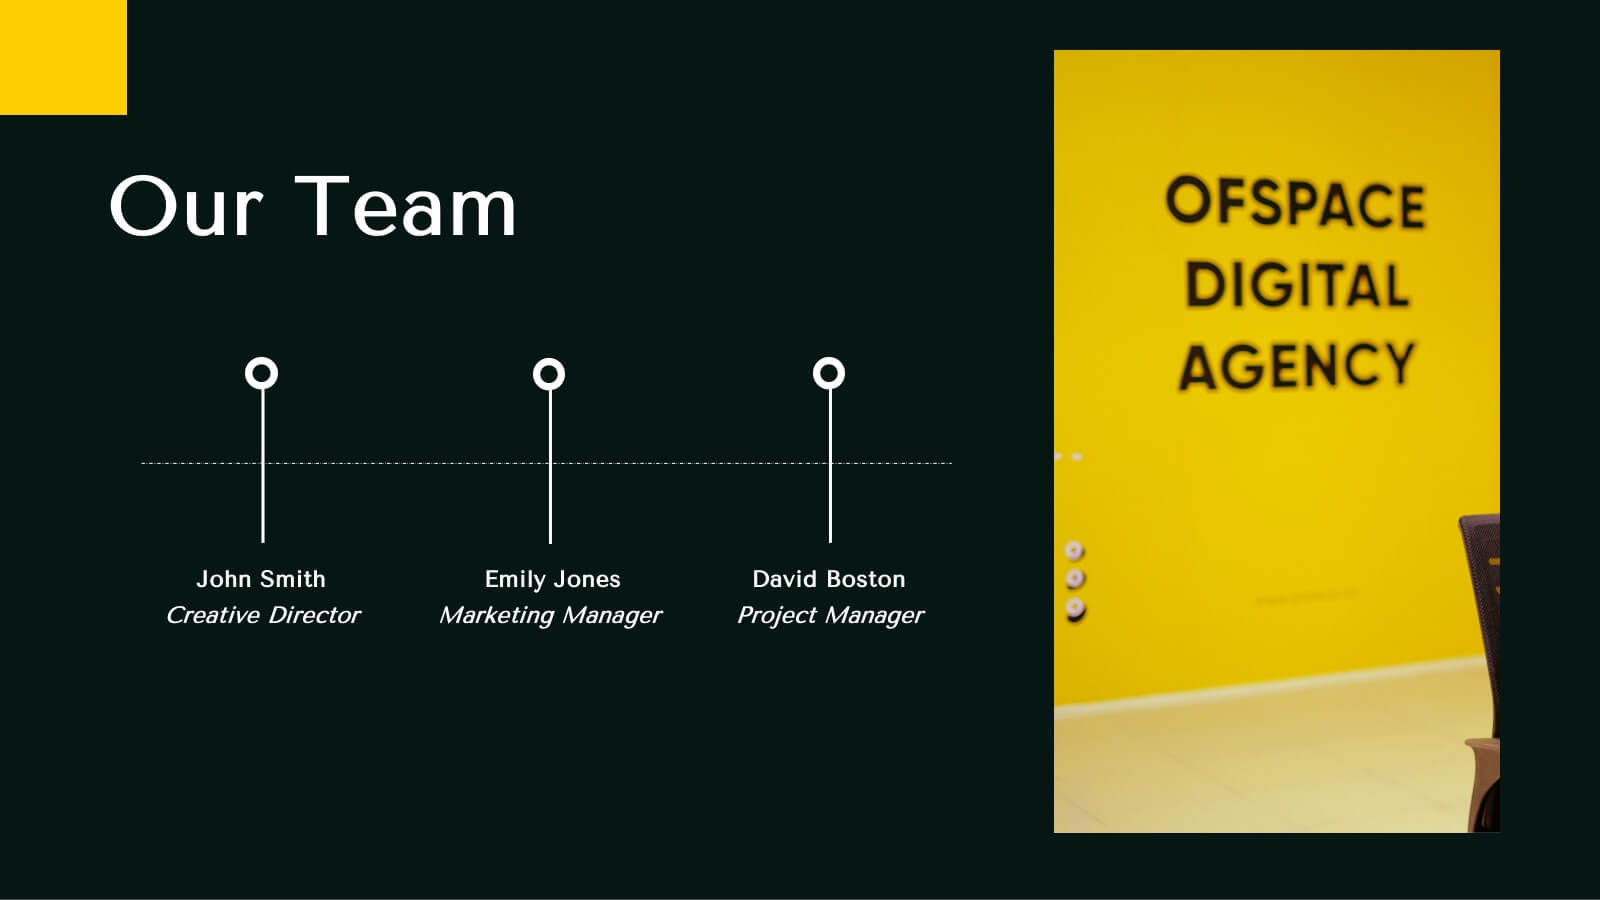
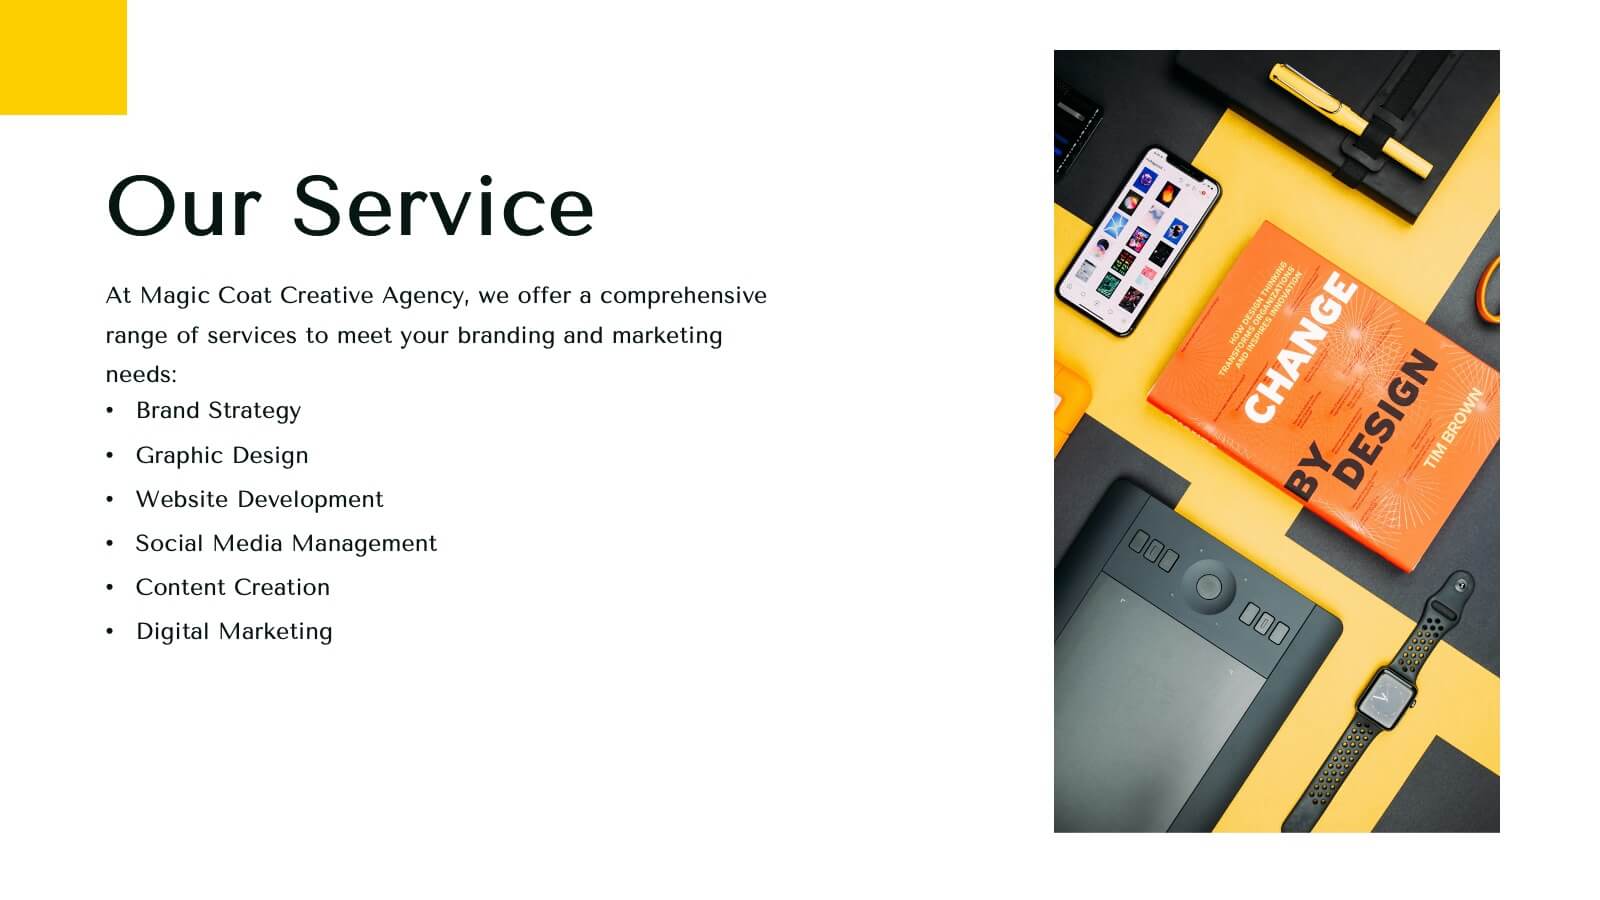
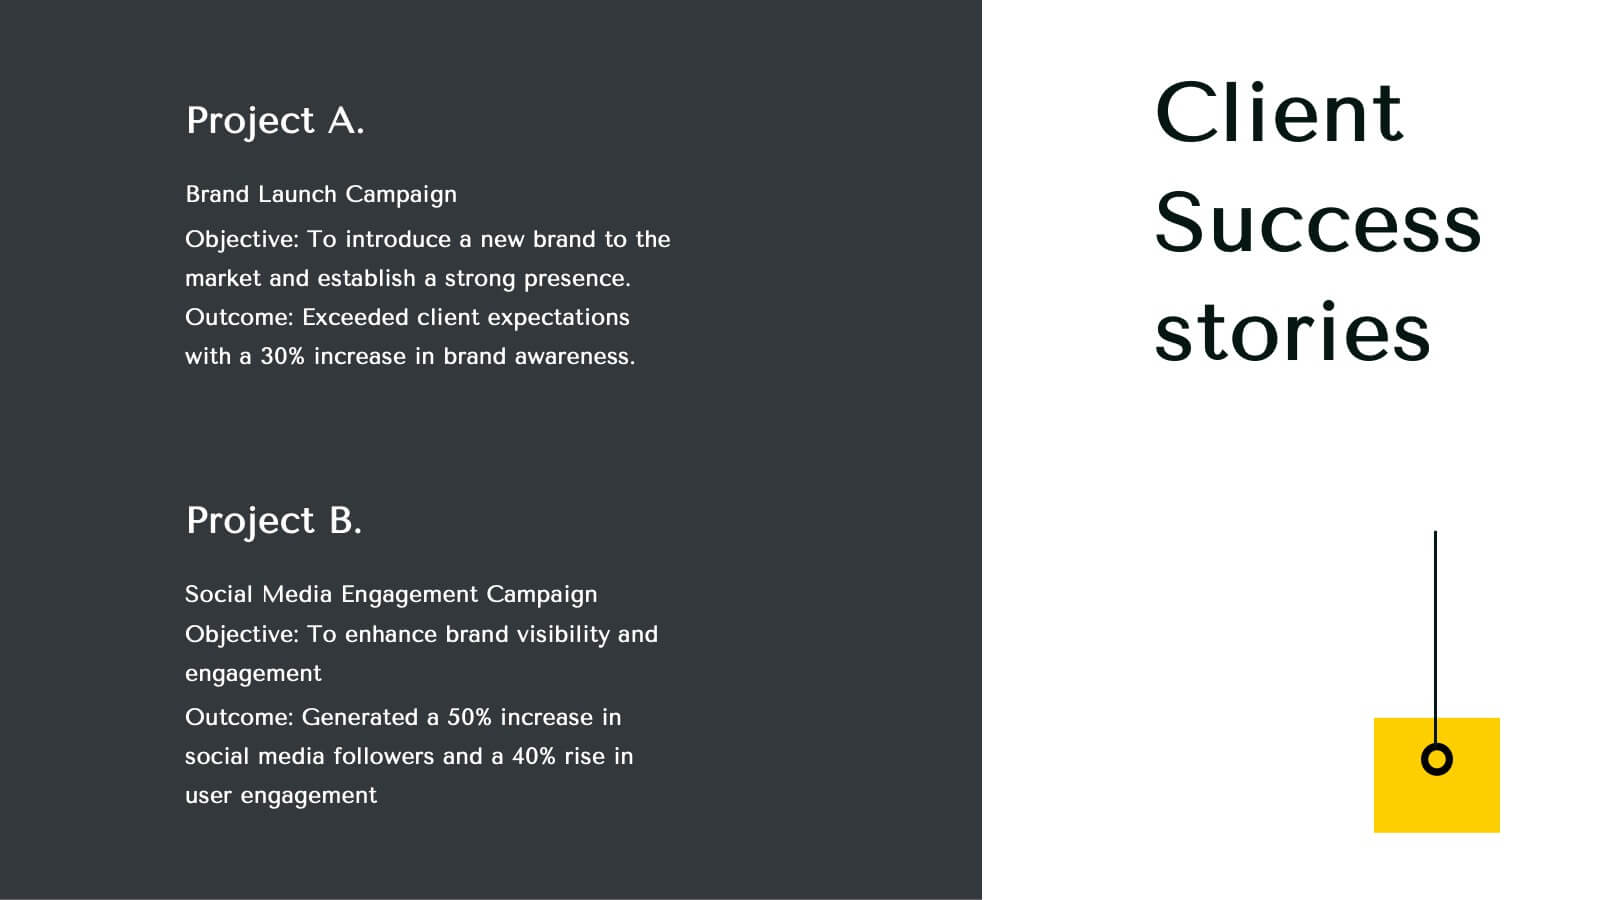
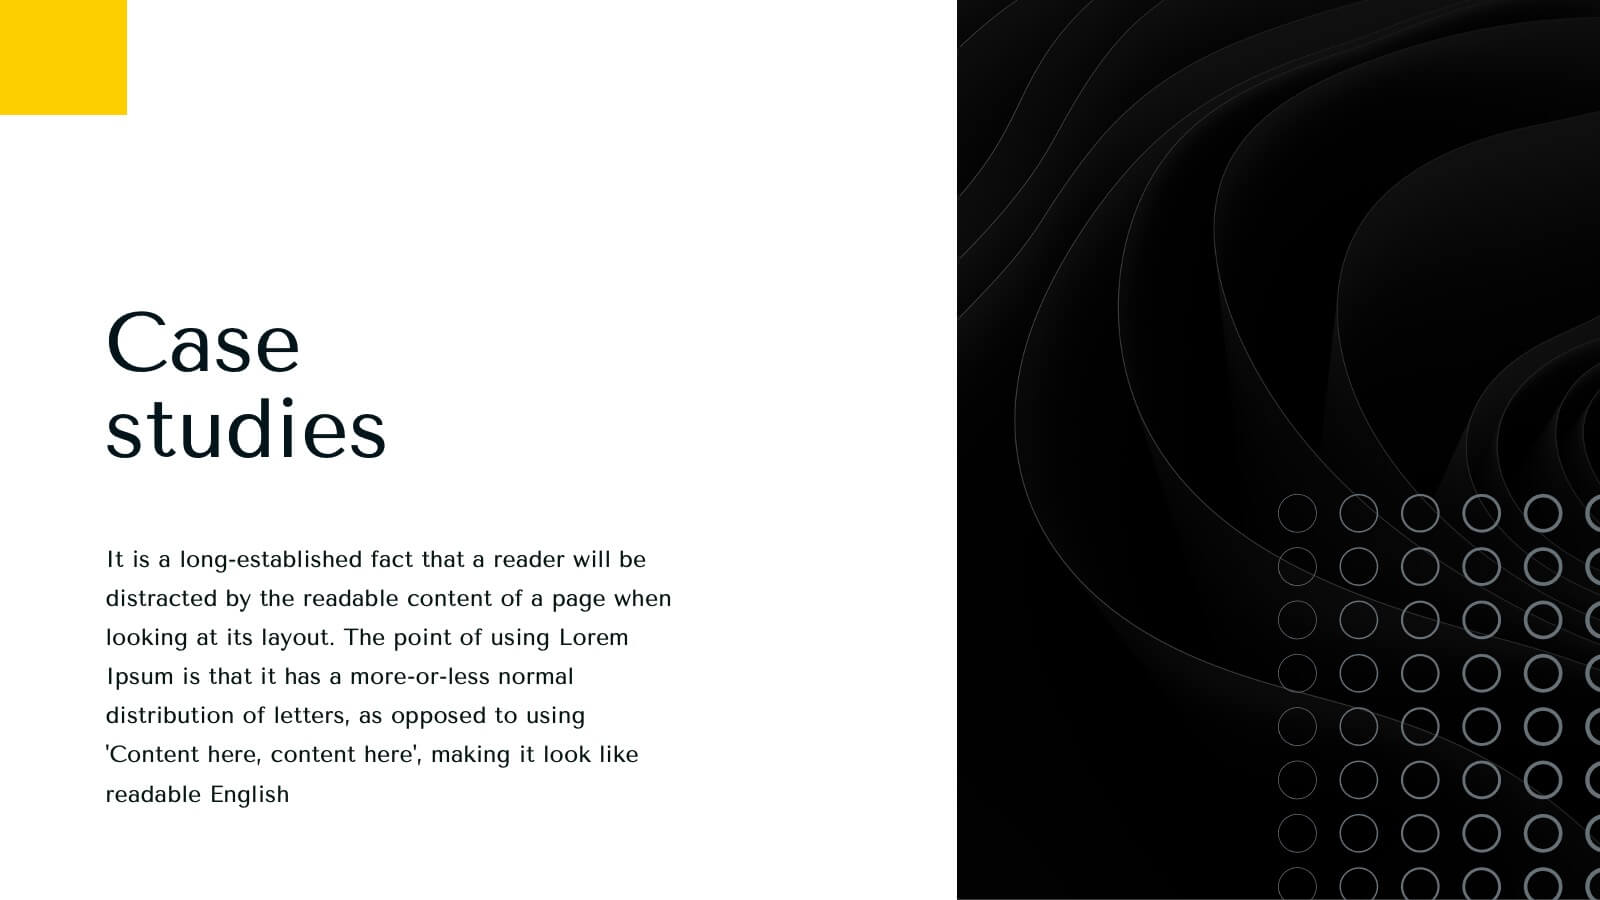
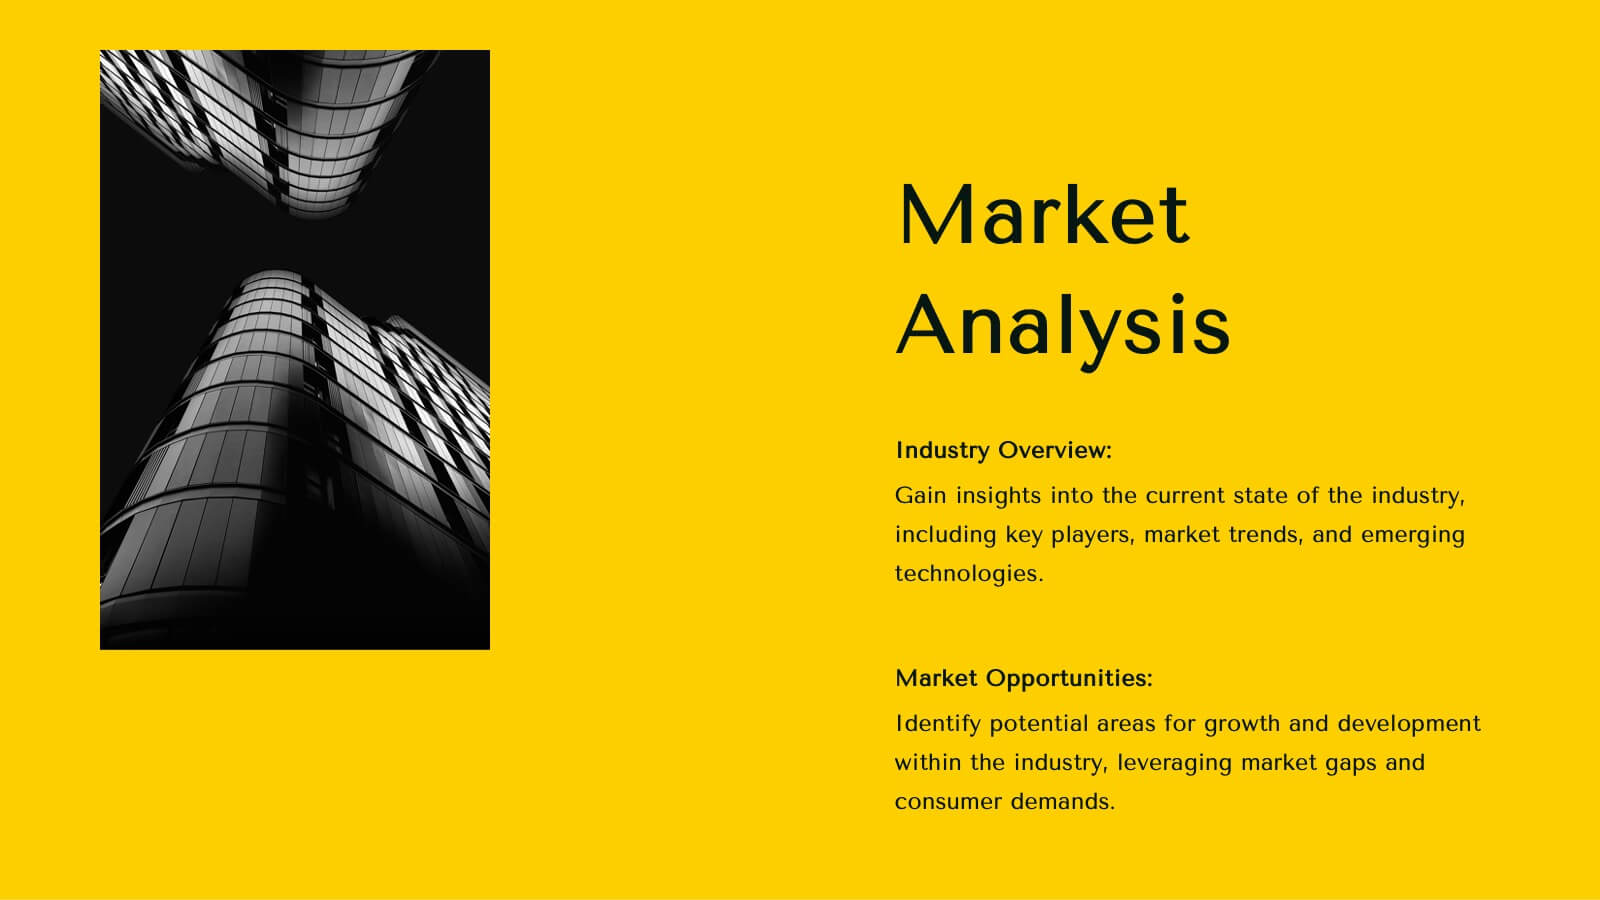
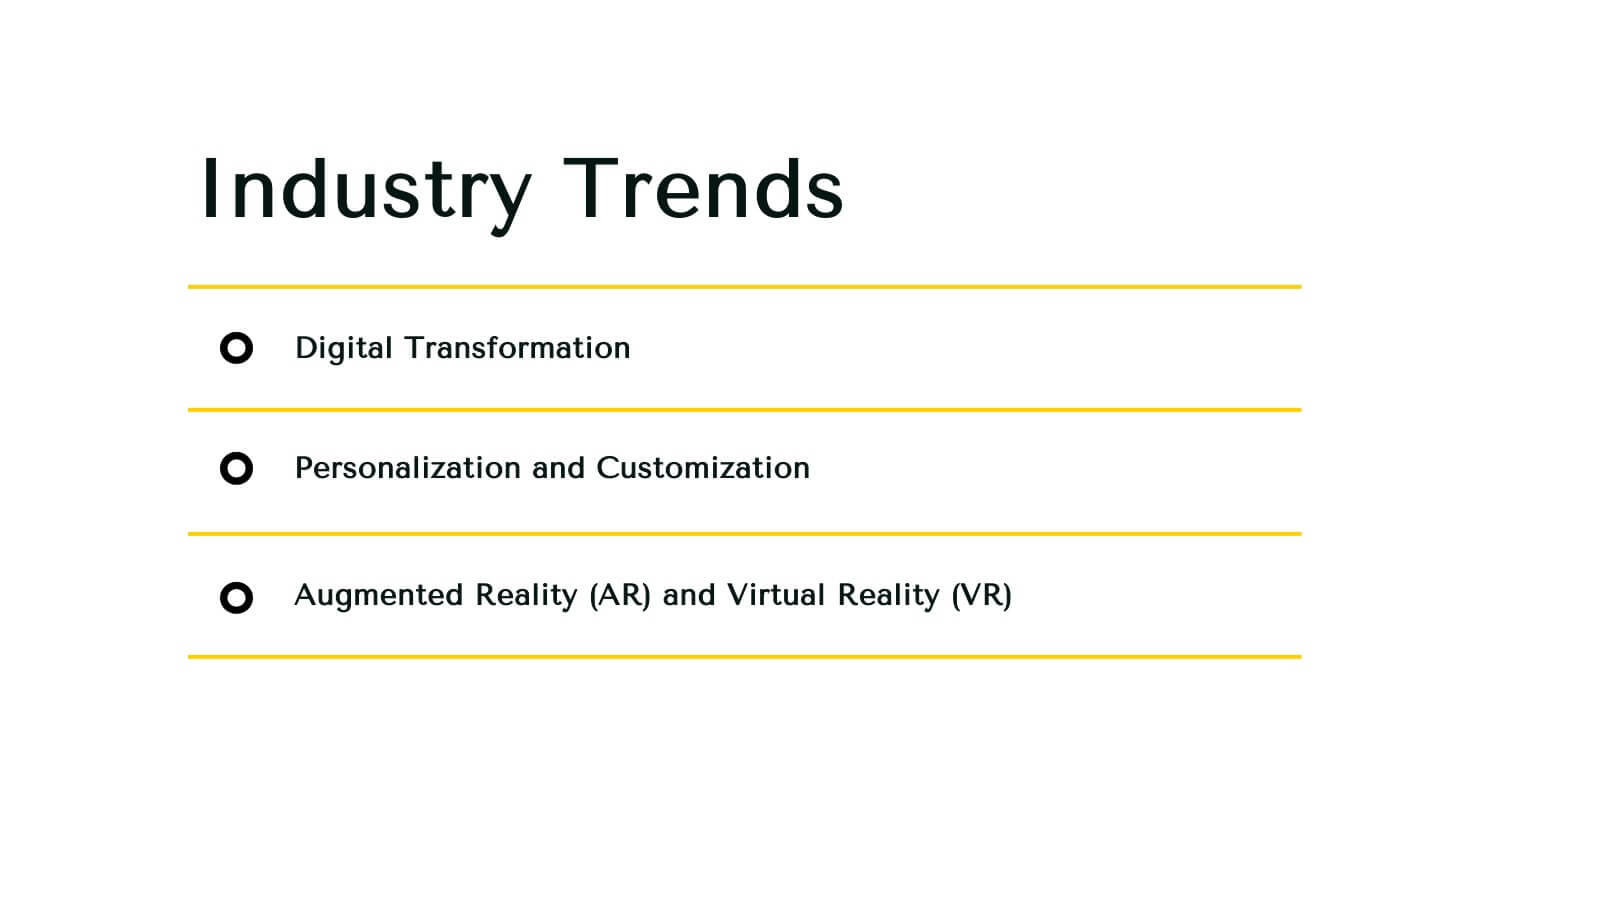
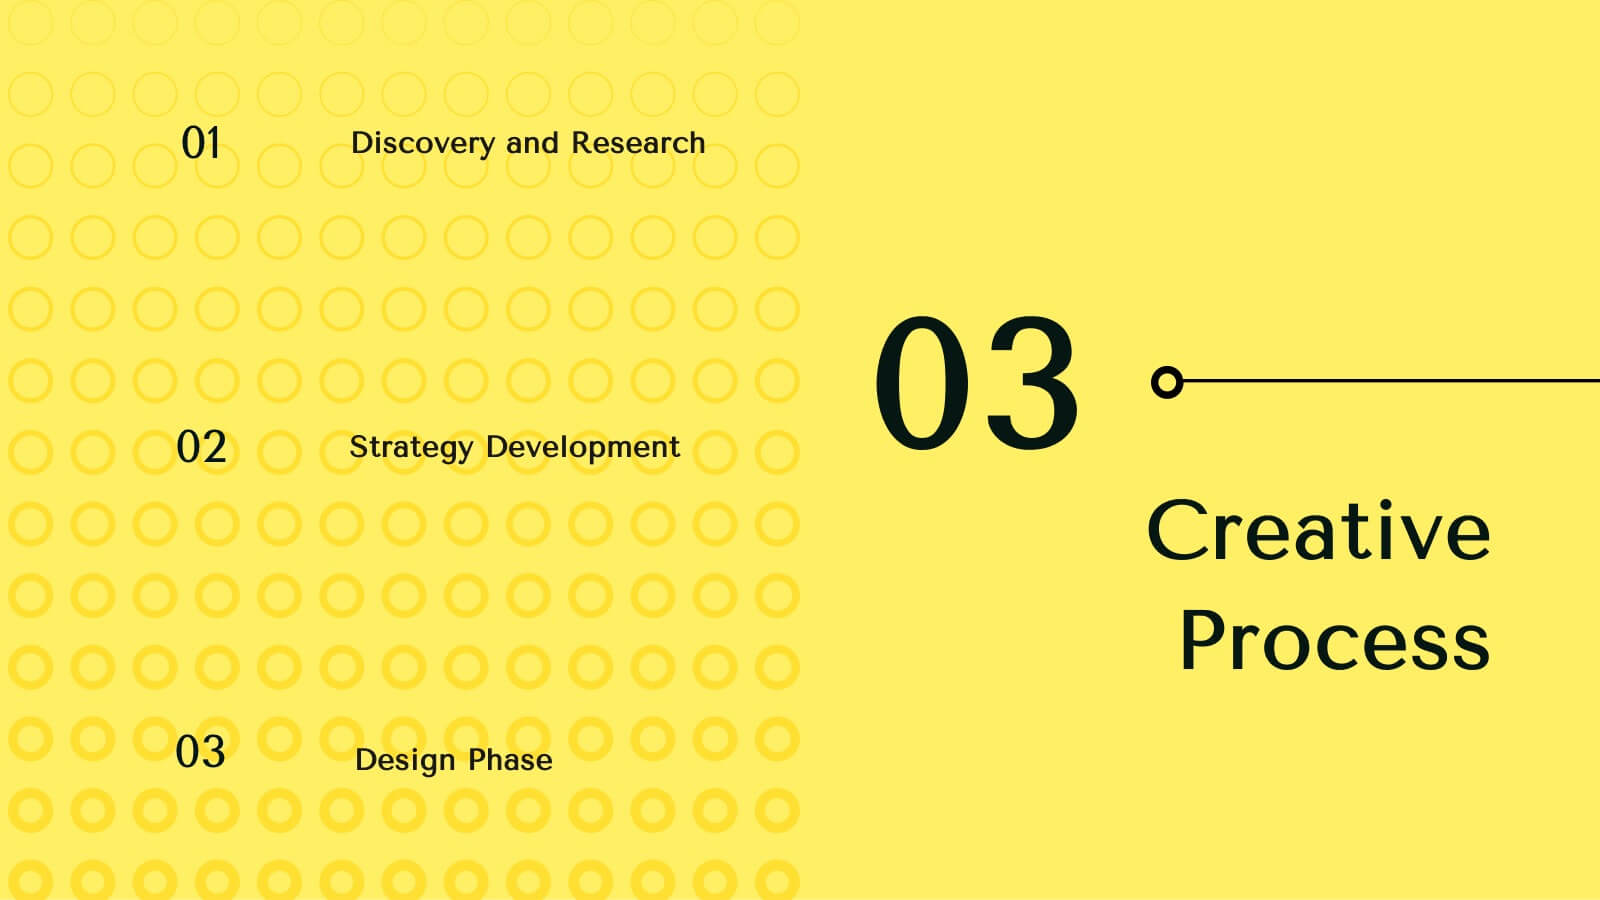
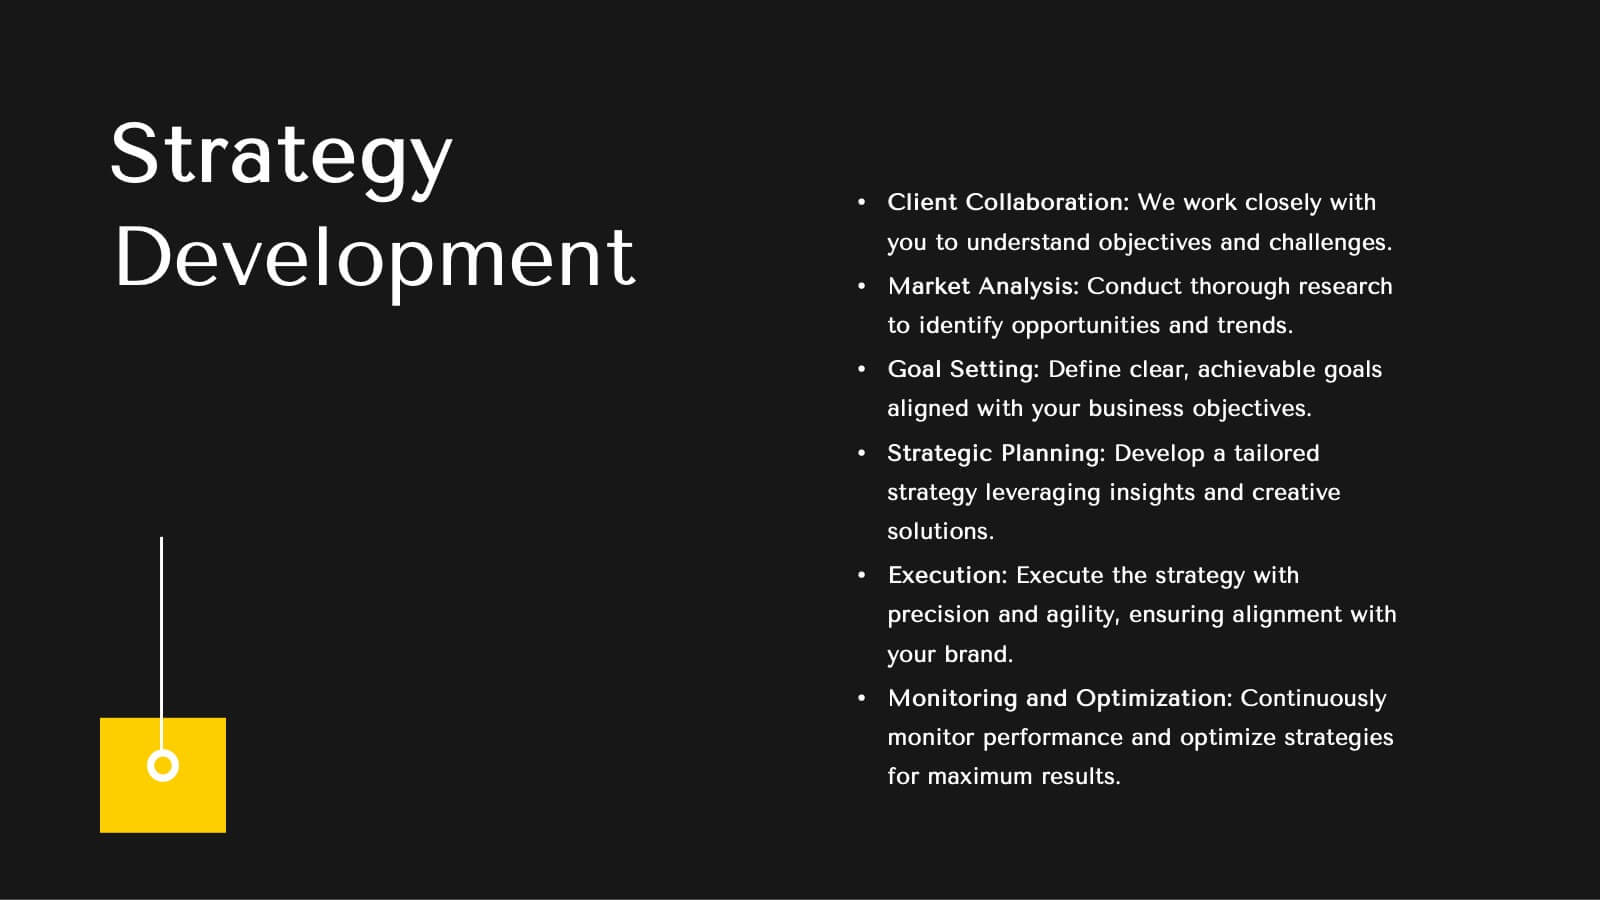
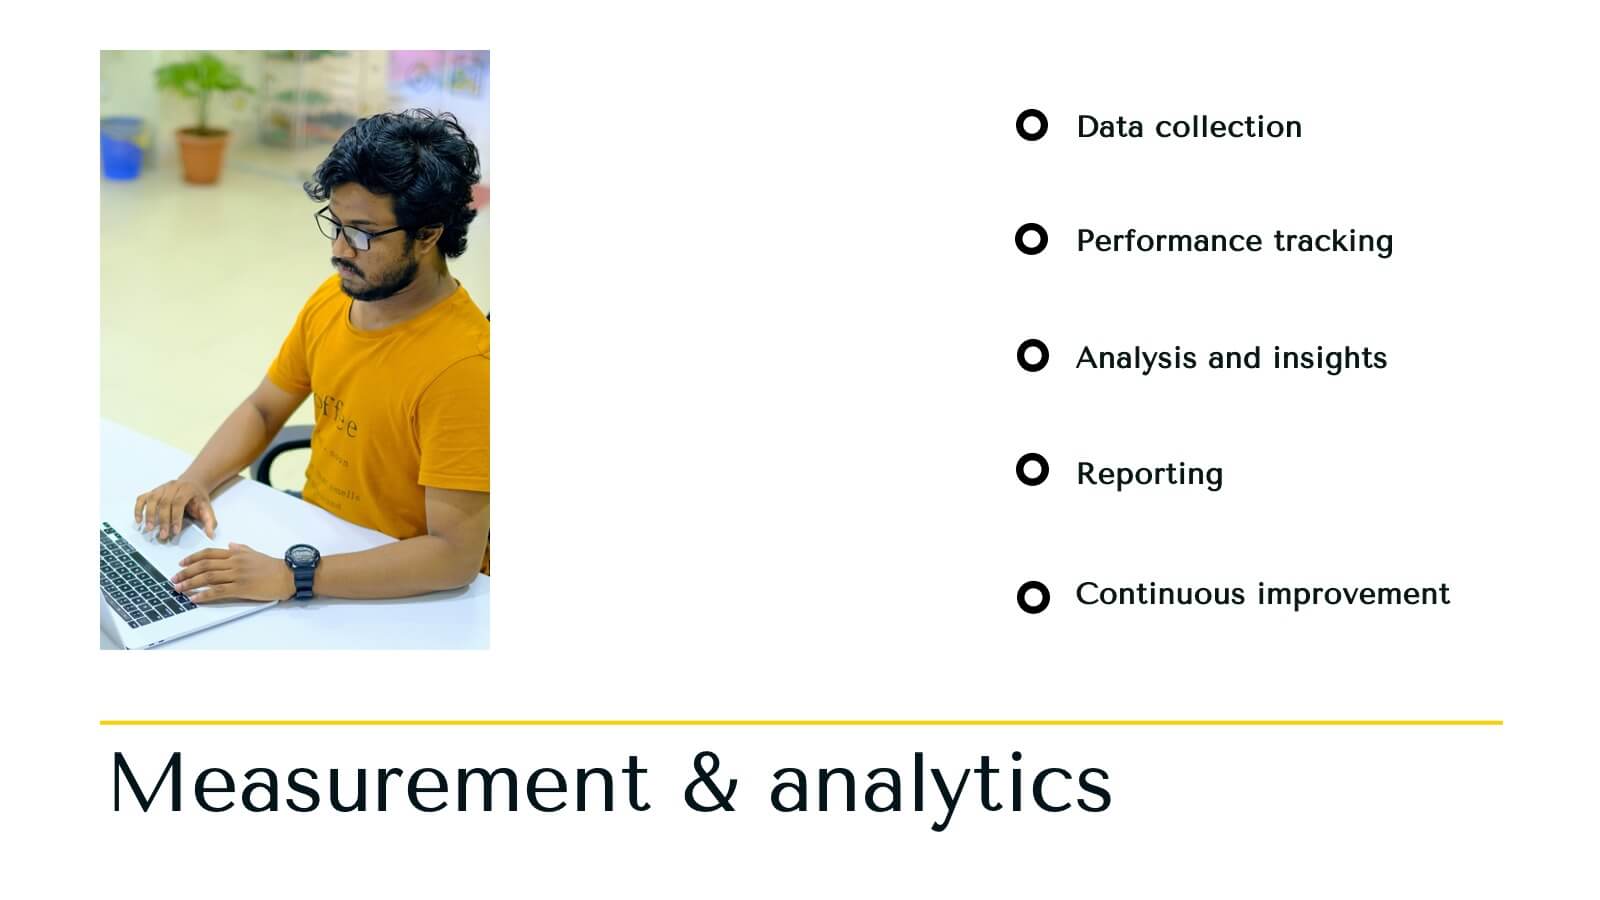
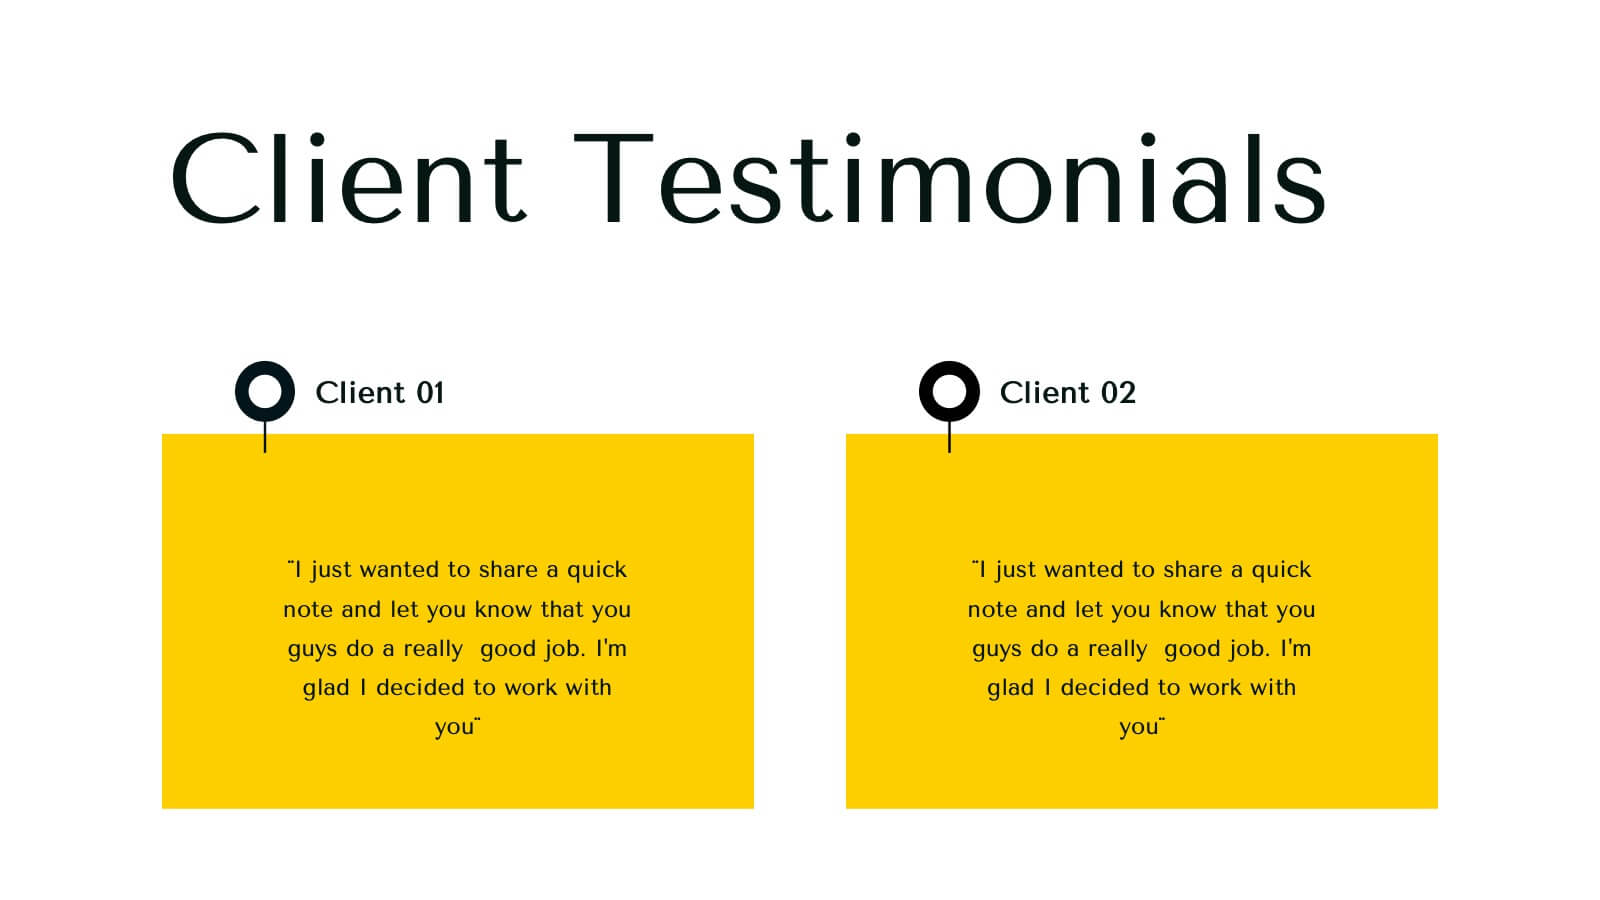
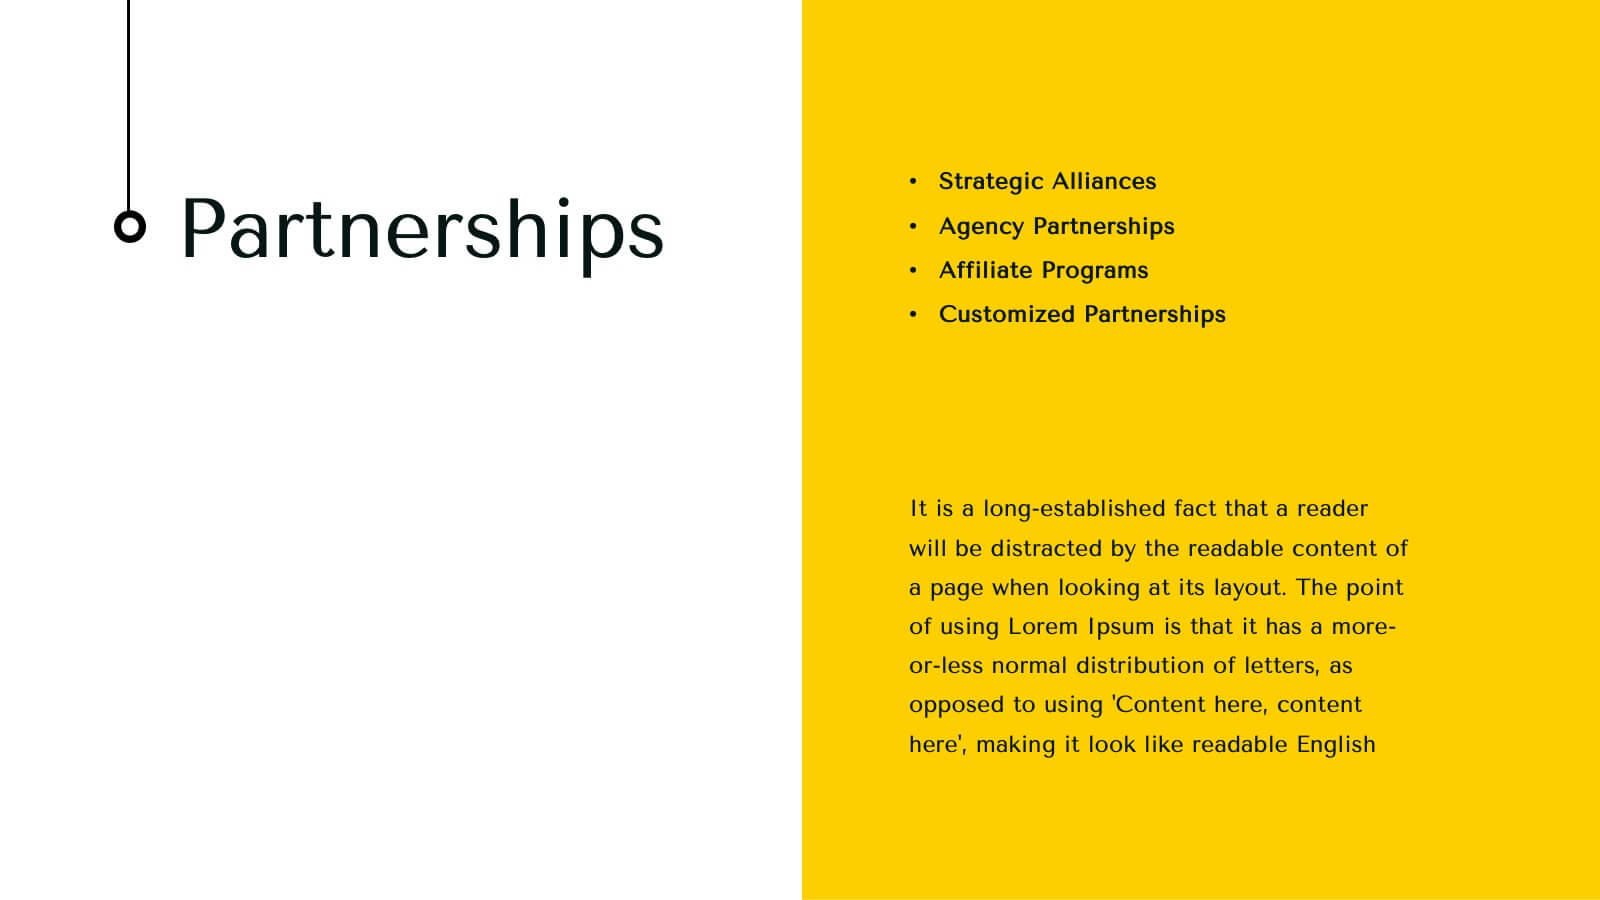
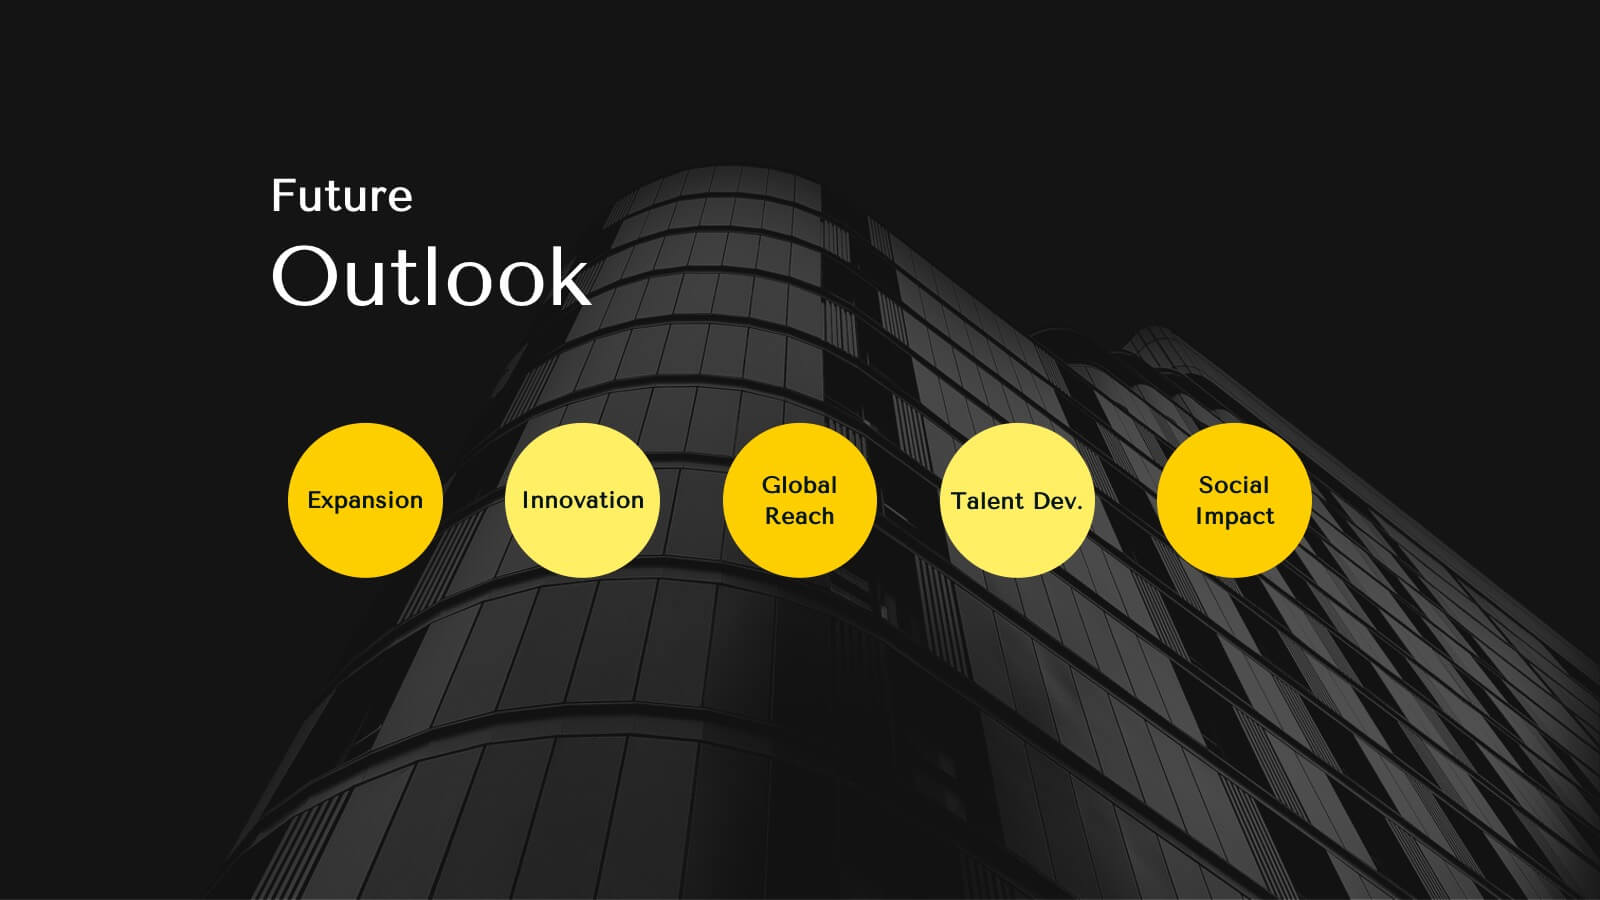
Infinity Agency Portfolio Presentation
Showcase your agency's excellence with this dynamic and modern presentation template. Ideal for presenting market analysis, client success stories, and strategic development plans, it features a bold design with a vibrant yellow and black theme. Highlight your unique approach and creative process to captivate your audience. Compatible with PowerPoint, Keynote, and Google Slides, it's perfect for any platform.


7 diapositivas
Simple Schedule Infographic
Effortlessly structure your time with our simple schedule infographic. Rendered in a clean white canvas, enhanced with dependable blue tones and anchored with timeless black, our template is the epitome of clarity and organization. Equipped with streamlined infographics, universal icons, and adaptable image placeholders, it facilitates easy time management and daily planning. Seamlessly tailored for Powerpoint, Keynote, or Google Slides. A fundamental tool for project managers, event planners, educators, or any professional aiming to efficiently allocate their time. Plan with ease; let every slide bring order to your daily chaos.


5 diapositivas
Cloud Security and Data Storage Presentation
Visually explain your cloud architecture and data protection strategy with this sleek horizontal diagram. Each layered icon represents different aspects of storage, access, and security control—perfect for IT audits, cloud infrastructure briefs, and risk management reports. Fully editable in PowerPoint, Keynote, and Google Slides.


4 diapositivas
Key Performance Indicators Presentation
Hit every target with a bold, visual layout that helps you present performance insights with clarity and impact. This presentation makes it easy to highlight goals, measure progress, and showcase meaningful data in a clean, modern design. Fully editable and compatible with PowerPoint, Keynote, and Google Slides.